ireland and iceland. iceland and ireland: similarities and differences ireland starting points ...
TRANSCRIPT

Ireland and Iceland

Iceland and Ireland: similarities and differences
Ireland Starting points Putting the house in order: the 1980s Impact of “the death of distance” The boom and the bust Euro member
Iceland Basics The boom and bust No euro
Features of the two busts
Outline
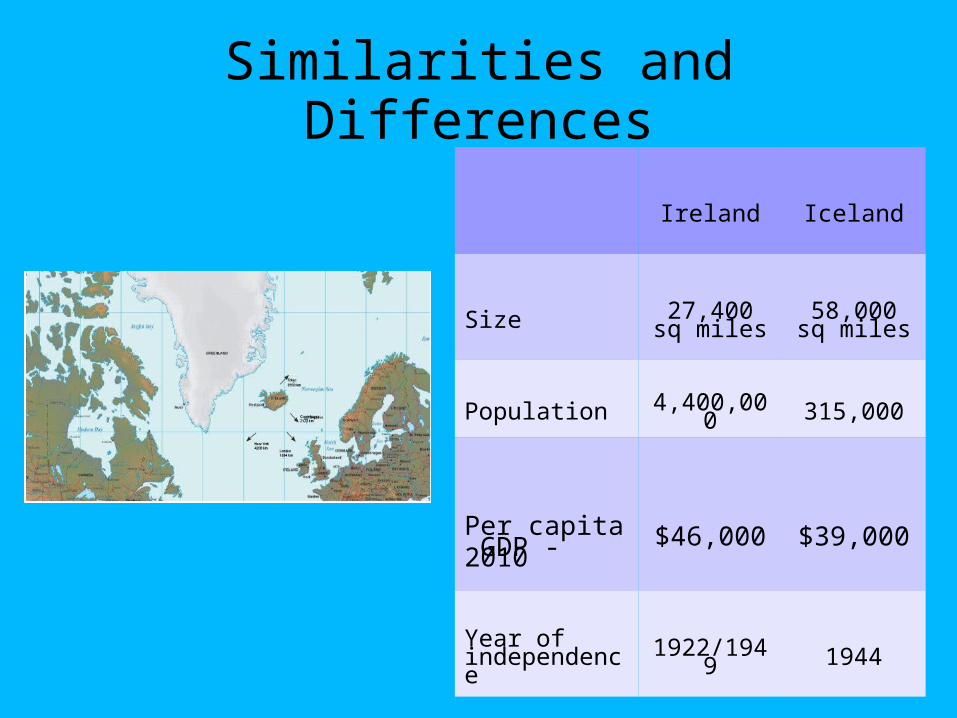
Similarities and Differences
Ireland Iceland
Size 27,400 sq miles
58,000 sq miles
Population 4,400,000 315,000
Per capita GDP - 2010
$46,000 $39,000
Year of independence
1922/1949 1944

Ireland

Ireland History in Brief
1846-50 Irish Famine (pop. peak :8 million) 1919-22 Partial independence for Ireland from
UK; Civil War 1930-1950s Industrial policy of “self sufficiency” Government: mildly “socialist” Favored small farmers and agricultural interests Promoted Irish language

1956
• Government seeks to attract foreign investment in export manufacturing industries: profits will be tax free for 15 years
1964
• Restrictions on foreign ownership of industry abolished
Industrial Development Authority
• Market Ireland to foreign direct investors
• Lobby government on behalf of investors (taxes, education, telecommunication, etc.)
Ireland – History continued

Ireland: Inherited Factors
Population (1985) 3.5 million; very young
Area 27,400 sq miles
Language English; some Irish
Legal system English common law
Government Parliamentary democracy

EARLY INVESTORS IN IRELAND
General Electric (1963) Digital (1971) Wang (1979) Mostek (1979) Apple Westinghouse (Thermo King, etc.)

External Economic/Trade Agreements
Not an original member of European Union Anglo-Irish Free Trade Agreement (1965) Entry into the European Union (1973) Joined Euro in 2002

Impact of 1973 EU Entry
Overall subsidy level roughly equal to Greece and Portugal
Substantial subsidies for Irish farmers Helped finance refocusing of higher
education Expanded Irish export markets, e.g.
beef Made Ireland even more attractive as a
“stepping stone” into Europe for foreign investors

Tax Policy Changes
1978: EU objects to “discriminatory” effect of low taxes just for export manufacturing
Irish solution: reduce corporate tax rate from 15% to 10% for all manufacturing
(Now around 12%)

Key Economic IndicatorsAnnual Averages 1961-1980
1961-1970 1971-1980
Real GDP % 4.2 4.8
Employment Growth 0.0 0.9
Unemployment % 4.8 6.8
Consumer Price Inflation 4.8 13.6
Net Migration -165,000 +96,000

PUTTING THE HOUSE IN ORDER - I
1980: An Bord Telecomm One of the worst European telephone
systems Largest employer in Ireland Both consumer and foreign investor
complaints Independence from Post Office, but still
state enterprise

PUTTING THE HOUSE IN ORDER – II
During 1980s: Major upgrading of technology at time of
fiscal restraint Focus: To become the lowest cost provider
of quality international telecommunications services in Europe

PUTTING THE HOUSE IN ORDER - III
1987: Focus on budget/debt control in Ireland New minority government Controlled deficit, e.g. postponed pay
raises for civil servants Forgiveness to taxpayers if they paid
overdue taxes (58% marginal rate) Agreement with unions on pay increases Then 10% corporate tax rate extended to
international financial services

PUTTING THE HOUSE IN ORDER - IV
Reform of education Reform of higher level education to stress
sciences, engineering Two new universities Technical college system emphasizing
electrical engineering and information technology

IRISH ECONOMIC POLICY, 1987 -
Not ideologically “free market,” e.g. like Margaret Thatcher in England
Very pragmatic Emphasis on agreement with unions:
Modest increases in nominal wage Real wages would not decline Reductions in personal tax rates to help
workers keep pace with inflation

Exchange Rate PolicyBefore and After the Euro
Small country dependency Irish currency historically tied to British pound
sterling Upon entry into EU, Irish “punt” created and
valued within EMS Enthusiastic member of Euro bloc Downside: no independent monetary policy

Key Economic IndicatorsAnnual Averages
1981-1986 1987-1993
Real GDP % 4.1 4.8
Employment Growth -1.3 1.1
Unemployment % 13.8 15.2
Consumer Price Inflation 10.8 2.9
Net Migration -70,000 -94,000

KEY EVENT: “THE DEATH OF DISTANCE” c. 1990
A chance event for Ireland - but “fortune favors the well prepared”
Technology events High capacity, low cost optical fiber High speed routers and switching networks. Internet/worldwide web
Competition among suppliers of international telecommunications services
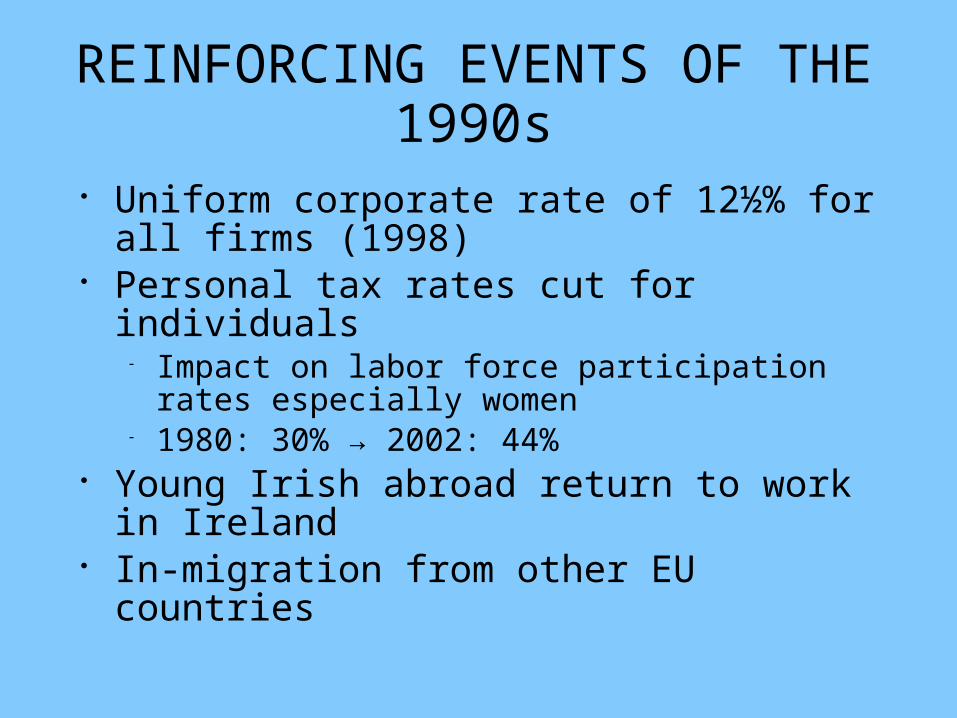
REINFORCING EVENTS OF THE 1990s
Uniform corporate rate of 12½% for all firms (1998)
Personal tax rates cut for individuals Impact on labor force participation rates especially
women 1980: 30% → 2002: 44%
Young Irish abroad return to work in Ireland In-migration from other EU countries

Ireland's BoomAnnual Averages
1994-2000 2005 2006 2007
Real GDP % 9.0 5.5 5.75 6.0
Employment Growth 5.1 4.7 4.5 3.6
Unemployment % 9.5 4.4 4.3 4.5
Consumer Price Inflation 2.5 2.5 3.9 4.9
Net Migration -72,400 55,100 71,800 67,300

Policy Implication of theIrish Boom
Get the fiscal policy fundamentals right Positive attitude towards investment, foreign
and domestic, with special attention to taxes and educational requirements of private sector employers
Create an environment for the rapid deployment of modern telecommunications technology, e.g. encourages investment and entrepreneurship

Policy Implication of theIrish Boom (continued)
Sometimes crises can be helpful (necessary?)
Get the fundamental fiscal policies right Reform/investment for telecommunications
infrastructure critical “Luck” plays a role … . . . but “fortune favors the well-prepared” Booms have a tendency to get out-of-hand

Boom to Bust:The Housing Bubble
1992-2006: Housing stock rises by 150% Demand factors:
Favorable demographics Rising real incomes No property taxes Mortgage interest deductibility Favorable capital gains on housing Low interest rates
Financial institutions aggressive in liberal lending terms (e.g. no money down) – but very little subprime lending

Boom to Bust (continued)
Property-related lending goes from 40% to 60% of banking system credits by 2007
Substantial speculative demand, e.g. “buy-to-let” mortgages were 26% of residential lending
Late 2007: home prices began to weaken October 2008: Lehman Bros. failure seizes up
interbank lending market; Irish banks lose deposits Irish government guarantees all deposits and debts in
Ireland of 6 largest banks

Housing prices soared relative to rents
(Bank of Ireland 2006)

Actual and Predicted Long-run Irish House prices
(Bank of Ireland 2006)

The Bubble Begins to Burst

IRELAND HOUSE PRICE Source: Central Bank of Ireland

Ireland's Housing Crash

Ireland TodayAnnual Averages
2007 2008 2009 2010
Real GDP % 6.0 -3.0 -7.5 -1.0
Employment Growth 3.6 -0.4 -4.6
Unemployment % 4.5 6.2 9.4 13.4
Consumer Price Inflation 4.9 4.1 -1.6 -1.5
Net Migration 67,300

Ireland Real GDP (YOY)

Ireland CPI

Ireland's Currency – the Euro

Ireland's Asset Bubble - Housing Boom to Bust
• Average national house price in Ireland fell 18.5% in 2009 vs a drop of 9.1 % in 2008
• A 48.2% drop since the peak in 3rd Q 2007 to January 2012

Ireland CDS

Source: http://www.spiegel.de/international/europe/0,1518,670294,00.html
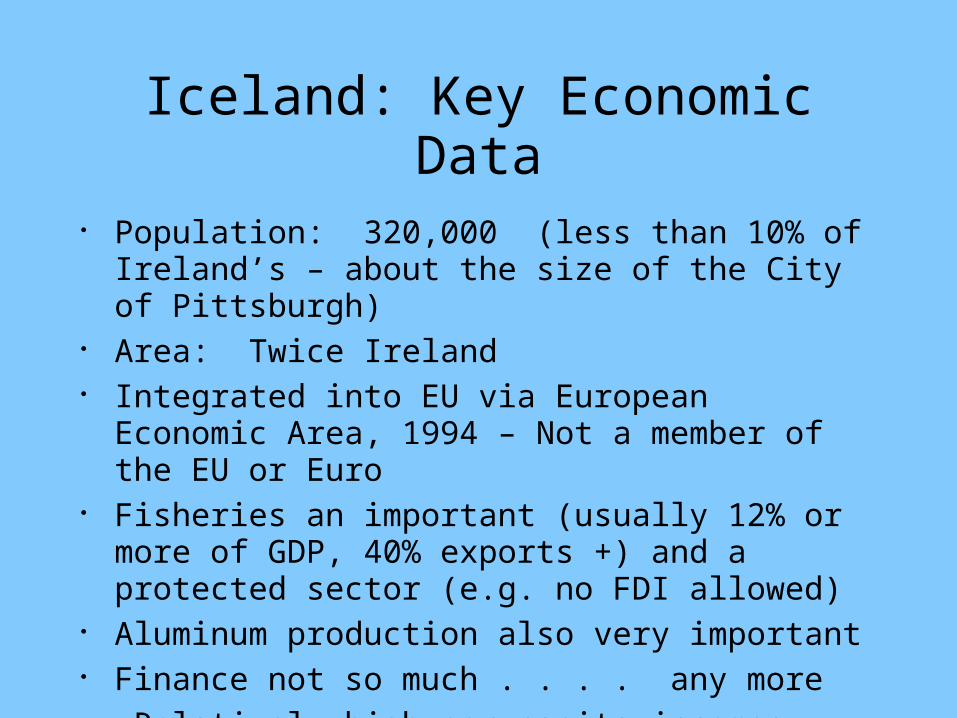
Iceland: Key Economic Data
Population: 320,000 (less than 10% of Ireland’s – about the size of the City of Pittsburgh)
Area: Twice Ireland Integrated into EU via European Economic Area,
1994 – Not a member of the EU or Euro Fisheries an important (usually 12% or more of GDP,
40% exports +) and a protected sector (e.g. no FDI allowed)
Aluminum production also very important Finance not so much . . . . any more Relatively high per capita incomes $40,000 vs
$65,000 at its peak in 2007-08.

Opening up the Economy Joined GATT in 1964 Privatization of key sectors starting in 1980s Trade and financial sectors liberalized in the
1990s Multinational aluminum company investment
in 1990s Krona floated in March 2001 Substantial investment and lending abroad by
Icelandic companies in 2000s

A Formerly “Fishy” Economy.... peaked in 2007

Iceland's Bubble
- 2003-2007: foreign funded boom lifted GDP 25%, strengthened krona
- Beginning in 2004: Rapid expansion of three major banks into overseas markets – borrowed ~$100 billion to buy foreign assets
- Further expansion funded with short-term deposits, e.g. from UK retail branches of Icelandic banks
- Other corporations and individuals became heavy borrowers in foreign currencies (lower interest rates than 16% charged on krona debt)
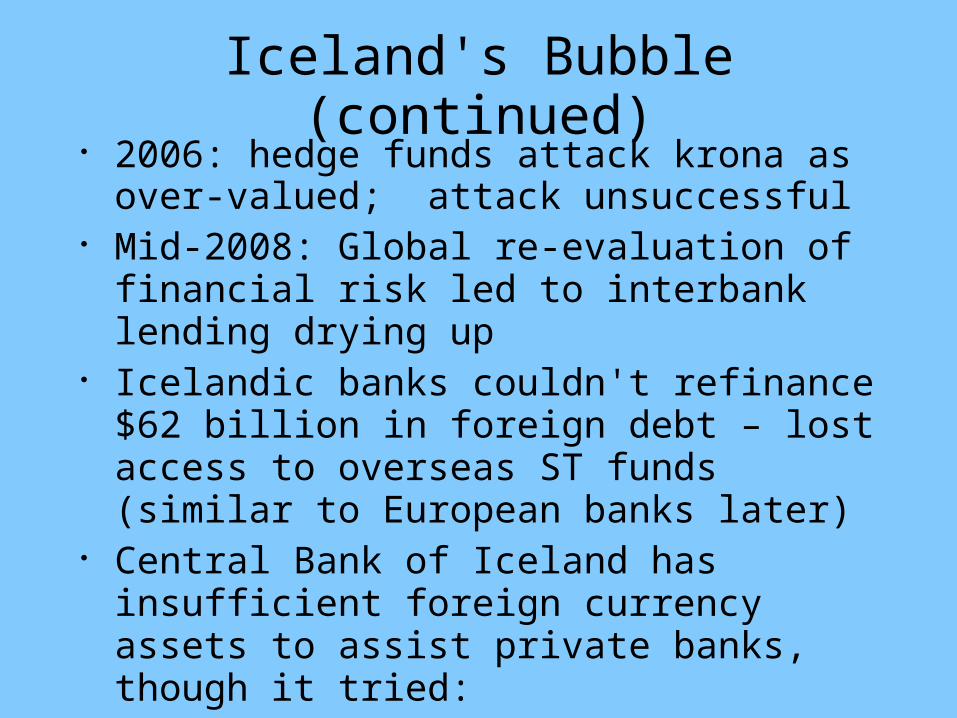
Iceland's Bubble (continued) 2006: hedge funds attack krona as over-
valued; attack unsuccessful Mid-2008: Global re-evaluation of financial
risk led to interbank lending drying up Icelandic banks couldn't refinance $62 billion
in foreign debt – lost access to overseas ST funds (similar to European banks later)
Central Bank of Iceland has insufficient foreign currency assets to assist private banks, though it tried:
One September 28 2008 government injected capital into Glitnir Bank (taking 75% stake)
Run on UK branches of other Icelandic banks

Iceland's Official Foreign Exchange Reserves
(About $7.2 billion)

ICELAND’S BUBBLE - cont.
Krona devalued (60 ISK → 125 ISK – now about 116.8 ISK/USD)
GDP growth 2009: - 6.5%, 2010: ~ -3.5% 2011: 2-3 % 2009 : Arranged a $2.1 billion IMF facility
ICELAND’S BUBBLE - cont
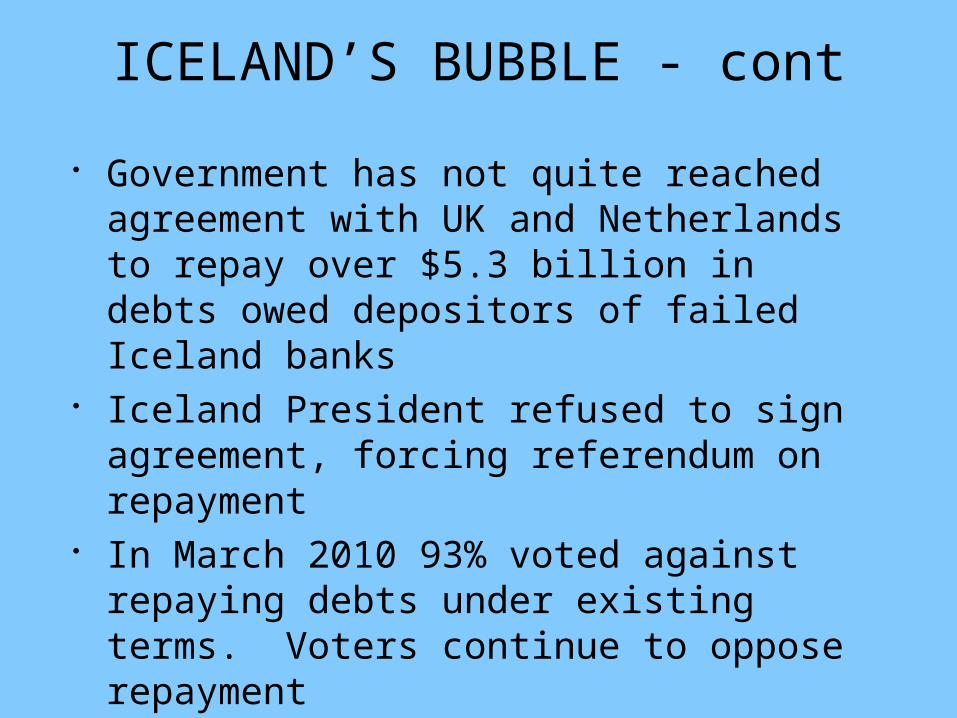
Government has not quite reached agreement with UK and Netherlands to repay over $5.3 billion in debts owed depositors of failed Iceland banks
Iceland President refused to sign agreement, forcing referendum on repayment
In March 2010 93% voted against repaying debts under existing terms. Voters continue to oppose repayment
Meanwhile, Parliament voted to pursue EU membership – no real movement

Iceland (Volatile) Real GDP

Iceland Real GDP Growth Rate

Iceland Krona


IcelandTotal Public Debt (% of GDP)
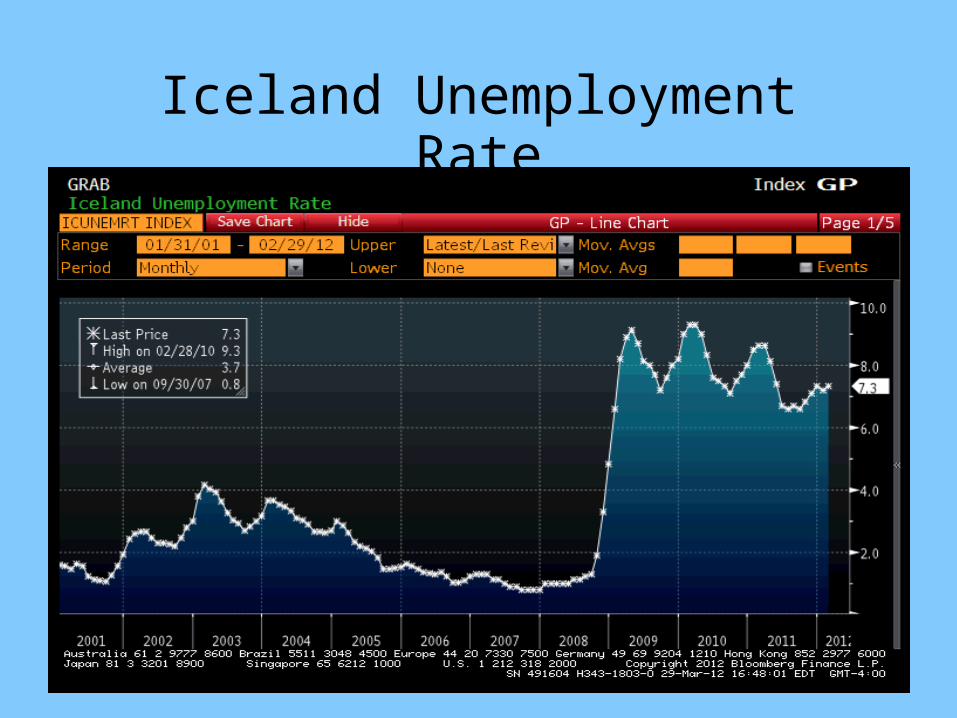
Iceland Unemployment Rate

Iceland CPI

Iceland CDS
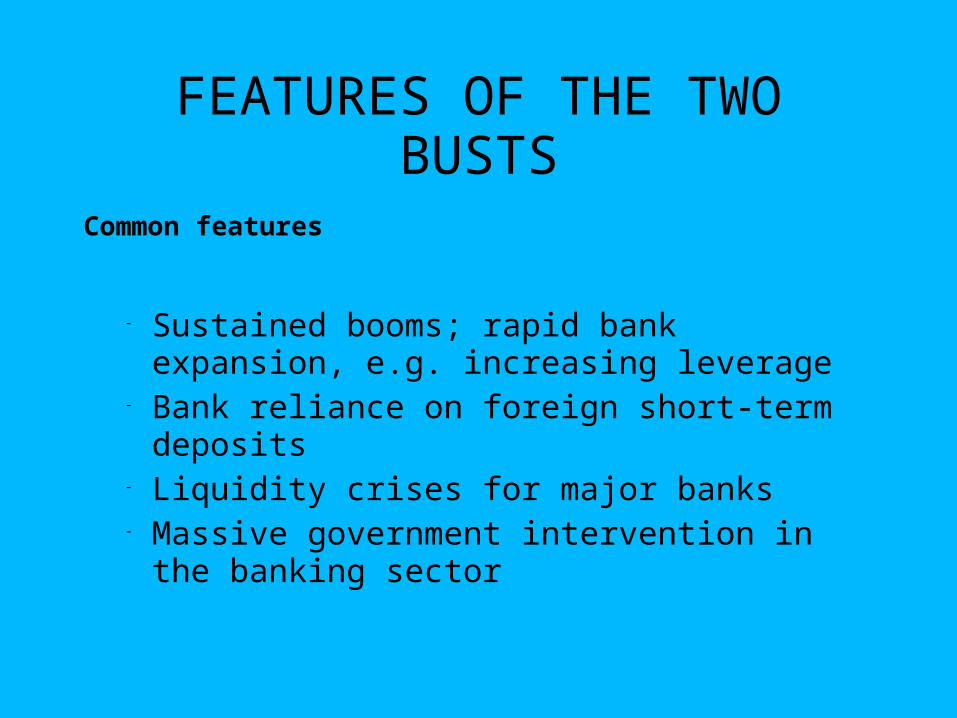
FEATURES OF THE TWO BUSTS
Sustained booms; rapid bank expansion, e.g. increasing leverage
Bank reliance on foreign short-term deposits Liquidity crises for major banks Massive government intervention in the
banking sector
Common features

FEATURES OF THE TWO BUSTS
Irish banks’ over-expansion was in domestic real estate lending
Ireland government took over banks assets and liabilities
Icelandic banks over-expansion mainly in lending overseas, frequently to Icelandic companies
Iceland had major FX crisis (not a Euro member)
Large depositors in Icelandic banks in the UK lost substantial sums; Irish depositors still whole
Distinguishing features
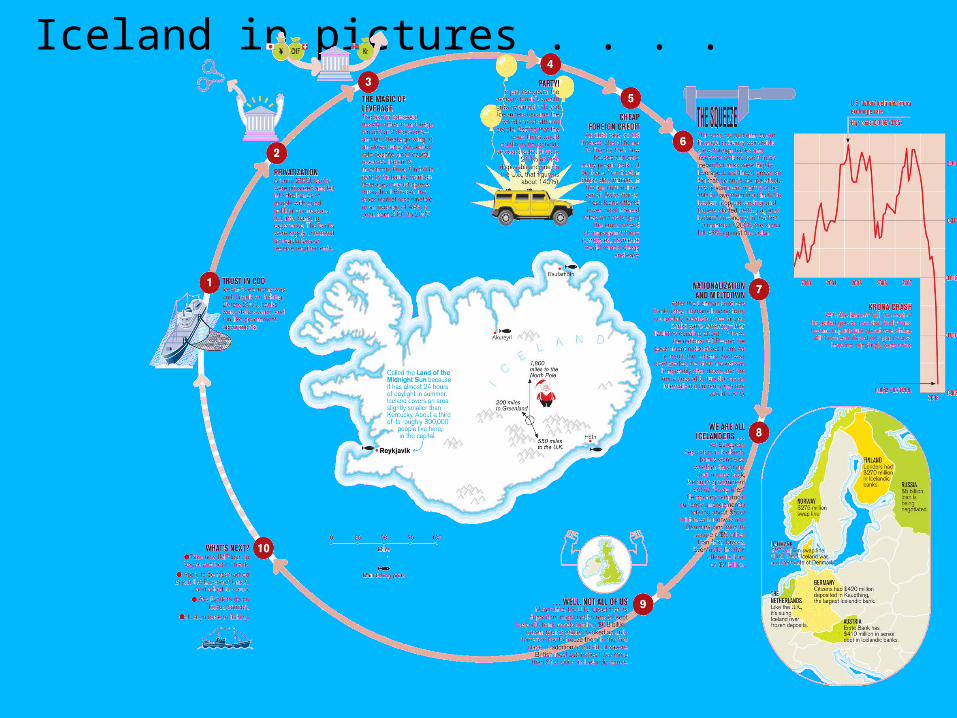
Iceland in pictures . . . .

Why Iceland was Different .... via Bloomberg interview

Zim
bab
we
Jap
an
Sai
nt
Kit
ts a
nd
Nev
is
Gre
ece
Leb
ano
n
Jam
aica
Icel
and
Ital
y
Sin
gap
ore
Bar
bad
os
Bel
giu
m
Irel
and
Po
rtu
gal
Su
dan
Can
ada
Ger
man
y
Fra
nce
Sri
Lan
ka
Hu
ng
ary
Bel
ize
Eg
ypt
Do
min
ica
Nic
arag
ua
Un
ited
Kin
gd
om
Isra
el
Au
stri
a
Mal
ta
Bah
rain
Co
te d
'Ivo
ire
Jord
an
Net
her
lan
ds
Un
ited
Sta
tes
Mo
rocc
o
Cyp
rus
Sp
ain
Alb
ania
Bra
zil
Cro
atia
Bh
uta
n
Mau
riti
us
Vie
tnam
Gu
yan
a
Uru
gu
ay
Ph
ilip
pin
es
Sey
chel
les
Po
lan
d
El S
alva
do
r
Mal
aysi
a
Ind
ia
Un
ited
Ara
b E
mir
ates
0
50
100
150
200
250
Government Debt
(as percent of GDP: 2010)Source: CIA

US Government Budget Deficit as Percent of GDP
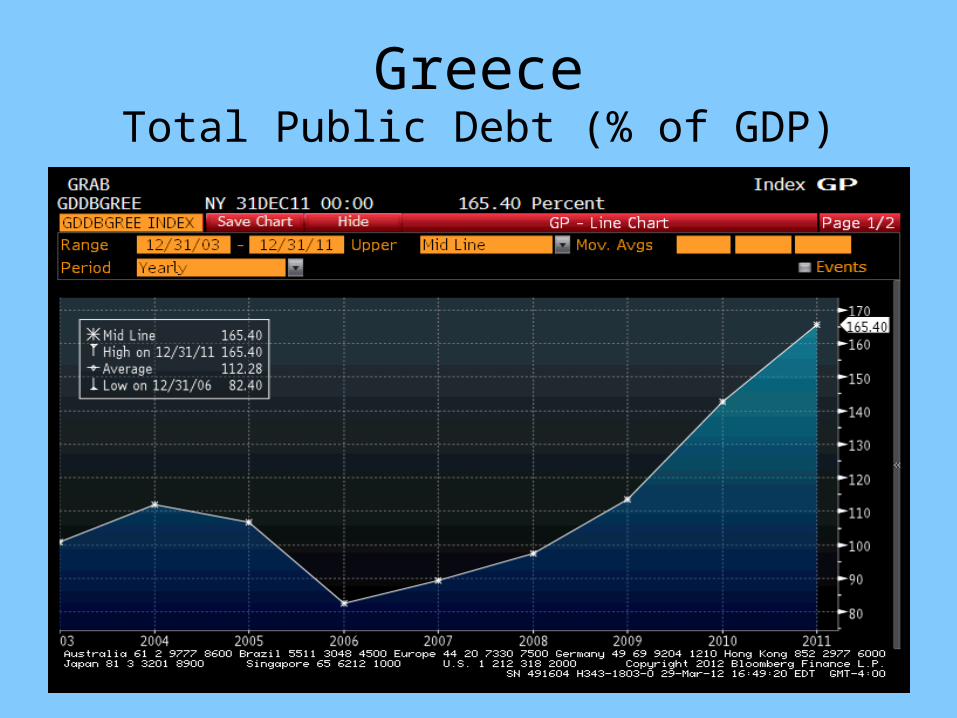
GreeceTotal Public Debt (% of GDP)

IrelandTotal Public Debt (% of GDP)

ItalyTotal Public Debt (% of GDP)

SpainTotal Public Debt (% of GDP)
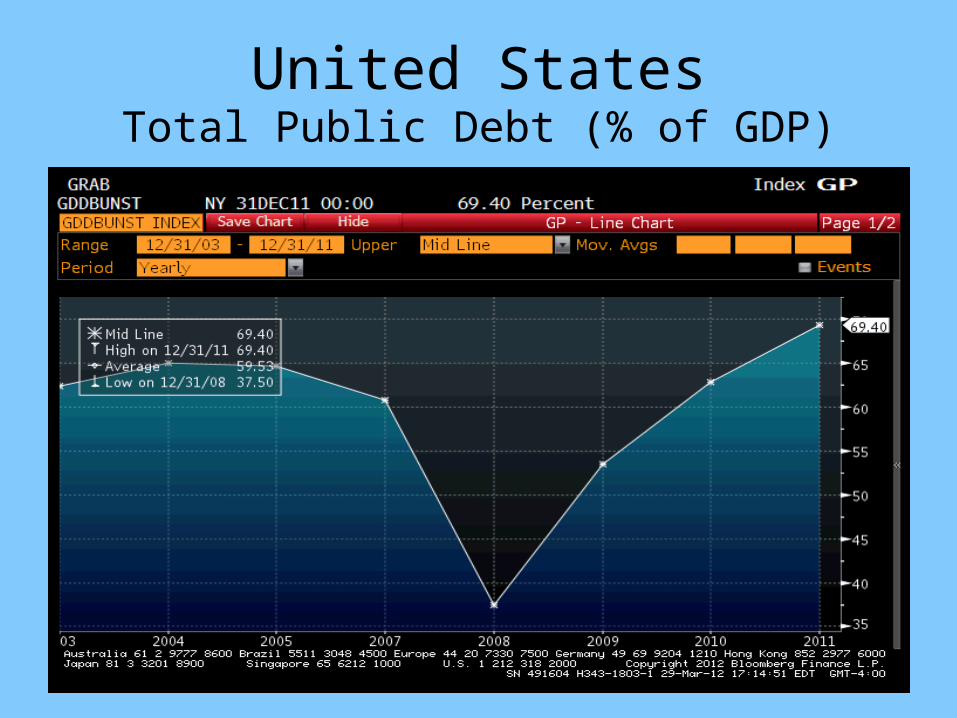
United StatesTotal Public Debt (% of GDP)

United StatesTotal Public Debt (% of GDP)
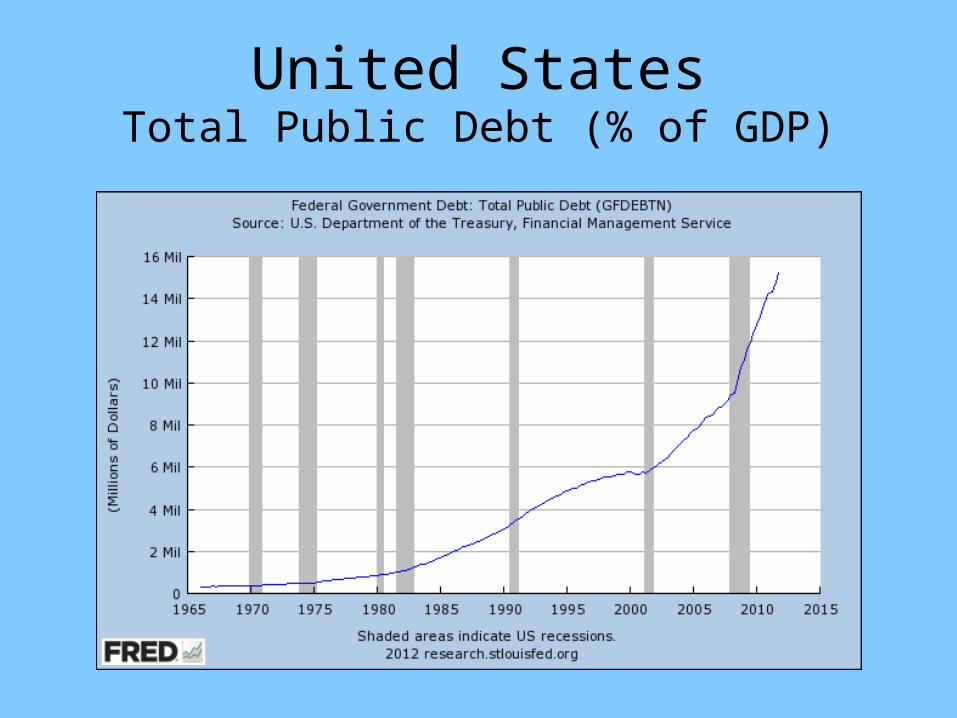
United StatesTotal Public Debt (% of GDP)

United StatesTotal Public Debt (% of GDP)