irish graves of south australia’s mid-north, 1850-1899: … · irish graves of south...
TRANSCRIPT

IRISH GRAVES OF SOUTH AUSTRALIA’S
MID-NORTH, 1850-1899: AN EXAMINATION
OF CULTURAL SIGNIFICANCE
Janine McEgan
B. Arts (Flinders) Grad. Dip. Cultural Heritage Management (Flinders)
A research project submitted as partial requirement for the Master of Cultural Heritage Management, Department of Archaeology, Flinders University, Adelaide, February 2017.

DECLARATION
‘I certify that this research project does not incorporate without acknowledgement
any material previously submitted for a degree or a diploma in any university; and
that to the best of my knowledge and belief it does not contain any material
previously published or written by another person except where due reference is
made in the text.’
Janine McEgan


i
Table of Contents List of Figures ......................................................................................................................... iv
List of Tables ……………………………………………………………………………………………………………………vii
List of Appendices……………………………………………………………………………………………………………..ix
ABSTRACT ............................................................................................................................ 1
ACKNOWLEDGEMENT ..................................................................................................... 3
Chapter 1: INTRODUCTION .............................................................................................. 5
Aim .......................................................................................................................................... 5
Significance ........................................................................................................................... 10
Chapter 2: LITERATURE REVIEW ................................................................................ 11
Identity .................................................................................................................................. 11
Ethnicity ................................................................................................................................ 13
Irish Ethnicity....................................................................................................................... 14
Symbolism and Material Culture ....................................................................................... 16
Religion, religious symbols and cemetery markers ........................................................... 18
Christian Burials in an Australian Context .................................................................... 20
Summary ............................................................................................................................... 22
Chapter 3: IRISH SETTLERS IN SOUTH AUSTRALIA .............................................. 23
The Beginnings of South Australia ..................................................................................... 23
The Irish in South Australia ............................................................................................... 24
The Home Counties of South Australia’s Irish Settlers ................................................. 27
Chain Migration ................................................................................................................... 30
The Irish and their relationship to other groups .............................................................. 31
Chapter 4: METHODS ........................................................................................................ 34
Introduction .......................................................................................................................... 34
Site Plans ............................................................................................................................... 37
Recording Methods .............................................................................................................. 38
Definitions of terms .............................................................................................................. 38
Historical Research .............................................................................................................. 38
Spreadsheets ......................................................................................................................... 39
Statistical Analysis ............................................................................................................... 39
Descriptive (percentage) Analysis ................................................................................. 39
Chi-Square Test of Independence .................................................................................. 40
Limitations ............................................................................................................................ 40

ii
Chapter 5: RESULTS .......................................................................................................... 41
Grave Orientation ................................................................................................................ 41
Counties ................................................................................................................................ 42
Family vs individual burial ................................................................................................. 43
Irish Catholic .................................................................................................................. 44
Irish Protestant ............................................................................................................... 45
Irish - Catholic vs Protestant .......................................................................................... 46
Irish vs Non-Irish ........................................................................................................... 46
Headstone Form ................................................................................................................... 46
Irish Catholic .................................................................................................................. 47
Irish Protestant ............................................................................................................... 48
Irish – Catholic vs Protestant ......................................................................................... 48
Irish vs Non-Irish ........................................................................................................... 49
Headstone Material .............................................................................................................. 52
Motifs .................................................................................................................................... 56
Irish Catholic .................................................................................................................. 57
Irish Protestant ............................................................................................................... 59
Irish – Catholic vs Protestant ......................................................................................... 60
Irish vs non-Irish ............................................................................................................ 60
Fences/borders...................................................................................................................... 61
Irish Catholic .................................................................................................................. 64
Irish Protestant ............................................................................................................... 64
Irish – Catholic vs Protestant ......................................................................................... 65
Irish vs Non-Irish ........................................................................................................... 65
Inscriptions ........................................................................................................................... 65
Introductory inscriptions ................................................................................................ 65
Epitaphs ......................................................................................................................... 66
Irish Catholic .................................................................................................................. 67
Irish Protestant ............................................................................................................... 70
Irish – Catholic vs Protestant ......................................................................................... 72
Irish vs Non-Irish ........................................................................................................... 72
Summary ............................................................................................................................... 75
Chapter 6: DISCUSSION .................................................................................................... 76
Irish Settlement .................................................................................................................... 76
Motifs of affection versus grief ...................................................................................... 78
Religious motifs ............................................................................................................. 80
Irish symbols .................................................................................................................. 83
Irishness in the mid-north ................................................................................................... 93
iii
Chapter 7: Conclusion ......................................................................................................... 95
Future Directions ................................................................................................................. 98
REFERENCES ..................................................................................................................... 99

iv
List of Figures Figure 1.1: Clare Valley region in context of South Australia..................................................6
Figure 1.2: Section of County of Stanley...................................................................................7
Figure 1.3: Sections of the County of Light..............................................................................8
Figure 2.1: Aspects of Identity.................................................................................................12
Figure 3.1: Clare Valley region of South Australia.................................................................27
Figure 3.2: Towns of the Clare Valley……………………………………………………….27
Figure 3.3: Birthplace of the deceased, or nearest relatives, recorded in the study…………28
Figure 4.1: Location of (1) Undalya and (2) Saddleworth cemeteries, in relation to
each town………………………………………………………………………..35
Figure 4.2: Location of Kapunda cemeteries. (1) St John’s, (2) Christchurch Anglican……35
Figure 4.3: Location of Navan Catholic cemetery in relation to the Riverton township…….36
Figure 4.4: Location of Mintaro Catholic Cemetery…………………………………………36
Figure 5.1: Percentage variation of individual and family burials among Irish Catholics…..44
Figure 5.2: Relative frequencies of burial types for Irish Catholics…………………………45
Figure 5.3: Percentage of individual and family burials among Irish Protestants…………….45
Figure 5.4: Frequency of individual vs family burial when comparing Irish to non-Irish
burials…………………………………………………………………………...46
Figure 5.5: Percentage of headstone forms for Irish Catholics………………………………47
Figure 5.6: Percentage of headstone forms for Irish Protestants…………………………….48
Figure 5.7: Percentage comparison of Irish Catholic and Protestant headstone forms………49
Figure 5.8: Percentage distribution of Irish and non-Irish headstone forms…………………50
Figure 5.9: The use of plain crosses as a headstone feature across the span of the study……50
Figure 5.10: The percentage of plain crosses as a headstone form across the time span
of the study…………………………………………………………………….51
Figure 5.11: The use of tablet form as a headstone across the span of the study……………..51
Figure 5.12: Celtic cross forms………………………………………………………………52
Figure 5.13: Slab/tomb grave marker forms…………………………………………………52
Figure 5.14: Fabric of grave markers for all cemeteries over the extent of the study…………53
Figure 5.15: Charles Hoffmann’s cast iron grave marker, 1866, Mintaro cemetery…………55
Figure 5.16: Percentage of motif categories in all cemeteries………………………………..57
Figure 5.17: Percentage of emotive symbols on Irish Catholic headstones………………….57
Figure 5.18: Percentage of Irish Catholic religious motifs…………………………………..58
Figure 5.19: Number of Irish motifs…………………………………………………………59
Figure 5.20: Percentage of Irish Catholic headstones with no motifs……………………….59

v
Figure 5.21: Comparison of the use of emotive motifs on Irish and non-Irish headstones
over time……………………………………………………………………....60
Figure 5.22: Comparison of the use of religious motifs on Irish and non-Irish headstones
over time………………………………………………………………………61
Figure 5.23: Comparison of the use of no motifs on Irish and non-Irish headstones
over time………………………………………………………………………61
Figure 5.24: Fence categories across all cemeteries.................................................................62
Figure 5.25: Fencing manufacturers’ labels………………………………………………….62
Figure 5.26: Clay tile from grave border at Christchurch cemetery………………………….63
Figure 5.27: Percentage of fence forms across all cemeteries……………………………….63
Figure 5.28: All forms of fencing choices on Irish Catholic graves…………………………64
Figure 5.29: Fencing designs of Irish Protestant graves……………………………………...64
Figure 5.30: Use of kerbing around burial plots of Irish and non-Irish………………………65
Figure 5.31: Introductory inscription categories across all cemeteries………………………66
Figure 5.32: Inscription categories of epitaphs for all cemeteries……………………………67
Figure 5.33: Emotive language on Irish Catholic headstones……………………………….68
Figure 5.34: Inclusion of biographical information on Irish Catholic headstones……………68
Figure 5.35: Religious wording on Irish Catholic headstones……………………………….69
Figure 5.36: Emotive inscriptions on Irish Protestant headstones……………………………70
Figure 5.37: Biographical information on Irish Protestant headstones………………………71
Figure 5.38: Death euphemisms on Irish Protestant headstones……………………………..71
Figure 5.39: Religious wording on Irish Protestant headstones……………………………...72
Figure 5.40: Use of emotive words by Irish (combined) and non-Irish groups over time…..73
Figure 5.41: Use of ‘died’ and ‘departed this life’ by Irish and non-Irish groups over time…73
Figure 5.42: Use of words of association to deceased by Irish and non-Irish groups over
Time……………………………………………………………………….......74
Figure 5.43: Use of home reference by Irish and non-Irish groups over time………………74
Figure 6.1: Irish vs non-Irish: Change over time of introductory phrases in inscriptions…..79
Figure 6.2: Engraved stone of the Sacred Heart on Ellen Crowe’s grave, 1895,
Undalya Catholic cemetery……………………………………………………..80
Figure 6.3: Michael Dermody’s Irish Catholic grave 1861………………………………….83
Figure 6.4: John Guiney’s Catholic grave 1883, showing shamrock motifs and adjacent
Celtic cross. Headstone erected by his parents…………………………………..83
Figure 6.5: Chi-rho symbol in Dorsetshire…………………………………………………..85
Figure 6.6: The development of the Celtic cross from ‘chi-rho’ symbol……………………..85
Figure 6.7: Triquetra…………………………………………………………………………85

vi
Figure 6.8: Shamrock………………………………………………………………………..85
Figure 6.9: Newgrange, Co. Meath showing triskele designs on entrance stone…………….86
Figure 6.10: Fahey headstone 1858, Navan Catholic cemetery……………………………...88
Figure 6.11: O’Brien headstone 1860s, Navan Catholic cemetery…………………………..89
Figure 6.12: O’Sullivan headstone 1863, Navan Catholic cemetery………………………..90
Figure 6.13: Motifs on the top section of the O’Sullivan headstone 1863,
Navan Catholic Cemetery……………………………………………………...91
Figure 6.14: Sketch of the O’Brien headstone, 1860s, Navan Catholic cemetery,
showing geometric design at base.……………………………………………..92
Figure 9.1: Key headstone shapes………………………………………………………….117
Figure 9.2: Elements of cast iron fencing …………………………………………………119
Figure 9.3: Examples of spear design fencing styles………………………………………121
Figure 9.4: Miscellaneous fence styles…………………………………………………….122

vii
List of Tables
Table 3.1: Birthplace of County Stanley and Light Residents……………………………….28
Table 3.2: Irish deaths recorded in study in County Stanley and Light, for each decade……29
Table 3.3: Religion by county 1861 and 1871……………………………………………….30
Table 4.1: Number of grave markers compared to numbers of burial plots…………………34
Table 4.2: Distribution of religion and nationality of recorded headstones…………………37
Table 4.3: Numbers of recorded interments with confirmed/unconfirmed nationality………39
Table 5.1: Counties represented in graves recorded for each decade………………………..43
Table 5.2: Distribution of family vs individual burials (number)……………………………43
Table 5.3: Percentage of burial type for Irish and non-Irish burials………………………….44
Table 5.4: Numbers of headstone forms for Irish Catholic burials………………………….47
Table 5.5: Numbers of headstone forms for Irish Protestant burials…………………………48
Table 5.6: Variation of headstone styles: Irish and non-Irish………………………………..49
Table 5.7: Overall percentage of each motif category across all burials…………………….56
Table 5.8: Numbers of motifs in all cemeteries………………………………………………56
Table 5.9: Non-specific headstone motifs…………………………………………………...58
Table 5.10: Numbers of motifs for all categories on Irish Protestant graves…………………59
Table 5.11: Number of non-Irish deaths recorded in study………………………………….60
Table 5.12: Euphemisms for death on Irish Catholic headstones……………………………69
Table 9.1: Emotive symbols and meanings………………………………….…………..…118
Table 9.2: Religious motifs and meanings………………………………………………….119
Table 9.3: Emotive wording and meanings…………………………………………………123
Table 9.4: Religious wording and meanings………………………………………………..123
Table 9.5: Biographical wording used………………………………………………….......123
Table 10.1: Chi square test, Family vs individual of Irish Catholic vs Protestant…………126
Table 10.2: Chi square test, Irish vs non-Irish types of interment…………………………126
Table 10.3: Chi-square test, Irish Catholic vs Protestant: two most prevalent
headstone forms………………………………………………………….........126
Table 10.4: Chi-square test, Irish Catholic vs Protestant:
Celtic cross and other cross forms…………………………………………….127
Table 10.5: Chi-square test, Irish vs non-Irish headstone forms: tablet and slab/tomb……127
Table 10.6: Chi-square tests, Irish vs non-Irish headstone forms: tablet and cross………..127
Table 10.7: Chi square test, Irish Catholic vs Protestant: affection and grief………………127

viii
Table 10.8: Chi square test, Irish Catholic vs Protestant: religious motifs and no motifs…128
Table 10.9: Chi square tests, Irish vs non-Irish: affection and grief……………………….128
Table 10.10: Chi square tests, Irish vs non-Irish: religious motifs and no motifs………….128
Table 10.11: Chi square test, Irish Catholic vs Protestant: cast iron picket and railing…….128
Table 10.12: Chi square test, Irish Catholic vs Protestant: Celtic cross and shamrock as
fencing spearheads…………………………………………………………...129
Table 10.13: Chi square test, Irish Catholic vs Protestant: cast iron picket border
and no border…………………………………………………………………129
Table 10.14: Chi square test, Irish Catholic vs Protestant: kerb border and no border…….129
Table 10.15: Chi square test, Irish vs non-Irish: kerb border and no border……………….129
Table 10.16: Chi square test, Irish vs non-Irish: Celtic cross and shamrocks
as fencing spearheads………………………………………………………...129
Table 10.17: Chi-square test, Irish Catholic vs Protestant: emotive words in inscription
introductions and epitaphs……………………………………………………130
Table 10.18: Chi-square test, Irish Catholic vs Protestant: birth place and residence
in inscription………………………………………………………………....130
Table 10.19: Chi-square test, Irish Catholic vs Protestant: birth place and time in
Australia in inscription……………………………………………………….130
Table 10.20: Chi-square test, Irish Catholic vs Protestant: ‘died’ and ‘departed this life’...130
Table 10.21: Chi-square test, Irish Catholic vs Protestant: death euphemisms
– ‘sleep’ and ‘passed’………………………………………………………..130
Table 10.22: Chi-square test, Irish Catholic vs Protestant: biblical verses and phrases……130
Table 10.23: Chi-square test, Irish Catholic vs Protestant: biblical words and quotes…….131
Table 10.24: Chi-square test, Irish vs non-Irish: emotive words in introductions
and epitaphs…………………………………………………………………..131
Table 10.25: Chi-square test, Irish vs non-Irish: ‘died’ and ‘departed this life…………….131
Table 10.26: Chi-square test, Irish vs non-Irish: words of association
with deceased in introductions and epitaphs…………………………………132
Table 10.27: Chi-square test, Irish vs non-Irish: relationship with the
deceased and who erected the headstone…………………………………….132
Table 10.28: Chi-square test, Irish vs non-Irish: mention of birth place and residence
at death……………………………………………………………………….132

ix
List of Appendices Appendix 1: Grave recording form…………………………………………………………108
Appendix 2: Photograph recording form…………………………………………………...109
Appendix 3: Mintaro Catholic Cemetery site plan………………………………………….110
Appendix 4: Navan Catholic Cemetery site plan…………………………………………..111
Appendix 5: St John’s Catholic Cemetery, Kapunda, site plan…………………………….112
Appendix 6: St Patrick’s Catholic Cemetery, Undalya, site plan…………………………..113
Appendix 7: Christchurch Anglican Cemetery, Kapunda, site plan………………………..114
Appendix 8: Whip Street Anglican Cemetery, Saddleworth, site plan…………………….115
Appendix 9: Definition of terms……………………………………………………………116
Appendix 10: Chi-square test results……………………………………………………….126
Appendix 11: Grave data and Historical Research data ……………………………………133

0

1
ABSTRACT
The Irish in colonial South Australia were poor, famine-affected and 90% Catholic,
with many arriving on assisted passage to be labourers and domestic servants to the
colony’s land owners. Historical studies suggest that they readily assimilated to their
new environment and willingly settled among peoples other than native Irish, thus
diffusing their cultural background. Archaeological studies, however, suggest that
high degrees of autonomy and difference were maintained in at least some aspects of
some Irish communities. The extent to which expressions of ‘Irishness’ were
materialised in the new colony through tangible material culture therefore provides
an avenue for archaeology to explore.
Given the highly symbolic and communicative functions of cemetery material
culture, one avenue in which it might be expected to find expressions of ‘Irishness’
is the memorialisation of death and remembrance. This project explores the degree to
which cultural traditions were incorporated in the material culture of Irish graves and
gravestones, and what this implies for expressions of Irishness in South Australia.
The study area is the Clare Valley in the mid-north of South Australia which had
considerable Irish settlement in the nineteenth century. Irish Catholic data was
compared to both non-Irish Catholic and Protestant Irish gravestone data in order to
isolate religious and cultural aspects of memorialisation.
Analysis of 200 headstones from graves erected between 1850 and 1899 shows that
the use of overt symbols associated with Irish origins was not common. Use of Celtic
crosses and shamrocks proved to be statistically significant for the Catholic Irish, but
only as motifs on grave surrounds, indicating the use of shamrocks and Celtic
crosses, however, shows a distinct religious leaning with the Catholic preference to
these symbols.
The inclusion of place of residence of the deceased, a practice still used in Ireland,
was used by both Catholic and Protestant Irish groups, indicating a cultural selection
rather than any religious distinction.
The Irish of South Australia’s mid-north maintained some expression of their Irish
culture in their graves, though with subtle rather than overt symbolism and text. The
expression of Irishness was maintained throughout the nineteenth century, with little

2
decline over the time period of the study thus ratifying past archaeological studies
rather than the suggestions of historical investigation that the Irish merely blended
into society leaving little trace of their origins.

3
ACKNOWLEDGEMENT
This project proved to be a long, ongoing saga, started by an interest in the lives of
people who, like my own predecessors, had travelled in times of hardship in the
nineteenth century from Ireland, a land far removed from the colony of South
Australia. The realisation of my goal could not have been accomplished without the
assistance of many people in many ways.
Firstly, my supervisor, Dr Heather Burke, warrants thanks for her patience in
assisting me to reach the end. I am certain she did not realise the time it would take
when suggesting the investigation of graves would be a way to investigate Irish
emigrants. Steering me to the mid north with an interest in an unusual motif she had
seen at Navan cemetery was the beginning of my journey.
People who assisted in the physical recording of the 201 graves enabled me to gather
data much more readily than if I had been in the field alone. It also made the task
much more enjoyable by sharing an interest with enthusiastic helpers. These people
were:
Dr Robert Stone
Maryam Kamleh
Jessica Lumb
Melissa McEgan
Assistance was also afforded me in the area of statistical analysis by David Green
and Matt van Leeuwen, and formatting advice from Fiona Rixon. Such tasks I could
never have managed without your expertise.
The enthusiasm and willingness of the following mid-north residents and
associations to assist me in research was invaluable.
Christchurch Anglican Parish
Clare Historical Society
Fr Mark Sexton, Northern Light Catholic Parish
Irish group at SA Genealogical and Historical Society
Martin Smith, Mintaro Historical Society
Pat and Mary Connell, Navan Catholic Cemetery caretakers
Peter Swann, St John’s Cemetery caretaker
Riverton Historical Society

4
Two fellow students whose assistance went above and beyond were great support.
Susan Arthure, a fellow researcher of the Irish, regularly emailed websites, readings,
photos –anything she thought may help me and at a time when she was also
engrossed in her own thesis; and Lynda Bignell who was always willing to be part of
a day trip to a cemetery or two assisted with measuring, photography or whatever
assistance I needed – even extending to scaring off snakes! I thank the two of them
very much.
Finally, to my three children, Melissa, Matt and Brendan, who have supported me
over the years of my studies, culminating in this project. Thank you for your interest,
enthusiasm and encouragement. You have been invaluable to me and without you, I
am certain I would not have achieved all that I have.
Thank you to everyone who has given of their time and support to assist me on this
very worthwhile and enjoyable journey.

5
Chapter 1: INTRODUCTION
The Irish have left an indelible legacy on Australia’s development, constituting about
25% of the nineteenth century immigrant population (Richards 1991b:2). Less than
half of them arrived via assisted passages, with the majority being self-funded
(Richards 1991b:3), and a significant number arriving as convicts. Two methods of
emigration particularly relevant to South Australia was a system of wealthy
landowners bringing tenants to live and work on private properties and, in the later
part of the century, a scheme known as ‘kinship assistance’, where Irish who were
already settled and financially secure in the colony sponsored other family members
or those from their home county to emigrate (Richards 1991b:17). The mid-north of
South Australia became home to a large number of these new arrivals, who had
connections to numerous Irish counties (Richards 1991c: 222).
Irish migrants in South Australia have shown to adjust to their new surroundings
among migrants from other nations was easily achieved, resulting in a diffusion of
their culture, according to historical research. Nonetheless, archaeological
investigations allude to autonomy and difference being preserved in certain facets of
some Irish settlements. The degree of ‘Irishness’ being communicated via tangible
material culture in the new colony enables a means for further archaeological
exploration.
Aim
The aim of this study was to investigate the manner in which nineteenth-century
Irish settlers memorialised their dead. To achieve this, the following research
question was devised:
How are the Irish people memorialised in graves in South Australia’s mid-
north in the nineteenth century, 1850-1899?
The Clare Valley region in South Australia's mid-north encompasses this project’s
study area, and extends from south of Kapunda to Peterborough in the north,
covering a distance of some 150 kilometres (Figure 1.1).

6
Figure 1.1: Clare Valley region in context of South Australia. (Maps from http://library.unimelb.edu.au 2001; www.map.net.au; Google maps 2017)
The cemeteries in which graves were recorded are situated within the counties of
Stanley and Light, and particularly in or near the mid-north towns of Mintaro,
South
Australia
Mintaro
Undalya Saddleworth
Riverton
Kapunda
Clare Valley
Adelaide

7
Navan, Kapunda, Undalya and Saddleworth as they existed in the nineteenth century
(Figures 1.2 & 1.3).
Figure 1.2: Section of County of Stanley.
(From Carroll: South Australian Counties Atlas 1876)

8
Figure 1.3: Sections of the County of Light. Note: Undalya lies on the border of the
two counties. (From Carroll: South Australian Counties Atlas 1876)
As gravestones are a physical means of observing changes over time, examining the
graves over a fifty year time frame enabled such changes to be ascertained.
Memorialisation includes the iconography of the grave as represented in motifs and

9
inscriptions, as well as the placement, form, height, style and colour of the grave
marker itself. The Irish are predominantly of the Catholic faith, with only
approximately 10% being Protestant (Phillips 2012:1). To determine what aspects of
the data might indicate ‘Irishness’ as opposed to ‘Catholicness’, a sub-sample of
Irish Protestant graves and non-Irish Catholic graves were also recorded. This
allowed identifiers of religious memorialisation to be separated from other cultural
traits. In order to compare change across time, memorialisation practices of first
generation immigrants and two generations of their descendants were compared.
While gender is an intrinsic part of identity, it was not the focus of this study and is,
therefore, not considered in the analysis of the data. Instead my analysis takes a
Marxist perspective, though other methods of interpretation could be considered.
The variables recorded and analysed included:
The primary burial, being the first-named person on the gravestone.
Understanding which interment was the primary burial was imperative to
understanding the order of burial within a grave, and the relationship of
stylistic choices on grave markers to other factors, such as gender, familial
structure or decade.
Motifs: symbols displayed on the grave markers
Inscriptions: the wording used on the marker
Form: shape of the headstone
Material: used to form the headstone
Size: the height, width and thickness of headstones
Fences/surrounds: the form and material of any grave edging
Family relationships: the number of names on a headstone or the number of
markers in a plot and the relationship between the people buried
Spatial distribution of family graves
Orientation and size of plots
Genealogical data was gathered to determine family relationships as well as the
counties in which people were born.

10
Significance
While there have been several historical studies of Irish cultural migration to South
Australia, (Arthure 2014, James 2009, Richards 1998, 1991a, 1991b, 1986, Moore
1991, Greet 1987, Nance 1978), none have attempted to assess Irish memorialisation
practices in this context. The proportion of Irish in South Australia was the lowest of
all Australian colonies, constituting no more than 10% of nineteenth century
immigrants (Richards 1991a:62). This relatively small population resulted in the
Irish being invisible in a number of ways: their narratives are not the dominant
narratives in the foundation of the state. Their Catholicism was unpopular in the
dissident context of the colony’s attitudes to religion, which were predominantly
Anglo-Scottish Protestant, resulting in a lack of representation in historical records.
Thus, this underrepresentation affords an opportunity to explore them through
material evidence.
With the Irish arrivals being an important, though inconspicuous facet in South
Australia’s growth from fledgling colony to a self-sustaining entity, this study
provides the opportunity to examine the enduring characteristics of their behaviour.
Anglo-Irish settlers, such as Captain Charles Bagot and Edmund Gleeson, were
influential and affluent Protestant Irishmen, who attained high government positions,
while the majority of Irish emigrants were Catholic and provided much of the labour
force needed to establish the colony. They were generally industrious and law-
abiding, eking out a living and attempting to adapt to the society in which they lived
(Greet 1987:77). The lack of historical narrative associated with the labouring Irish
in South Australia warrants a study into their lives. As stated by Tarlow (1999),
gravestones are a manner in which beliefs can be expressed allowing traditions to be
demonstrated rather than assumed.
This study therefore provides an insight into cultural dynamics and relationships
between groups, particularly in the contexts of a region’s early settlement, while also
contributing to archaeological knowledge of the presence of a particular group, who,
though low in number, left an indelible imprint on the landscape of the colony. In
particular, this study enables the evaluation of the connection between identity and
memorialisation, and evaluates its strength within a particular set of Irish
communities. Furthermore, it explores whether these migrants changed
memorialisation practices in response to interaction with other cultural groups.

11
Chapter 2: LITERATURE REVIEW
Identity
According to Erikson, 'identity ... connotes both a persistent sameness within
oneself... and a persistent sharing of some kind of essential characteristics with
others' (Erikson 1980:109, cited in Sökefeld 2001:531), while identity is considered
by Goffmann (1963) to be a 'collection of characteristics', be they inherent or
attributed, that are used to classify people (Goffmann 1963, cited in Sökefeld
2001:532). Goffman’s is a combination of emic and etic views of identity - the
mechanisms used to classify people by others, as well as the means used to
understand the self. Erikson also studied identity from both perspectives.
Thus, identity presents in two ways – as one's self-perception that may or may not
change over time, and as a social grouping via the perception of self and others,
although it is still related to relative position within larger, socially-constructed and
intersecting systems, such as age, gender, race or capitalism. For example, religion
(Smedley 1998:693) and occupation place people in a particular social stratum
(Smedley 1998:691), while ethnicity and gender can further entrench domination
(Burke 1999:7). However, differences in characteristics such as religion and
occupation can also be the cause of domination. Irish Catholics, for example, have
long been derided and treated as inferior, firstly by the English when Ireland was
claimed in the seventeenth century, and later as migrants to British colonies.
Furthermore, the Irish rural lifestyle was demeaned by British laws with people
forced into tenancy from the seventeenth century onwards (Handlin 1959:38).
Sökefeld (2001) argues that ethnicity and gender have emic dimensions as local
concepts 'within a culture' (i.e. as self-identity), but also etic dimensions as 'cross-
cultural perspectives' determined by outside opinions, and can thus also be
applicable to the ascription of a group identity (Sökefeld 2001:529). While many
facets of identity are ascribed by others, meaning is created throughout the everyday
lives of people (McGuire and Wurst 2002:89). Bourdieu (1977: cited in Clark
2005:449) argues that people have a subconsciously-generated bias toward particular
ideas and customs, such as a gendered division of labour. This, however, may
develop into a conscious approach if it becomes entrenched as the accepted
procedure. Hence, part of one's self-identity is 'shaped by social practices' from a
very young age (Jones 1999:225-226).

12
Self-identity is ever present, but is unlikely to be consciously considered until
confronted by another's perceptions (Field 1994:434). Smedley suggests that
personal identity relates to one's place of birth, matriarchal or patriarchal lineal
descent or social position (Smedley 1998:692), akin to Bourdieu’s argument of
subconscious bias, and that social position can acquire attributes based on education,
marriage or a further development of self-identity (See Figure 2.1). Self-identity is
related, in part, to wider 'economic and power interests' (as suggested by Smedley
[1998:692]), such that identity can shift dependent on the situation in which one
exists (Jones 1999:224), though it is unlikely a major transformation would occur.
While the word identity is derived from the Latin idem, meaning 'same', group or
social identity is unlikely to be homogeneous, as common traits can be shared by
different groups (Jones 1999:225), and, within a group, differences exist between
individuals: in other words, groups will have 'internal diversity' (Bottero and Irwin
2003:465). Individual and group identity are both expressed in various ways:
through intangible actions and activities, such as spoken language, religious
practices, food or music, and through the tangible material culture that derives from
these. Archaeologists, in turn, and as the ultimate outside observers, use material
remains of such social practices to interpret the classification of social identity.
Social identity is continually evolving (Brighton 2004:157), varying in different
contexts and resulting in identity being a dynamic entity that is hard to determine.
Identity
Conscious / Subconscious
Self / Individual Social / Group
Ascribed Acquired
Age Family Gender Ethnicity Education Occupation
Language Religion Marriage Politics
Figure 2.1: Aspects of Identity.
Capitalism, having dominated the western world since the sixteenth century, has had
a significant impact on the structures of modern society. It is based on a system of

13
production in which one group has dominance and control, while another works to
create profit for the former (Leone 1999:13, cited in Croucher and Weiss 2011:8).
Burke considers capitalism to be a social process in which the dominant have
'control over things... control over labour... and control over production' (Burke
1999:6). Such influence results in an imbalance of wealth and work distribution.
The basic principles which structure capitalism stratify society into classes, with the
need for subordinates to undertake the work to produce goods, and thus profits, for
the dominant (Leone 1999). By definition, class is a group of people with the same
economic, political or cultural positions, whereas status is acquired on the basis of
marriage, appearance, sex, age, family relations and birth; so, while people may
begin life within one social group, abilities and accomplishments can allow
movement between these groups.
Ethnicity
An important aspect of ascribed identity is ethnicity. An ethnic group has common
traits, such as language and cultural values (Sökefeld 2001:532). As defined by Barth
(1969:13, cited in Sökefeld 2001:532), 'ethnic ascription...classifies a person in terms
of his basic, most general identity, presumptively determined by his origins or
background'. However, ethnicity is not merely cultural; it is also the manner by
which social and cultural processes are integrated to make a group identifiable (Jones
1997:xiii), but is often perceived on the basis of limited traits by outside observers
(Jones 1997:62), including archaeologists.
Upton construes ethnicity as a range of values and practices within a group that
distinguish them from other groups (Upton 1996:1), where the identity of a culture
lies 'in those values and practices from the homeland’ (Upton 1996:3): For example,
the 'Irishness' of emigrants as defined by the practices and values they shared, versus
‘Irishness’ as perceived by those of other lands, often with negative connotations,
with religious differences being a major factor in these perceptions. Smedley
augments this with the theory that ethnicity burdens identity with elements, such as
difference from others and hostility (Smedley 1998:690), by suggesting that people
of different ethnic groups compete with each other and that struggle and animosity
result (Smedley 1998:691). As the English encountered various peoples in their
exploration of the world, for example, an interpretation of human differences arose
both within the British Isles (that is, between the British and the Irish) and between

14
the English and the inhabitants of the New World (Smedley 1998:694). The
awareness of having different beliefs or practices becomes apparent when contact
with other cultural groups occurs, particularly when this contact becomes the
mechanism by which one group can be exploited by another. In her study of Kalahari
San points, Wiessner (1983) found distinct differences in style between language
groups, revealing the subconscious barriers that had developed between these
peoples (Wiessner 1983:269), although the San people also endeavoured to
characterise their craft with personal forms of decoration (Wiessner 1983:271), thus
individualising the points within the group. Furthermore, Wiessner (1983:257)
proposed that identity, both personal and social, is affected by ‘social comparison’,
thus revealing similarity or difference in the resultant artefact.
Irish Ethnicity
Identity is intrinsic with class position in Ireland, along with occupation and name
(Field 1994:434). Until the mid-nineteenth century, the Irish countryside was
primarily populated by 'rural poor' although numerous other social levels also
existed, ranging from large landholders to itinerant workers, and included families
who owned land and those who did not. After 1860, the rural class structure
underwent major changes, with an increase in the number of small farmers, along
with a decrease in population following the Famine (Hirsch 1991:1117). Thus, an
individual’s place in society was well-defined in Ireland, but until a person migrates
to another country, or, indeed, if one’s country is invaded, then 'self-definition' is
challenged (Field 1994:434). A distinct Irish identity had developed over the
country's long history, but after England's invasion in 1649, the people were
considered in terms of their differences to the English, particularly in terms of their
religion, monetary wealth and education. When capitalism came to the fore, from the
sixteenth century onwards, Irish position, and consequently identity, was altered by
the development of a hierarchical structure in which power and dominance of one
group over another escalated.
Emigration has been a significant contributor to the development of ethnic
recognition. With the demand for 'immigrant labour and the lack of employment
opportunities at home' (Fitzpatrick 1985:1), the English became the first to instigate
Irish emigration, particularly from the 1820s (Lawes 2013). Busteed and Hodgson
used Manchester as a case study for understanding the Irish adjustment to urban life

15
in a new country in the nineteenth century (Busteed and Hodgson 1996:139), finding
that English animosity had particular anti-Irish sentiment, being more than Catholic
xenophobia, with Ireland considered politically unstable and violent (Busteed and
Hodgson 1996:143). Walter considered an increasing anti-Catholic sentiment in
England by the mid-nineteenth century gave rise to racial and religious
discrimination, against the Irish (Walter 1986:132), with the English regarding the
Catholic Church as a negative encroachment on their land. Busteed and Hodgson,
however, argued that the Church offered a 'landmark of cultural identity' and
leadership (Busteed and Hodgson 1996:148), being that the institution was a core to
Irish identity, and thus an effective cornerstone and support to emigrants.
Field's sociological study in three north-eastern cities of the United States recognised
the alienation felt by Irish immigrants in the seventeenth century, being labelled with
negative stereotypes, and accused of being ignorant, drunken and violent (Field
1994:435). In contrast, Miller (1980) investigated the manner in which Irish migrants
perceived themselves in the 1800s. Through newspapers and personal letters, he
found they considered themselves to be in 'exile' brought on by forced migration due
to 'English tyranny'; though many migrated voluntarily to improve their social and
economic fortunes (Miller 1980:99-100).
Marston analysed the neighbourhoods established in Lowell, Massachusetts, in the
nineteenth century, suggesting they presented an answer to the strategies which
enabled the Irish to develop a political presence (Marston 1988:414). Through Irish-
dominated areas and volunteer organisations, a ‘political response’ to discrimination
developed, while living in ‘residential clusters’ afforded the Irish a sense of security
against local discrimination (Marston 1988:419). Volunteer groups fostered the
sharing of knowledge, and provided a chance to work with the rest of the
community, allowing the development of ideas and beliefs and leading to the
evolution of a political ideology arising from their Irish ethnicity (Marston
1988:426). Furthermore, living in enclaves allowed the development of ‘ethnic
solidarity’, expressed in such activities as St Patrick’s Day parades, which not only
emphasised the significance of Ireland and being Irish, but were also public
expressions of the Irish ability for community engagement (Marston 1988:427).
As discussed by Arthure (2014:16), Irishness is a term often used but never defined.
Fitzpatrick (1991a:324) suggests the nature of Irishness is assumed rather than

16
analysed, and that nineteenth-century English observations have formed the basis for
many such assumptions then and since, including the strictness of Catholicism, the
simplistic rural and social society of Ireland, and the prevalence of Gaelic language
(Fitzpatrick 1991a:325). Regardless of the county of origin, religion or skills, many
Irish emigrants tended to be identified as ‘ignorant, dirty and primitive Paddies or
Biddies’ (Fitzpatrick 1985:13). The Irish, however, saw themselves in a different
light; many considered their exodus to be at the fault of English laws in Ireland,
being forced into emigration by ‘political oppression’ and not as a necessity of social
cataclysm (Miller 1980:99), while experiencing discrimination economically and
being perceived as a threat to established morals. Furthermore, Miller (1980:108-
110) identifies a central tenet of Irish Catholic society as a dependence on family and
tradition, leaving little opportunity for individuality, which was further engrained by
a uniformity of belief in the Church. This was in comparison with Irish Protestants,
who considered individuality an important part of their identity.
Symbolism and Material Culture
A number of studies have considered ethnicity through historical archaeology.
McGuire (1982) examined the means by which ethnic groups formed and changed.
In an archaeological study of ethnicity in historic periods, he advocated a
combination of material culture and historical documents to illustrate why some
ethnic groups assimilate (thus becoming materially invisible) and others do not
(McGuire 1982:159).
Material culture conveys notions of 'social-identity' by being associated with a
particular group which enables significant interpretation of aspects of ethnicity and
class (Brighton 2004:149-150). Orser's study of the Roscommon district in Ireland,
for example, found that the area supported three social classes during the late
eighteenth and early nineteenth centuries- landlords, tenants and peasants. Orser
examined the manner in which the peasants expressed their identity through the
locally-made ceramics found in domestic sites, even though better quality, imported
English ceramics were readily available (Orser 1997:15-17).
Similarly, Reckner (2001) scrutinised Irish animosity to American patriotic motifs in
Irish districts of New York as a response to American ‘nativism’ (a means of
protecting the interests of native inhabitants against those of immigrants), akin to
nationalism. His study examined the lack of American nationalist symbols, such as

17
the bald eagle, on clay pipes found in a district with a population of over 90% Irish
immigrants from the 1850s (Reckner 2001:105), in comparison to those that
displayed Irish nationalist symbols, including harps and shamrocks, particularly from
the 1880s onwards (Reckner 2001:111). The nativist themes of this period were
defined by anti-Catholicism and the threat of foreign-born peoples (Reckner
2001:109), with the rise of poverty, crime and disease yet again proclaimed the fault
of 'Catholics', while the cheap labour of the migrants was deemed the cause of a lack
of 'American' jobs (Reckner 2001:110; see also Marston 1988:419). Reckner argues
that such discriminations caused a reluctance by the Irish to accept American
symbols, and so to develop their own political ideologies to strengthen their
standing.
Brighton (2004) found a similar correlation between the use of clay pipes with overt
Irish symbols and the assertion of distinct social and political positions. Focussing on
a case study in Paterson, New Jersey, a district of Irish-born Ulster immigrants and
their Irish/American descendants, he demonstrated how the use of the Red Hand of
Ulster on clay pipes assisted in defining the social standing of the Irish as they
acquired a place in American society (Brighton 2004:161). Brighton concluded that
the Red Hand symbol was used to signify Ireland’s long and important history and
thus portrayed the battle to develop a social order for the Irish and their progeny
(Brighton 2004:161).
The studies of Reckner and Brighton suggest that political awareness and solidarity
among the Irish, and first generation Irish/Americans, increased over the course of
the nineteenth century. Brighton linked this to the 'Gaelic Revival' in Ireland,
manifesting in an increased consciousness of Irish history and interest in Gaelic
culture from the 1880s (Brighton 2004:158-159). Furthermore, having connection
with homeland causes induced a confidence to strive for improved social and
political standing in America, while alleviating a sense of inferiority in their new
home (Brighton 2004:158). This contributed to a 'renewed sense of self,
respectability and cultural strength' (O'Mahony and Delahunty 1998:77, cited in
Brighton 2004:159). Morrissey (2005) further noted how such positive and distinct
social identities continued into the twentieth century through the use of 'cultural
signifiers' - by Irish servicemen in World War I, such as the Connaught Rangers who
used shamrock badges and green flags on their uniforms (Morrissey 2005:80).

18
These studies demonstrate ways in which social identity can present itself as group-
based, in that material culture and spatial organisation produce a connectedness
when confronted with adversity. In turn, this connectedness allowed the Irish to
develop a larger political philosophy that also equipped them to cope with
discrimination and assert solidarity.
Religion, religious symbols and cemetery markers
Religion has long been a major consideration when discussing Irish identity, with
Catholicism being regarded as the faith of the ‘true’ Irish (Walker 1996:37),
particularly in the nineteenth century. Being such a divisive issue in Britain’s
domination of Ireland, with Catholics excluded from any position of importance
(Keenan 1983:5), and the Irish migrating to British colonies where Irish Catholics
encountered prejudice in their everyday lives, the Catholic faith and its symbolism is
particularly poignant in understanding Irishness and Irish identity.
‘Religion lies at the core of cultural history’ (Glennie 1995:164), and death and loss
is a time when lives and faith are contemplated (Mytum 2013:161). The importance
and strength of faith and attitudes to death and remembrance are exhibited in the
memorials. Death and its observance in the Protestant faith still revolves around
judgement of life and beliefs, not on the ‘hope of divine reward’ (Museum of
Protestantism 2014) with no improvement then possible, whereas Catholics
concentrated on more engaged memorialisation in that one’s faith could be enhanced
through prayers by the living (Mytum 2013:162).
The external gravestone, as opposed to memorials within churches, allows not only a
public demonstration of loss, but also a method of displaying beliefs (Mytum
2006:103), and insight into the deceased’s identity. Mytum’s study (2013)
investigated the symbols and texts used on gravestones, not only in different
countries, but also by different religions throughout the eighteenth and nineteenth
centuries. Ulster Catholics who suffered persecution and prejudice, used similar
symbols to Protestants, so that their faith would be less evident in the Counter
Reformation Catholic church (Mytum 2013:166). Puritans of New England
represented the prospect of resurrection with cherubs, but used little biblical text and
Ulster Scots in New Hampshire employed mortality symbols such as coffins with
hearts and a cross, as well as Presbyterian images for love (Mytum 2013:163). The
Jesuit order of Germany encouraged the use of ‘IHS’ (one explanation of this

19
abbreviation is Iesus Hominum Salvator – ‘Jesus Savior of Mankind’ [Donnelly
2005:39]) with a cross, a symbol that developed strong associations with Irish
Catholics as a symbol of prayer for the dead as well as a ‘symbol of resistance’
against the Reformation for both Irish Catholics and the vestige of the Scottish who
remained with that faith (Mytum 2013:168). Furthermore, depictions of Christ’s
Passion and a crucifix were popular motifs in the Irish Counties of Louth and
Tipperary (Mytum 2013:168). Gravestones are particularly important means by
which such beliefs can be articulated – one that may reflect people’s connections and
traditions with more transparency than documented histories (Tarlow 1999:5).
Mytum has undertaken numerous studies of Irish cemeteries to analyse the spatial
relationship of graves (Mytum and Evans 2002:131) and considered grave markers
as artefacts with their own 'social history' (Mytum 2003/2004:111). He believes the
inscription to be the most important part of the marker, as the words are not merely
descriptive but also contextual, particularly with additions of progressive interments
(Mytum 2003/2004:113). The monument style indicates facets of beliefs and social
status, with meaning being communicated to the community who knew the deceased.
County Louth characteristically displayed simple inscriptions, such as:
ERECTED BY NICHOLAS GARVEY GARVEYSTOWN IN MEMORY OF HIS FATHER PATRICK GARVEY WHO DIED 1ST AUG 1893 AGED 60 YEARS
RIP
An emphasis was often given to those who erected the memorial, displaying
elements of identity, such as religious beliefs or social status, although not
necessarily deliberately (Mytum 2003/2004:114). Furthermore, Mytum found Irish
graves to be re-used over a number of generations, particularly from the mid-
eighteenth century until the early 1900s. Over time the style of inscription reflected
the era in which wording was added, while the importance of familial connection and
responsibility was shown by continual re-use (Mytum 2003/2004:117).
Mytum's and Evan’s research at Killeevan, County Monaghan, did not investigate
individual grave markers, but rather the spatial relationships and 'changing physical
context of commemoration' (Mytum 2003/2004:113). Being that the site was little

20
used after the eighteenth century, it presented a finite time frame to examine the
'spatial dynamics' of memorialisation (Mytum and Evans 2002:133). Unusual
findings occurred in the study, with interesting placements of Catholic burials,
normally located at the east end of the churchyard and in proximity to the church
altar, found to the west, a situation they ascribed to the position of an earlier
medieval church, rather than the existing building (Mytum and Evans 2002:144).
More interestingly, Mytum found few family burials in this cemetery, suggesting
that the practice was not universal across Ireland.
County Monaghan was also the subject of McCormick's research into headstone
decoration from the eighteenth century (McCormick 1976). He found the stones to
be decorated on back, front and, at times, the sides. The fronts contained an
inscription, bordered by birds or foliage, with cherubs' heads and beings, who were
possibly angels; the back decoration consisted of a coat-of-arms and a depiction of
Adam and Eve, while the sides, when embellished, portrayed praying clergy
(McCormick 1976:5). McCormick notes that dorsal engravings, particularly when
accompanied by vegetation, were typical throughout Ireland (McCormick 1976:6).
The motifs were associated with more general precepts of Christianity akin to
Alexander’s (1950) findings, rather than having distinct cultural undertones.
Alexander (1950) explored the meanings of early Christian symbols, many of which
are still used as grave decoration. She found that the essence of motifs has remained
generally constant throughout the centuries (Alexander 1950:242). Jesus is
represented by ‘alpha and omega’, as well as by a lamb, the latter of which also
depicted the faithful, as did a fish. A phoenix or peacock depicted the resurrection,
and a cross, derived from the time of Constantine, was a symbol of triumph. The
initials ‘INRI’, the contraction for IESVS NAZAREVS, REX IVDAEORUM [Jesus
of Nazareth, King of the Jews], are normally seen above Christ’s head in crucifixion
embodiments (Alexander 1950:242-247).
Christian Burials in an Australian Context
The evidence of Christian burials in Australia from the time of first settlement is
quite different from that seen in Irish cemeteries. Jalland identified the significance
placed on bush deaths and burials in the latter half of the nineteenth century, where
the bush grave 'established a sense of belonging to the land' (Jalland 2002:254). Irish
people desired to be buried with family in Ireland, but due to the tyranny of distance
21
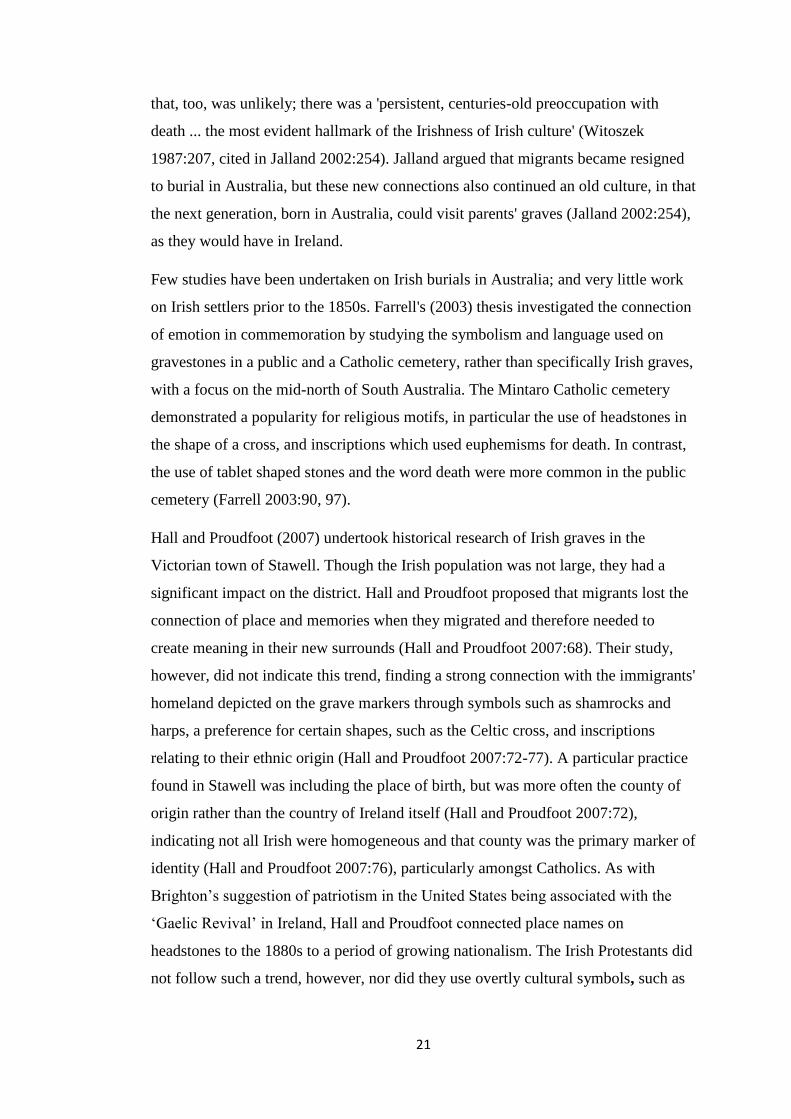
that, too, was unlikely; there was a 'persistent, centuries-old preoccupation with
death ... the most evident hallmark of the Irishness of Irish culture' (Witoszek
1987:207, cited in Jalland 2002:254). Jalland argued that migrants became resigned
to burial in Australia, but these new connections also continued an old culture, in that
the next generation, born in Australia, could visit parents' graves (Jalland 2002:254),
as they would have in Ireland.
Few studies have been undertaken on Irish burials in Australia; and very little work
on Irish settlers prior to the 1850s. Farrell's (2003) thesis investigated the connection
of emotion in commemoration by studying the symbolism and language used on
gravestones in a public and a Catholic cemetery, rather than specifically Irish graves,
with a focus on the mid-north of South Australia. The Mintaro Catholic cemetery
demonstrated a popularity for religious motifs, in particular the use of headstones in
the shape of a cross, and inscriptions which used euphemisms for death. In contrast,
the use of tablet shaped stones and the word death were more common in the public
cemetery (Farrell 2003:90, 97).
Hall and Proudfoot (2007) undertook historical research of Irish graves in the
Victorian town of Stawell. Though the Irish population was not large, they had a
significant impact on the district. Hall and Proudfoot proposed that migrants lost the
connection of place and memories when they migrated and therefore needed to
create meaning in their new surrounds (Hall and Proudfoot 2007:68). Their study,
however, did not indicate this trend, finding a strong connection with the immigrants'
homeland depicted on the grave markers through symbols such as shamrocks and
harps, a preference for certain shapes, such as the Celtic cross, and inscriptions
relating to their ethnic origin (Hall and Proudfoot 2007:72-77). A particular practice
found in Stawell was including the place of birth, but was more often the county of
origin rather than the country of Ireland itself (Hall and Proudfoot 2007:72),
indicating not all Irish were homogeneous and that county was the primary marker of
identity (Hall and Proudfoot 2007:76), particularly amongst Catholics. As with
Brighton’s suggestion of patriotism in the United States being associated with the
‘Gaelic Revival’ in Ireland, Hall and Proudfoot connected place names on
headstones to the 1880s to a period of growing nationalism. The Irish Protestants did
not follow such a trend, however, nor did they use overtly cultural symbols, such as

22
shamrocks or harps or inscribe their place of birth on headstones (Hall and Proudfoot
2007:77).
Despite highlighting some suggestive markers of Irishness, Hall and Proudfoot’s was
an historical study and therefore relied solely on descriptive observations with no
statistical analysis to determine whether the findings represented real distinctions
amongst the larger population, let alone whether Protestant and Catholic graves
indicated difference or similarity in terms of Irishness.
Summary
The studies of grave and cemetery trends in style, decoration and inscriptions
demonstrates the worth of investigating the memorialisation of Irish settlers in South
Australia. Variations in Ireland allow an understanding of the importance of local
traditions in South Australia, and whether colonial developments can be identified.
As much work has been undertaken in the United States and Ireland, the opportunity
to expand the knowledge of the archaeological record in a new domain provides a
means to further understand the early settlers, and what they deemed important to
continue from their homeland.
23
Chapter 3: IRISH SETTLERS IN SOUTH AUSTRALIA
The Beginnings of South Australia
South Australia was a non-convict, English colony, founded on Edward Gibbon
Wakefield’s plan of ‘systematic colonisation’ (Richards 1986:5). Men with capital
bought land with the promise of labour and profit (Main 1986:96), and the revenue
from sales was used to pay emigrant labourers’ passages (Pike 1967:52).
Furthermore, the high price of £1 per acre prevented labourers from being able to
afford land for many years after their arrival, thus retaining them as a labour force.
This enabled the colony to exist with two levels of society – ‘men of capital’ and
‘labourers with free passage’– although the plan did not work as well in practice
(Main 1986:97).
The founding philosophies of South Australia were ‘civil liberty, social opportunity
and equality for all religions’ (Pike 1967:3), with an anticipated gender balance. This
ideal, however, was a marketing ploy, and did not justify such a large number of
emigrants (15,000) coming to South Australia on assisted passage in the colony’s
first decade.
With South Australia being English in its genesis, the Irish were not the earliest
arrivals. In fact, it was a calculated decision by administrators to avoid affiliating
with Ireland as a source of emigrants (Richards 1991a:62-63). However, the architect
of the South Australian colonisation scheme, Wakefield, considered that encouraging
Irish migration could assist in alleviating the influx of Irish peasants to England, and
suggested creating an emigration fund for that purpose (Richards 1991b:10). From
1835, Captain Robert Torrens, a Derry-born Protestant, vigorously crusaded to
encourage Irish emigration (Moore 1991:104-105). Many of the colony's residents,
however, were opposed, not only to immigration of the poor, but also to the
establishment of Catholicism in the colony (Richards 1991a:67). As such, the
numbers of Catholic Irish were few until the 1840s, but the South Australian
Protestant Emigration Community, established in 1837, was formed to encourage
Protestant Irishmen to escape the conflict and unrest in Ireland. As the need for
labourers increased, Irish Catholics were recruited with men under 30 years of age
offered passage at a reduced rate, with board and clothing provided. Upon arrival in
the colony, they had the freedom to work for whomever they chose (Moore

24
1991:109). It was under these conditions that the William Nichol brought the first
company of free Irish settlers directly from Ireland to South Australia, departing in
April, 1840 (Leadbeater 2014). These came from numerous counties, thus ensuring
the colony would be well publicised among the many peasant farmers across Ireland
through letters from their emigrated relatives (Moore 1991:109).
A number of emigration organisations operated in the first ten years of settlement,
developed to advertise South Australia as a worthwhile place in which to live and/or
invest and to stimulate Irish emigration; one in particular, the Emigration and Special
Survey Commission, was established in 1840 to encourage colonists to settle in
special survey areas (Moore 1991:109). Few investors had taken advantage of
opportunities to own land until the creation of the special surveys, by which settlers
or investors in Great Britain could pay £4000 for a survey of 15000 acres. Four
thousand of the surveyed acres could then be pre-emptively selected by that
individual for settlement (Moore 1991:109).
The Irish in South Australia
Initial settlement of the mid-north occurred in the early 1840s, as part of one of the
first special surveys; the counties of Stanley and Light were proclaimed in 1842.
Three individuals, Edmund B. Gleeson, from County Clare in Ireland (Richards
1991a:84), Sir Montague Chapman of County Westmeath (Richards 1991a:69) and
Colonel George Wyndham, of Sussex, England (Spencer 1998:3), acquired land
under special survey. Gleeson had arrived in the colony in 1838 from Ireland via
military service in India (Richards 1991a:84) and was one of the first to settle in the
mid-north in 1840, establishing a homestead and sheep station in the Clare Valley,
named after Gleeson’s home county.
Chapman was a Protestant Irishman purchased land near the area now known as
Kapunda. Wyndham, who already possessed substantial land holdings in Counties
Clare, Tipperary and Limerick in Ireland invested in land at Hutt River, near Clare,
to alleviate the excess of tenant farmers on his estates, while also assisting those
tenants to migrate and work the lands, as did Gleeson and Chapman, who brought
many Irish people to the colony to labour on their properties.
Neither Chapman nor Wyndham ever migrated to South Australia, but had managers
to oversee their colonial acreages. Chapman, however, did visit his estates in 1852,

25
the year after transferring a sizeable proportion of land to his manager, Charles
Bagot (Moore 1991:111-112).
Bagot, of Ennis, County Clare, in association with Chapman, recruited people who
had been displaced by evictions and closures (Richards 1986:123), sending 213 Irish
from Ireland’s southern and eastern provinces of Munster and Leinster to the colony.
Bagot travelled as manager of the land purchase, sailing on the Birman in 1840 with
his family from Cork (Moore 1991:112). Two further emigrant ships sailed from
Cork in 1840, the Mary Dugdale and the Brightman. Some immigrants found work
on the properties of John Reid, a Protestant Irishman from County Clare (Niesingh
and Shackley 2009:4-5), others worked for Bagot on land owned by Chapman at
Kapunda and the River Light or for Gleeson on his property in Clare (Moore
1991:110).
Chapman, Gleeson and Bagot were typical of the earliest Irish settlers to South
Australia, who were mainly Protestants, since ‘no Catholic gentlemen of property
were allowed to join the founders’, an accusation by South Australia’s first Catholic
priest, William Benson, in 1843 (Richards 1991c:216). This notion of minimising
Irish migrant numbers was supported by Major Thomas O’Halloran, a Protestant
Irishman who claimed that the early administrators of the colony allowed twenty
times more English to immigrate to South Australia than Irish (O’Halloran et al.
1849:1S).
A severe shortage of workers in the late 1840s, due to the improving economy and
thus increased demand for labourers, causing the near collapse of the colony and
resulting in many ex-prisoners and ‘poor house’ girls being brought to South
Australia (Richards 1986:126). About 600 Irish Catholic female orphans arrived in
South Australia between 1848 and 1850 (O’Farrell 1987:74) and, although initially
not welcomed because of their religion and their lack of education, the girls were
quickly employed until a downturn in available work resulted in the cessation of that
particular emigration scheme (Richards 1998:83-85). The colony’s Governor from
1855, Richard Graves MacDonnell, planned to spread the Catholic immigrants
throughout the countryside to reduce an excess of labourers and overcrowding in the
city, as there was insufficient work and accommodation in which to house them, for
such an influx in Adelaide. As a result, some of the women shifted to the Clare
region, which already had an Irish presence (Richards 1998:91-92). Furthermore,
26
more Irish girls were sent to that district as part of Caroline Chisholm’s scheme
(Moyle 1982:16-17) to secure accommodation and work, while arranging marriages
for single Irish Catholic girls encouraged a more temperate community (Gallasch
1983:4). Chisholm, being faithful to her Catholic belief, encouraged families to
emigrate together or to reunify families when a parent had initially emigrated alone
(Aust. Population Association 1988:54). The St Patrick’s Society, originally founded
in Adelaide in 1849 (O’Farrell 1987:143), began an immigration depot in Clare to
care for the single women, with a similar scheme operating in Mintaro, both of
which employed strict rules to ensure the girls’ safety (Lally 2006:5-6).
Various towns developed across the mid-north in response to the influx of
immigrants throughout the nineteenth century (Figure 3.2). Kapunda, initially an
agricultural area, advanced with the discovery of copper, while Mintaro developed
from Burra’s copper industry, being a transport stopover to the town of Port Henry
(now Port Wakefield) (Noye 1975:20), with that village being established when
Joseph Gilbert subdivided land in 1849 (DENR 1990). The discovery of slate at
Mintaro in 1854 became a major factor in the town’s survival after the ore transport
bypassed it from 1857 onwards, while its development as an agricultural centre
further enhanced its continuance (Noye 1975:125). The Irish (Catholics) tended to
settle on the northern side of the town, while English (Methodists) were primarily in
the town itself. As in Kapunda, the Irish presence in Mintaro resulted in a strong
community, with settlers such as Peter Brady and the Dempsey family, all of County
Cavan, becoming leaders in that community.
Conversely, Navan was an Irish enclave settled in the 1840s by Irish emigrants who
fled the Famine, and named after a town in Co. Meath (Burrows 1965:29). By 1866
the population was 300, with a Catholic school and church adding to the services
(Whitworth 1866:157). As noted by Carroll (1876:4), by 1876 Navan was considered
more an agricultural district than a township, since the area had reverted mainly to
farmland (Burrows 1965:29-30). The establishment of a segregated Irish community
such as Navan was unusual in South Australia. Saddleworth was also settled in the
1840s, by an English farmer, James Masters, who established a sheep property and
named the area after his hometown in West Riding, Yorkshire. The town did not
appear to have a large Irish population, with only a handful of graves found in the
Anglican cemetery, and those all belonging to one extended family. The town

27
developed similarly to Mintaro, being on the transport route from Burra to Adelaide
(History SA). Riverton, near Navan, was also established by Masters in 1856
(Burrows 1965), but was an English community, suggesting that English migrants
chose to settle away from the neighbouring Irish.
Undalya is on the border of the counties of Stanley and Light, and at the junction of
the Wakefield River and Pine Creek (Whitworth 1866:256). Its two earliest settlers
were Englishmen, Captain George Lambert, buried in the Undalya Catholic
cemetery, and William Baker, who arrived in the district in 1848, having been a
crewman on the Emerald Isle, the ship chartered by Gleeson when he migrated to
South Australia (Moyle 1982:98). St Patrick’s Catholic Church was built in 1866 by
the Jesuit priests of Sevenhill, adjacent to a Catholic school established the year
before to cater for Irish immigrants (Moyle 1982:100), who, as in other districts,
proved to be hard-working members of the community, although not rising to any
particular historical prominence.
Figure 3.1: Clare Valley region of South Figure 3.2: Towns of the Clare
Australia. Valley. (Map from http://library.unimelb.edu.au 2001) (Map from Topic Media 2014)
The Home Counties of South Australia’s Irish Settlers
The arrival of the Birman in 1840 began an ongoing and significant association
between County Clare and South Australia, since that county consistently provided
the highest number of emigrants through the nineteenth century. Together, the

28
counties of Clare, Tipperary, Limerick and Cork supplied half of all assisted passage
arrivals after 1850 (Richards 1991c:221), with the Irish constituting about 10 percent
of the colony's population in 1861 (Richards 1991a:101) (Table 3.1). However, the
distribution found in this study showed a higher percentage of Cavan immigrants
compared to those from either Cork or Limerick in the mid-north (Figure 3.3).
Stanley Light
Birthplace 1861 1871 1881 1891 1901 1861 1871 1881 1891 1901
Ireland 714 1102 877 520 372 1917 1921 1124 738 539
South
Australia
1995 5677 7233 7483 7540 5844 11417 10698 11460 12539
Rest of
Australia/
NZ
36 N/A 163 110 203 89 N/A 202 189 316
Rest of
Britain
1811 2470 2232 1401 891 3622 3439 2386 1627 1038
Other
countries
42 382 509 346 256 51 2983 1867 1470 1018
Other British
Possessions
204 115 22 21 11 3384 194 25 18 15
At sea/
unspecified
33 39 32 35 27 73 65 26 44 22
Total 4835 9785 11068 9916 9300 14980 20019 16328 15546 15487
Table 3.1: Birthplace of County Stanley and Light Residents. (1861, 1871, 1881,
1891, 1901 SA Census)
0
5
10
15
20
25
30
Per
cen
tag
e fo
r ea
ch c
ou
nty
Figure 3.3: Birthplace of the deceased, or nearest relatives,
recorded in the study.

29
County 1850s 1860s 1870s 1880s 1890s
Stanley 0 13 14 9 14
Light 4 39 35 26 37
Total 4 52 49 35 51
Table 3.2: Irish deaths recorded in study in County Stanley and Light, for each
decade.
Over time the counties of Stanley and Light continued to grow in population,
peaking in the 1860s in Light and the 1870s in Stanley (Table 3.1), with both
showing a significant influx of Irish-born migrants. A decline in population is
apparent in the 1891 census, particularly among the Irish-born residents of Light,
with a decrease of about 35% over the preceding decade. Stanley had about 41%
fewer Irish-born in the same period (Table 3.1). The number of deaths recorded for
this study (Table 3.2) followed a similar pattern to the Census data, with a greater
number of deaths in the 1890s being indicative of aged migrants. The decrease in
overall numbers of settlers in the counties indicates a willingness of Irish settlers to
move to other areas when opportunities arose and not to be totally reliant on Irish
communities.
For all these immigrants, the Catholic Church was a mainstay. With low numbers of
Catholics in South Australia (6% in 1844), becoming established was difficult for the
Church, as little state aid was available, being mainly due to the colony ostensibly
having no ties to a particular faith, resulting in charitable and social organisations
being created by the various faiths to finance their own churches and charitable
causes. Jesuit priests, who built a centre at Sevenhill near Clare, were instrumental in
Irish emigrants maintaining connections with their faith (Hilliard and Hunt
1986:212-213). Services were often held in private homes such as in Peter Brady’s
home in Mintaro prior to 1855, when the Mary Immaculate Catholic Church was
built, or in Timothy Crowe’s house at Undalya, where a separate room was built for
religious worship, until St Patrick’s Church was constructed in 1866 (Moyle
1982:107). By 1871, Catholics had grown to outnumber members of the Church of
England in both counties (Table 3.3).

30
Light Stanley Total members of the
two Counties
1861 1871 1861 1871 1861 1871
Catholic 2163 4066 221 2794 2384 6860
Church of
England
2377 2706 307 2264 2684 4970
Total people in
County
14980 20019 4835 9785 10904 29804
Table 3.3: Religion by county 1861 and 1871. (SA Census: 1861 & 1871)
Chain Migration
Chain migration describes the continual arrival of migrants linked by county, or
more particularly, family connections and was practised in all Australian colonies
during the nineteenth century (Reid 2011:220), being most prevalent among the Irish
(O’Farrell 1987:16). While categories of desired migrants, mostly labourers and
servants, were determined by Britain and each colony was dependent on need, it was
the families, or Irish associates, who were central to who actually migrated
(Fitzpatrick 1991b:135). Family, though important in all migrant nationalities,
appeared to hold a stronger bond among the Irish. Coming from a rural society
where tradition and religious beliefs were paramount in everyday life, family bonds
were also very strong (O’Farrell 1987:16).
Assisted passage and chain emigration systems practised in South Australia both
exploited and assisted this strong sense of community among the Irish, resulting in a
widespread network of relatives and friends who sustained immigrants in times of
need (Richards 1991a:82). Examples in the Mintaro region were particularly evident.
Peter and Daniel Brady arrived in South Australia in 1840, and established a means
by which new arrivals could find employment and settle into the community,
nominating more than 500 to migrate in a twenty year period (Richards 1991a:89).
The Dempsey family from County Cavan also showed both the willingness of Irish
emigrants to move for opportunity and the phenomenon of chain migration. Three
siblings, Andrew, Bridget and Martha, migrated from County Cavan in 1849, with
Andrew moving to the Ballarat Goldfields in 1851 and returning to settle in Marrabel
in South Australia. Other siblings arrived in the 1850s to become bullock teamsters,
with the rest of the family including aged parents arriving in 1854, and all eventually
settling near Mintaro and the nearby town of Auburn. Overall, the family migration
spanned a 30 year time period (Richards 1991a:85-86).

31
This chain emigration led to Irish regions developing in some areas of the colony,
particularly the mid-north, with localities such as Kapunda and Clare having high
concentrations of Irish settlers. The Irish proved to be enterprising and readily took
advantage of land legislation from 1869, enabling access to credit which allowed
them to expand their farms. This resulted in a willingness to relocate in order to
advance economically, and thus a dispersal away from the initial enclaves, such as
Navan, that were established in the mid-north.
The Irish and their relationship to other groups
While the Irish settled near fellow countrymen on arrival, they were not averse to
settling in new areas in an attempt to better their lot. That is, they did not generally
settle in isolated communities (Nance 1978:67), resulting in historians arguing for a
dilution of any discernible influence they may have had on the developing society.
The historical studies of Richards (1991a, b) and James (2009) are examples of the
emphasis placed on the ordinariness of the Irish settlers, and their assimilation into
society. Richards suggests the Irish avoided developing concentrated areas of kin,
and that their mobility and way of living showed little distinction from British
migrants, thus allowing them to assimilate (Richards 1991b: 233-234). The
‘ordinariness’ of the Irish is further considered by James (2009) to have enabled the
Irish to blend into South Australian society.
Recent archaeological work in Kapunda, however, suggests that this is not the whole
story. Along with Cornish and Welsh migrants to the Kapunda district, the Irish
constituted more than half of Kapunda’s population (Charlton 1971:63). However,
few Irish gained civil distinction in the Kapunda area, with the exception of some
Protestants, such as Bagot, Dr Blood (later to become Mayor of Kapunda) and
William Oldham (Charlton 1971: 64), originally the Kapunda Mine bursar, was
appointed as Kapunda’s surveyor by Bagot and became a very influential member of
the community (Charlton 1971:14). Kapunda saw a large influx of Irish in the 1850s
with most squatting on land outside the town that became known as Baker’s Flat.
Little tolerance was shown to them by the town dwellers (Charlton 1971:18) and by
the 1880s, the Irish were well established, claiming ownership of Baker’s Flat
because of the longevity of their residence, despite neither owning nor renting the
land itself. Considerable unrest ensued between them and the owners, with the Irish
women showing strong resistance (Charlton 1971:42, 43). Their strength in numbers
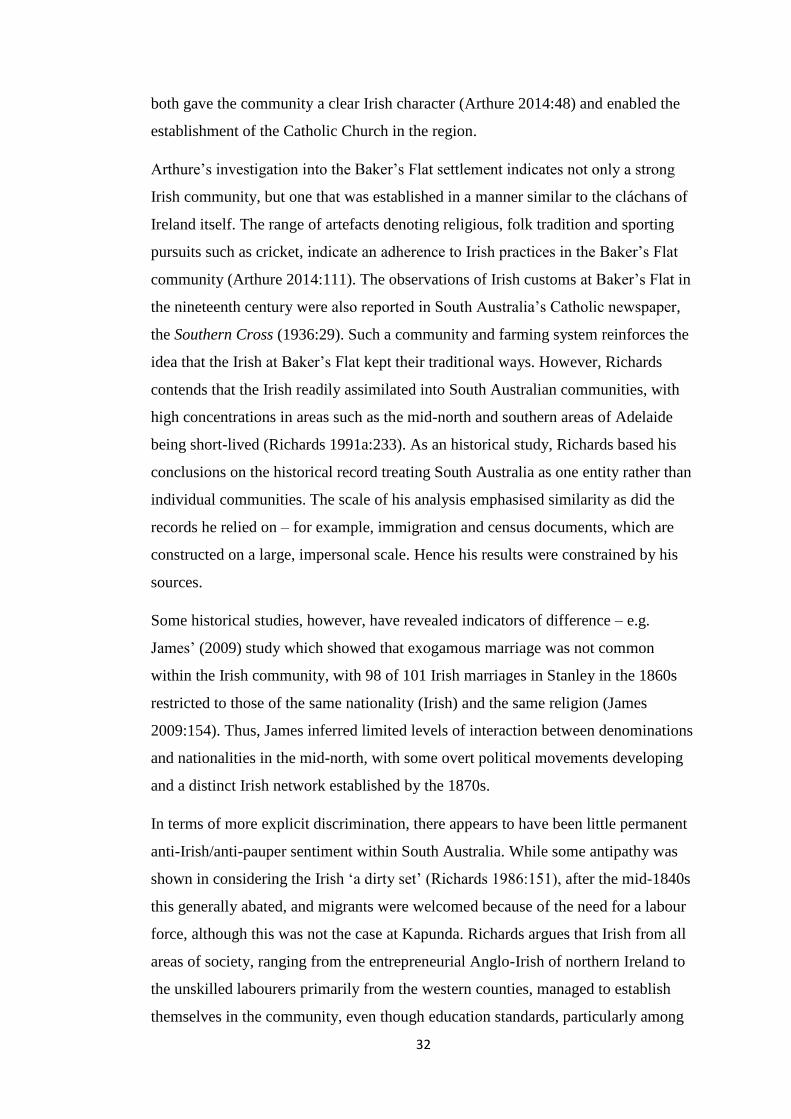
32
both gave the community a clear Irish character (Arthure 2014:48) and enabled the
establishment of the Catholic Church in the region.
Arthure’s investigation into the Baker’s Flat settlement indicates not only a strong
Irish community, but one that was established in a manner similar to the cláchans of
Ireland itself. The range of artefacts denoting religious, folk tradition and sporting
pursuits such as cricket, indicate an adherence to Irish practices in the Baker’s Flat
community (Arthure 2014:111). The observations of Irish customs at Baker’s Flat in
the nineteenth century were also reported in South Australia’s Catholic newspaper,
the Southern Cross (1936:29). Such a community and farming system reinforces the
idea that the Irish at Baker’s Flat kept their traditional ways. However, Richards
contends that the Irish readily assimilated into South Australian communities, with
high concentrations in areas such as the mid-north and southern areas of Adelaide
being short-lived (Richards 1991a:233). As an historical study, Richards based his
conclusions on the historical record treating South Australia as one entity rather than
individual communities. The scale of his analysis emphasised similarity as did the
records he relied on – for example, immigration and census documents, which are
constructed on a large, impersonal scale. Hence his results were constrained by his
sources.
Some historical studies, however, have revealed indicators of difference – e.g.
James’ (2009) study which showed that exogamous marriage was not common
within the Irish community, with 98 of 101 Irish marriages in Stanley in the 1860s
restricted to those of the same nationality (Irish) and the same religion (James
2009:154). Thus, James inferred limited levels of interaction between denominations
and nationalities in the mid-north, with some overt political movements developing
and a distinct Irish network established by the 1870s.
In terms of more explicit discrimination, there appears to have been little permanent
anti-Irish/anti-pauper sentiment within South Australia. While some antipathy was
shown in considering the Irish ‘a dirty set’ (Richards 1986:151), after the mid-1840s
this generally abated, and migrants were welcomed because of the need for a labour
force, although this was not the case at Kapunda. Richards argues that Irish from all
areas of society, ranging from the entrepreneurial Anglo-Irish of northern Ireland to
the unskilled labourers primarily from the western counties, managed to establish
themselves in the community, even though education standards, particularly among

33
the Catholic Irish, were low (Richards 1991a: 227-232), thus suggesting that the
Irish were no more maligned than other immigrant nationalities.
Arthure’s findings, which emphasise the difference maintained across 70 years by at
least one Irish community and James’ recognition of strong communal bonds
between Irish Catholics, both suggest that the Irish were distinctive in at least some
ways until well into the twentieth century. By studying Irishness in more detail,
including within individual communities and within individual families, the
archaeology of Irish graves has the potential to provide an alternative window into
the dominant historical narrative.
The mid-north of South Australia is therefore an excellent location in which to test
ideas of Irish identity, as numerous Irish men and women settled in the region from
many counties. Furthermore, with the large diversity of nationalities living in the
region, changes in cultural practices over time due to outside influences may be
identified.

34
Chapter 4: METHODS
Introduction
Six cemeteries in the mid-north were investigated for expressions of Irish identity in
gravestones. The time frame focussed on 1850 to 1899, as emigration had dwindled
by the end of the century as economic conditions in Ireland improved (Walsh
2001:33). By the end of the nineteenth century colonial status was changing within
the nation as Federation loomed.
The cemeteries chosen for data collection encompass a sizeable proportion of the
range of Irish settlement in the mid-north in the second half of the nineteenth
century. Four cemeteries were Catholic (Mintaro [Figure 4.4], Navan [Figure 4.3,
Undalya [Figure 4.1, (1)] and St John’s [Figure 4.2, (1)], near Kapunda) and two
were Anglican (Christchurch Anglican Cemetery [Figure 4.2, (2)] at Kapunda and
Whip Street Cemetery, Saddleworth [Figure 4.1, (2)]). The Irish who migrated to the
colony were predominantly Catholic; however, in an attempt to differentiate between
forms of Catholic identity vs Irish identity a comparison was made to Irish Anglican
(Protestant) burials, as well as non-Irish Catholic burials. To allow for a range of
ages and genders, a total of 200 headstones were recorded in 177 plots, constituting a
total of 352 burials (Table 4.1).
Cremations were not included in this study. Cremated remains were only present in
one cemetery, Christ Church Anglican. The practice was not legalised in South
Australia until 1891 and the first crematorium was only built in 1903 in Adelaide
(Unknown [Australian Museum] 2010), placing cremations outside the time frame of
this study. Furthermore, papal permission for priests to preside over cremations was
not bestowed until 1969 (Jalland 2006: 331) nor was it a practice accepted among
Catholics even when it was a legal means of body disposal.
Mintaro Navan St Johns Undalya Christchurch S/worth Total
Grave markers 39 17 111 18 9 6 200
Plots 34 17 101 17 7 1 177
Table 4.1: Number of grave markers compared to numbers of burial plots.

35
Figure 4.1: Location of (1) Undalya and (2) Saddleworth cemeteries,
in relation to each town. (Map Data © Google 2017)
Figure 4.2: Location of Kapunda cemeteries.
(1) St John’s, (2) Christchurch Anglican. (Map Data © Google 2017)
1
2
1
2
Undalya
Saddleworth
Kapunda

36
Figure 4.3: Location of Navan Catholic
cemetery in relation to the Riverton
township. (Digital Global © Google
2015)
N
Figure 4.4: Location of Mintaro Catholic Cemetery.
(Digital Global © Google 2015)
Riverton
Mintaro

37
The proportion of Irish Catholic to non-Irish and Irish Protestant graves in each
cemetery were as follows:
Mintaro Navan St Johns Undalya Christchurch Saddleworth
Timeframe of
graves recorded
1858
1897
1858
1899
1859
1899
1862
1899
1870
1898
1872
1899
Irish Catholic 35 17 98 16 N/A N/A
Non-Irish
Catholic
4 N/A 13 2 N/A N/A
Irish Protestant N/A N/A N/A N/A 9 6
Total 39 17 111 18 9 6
Table 4.2: Distribution of religion and nationality of recorded headstones.
The data collection was undertaken on four separate visits. In July 2013, a team of
four recorded all graves within the 1850-1899 timeframe at Navan, Mintaro and St
John's cemeteries. In September 2013 and October 2013 respectively, the graves in
Undalya and Christchurch cemeteries graves were recorded, with Saddleworth
recorded in June 2014 to increase the dataset of Protestant Irish burials. Christchurch
cemetery had proven to contain fewer examples than expected, mainly due to a lack
of original headstones. Some graves were revisited to check data which had not been
accurately recorded.
The following goals were realised:
1) a site plan of each cemetery was produced if it did not exist;
2) all graves within the selected time frame had the following data recorded,
descriptively and photographically:
the inscriptions of each headstone
the style of each headstone
the style of borders around each plot
the motifs on the headstones, and
the dimensions of each plot
Site Plans
Undalya (Appendix 6), Mintaro (Appendix 3) and the Saddleworth Whip Street
(Appendix 8) cemeteries required new plans, since either no previous ones existed or
proved unsuitable for this study. All were plotted using the baseline/offset method,
with perimeter measurements and major dimensions recorded using a trundle wheel.
The baseline was a 50 metre tape and smaller measurements recorded using 8 metre
tapes. Some cemeteries, such as Mintaro and Undalya were very overgrown, which
prevented their perimeters from being measured accurately.

38
Navan (Appendix 4), St John's (Appendix 5) and Christchurch (Appendix 7)
cemeteries all had stylised plans supplied by their caretakers, allowing the outlines of
the graves to be married to the names of the burials.
Recording Methods
Many graves had numerous interments. While some people had died in the project
timeframe, they were not the primary burial, that is, not the first named person on the
headstone. As the stylistic choices of the headstones relate to the primary burial, and
not those buried earlier or later, this interment was the most relevant to the study. As
a result, only those headstones with the primary burial occurring between 1850 and
1899 were recorded.
All headstones were recorded using a grave recording form (Appendix 1), based on
that in Burke et al. (2009:388), allowing all stylistic choices to be recorded apart
from fence dimensions. To compensate, these were written in the area for drawing
the headstone shape, and easily found when entering the data in the database. The
photographic record documented the photo number, grave reference and subject
(Appendix 2).
Definitions of terms
The definitions of terms used in this study are in Appendix 9.
Historical Research
To complement the recorded data, historical research was undertaken to determine
who of the interred were actually Irish and, if possible, when they had arrived and
from which county. An insight into emigrant occupations and where they resided
upon settling in the mid-north was also a focus of this research. A number of primary
and secondary resources were utilised including:
Biographical index of South Australia (Statton and SAGHS 1986)
Births, Marriages and Death records of South Australia
Christchurch Anglican Church burial records
Family histories
Internet (Trove, shipping lists, Genealogy SA database, Familysearch.org)
Kapunda Catholic Church burial records
Local history centres, particularly Kapunda, Riverton and Clare, providing
both written and photographic sources

39
State Library resources (South Australiana reference sources, SA Gazette, SA
Parliamentary Papers)
When no records could be found, the Irish Primary Valuation property survey was
used to narrow down the area of origin for particular surnames, enabling a degree of
certainty to be established over the Irish origins. This survey established which
surnames were found most commonly in which counties and, while this method does
not ensure true accuracy, it allows for an approximation of emigrants' origins (Table
4.3) (Ireland Valuation Office 1847). These people were grouped as ‘Irish uncertain’
(Table 4.3) and accounted for 18.9% of recorded interments.
Mintaro Navan St Johns Undalya Christchurch Saddleworth
Irish
confirmed
30
11 78 14 5 7
Irish
uncertain
5 6 20 2 4 1
Non-Irish
confirmed
4 n/a 11 1 n/a n/a
Non-Irish
uncertain
0 n/a 2 1 n/a n/a
Total 39 17 111 18 9 7
Table 4.3: Numbers of recorded interments with confirmed/unconfirmed nationality.
Spreadsheets
All data was entered into Excel, using the same categories as the recording forms.
Further spreadsheets were created for historical research, with categories including
dates of birth and death, country and/or county of origin, year of arrival in South
Australia, occupation and residence, along with details of marriage and children (see
Appendix 11 – electronic data).
Statistical Analysis
Statistical analysis was used to determine if any meaningful patterns could be
discerned in the data, allowing the significance of individual pieces of data, and of
trends in the data, to be identified.
Descriptive (percentage) Analysis
Initial patterns from the data were derived from basic descriptive statistics to give an
overview of possible trends that could be examined more closely in terms of
significance.

40
Chi-Square Test of Independence
Chi-square was employed to test the independence of two categorical variables from
a population. This was achieved by determining whether a significant connection
existed between them. In this case, the variables were a) Irish Catholic and non-Irish
Catholic, b) Irish Catholic and Irish Protestant and c) Irish and non-Irish. Chi-square
could only be used on data counts of greater than five.
The definition of terms for the testing are detailed in Appendix 9.
Limitations
A number of limitations restricted a more comprehensive analysis of the data. The
historical research was impacted by the limited availability of some data.
Specifically, the shipping manifests for Irish emigrants are far from complete
(Swiggum 2014), making confirmation of origins uncertain in some instances. A
number of passenger lists have been lost or destroyed, while most ships departed
from England with no birthplace recorded for some passengers. Only four ships
sailed directly from Irish ports to South Australia, making determination of Irish
origins difficult. The variations of spellings and birthdates/ages further complicated
the process. If the birthdates/ages were within two or three years of that on the
graves, it was assumed to be the same person. Accuracy of identification was
increased by cross-checking other family members from grave inscriptions with
shipping lists that included the names of family members. By cross-checking birth,
marriage and death records, a degree of certainty could be ascertained. Baptismal
records also assisted in determining the correlation between parents’ names and
shipping records.
Another constraint was the low number of non-Catholic Irish graves recorded. This
did not allow a definitive comparison with the Catholic examples. About 10% of
Irish who immigrated to the colony were Protestant, resulting in difficulty in finding
a reasonably sized sample of graves to record. The number of Protestant graves in
the data set was about 10%, but the time range was not evenly spread, meaning very
few were available to compare in each decade.

41
Chapter 5: RESULTS
Analysis of the graves was considered in the following manner:
The Irish buried in the four Catholic cemeteries were compared to ascertain if
any regional variations in grave elements existed between different Irish
communities.
Irish Catholic and Irish Protestant burials were compared to determine the
effect that religion had on burial symbolism.
Irish (Catholic and Protestant combined) were compared to non-Irish
Catholic burials, to identify qualities related to Irish identity
The results were firstly analysed together across all time periods to determine overall
similarities and differences between the three categories. Secondly, the data were
analysed by decade to ascertain variation across time for the motifs (both on
headstones and fences), inscriptions and headstones (form and material) in order to
explore whether signifiers of Irish identity existed and changed over time. As most
of the decadal totals were fewer than five, descriptive statistics were used because
the number was too low to test for statistical significance. Of the chi-square tests,
only the statistically significant results are discussed here; for a complete list of all
chi square results, see Appendix 10.
Grave Orientation
Interments in St John’s and Mintaro were oriented northeast and southwest, while
Navan and Christchurch had graves oriented east and west. Four cemeteries (St
John’s, Mintaro, Navan and Christchurch) had graves in parallel rows with their
headstones back-to-back. Saddleworth had graves facing in one direction (east) and
Undalya had all but three graves facing southwest. St John’s contained one anomaly
which was the grave of a seven year old named Caroline Meigs that was oriented
perpendicular to all others in the cemetery, facing approximately east.
In terms of grave orientation as defined by cardinal direction, according to Mytum
(2000:46) the traditional orientation of Christian headstones is to face east so that
when the dead rose on ‘Judgment Day they would be facing the sunrise’ (Riordan
1997:30). As noted by Riordan (1997), grave diggers probably used the direction in
which the sun rose for orientation. However, this solar orientation varied, being

42
dependent on the time of year and the latitude of the cemetery (Riordan 1997:30),
rather than being true east or west.
The range of orientation for graves within mid-north cemeteries suggested that the
traditional orientation was not adhered to with any diligence and, according to
Mytum (2001:36), new cemeteries in grid formation, with paths between rows,
developed in the nineteenth century throughout Europe, North America and Britain.
Catholic burial grounds within Ireland were developing in the same manner and this
approach was adopted in the establishment of cemeteries in South Australia.
Counties
At least 12 counties were represented in the data set (Table 5.1), though about 26.5%
of the recorded graves could not be assigned to a specific county. The majority of
people were from County Clare, although a large number from County Cavan were
buried at the Mintaro Catholic Cemetery (35.8% or n=13), probably due to the Brady
brothers’ influence, as discussed in Chapter 3. The number of Irish burials was quite
consistent between 1860 and 1899, but with a spike of about 25% through the 1870s
(Table 3.2). One other county with a significant percentage of graves was County
Derry, accounting for 66.7% of burials in the Saddleworth Anglican cemetery. This,
however, represented only four grave markers from a total of six.
People whose archival records merely stated ‘Ireland’ as their origin were most
numerous in St John’s cemetery (6.5% of all Irish immigrants). Two other
cemeteries had people of generic Irish backgrounds. The number of people (18.4%
over the six cemeteries) whose names were likely to be of Irish origin (Irish
Valuation Office 1847) did not allow for a definitive analysis of the counties
represented. The individual cemeteries showing the highest percentages of likely
Irish names were Navan and Christchurch, with 35.3% (n=5) and 44.4% (n=4)
respectively.

43
Birth origins 1850s 1860s 1870s 1880s 1890s
Armagh - - - - 2
Cavan - 5 6 6 3
Clare - 6 17 12 19
Cork 2 - 3 - -
Derry - - 1 - 3
Galway - - 2 - 3
Kerry - 1 - - 1
Kilkenny - 3 1 1 -
Limerick - - 1 1 -
Meath - - - 1 -
Monaghan - - 1 - -
Tipperary - 6 2 3 1
Tyrone - - 1 2 1
Westmeath - 1 2 2 -
Wexford - 1 - 1 -
Wicklow - 3 - 1 -
Ireland - 7 4 2 3
Ireland (uncertain) 1 12 12 6 7
Sub-total (Irish) 3 45 53 38 41
Non-Irish/unknown - 7 - 7 4
Table 5.1: Counties represented in graves recorded for each decade.
Family vs individual burial
The influence of family was considered in terms of the proximity of family members
to each other, that is whether people were buried singly or in family groupings
(Table 5.2).
Mintaro Navan St Johns Undalya Christchurch Saddleworth
Irish
Non-
Irish Irish Irish
Non-
Irish Irish
Non-
Irish Irish Irish
Single burial
(individual) 6 1 1 24 5 4 0 2 0
One headstone
(multiple
burials) 18 2 12 40 5 6 2 4 0
Multiple
headstones
(single plot) 7 0 1 16 2 1 0 1 1
Multiple plots
in proximity 0 0 1 4 0 2 0 0 0
Table 5.2: Distribution of family vs individual burials (number).

44
Irish (% of
total)
Non-Irish (% of
total)
Single burial
(individual) 24.5 (22.2) 33.3 (3.6)
One headstone
(multiple
burials) 52.9 (47.6) 50 (5.4)
Multiple
headstones
(single plot) 17.9 (15.5) 16.7 (1.2)
Multiple plots in
proximity 4.6 (4.2) 0.0 (0.0)
Table 5.3: Percentage of burial type for Irish and non-Irish burials.
Three different groupings were noted: a single headstone with multiple entries
(47.6% of Irish vs 5.4% non-Irish burials), multiple headstones in a single plot (5.5%
of Irish vs 1.2% non-Irish burials) and multiple single graves in close proximity
(4.7% of Irish vs 0% non-Irish burials). Each type of family grouping was counted as
a single unit.
Irish Catholic
Figure 5.1 shows the frequency of single burials compared to family burials across
all time periods in the Catholic cemeteries, with each having a very high frequency
of families buried together (ranging from 69.2% at Undalya to 93.3% at Navan).
0.0
10.0
20.0
30.0
40.0
50.0
60.0
70.0
80.0
90.0
100.0
Mintaro Navan St Johns Undalya
Per
cen
tag
e
Figure 5.1: Percentage variation of individual and family
burials among Irish Catholics.
(All forms of family burial combined)
Individual burials Family groupings, combined

45
Family groupings showed a distinct preference for multiple burials with a single
headstone, ranging from 46.2% at Undalya to 80% at Navan. The use of multiple
headstones in one plot was more prevalent at Mintaro (22.6%) and St John’s (19%),
while Undalya was the only Catholic cemetery to show a preference for multiple
burials in close proximity. (Figure 5.2).
Irish Protestant
Irish Protestant graves showed a similar rate of family burials, with multiple
interments (both single headstones and multiple headstones) being preferred
(Figure 5.3).
0.0
10.0
20.0
30.0
40.0
50.0
60.0
70.0
80.0
90.0
Mintaro Navan St Johns Undalya
Per
cen
tag
e
Figure 5.2: Relative frequencies of burials types for
Irish Catholics.
Individual burials One headstone Multiple headstones Multiple burials
0.0
20.0
40.0
60.0
80.0
100.0
120.0
Christchurch Saddleworth
Per
cen
tag
e
Figure 5.3: Percentage of individual and family burials among
Irish Protestants.
Single Family

46
Irish - Catholic vs Protestant
Despite a perceived preference for family burials in the descriptive statistics, chi-
square analysis (Table 10.1) showed no statistically significant differences between
individual or family burials amongst Catholic and Protestant Irish. As found by
Mytum (2001), family grouping was a common practice in burial grounds from
medieval times for all religious groups. Originally, family vaults were constructed
only for high status families, but the tradition subsequently developed among the less
affluent, including both Catholics and Protestants, with this method of burial
recorded in Scotland, and northern and southern Ireland (Mytum 2001:31-32).
Irish vs Non-Irish
Comparing Irish and non-Irish burials found minimal differences between individual
and family burial (Figure 5.4), but did suggest an Irish preference for family burial.
However, this did not prove to be statistically significant (Table 10.2).
Headstone Form
Tables 5.4 and 5.5 and Figure 5.5 illustrate the various headstone forms. Tablets
constituted over 50% of all headstones across all cemeteries. The cross was the
second most common form, being most prevalent in the Catholic cemeteries,
especially St John’s (32.4%) and Navan (29.4%), while Saddleworth had no cross
markers. Celtic crosses were few in number, but occurred in all cemeteries except
Saddleworth. Slabs and tombs appeared in four cemeteries, but in low numbers;
0.0
10.0
20.0
30.0
40.0
50.0
60.0
70.0
80.0
Individual burials Family groupings, combined
Per
cen
tag
e
Figure 5.4: Frequency of individual vs family burial
when comparing Irish to non-Irish burials.
Irish Non-Irish

47
Mintaro had the highest frequency. Monuments/obelisks were only recorded at St
John’s.
Irish Catholic
Mintaro Navan St Johns Undalya Total
Celtic Cross 2 1 7 0 10
Cross 7 5 25 3 40
Tablet 24 11 56 9 100
Slab/tomb 8 0 1 4 13
Monument/
obelisk 0 0 8 0 8
Chapel 0 1 0 0 1
Total 41 18 97 16 172
Table 5.4: Numbers of headstone forms for Irish Catholic burials.
Irish Catholic headstones showed a similar pattern: tablets followed by crosses were
the most frequent form in all four cemeteries. As noted by Tarlow (1999:69), tablets
were reminiscent of bedheads, thus conjuring the idea of sleep as a euphemism for
death, while crosses, similar to crucifixes, were symbolic of the Christian faith and
particularly Catholicism, an association found by Smith (2001:706) to have been
prevalent in nineteenth century New England, an area with a large Irish immigrant
population.
Slabs/tombs and Celtic crosses were found in three cemeteries, while
monuments/obelisks were in only one cemetery (Table 5.4).
0.0
10.0
20.0
30.0
40.0
50.0
60.0
Mintaro Navan St John's Undalya
Per
cen
tag
e o
f fo
rms
Figure 5.5: Percentage of headstone forms for Irish
Catholics.
Celtic cross Cross Tablet Slab/tomb Monument

48
Irish Protestant
Christchurch Saddleworth Total
Celtic Cross 1 0 1
Cross 2 0 1
Tablet 6 6 13
Slab/tomb 0 1 1
Total 9 7 16
Table 5.5: Numbers of headstone forms for Irish Protestant burials.
Irish – Catholic vs Protestant
Protestant cemeteries had the highest proportion of tablets (75%) (Figure 5.7),
though tablets on Irish Catholic graves constituted the greater number of the 172
grave markers (Table 5.4). Crosses, however, were more common on Catholic
examples. Celtic crosses occurred in similar proportions, as did slabs/tombs (Figure
5.7), with the former only in Christchurch and the latter only in Saddleworth of the
Protestant cemeteries (Figure 5.6).
0.0
10.0
20.0
30.0
40.0
50.0
60.0
70.0
80.0
90.0
Christchurch Saddleworth
Per
cen
tag
e o
f fo
rms
Figure 5.6: Percentage of headstone forms for Irish
Protestants.
Celtic cross Cross Tablet Slab

49
As the two most frequent headstone forms, tablets and crosses were tested for
significance, as were both forms of crosses. Neither combination showed a
statistically significant difference between Catholic and Protestant Irish groups
(Tables 10.3 and 10.4).
Irish vs Non-Irish
Irish Non-Irish/Unknown Total
Celtic Cross 11 1 12
Cross 50 9 59
Tablet 105 7 112
Slab/tomb 12 1 13
Monument/obelisk 8 0 8
Total 186 18 204
Table 5.6: Variation of headstone styles: Irish and non-Irish.
Celtic crosses were only found on Irish graves, with one possible exception; this
was, however, on a grave of uncertain lineage (Table 5.6). Tablets were the
dominant form of memorialisation on Irish graves, while crosses were the most
common form on non-Irish graves. Slabs/tombs were also found in similar
percentages in both groups, and monuments/obelisks were only found on Irish
graves (Figure 5.8).
0.0
10.0
20.0
30.0
40.0
50.0
60.0
70.0
80.0
Celtic cross Cross Tablet Slab/tomb Monument Chapel
Per
cen
tag
e o
f fo
rms
Figure 5.7: Percentage comparison of Irish Catholic and
Protestant headstone forms.
Irish Catholic Irish Protestant

50
Chi-square analysis (Tables 10.5 & 10.6) showed no statistically significant
differences in these choices between Irish and non-Irish groups.
When considered across time, however, descriptive statistics for the use of the three
most frequently used headstone types suggest differing trends in their use by the
three groups.
0.0
10.0
20.0
30.0
40.0
50.0
60.0
70.0
Celtic Cross Cross Tablet Slab/tomb Monument
Per
cen
tag
e
Figure 5.8: Percentage distribution of Irish and non-Irish
headstone forms.
Irish Non-Irish/Unknown
0
2
4
6
8
10
12
14
16
18
1850s 1860s 1870s 1880s 1890s
Nu
mb
er o
f cr
oss
es
Figure 5.9: The use of plain crosses as a headstone feature
across the span of the study.
Irish Catholic Irish Protestant Non-Irish

51
The use of cross headstones was relatively constant by the Protestants and much
lower than amongst Irish Catholics, whose graves, on the other hand, showed a
marked increase in the use of crosses in the 1870s, followed by a decline and then a
second peak in the 1890s (Figure 5.10). In contrast, the peak in crosses amongst non-
Irish occurred in the 1860s, with a second peak in the 1880s (coinciding with a
smaller peak amongst Protestant Irish), at the same time that its use fell amongst
Irish Catholics.
The Irish Catholics showed an increase in the use of tablets from the 1850s through
to the 1870s that then declined (Figure 5.11). In contrast Irish Protestant use of
tablets peaked only in the 1870s and 1890s.
Both Celtic crosses and slab/tomb markers were more popular on Irish Catholic
graves, with only one slab and one Celtic cross occurring on a Protestant grave. The
0
10
20
30
40
50
60
70
80
90
100
1850s 1860s 1870s 1880s 1890s
Per
centa
ge
Figure 5.10: The percentage of plain crosses as a
headstone form across the time span of the study.
Irish Catholic Irish Protestant Non-Irish
05
10152025303540
1850s 1860s 1870s 1880s 1890s
Nu
mb
er o
f ta
ble
ts
Figure 5.11: The use of tablet form as a headstone across
the span of the study.
Irish Catholic Irish Protestant Non-Irish

52
use of Celtic crosses on Catholic graves occurred at a consistent rate (Figure 5.12),
while slabs/tombs were most popular in the 1860s (a total of eight); no examples
were found in either the 1850s or 1880s (Figure 5.13).
Headstone Material
Headstones consisted of five materials: marble, slate, cement, sandstone and cast
iron, with marble by far the most common across all cemeteries. These results were
consistent with those of Muller’s study (2015) at West Terrace Cemetery in
Adelaide, where it was also found that slate was the dominant material in earlier (pre
1870) headstones. Marble constituted 89.2% of St John’s memorials (the highest
0
0.5
1
1.5
2
2.5
3
3.5
1850s 1860s 1870s 1880s 1890s
Nu
mb
ers
Figure 5.12: Celtic cross forms. (NB Irish Protestant and non-Irish
have the same number of Celtic cross markers in the same
decades, so only one line is apparent)
Irish Catholic Irish Protestant Non-Irish
0
1
2
3
4
5
6
7
8
9
1850s 1860s 1870s 1880s 1890s
Nu
mb
ers
Figure 5.13: Slab/tomb grave marker forms.
Irish Catholic Irish Protestant Non-Irish
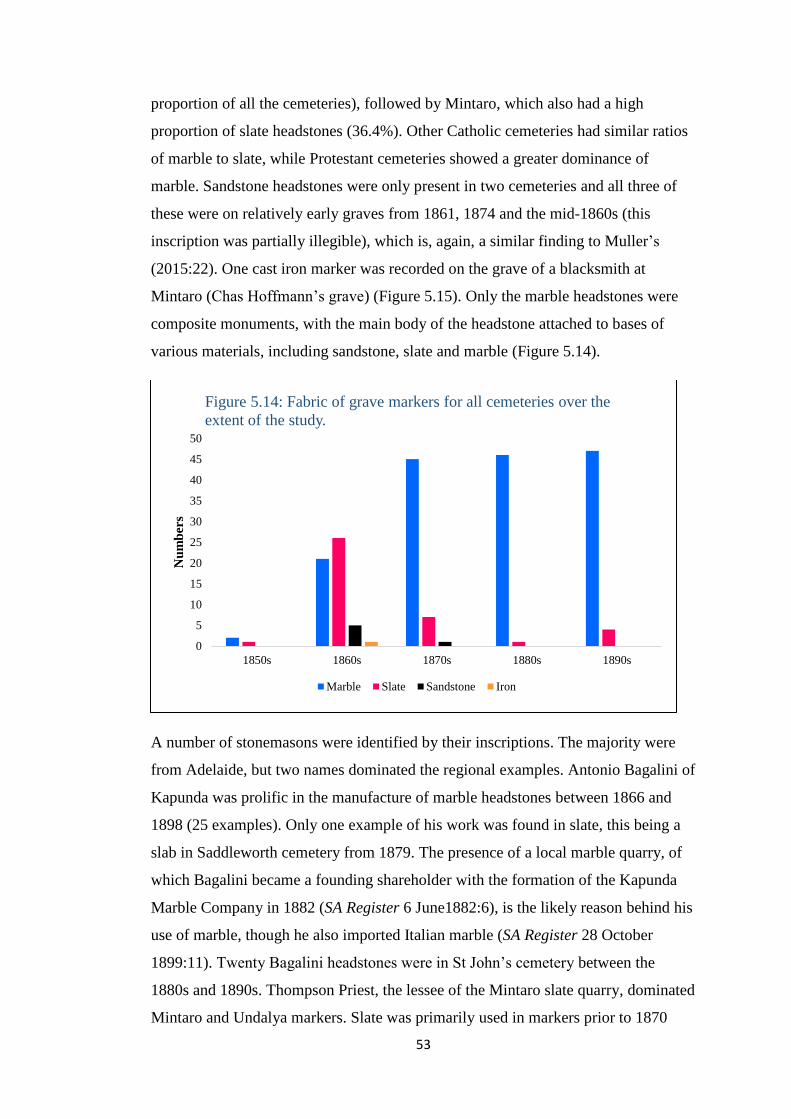
53
proportion of all the cemeteries), followed by Mintaro, which also had a high
proportion of slate headstones (36.4%). Other Catholic cemeteries had similar ratios
of marble to slate, while Protestant cemeteries showed a greater dominance of
marble. Sandstone headstones were only present in two cemeteries and all three of
these were on relatively early graves from 1861, 1874 and the mid-1860s (this
inscription was partially illegible), which is, again, a similar finding to Muller’s
(2015:22). One cast iron marker was recorded on the grave of a blacksmith at
Mintaro (Chas Hoffmann’s grave) (Figure 5.15). Only the marble headstones were
composite monuments, with the main body of the headstone attached to bases of
various materials, including sandstone, slate and marble (Figure 5.14).
A number of stonemasons were identified by their inscriptions. The majority were
from Adelaide, but two names dominated the regional examples. Antonio Bagalini of
Kapunda was prolific in the manufacture of marble headstones between 1866 and
1898 (25 examples). Only one example of his work was found in slate, this being a
slab in Saddleworth cemetery from 1879. The presence of a local marble quarry, of
which Bagalini became a founding shareholder with the formation of the Kapunda
Marble Company in 1882 (SA Register 6 June1882:6), is the likely reason behind his
use of marble, though he also imported Italian marble (SA Register 28 October
1899:11). Twenty Bagalini headstones were in St John’s cemetery between the
1880s and 1890s. Thompson Priest, the lessee of the Mintaro slate quarry, dominated
Mintaro and Undalya markers. Slate was primarily used in markers prior to 1870
0
5
10
15
20
25
30
35
40
45
50
1850s 1860s 1870s 1880s 1890s
Nu
mb
ers
Figure 5.14: Fabric of grave markers for all cemeteries over the
extent of the study.
Marble Slate Sandstone Iron

54
with sixteen of the 39 markers in Mintaro manufactured by Priest, all but one of
which was slate; the lone marble instance of his work was a headstone attached to
two slate tombs (made by Priest) for Patrick Weathers and his daughter, Catherine.
Undalya had four slate markers by Priest, with six other marble markers by Adelaide
stonemasons. The other three cemeteries contained few named stonemasons, though
Bagalini had examples of his work in each. Over time, common shapes appeared,
suggesting that selection from mass-produced products became increasingly
common after the mid-1860s. Examples of the same shapes and motifs were found at
Undalya on the graves of Richard Morrissey (1866) and Mary Kelen (1866), (both
slate). Numerous examples of a common marble headstone form also occurred, but
with different motif engravings. Different stonemasons’ marks were found on these,
suggesting the engraving was their work rather than the headstone itself. These were
particularly evident at St John’s.
Choice in headstone material is indicative of the materials available within each
district: marble was most common in the Kapunda area where a quarry existed from
the 1870s, while the northern cemeteries of Mintaro and Undalya had a
predominance of slate memorials, being near the slate quarry, though slate and
marble occurred in all cemeteries. One grave at St John’s and two at Navan
contained sandstone headstones, and one cast iron cross was recorded at Mintaro.
Muller (2006) found slate to be a dominant material for headstones in the 1860s at
West Terrace cemetery, Adelaide, with a marked decline in the 1870s, a trend also
apparent in the mid-north cemeteries. Marble comprised 78.9% of the headstones in
the mid-north, compared to the 77% found by Muller, suggesting that availability of
material was a factor, as it was quarried at a number of sites within ready proximity
to both areas. Furthermore, the cost of marble was relatively cheap compared to slate
(Muller 2006:57-59). However, marble had been imported from the 1850s
(McDougall and Vines 2004:9), which suggests its use had other significance and
was probably linked to broader trends. Brennan (2011:109) found a preference in the
use of marble from 1800 in Rhode Island (US) cemeteries, while Francavaglia
(1971:504-507) found in Oregon that marble, in various headstone forms, was also
the fabric of choice from the 1840s to 1900, linked to a fondness for imitating
classical creations from past eras.

55
Figure 5.15: Charles Hoffmann’s cast iron grave marker,
1866, Mintaro cemetery. (Photo: J McEgan)

56
Motifs
A total of 46 different motifs were recorded, and categorised into seven groups since
a number of symbols have similar meanings: affection, grief, religious, Irish
symbols, no motif, non-specific and organisations (refer to Appendix 9 for
definitions).
Motifs of affection were most common, occurring on 21.3% of headstones, while
15.6% of headstones had no motifs (Table 5.7). Known symbols of Irish culture
were few, and were restricted to Celtic crosses, shamrocks and scrolls resembling
triskeles.
Motif category Total percentage
Affection 21.3
Grief 3.9
Religious 52.1
Irish symbols 3.5
No motif 15.6
Non specific 3.2
Organisation 0.4
Table 5.7: Overall percentage of each motif category across all burials.
In terms of variation between cemeteries, religious motifs were most common in all
cemeteries (ranging from 41.4% at Navan to 61.5% at Undalya), except Christchurch
Anglican which was dominated by graves with no motifs – a typical stylistic choice
for Protestant non-conformist burials. Saddleworth, however, which was also an
Anglican cemetery, had a similarly high proportion of religious motifs (50%) to the
Catholic cemeteries (Figure 5.16).
Mintaro Navan
St
John's Undalya Christchurch Saddleworth
Affection 11 6 40 1 2 0
Grief 3 0 3 1 1 3
Religious 33 12 81 16 1 4
Irish symbols 0 3 5 2 0 0
No motif 8 5 21 4 5 1
Non specific 0 3 4 2 0 0
Organisation 0 0 0 0 1 0
Total 55 29 154 26 10 8
Table 5.8: Numbers of motifs in all cemeteries.

57
Irish Catholic
Motifs of affection were more common on Irish Catholic headstones. Hope,
immortality, innocence and remembrance were the most frequent at Mintaro, Navan
and St John’s, while Mintaro had the only examples of mourning symbols (21.4% of
its total emotive motifs). Undalya had 100% of emotive motifs relating to
immortality on its Irish headstones (Figure 5.17).
0.0
10.0
20.0
30.0
40.0
50.0
60.0
70.0
Mintaro Navan St John's Undalya Christchurch Saddleworth
Per
cen
tag
e
Figure 5.16: Percentage of motif categories in all cemeteries.
Affection Grief Religious Irish symbols No motif Non specific Organisation
0.0
20.0
40.0
60.0
80.0
100.0
120.0
Per
cen
tag
e
Figure 5.17: Percentage of emotive symbols on Irish Catholic
headstones.
Mintaro Navan St John's Undalya

58
Symbols representing Christ (ranging from 15.9% at St John’s to 37.5% at Undalya)
and crosses (56.3% at Undalya to 65.5% at Mintaro) occurred in all four Catholic
cemeteries. St John’s had three symbols associated with Mass (a chalice, rosary
beads and a communion stole - a total of 4.9% of its religious motifs), and Navan
had examples of a chalice and communion stole (16.7%) (Figure 5.18).
Non-specific motifs occurred in three cemeteries – Navan, St Johns and Undalya
(Table 5.9).
Navan St John's Undalya
Foliage 3 4 1
Tulips 0 0 1
Waves 0 1 0
Table 5.9: Non-specific headstone motifs.
Irish symbols were found in Navan, which had one Celtic cross, one triskele (scroll)
and a geometric design similar to examples found at Newgrange, Co. Meath, while
St John’s (two crosses and three shamrocks – the highest number) and Undalya had
one Celtic cross and one shamrock (Figure 5.19).
0.0
10.0
20.0
30.0
40.0
50.0
60.0
70.0
80.0
90.0
100.0
Angel Cherub Christ Cross Crucifix God Holy
Spirit
Holy
Trinity
New life Mass
Per
cen
tag
e
Figure 5.18: Percentage of Irish Catholic religious motifs.
Mintaro Navan St John's Undalya

59
Headstones without motifs occurred at a low rate in all four Catholic cemeteries,
ranging from 13.6% at St John’s to 17.2% at Navan (Figure 5.20).
Irish Protestant
Irish Protestant headstones typically had few motifs. Emotive symbols were most
frequent in the 1870s. Religious motifs were more common at Saddleworth, while a
lack of motifs was more prevalent at Christchurch. The only symbol representative
of an organisation/occupation in the study was at Christchurch cemetery, being a
three-chain link, depicting an Independent Order of Oddfellows (IOOF) symbol
(Table 5.10).
Christchurch Saddleworth
Emotive 3 8
Religious 1 4
No motif 5 1
Non specific 0 0
Organisation 1 0
Total 10 13
Table 5.10: Numbers of motifs for all categories on Irish Protestant graves.
0
0.5
1
1.5
2
2.5
3
3.5
Navan St John's Undalya
Nu
mb
er
Figure 5.19: Number of Irish motifs.
Celtic cross Scrolls Shamrocks
0.0
2.0
4.0
6.0
8.0
10.0
12.0
14.0
16.0
18.0
20.0
Mintaro Navan St John's Undalya
Per
cen
tag
e
Figure 5.20: Percentage of Irish Catholic headstones
with no motifs.

60
Irish – Catholic vs Protestant
Only some symbol categories could be statistically analysed because of sample size.
Chi square analysis of the use of emotive symbols between the two Irish groups
proved to be statistically significant in favour of the Catholics, indicating a
dependence on religion rather than country of origin (Table 10.7). The use of
religious motifs by Irish Catholics was also statistically significant, compared to a
lack of motifs (Table 10.8).
Irish vs non-Irish
The use of emotive symbols on Irish headstones increased appreciably from the
1860s (Figure 5.21), even though Irish grave numbers remained stable through that
decade and into the 1870s (Table 3.8). The non-Irish use of emotive symbols (Figure
5.28) was very low compared to the number of deaths recorded (Table 5.11).
1850s 1860s 1870s 1880s 1890s
Non-Irish deaths recorded 0 7 1 7 4
Table 5.11: Number of non-Irish deaths recorded in study.
Religious motifs’ usage declined on Irish headstones after the 1860s, with a small
increase of these motifs on non-Irish graves occurring in the study’s last two decades
(Figure 5.22).
0
5
10
15
20
25
30
35
1850s 1860s 1870s 1880s 1890s
Nu
mb
er o
f m
oti
fs
Figure 5.21: Comparison of the use of emotive motifs on
Irish and non-Irish headstones over time.
Irish Non-Irish

61
The number of Irish graves without motifs rose steadily from the 1850s through to
the 1870s. However, a marked decline occurred in the 1880s before a further
increase in the 1890s. Conversely, a lack of motifs on non-Irish headstones increased
in the 1880s, with a decline in the 1890s (Figure 5.23).
Fences/borders
Four types of borders were identified. As there was only one example of a chapel
being incorporated into the surround for a grave, it was not afforded a separate
category. Most prolific was cast iron fencing which occurred in all cemeteries, with
107 of the 165 plots having some form of cast iron surround (Figure 5.24).
0
10
20
30
40
50
60
1850s 1860s 1870s 1880s 1890s
Nu
mb
ers
of
mo
tifs
Figure 5.22: Comparison of the use of religious motifs on
Irish and non-Irish headstones over time.
Irish Non-Irish
0
10
20
30
40
50
60
70
80
90
1850s 1860s 1870s 1880s 1890s
Per
centa
ge
Figure 5.23: Comparison of the use of no motifs on Irish
and non-Irish headstones over time.
Irish Non-Irish

62
Two manufacturers of cast iron fencing were recorded: Mellor and Stewart &
Harley, both of Adelaide (Figure 5.25). In Britain, cast iron fencing, both pickets and
railings, originally enclosed family plots containing large monuments and was more
common amongst affluent families during the nineteenth century (Mytum 2001:35).
With the development of techniques (Linden-Ward 1990:39), fencing became more
affordable, allowing poorer families to use this method.
Figure 5.25: Fencing manufacturers’ labels.
(Photos by J McEgan & M McEgan)
Two examples of a clay tile border were found: one with the stamped maker’s name
of J. C. Koster in Christchurch cemetery, where it was incorporated beneath a cast
iron fence (Figure 5.26), and another at St John’s without a maker’s mark.
0
10
20
30
40
50
60
Cast iron picket Railing Kerb None
Nu
mb
ers
Fence categories
Figure 5.24: Fence categories across all cemeteries.
Mintaro Navan St John's Undalya Christchurch Saddleworth

63
Figure 5.26: Clay tile from grave border at Christchurch cemetery.
(Photo by M McEgan)
Having no border on graves was very common (occurring in 27% of all graves). St
John’s had the greatest percentage of borderless graves, constituting 28.1% of its
recorded plots. Kerbs were few in number with only thirteen being recorded, none of
which were in Protestant cemeteries (Figure 5.27).
Figure 5.27 indicates the prevalence of cast iron fencing in all cemeteries. In terms of
the motifs used on fence pickets, the Fleur de Lys appeared in two cemeteries. The
Celtic cross spearhead had equal representation at Navan and Christchurch, while a
shamrock occurred in four cemeteries (St John’s 20.6%, Navan 11.8%, Mintaro
17.6% and Christchurch 12.5%). St John’s had the widest range of motifs (n=6).
0.0
20.0
40.0
60.0
80.0
100.0
120.0
Per
cen
tag
e
Figure 5.27: Percentage of fence forms across all cemeteries.
Mintaro Navan St John's Undalya Christchurch Saddleworth

64
Irish Catholic
The cast iron picket fence with an arrowhead was most common at Mintaro (15
examples) and St John’s (28). The shamrock spearhead was used in three cemeteries
(Mintaro, Navan and St John’s). Six graves at Navan and Undalya and twenty-three
graves at St John’s had no defined border. Cast iron railings were at all cemeteries
but in low numbers, as was kerbing (made of stone or concrete) (Figure 5.28).
Irish Protestant
Five forms of grave surrounds – i.e. cast iron picket (three forms), cast iron railing or
no border – were found in the two Protestant cemeteries. Arrowhead designs were
the most numerous at Christchurch (n=3), with one at Saddleworth. One example of
the other designs occurred at Christchurch (Figure 5.29).
0
5
10
15
20
25
30
Nu
mb
ers
Figure 5.28: All forms of fencing choices on Irish Catholic
graves.
Mintaro Navan St John's Undalya
0
0.5
1
1.5
2
2.5
3
3.5
Arrowhead Celtic Cross Shamrock Railing None
Nu
mb
ers
Figure 5.29: Fencing designs of Irish Protestant graves.
Christchurch Saddleworth

65
Irish – Catholic vs Protestant
No statistically significant differences in the choice of picket versus railing
surrounds were indicated (Table 10.11) between the Irish religious populations, and
similarly, between pickets and no border (Table 10.13) and a kerb border and no
border (Table 10.14).
However, Celtic cross and shamrock spearheads used by Irish Catholics were
statistically significant (Table 10.12).
Irish vs Non-Irish
In Britain, kerbing around graves has been recorded from the 1830s, and grew in
popularity over the nineteenth century (Mytum 2001: 36). A similar trend is
indicated by the Irish graves in this study, with a steady increase in the 1870s to the
1890s, while non-Irish plots had just one example in the 1880s. However, no
statistically significant differences were indicated (Table 10.15) in the choice of a
kerb surround versus no border, or a Celtic cross and shamrock spearheads between
Irish and non-Irish graves (Table 10.16).
Inscriptions
Introductory inscriptions
Figure 5.31 illustrates the variety of introductory inscriptions. Memory (ranging
from 72.2% at Undalya to 100% at both Christchurch and Saddleworth) and
affection (11.8% at Navan to 27.8% at Undalya) in the emotive category and
association with the deceased in the biographical category, were the most frequent,
while religious phrases were more common at St. John’s. ‘Pray for the soul/repose of
0
1
2
3
4
5
6
7
1850s 1860s 1870s 1880s 1890s
Nu
mb
ers
Figure 5.30: Use of kerbing around burial plots of
Irish and non-Irish.
Irish Non-Irish

66
the soul’ and ‘Gloria in Excelsis Deo’ accounted for 33.3% and 44.4% respectively
of the religious phrases at St John’s, which also had the only sad introductory
inscription (Figure 5.31).
Epitaphs
In terms of the epitaph, words of affection were the most common, with all of the
epitaphs in Saddleworth and 72.2% of those in Navan expressing some words of
affection. In the biographical category, association with the deceased was most
common, with 83 examples at St John’s. The word ‘died’ was the most prevalent
term for the passing of the deceased (n=100 at Saddleworth). ‘Departed from this
life’ was the most frequent euphemism in the other five cemeteries. Cause of death
was only found on three headstones (all at St John’s), one of which was for a family
of seven who perished in a bushfire. Religious verses or phrases occurred at all
cemeteries with St John’s having the highest number (n=36). ‘Amen’ was the most
commonly used religious word (Figure 5.32).
Four cases of unnamed burials occurred, with three at St John’s of children who died
in infancy, and one at Undalya that was simply inscribed as ‘my dear mother’
without any further personal information. Dates for death, birth or age at death
occurred a total of 640 times for the 350 burials recorded.
0
10
20
30
40
50
60
70
80
90
Mintaro Navan St Johns Undalya Christchurch Saddleworth
Nu
mb
ers
Figure 5.31: Introductory inscription categories across all
cemeteries.
Memory Affection Sadness Association Home Religious Miscellaneous

67
Irish Catholic
Introductory inscriptions
Words relating to memory occurred most frequently in Irish Catholic inscriptions,
ranging from 77.2% at Undalya to 88.2% at Navan. Affection was most prevalent at
Mintaro (90.2%). The use of poetic verse was a rare occurrence and was only found
at Mintaro and St John’s (Figure 5.33).
0
20
40
60
80
100
120
140
160
Mintaro Navan St Johns Undalya Christchurch Saddleworth
Nu
mb
ers
Figure 5.32: Inscription categories of epitaphs for all cemeteries.
Memory Affection Sadness Verse
Association Home Occupation Cause of death
Died Euphemism for death Religious Unnamed

68
Biographical data found in Irish Catholic introductory inscriptions was that of
association with the deceased person via the words ‘erected by’ and a description of
the relationship, occurring in all Catholic cemeteries. Mintaro had the only
headstones that did not include a date of death in the inscription (n=8). Occupations
were rarely included (2.5%), being only ‘M.D.’ and ‘Revd’ at St John’s and ‘Capt’ at
Undalya. Mention of country of birth, county of birth, residence or time in Australia
were grouped under the ‘Home’ category and were similarly rare, occurring only
once at St John’s (Figure 5.34).
0.0
10.0
20.0
30.0
40.0
50.0
60.0
70.0
80.0
90.0
100.0
Intro Epitaph Intro Epitaph Intro Epitaph Intro Epitaph
Mintaro Navan St Johns Undalya
Per
cen
tag
e
Figure 5.33: Emotive language on Irish Catholic headstones.
Memory Affection Sadness Verse
0
50
100
150
200
250
300
350
Intro Epitaph Intro Epitaph Intro Epitaph Intro Epitaph
Mintaro Navan St Johns Undalya
Nu
mb
ers
Figure 5.34: Inclusion of biographical information on Irish
Catholic headstones.
Name Dates Association Home Occupation Cause of death

69
Religious phrases were not used in introductions at Mintaro, but were particularly
numerous at St John’s (n=32), and were the only religious wording used at Navan
and Undalya.
Epitaphs
It is noted by Griffin and Tobin (1982: 54) that a significant part of social history is
written in gravestone inscriptions, allowing a means of determining aspects of life
such as settlement, marriage or migration. Furthermore, religious text is often found
with biographical information, as confirmed in the study.
Religious phrases dominated the epitaphs at St John’s (59%) and Undalya (57%),
while single words, such as ‘Amen’ and ‘Pray’ were more common at Navan (60%).
Religious verses were most common at Mintaro (57%) (Figure 5.35).
Euphemisms for death were unusual on Irish Catholic headstones, with ‘died’ being
the most common term (ranging from 13 [65%] at Undalya to 29 [90.5%] at Navan).
‘Departed this life’ was the only euphemism used at three of the cemeteries and
Undalya contained the only example of ‘sleep’ (Table 5.12).
Mintaro Navan St Johns Undalya
Died 62 29 123 13
Departed this life 7 3 22 6
Sleep 1
Total 69 32 145 20
Table 5.12: Euphemisms for death on Irish Catholic headstones.
0
20
40
60
80
100
120
Intro Epitaph Intro Epitaph Intro Epitaph Intro Epitaph
Mintaro Navan St Johns Undalya
Per
cen
tag
e
Figure 5.35: Religious wording on Irish Catholic headstones.
Quote Verse Phrase Word

70
Irish Protestant
Introductory inscriptions
Memory was the most common wording in Irish Protestant introductory inscriptions,
occurring on seven of the nine graves at Christchurch and on all six headstones at
Saddleworth. Memory, however, only occurred in Christchurch epitaphs once, with
words of affection being more common (n=4 at Christchurch and n=5 at
Saddleworth). A verse appeared once at Christchurch (Figure 5.36).
Epitaphs
Biographical information was restricted to name, dates (age or date of death of each
interred person) and association with the deceased (five examples) at Saddleworth.
Christchurch headstones had 27 instances of names, 18 death dates and nine
examples of age at death. Mention of ‘home’ appeared twice at Christchurch, with
one example of connection to an organisation (the IOOF) (Figure 5.37).
0
1
2
3
4
5
6
7
8
Intro Epitaph Intro Epitaph
Christchurch Saddleworth
Nu
mb
ers
Figure 5.36: Emotive inscriptions on Irish Protestant headstones.
Memory Affection Sadness Verse

71
As with the Irish Catholic headstones, use of the word ‘died’ was preferred in Irish
Protestant cemeteries. ‘Departed this life’, ‘passed’ and ‘sleep’ were only used at
Christchurch (Figure 5.38).
Religious wording (particularly phrases) occurred in the epitaphs at Christchurch
(n=2) and Saddleworth (n=4)). The use of verse and a biblical quote appeared once
each at Christchurch, and three times at Saddleworth (Figure 5.39).
0
5
10
15
20
25
30
Intro Epitaph Intro Epitaph
Christchurch Saddleworth
Nu
mb
ers
Figure 5.37: Biographical information on Irish Protestant
headstones.
Name Dates Association Home Organisation Cause of death
0
2
4
6
8
10
12
Epitaph Intro Epitaph
Christchurch Saddleworth
Nu
mb
ers
Figure 5.38: Death euphemisms on Irish Protestant
headstones.
Died Departed this life Sleep Passed away/from us

72
Irish – Catholic vs Protestant
There were no statistically significant differences in the choice of emotive words in
either introductory or epitaph inscriptions (Table 10.17) between Irish religious
populations.
Mytum (2001:35) noted that recording one’s place of residence became an accepted
tradition on headstones in nineteenth century Ireland, but this was not statistically
significant in the mid-north (Tables 10.18 and 10.19).
A significant difference in the use of religious wording by Catholics compared to
biblical quotes by Protestants, however, was indicated (Table 10.23).
Irish vs Non-Irish
Irish headstones had a similar tendency to use emotive words in introductory
inscriptions and epitaphs, with comparable changes over time. Non-Irish graves had
few examples of either. Emotive language in epitaphs only occurred in the 1880s
(n=4) and 1890s (n=3) (Figure 5.40).
0
0.5
1
1.5
2
2.5
3
3.5
4
4.5
Christchurch Saddleworth
Nu
mb
ers
Figure 5.39: Religious wording on Irish
Protestant headstones.
Quote Verse Phrase
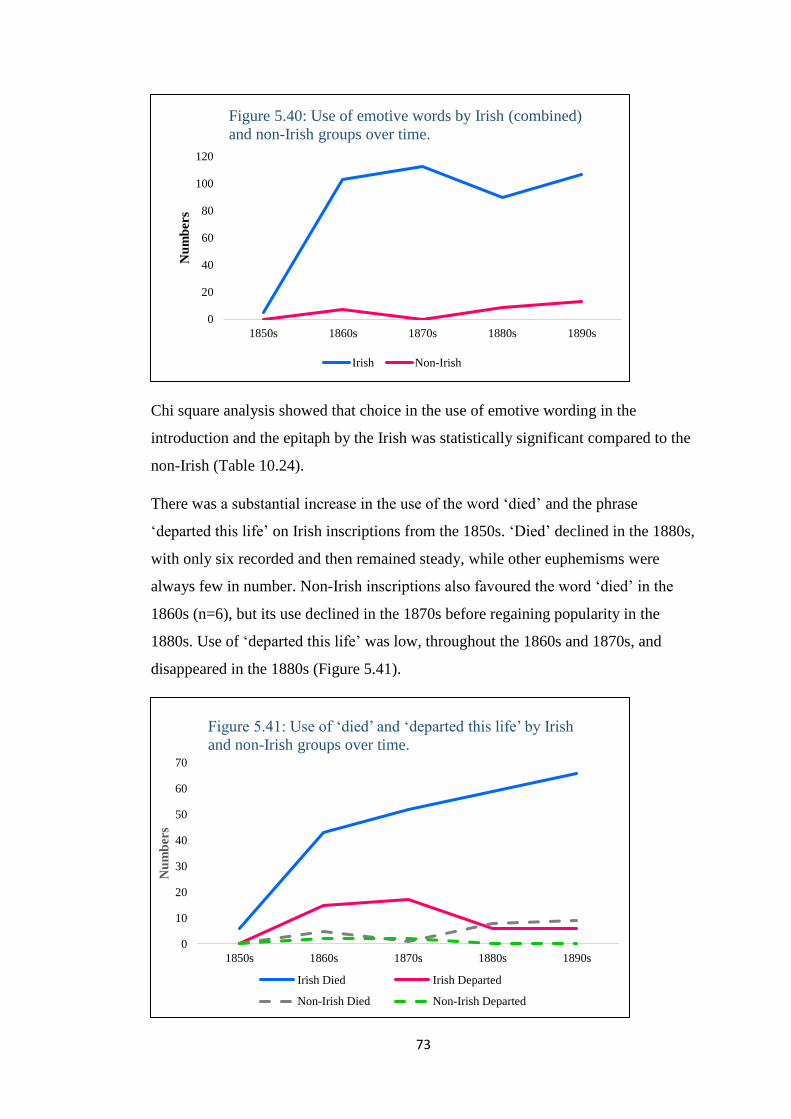
73
Chi square analysis showed that choice in the use of emotive wording in the
introduction and the epitaph by the Irish was statistically significant compared to the
non-Irish (Table 10.24).
There was a substantial increase in the use of the word ‘died’ and the phrase
‘departed this life’ on Irish inscriptions from the 1850s. ‘Died’ declined in the 1880s,
with only six recorded and then remained steady, while other euphemisms were
always few in number. Non-Irish inscriptions also favoured the word ‘died’ in the
1860s (n=6), but its use declined in the 1870s before regaining popularity in the
1880s. Use of ‘departed this life’ was low, throughout the 1860s and 1870s, and
disappeared in the 1880s (Figure 5.41).
0
20
40
60
80
100
120
1850s 1860s 1870s 1880s 1890s
Nu
mb
ers
Figure 5.40: Use of emotive words by Irish (combined)
and non-Irish groups over time.
Irish Non-Irish
0
10
20
30
40
50
60
70
1850s 1860s 1870s 1880s 1890s
Nu
mb
ers
Figure 5.41: Use of ‘died’ and ‘departed this life’ by Irish
and non-Irish groups over time.
Irish Died Irish Departed
Non-Irish Died Non-Irish Departed

74
Irish headstones showed a steady rise in the mention of relationships to the deceased
(Figure 5.42). Familial connection was the most common social identifier on graves
in Ireland, particularly by the later nineteenth century, when larger memorials with
family names became common, although this trait also occurred in Scotland,
America and Europe (Mytum 2001:35) (Figure 5.42).
The use of words relating to birthplace, residence or time lived in Australia peaked
in the 1860s and 1890s on Irish headstones. In comparison, non-Irish headstones
showed a lesser peak in the use of such referents in the 1870s (Figure 5.43).
None of these choices proved to be statistically significant.
0
10
20
30
40
50
60
70
1850s 1860s 1870s 1880s 1890s
Nu
mb
ers
Figure 5.42: Use of words of association to deceased by
Irish and non-Irish groups over time.
Irish Non-Irish
0
2
4
6
8
10
12
14
16
1850s 1860s 1870s 1880s 1890s
Nu
mb
ers
Figure 5.43: Use of home reference by Irish and non-Irish
groups over time.
Irish Non-Irish

75
Summary
Of all the variables analysed in this study, only six proved to be statistically
significant. In terms of differences between the two Irish groups (Catholic vs
Protestant), inscriptions appeared to be influenced by religion, with the use of
biblical verses and religious phrases favoured by Irish Catholics. The use of
individual religious words was less common, but still more apparent on Catholic
graves, with no examples found on Protestant graves.
Words of affection used by Catholics compared to words of grief used by
Protestants, as well as the very large number of religious symbols appearing on
Catholic graves, were also significant. Catholic use of shamrock and Celtic cross
motifs on cast iron grave surrounds also proved to be significant.
Only one chi-square test gave a significant result between Irish and non-Irish
populations: the use of emotive words in introductions and epitaphs by the Irish.

76
Chapter 6: DISCUSSION
This study aimed to investigate the manner in which nineteenth century Irish settlers
memorialised their dead. To achieve this, the following research question was
devised:
How are the Irish people memorialised in graves in South Australia’s mid-
north in the nineteenth century, 1850-1899?
To answer this, the statistically significant results will be analysed in terms of the
construction of Irish identity over time.
Irish Settlement
Stereotypically, the Irish are often portrayed as an exclusive and cohesive group (see,
for example, Campbell 1996:25), and a comparison of two Irish rural settlements in
the nineteenth century — one in Minnesota, United States and the other in south
western New South Wales — shows similarities in both settlement patterns and the
degree of integration with other migrant groups (Campbell 2008, 1998, 1996). In
both cases, Irish emigrants tended to work and live in urban communities prior to
settling into an agricultural life. Any exclusion of other cultural groups was not
intentional, but more a by-product of living in proximity to relatives or friends for
support. In the northern United States, and particularly in Lowell, Massachusetts,
(Marston 1988) and Five Points, New York City, (Brighton 2004, 2011; Reckner
2001) the Irish lived in close-knit communities, partially to combat anti-immigrant /
anti-Catholic sentiment of native-born Americans. Such environments resulted in
fostering overtly Irish political ideologies and to some extent emphasised isolation
from the broader community. However, as found by Brighton (2011, 2004), from
1880 an ‘identity shift’ began to appear, with an Irish-American identity developing.
This resulted in a move away from overtly Irish characteristics, while retaining a
sense of identity in the practice of Catholicism and political responses to their
situation (Brighton 2011:46). In NSW, Campbell argues that, while the Irish
settlements were motivated by opportunity, many arrived in Australia as convicts.
Land grants enabled freed convicts to develop communities far from Sydney, thus
facilitating Irish communities (Campbell 1998:52), whereas Irish migrants to the
United States were restricted to the cities, having little money to venture into rural
areas.

77
Patrick O’Farrell (1987) suggested that the scale of ‘Irish activity’ in colonial
Australia was dependent on few people. With the expanse of the country and the
resultant distribution of Irish settlers across many different communities, few Irish
traditions were continued, save perhaps the celebration of St Patrick’s Day. Further
displays of ‘Irishness’ were avoided to prevent alienation or derision from the
general populace (O’Farrell 1987:173). Within South Australia, the historian Eric
Richards has argued that, unlike their counterparts in Britain and North America, the
Irish were not obviously marginalised, did not settle in segregated communities and
were largely indistinguishable from their British equivalents (Richards 1991a:233-
234, 1991b:92-93,1991c:216). More detailed historical studies in the mid-north, on
the other hand, found strong evidence for networking amongst Irish settlers that
created family precedents for chain migration (James 2009:94-95, 209-210), distinct
traces of spatial clustering throughout the 1860s and 1870s (James 2009:209) and
entrenched patterns of endogamous marriage within the Irish and Catholic
communities throughout the nineteenth century (James 2009:21-22, 210, 221). This
means that, in contrast to the situation that Campbell has argued for NSW, the Irish
in the mid-north of SA were largely insular, tending to marry only other Catholics,
and mostly Irish Catholics, and lived in spatially separate communities. However,
with time, the Irish moved to further their opportunities and did not stay within the
close confines of Irish settlements.
In addition, in South Australia’s mid-north there were few distinctions drawn
between Protestant and Catholic Irish in terms of their national loyalties (James
2009:208-209, 221). Perhaps even more importantly for archaeology and heritage,
and particularly for understanding the ongoing construction of colonial narratives,
James also argued that being Irish did not remain important for South Australia’s
Irish population and therefore Irish heritage was not retained in local memory. While
a clear distinctiveness was maintained until at least the turn of the twentieth century
in some areas, she noted a parallel neglect after 1870, erasing an earlier ‘strong Irish
imprint’ in areas such as the Clare Valley (James 2009:8, 211). Similarly, findings of
cultural unity by Marston (1988), Brighton (2011, 2004) and Reckner (2001) in the
United States were followed by a shift away from a distinct Irish signature from the
1880s.

78
In this study, the general pattern of similarity identified by Richards holds true in
most areas of burial symbolism. There is, however, some archaeological evidence for
distinctiveness and separation between denominations and between the Irish and the
others around them. Given the small number of statistically significant results from
this analysis, areas of comparison and contrast will be explored further here in three
ways: through the use of motifs of affection and grief, motifs related to religious
beliefs, and overtly Irish symbols of identity. The use of motifs showed a marked
decline in the 1880s overall, but when motifs were present religious symbols were
most common on Irish Catholic graves, while the use of emotive symbols identified
Irish graves. The expression of affection and grief via symbols, however,
distinguished Irish Catholics from Irish Protestants.
Motifs of affection versus grief
Motifs signifying affection and grief proved to have a strong religiously-based
difference (Table 10.7), with Irish Catholic graves displaying the vast majority of
motifs representing affection. The use of flora was particularly dominant. Roses as a
symbol of hope, and daisies, which represent innocence, were the most frequently
used, especially by those buried in the Mintaro and St John’s cemeteries. Wreaths (of
both flora and foliage) and forget-me-nots, both portraying remembrance, were also
found at the same two cemeteries.
In contrast, Irish Protestant graves had more austere headstones with fewer motifs.
Christchurch cemetery had just three emotive symbols, two of which represented
grief. These were a lily with a broken stem and morning glory flowers, while
Saddleworth cemetery had an equal number of affection and grief symbols (n=6).
When looked at over time, the use of emotive symbols amongst Irish Catholics
became more popular towards the end of the 19th century. Fewer than five were
recorded in each of the first two decades of the study, and prior to the 1880s only 12
emotive designs, ranging from flowers to urns draped with a cloth, were found on
Catholic headstones. There was a steady escalation of such symbols, particularly
those of affection, into the 1880s (31 examples), followed by a decline to 20 in the
1890s. In contrast, only one or two were found on non-Irish graves in every decade.
While no more deaths occurred in the 1880s than other decades, the loss of the early
migrants, and thus a direct connection with Ireland, could have accounted for a surge

79
in using emotive symbols. This was, however, a choice adopted distinctively by Irish
Catholics rather than Irish Protestants.
The emotional experience of death was also carried through in the language of
headstone inscriptions (Dethlefsen 1981:140), although this was something that was
shared by both Irish Catholics and Protestants.
As a collective, Irish Catholic and Protestant graves showed a statistically significant
difference in the use of emotive words compared to non-Irish burials (Table 10.24),
when the categories for words of affection and grief were considered as one in both
the introductory and epitaph inscriptions (Figure 5.47). Figure 6.1 illustrates this
difference, showing little use of emotive inscriptions by non-Irish, but a recognisable
change in the Irish use of inscriptions relating to affection, over time. So, while a
choice between symbolic motifs of affection and grief distinguished Catholics from
Protestants, when considered together, the use of emotive terms linked the two
groups and separated them from the non-Irish around them. In other words, while
Irish Catholics tended to use more affectionate terms and Irish Protestants more
terms of grief, the Irish as a single group tended to be much more overtly emotive in
comparison to the non-Irish. Irish headstones had a similar tendency to use emotive
words in the introductory inscriptions and epitaphs, with comparable changes in their
uses over time. Emotive language in epitaphs only occurred in the 1880s (n=4) and
1890s (n=3) (Figure 5.47). Non-Irish graves had few examples of either.
0
5
10
15
20
25
30
35
1850s 1860s 1870s 1880s 1890s
Nu
mb
ers
Figure 6.1: Irish vs non-Irish: Change over time of introductory phrases
in inscriptions.
In memory Irish In memory Non-Irish
Erected by Irish Erected by Non-Irish
In loving memory Irish In loving memory Non-Irish

80
This shift is similar to that noted by Tarlow on Orkney graves. She found the use of
more emotive phrases, such as ‘In loving memory’ or ‘Sacred to the memory’, had
supplanted earlier phrases such as ‘In memory’ by the end of the 1880s (Tarlow
1999:66).
Religious motifs
A lack of motifs on graves in comparison to religious motifs proved to be
statistically significant when analysing Irish Catholics and Protestants. Perhaps not
surprisingly, symbols representing Christ (Appendix 9) (Figure 6.2) and the cross
were predominant on Catholic graves, accounting for 88% of all religious symbols
(Figure 5.20). In comparison, the few religious motifs found on Protestant graves
related to God and the Holy Spirit. Over time the use of religious motifs by Catholics
peaked in the 1860s, particularly at St John’s (n=11), with a steady decline
throughout the rest of the century (Figure 5.29). The 1860s saw the greatest use of
religious words on Catholic headstones, while there were none on Protestant
headstones, and Protestants only used religious symbols in the 1870s.
Figure 6.2: Engraved stone of the Sacred Heart on
Ellen Crowe’s grave, 1895, Undalya Catholic
cemetery. (Photo: J McEgan)
These results complement Mytum’s (2013:162) observations on 19th century
Protestant observances of death, which concentrated on the judgement of a life lived,
with no prospect of improvement in any afterlife, thus few religious symbols were
included on headstones. Smith (2001) found a similar avoidance of the cross in
Protestant churches in nineteenth century America, as this symbol was particularly
affiliated with the Catholic faith, a restraint also obvious in Protestant graves in this
study. Catholics, however, attempted to shorten the path through Purgatory by a
variety of means, including the use of religious motifs on Catholic graves to aid a
more ‘active’ memorialisation. Furthermore, the use of ‘IHS’ on a cross was
encouraged by Jesuit fathers (Mytum 2013:167), an order well-established in South

81
Australia’s mid-north. Not surprisingly, Irish Catholics adopted the use of these
symbols in the mid-north following the general trend from the European influence of
the Austrian Jesuits. The maintenance of such strong faith-based imagery in contrast
to Protestant belief may have connoted more adherence to Catholic orthodoxy.
One other chi-square test on parts of the grave inscriptions confirmed religious-based
differences (Tables 10.22 & 10.23). The use of a single religious word (e.g. ‘Amen’)
and biblical quotes by the two Irish groups were compared. Irish Catholics used the
word ‘Amen’ while biblical quotes only occurred on three graves (Protestant n=1
and Catholic n=2). Finally, while not proving to be statistically significant, the use of
a plain cross as a headstone form suggested interesting oppositional trends amongst
sectors of the Irish population (Figures 5.12 & 5.13). Specifically, the use of the
cross as a monument form declined amongst Irish Catholics in the 1880s, while Irish
Protestant’ use of this form increased marginally. Both groups reversed this trend in
the 1890s, suggesting that something distinctive may have been occurring in the
choices that each group were making. There are two possibilities to explain these
choices: that the use of the cross between Catholics and Protestants was a result of
adherence to particular religious beliefs or injunctions, or that it was an expression of
wider political ideologies that opposed these two groups.
While the Catholic Church exerted influence over the political environment in
Ireland, there is no indication that it advised its followers to change their manner of
memorialisation away from the use of symbols such as the cross, nor does the Dei
Filius from the First Vatican Council of 1869-1870 (Unknown [inters.org] 1870)
indicate any directive to abandon it as a means of memorialisation. However, the
Irish societies representing ‘Liberalism’ and ‘Socialism’, for example, were
condemned by Pope Pius IX for being ‘anti-religious’ in 1864 (McCartney 1968:13).
Such antipathy towards the stirrings of Irish independence caused some conflict for
the Irish who revered their faith, thus strengthening a separation of Irish Catholics
from Rome (McCartney 1968:13-14). This may have resulted in some Catholics
choosing not to use the cross as a headstone form, although the cross continued to be
used as a motif across the decades of the study, as was the ‘IHS’ symbol representing
Christ.
As a descendant of Irish immigrants, Terry Trainor recalls a parish priest (an Irish
expatriate himself) singing and playing music of the Irish rebellion, while Mr

82
Trainor’s father owned a book with strong sentiments of Irish rebellion, Catholicity
and Irish self-rule (T. Trainor pers. comm. 2015). Such occurrences suggest that the
Catholic Church and Irish independence were closely intertwined and, as such,
unlikely to be expressed as separate entities in the depiction of memorials.
In terms of a connection between crosses and wider political beliefs, Daniel
O’Connell’s founding of the Repeal Association to gain independence from Britain
in 1840 firmly identified nationalism with Catholicism in order to unite the majority
of the Irish Catholic people (Sheehy and Mott 1980:29). Irish nationalist political
movements spread across the world, but while some partiality toward such beliefs
existed, Australian Irish migrants seemed more concerned with loyalty to family and
their county of birth than with nationalist connections (O’Farrell 1980:116, cited in
Campbell 1996:33). This attitude was far removed from that of Irish/American
immigrants, who, according to Brown (1966), were desperate to improve their lives
to overcome ‘a pervasive sense of inferiority, intense longing for acceptance and
respectability…’ Miller (1980:104), suggests that the Irish considered they were ‘in
forced exile’ from English rule, leading to a tenacious nationalism in America.
Little archaeological evidence of Irish nationalism has been found in Australia as
attested to by the excavation of political prisoner William Smith O’Brien’s cottage in
Port Arthur, Tasmania in 1983. While he was a leading political figure in nineteenth-
century Britain, O’Brien’s presence in Australia from 1849 has left little physical
testimony other than changes to the structure to accommodate an eminent convict
(Egloff and Morrison 2001).
An alternative explanation for the fall in popularity of cross headstones amongst
Catholics in the 1880s may be more prosaic. The economic state of South Australia
could have influenced the manner in which the departed were memorialised. South
Australia suffered significant droughts in the 1880s, resulting in many insolvencies
(James 2012:110). Being that the mid-north was an agricultural area, and many of
the Irish settlers were farmers, the aftermath of such weather events would have
resulted in the loss of, or reduced cash flow for the properties. A reduction in the
number of cross-form headstones, being they were amongst the largest and therefore
most costly, could have been due to economics, as could the increasing plainness of
headstones from the 1880s (see Figure 5.30), as fewer engraved motifs presumably
translated to lower cost. While O’Farrell (1987:173) found Celtic crosses to have

83
increased in popularity on graves from about the 1880s in Australian Catholic
cemeteries, they were generally connected with more affluent migrants, and thus the
lack of examples in this study could be a further indication that the financial state of
South Australia influenced headstone choices.
Irish symbols
The use of overtly Irish symbols spanned the timeframe of this study, indicating that
time away from their homeland did not necessarily dampen the connection with
Ireland. These symbols included the Celtic form of the cross and shamrocks. From
the data recorded in this study, the use of such symbols to demonstrate Irish
association was primarily used by first generation immigrants (Figure 6.3), with the
lone example of a Celtic cross headstone from the second generation belonging to a
nineteen year old whose parents (themselves first generation migrants) erected the
marker. Motifs of shamrocks and Celtic crosses proved to be the same, with only one
of five graves bearing Irish-type motifs belonging to a second generation Irish
person, whose parents also erected the memorial (Figure 6.4).
Figure 6.3: Michael Dermody’s
Irish Catholic grave 1861.
(Photo: M. McEgan)
Figure 6.4: John Guiney’s Catholic grave
1883, showing shamrock motifs and
adjacent Celtic cross. Headstone erected
by his parents. (Photo: J. McEgan)

84
Celtic crosses and shamrocks also figured prominently as motifs on the cast iron
surrounds of graves, and were again statistically significant when the Catholic and
Protestant Irish were compared. The shamrock occurred more often on Catholic
graves and the Celtic cross symbol on Catholic grave fences, while Protestant graves
had only one example of each. The shamrock is a trefoliate leaf (Deas 1898:104),
long associated with St Patrick, Ireland’s patron saint. The plant’s three leaflets are
purported to have been used as a metaphor for the Holy Trinity by St Patrick on his
quest to convert the Celts of Ireland to Christianity (Unknown [Ulster Journal of
Archaeology] 1857:12), with specimens being worn in hats to commemorate St
Patrick on his Holy day, as noted by Dr. Caleb Threlkeld in 1726 (Frazer 1894:133).
Furthermore, there is some speculation that Celts themselves revered the plant for its
trefoil form, with the numeral ‘three’ found in many forms in Celtic history, such as
the triskele (Figure 6.9) and the triquetra (Figure 6.7), as well as the shamrock
(Figure 6.8). As noted by Mac Mathúna (1999: 174, 177), Irish folklore had an
inherited concept of the cosmos involving a triad of three divisions of the universe
being nem (sky), talam (sea) and muir (earth), indicating the importance of the
number ‘three’, a belief also held by the Druids (Deas 1898:105). Christian belief in
the Holy Trinity in many ways co-opted such beliefs and entrenched them still
further.
The dominance of the shamrock imagery on Catholic graves in the mid-north
suggests strongly that the connection with religion (and thus St Patrick) was the
over-riding factor in its use on Irish Catholic graves. The Celtic Revival of
nineteenth century Ireland is primarily associated with the Protestant Irish
(Hutchinson 2001:505), in which symbols such as the Celtic cross were used ‘to
establish …..an Irish national identity’ (Hutchinson 2001:510). In contrast,
traditional symbols like the shamrock and harp were well-represented among the
Catholic population (Hutchinson 2001:510). However, the symbols represented
different ideas of an Irish heritage: Protestants used them as a means to connect with
Ireland as many had descended from Anglo-Scottish settlers, whereas Catholics
associated the images with a chance to reclaim Ireland from the English and restore
traditional Irish culture (Hutchinson 2001:513-514). The results of this study
substantiate such observations, as shamrocks were the dominant choice on Irish
Catholic graves compared to Celtic crosses or other symbols, with the Holy Trinity
being a more probable connection than Celtic association. Celtic crosses, however,

85
have a probable connection with early Christianity. The shape is suggested by Bryce
(1989) to have evolved from a symbol common in fourth century Christianity – the
‘chi-rho’ an ‘X’ (chi) overlaid with a ‘P’ (rho), being the Greek letters of the first
two letters of ‘Christ’ (See figures 6.5 & 6.6), and used in combination to represent
Christ. Hence, the use of Celtic crosses on the Irish Catholic graves had associations
with early Christianity in Britain.
Figure 6.5: Chi-rho symbol in Figure 6.6: The development of the
Dorsetshire. Celtic cross from ‘chi-rho’ symbol.
(From Bryce: Symbolism of the Celtic Cross 1989)
Figure 6.7: Triquetra. Figure 6.8: Shamrock.
(Image from Fulford & Gilbert 2008) (Image from M. Russell 2015)

86
Figure 6.9: Newgrange, Co. Meath showing triskele designs on entrance stone.
(Photo: S. Arthure)
Spatially, there was little variation in the way in which Irish settlers memorialised
the dead in the mid-north. Headstone forms were relatively consistent in
representation across the six cemeteries. Fencing designs also showed little diversity
over the study area, as did inscription categories. Motifs had the greatest fluctuation
in form – religious symbols ranged from 40 to 60% in the Catholic cemeteries, but
were much less frequent on Protestant graves. Motifs of affection had the greatest
spread from 5% at Undalya to 40% at Saddleworth, while the other cemeteries
comprised about 10%. Irish symbols accounted for less than 10% in all cemeteries.
The greatest variation was in headstone fabric, with marble being most common in
the Kapunda cemeteries and slate at Mintaro and Undalya. This deviation was most
likely simply due to the proximity of quarries for the stone used.
Four early grave markers were unique in style, three of which were Catholic burials
at the Navan cemetery (O’Sullivan, O’Brien and Fahey) and one of which was a
non-Irish Catholic burial at the Mintaro cemetery (Hoffmann) (Figure 5.15). Two of
the Navan headstones, from 1858 (Fahey) (Figure 6.10) and 1863 (O’Sullivan)
(Figure 6.12), had the same shape, but were very different to other forms. The
O’Brien tablet from the 1860s (Figure 6.11) was the only example that appeared to
be completely hand-carved. The shape of the headstone was not symmetrical, while
the shapes carved around the edges were irregular. The legible text was neat, but not
even in size or distribution across the lines. Furthermore, there were spelling errors
evident, specifically: the words ‘REAST’ and ‘AMN’. The O’Sullivan headstone had
distinctive designs not seen on the other three, with two spirals decorating the space
above the epitaph (Figure 6.12 & 6.13). These also appear to be hand carved, as they
are irregular. The rest of the O’Sullivan headstone had consistently sized text, though

87
some letters had been made smaller to fit on a line, and the additional motifs were
regular in their form, similar to those on the Fahey stone (Figure 6.10).
Three forms of foliage decorated the O’Sullivan headstone (Figures 6.12 & 6.13),
while the base of the O’Brien headstone (Figures 6.11 & 6.14) included a geometric
chevron design between a cross and a chalice. It was the only example in the
database to have a painted motif, while it also bore fern-like engravings similar to
those on the O’Sullivan headstone. There is no indication of who carved these
headstones and they are assumed to have been made locally, by an unnamed mason.
The O’Sullivan and Fahey headstones may have been made by the same person,
since they are the same shape, are both carved with Bodonee crosses inside the
rounded finials at the top of the headstone and include the same recessed panel in the
centre of the epitaph. They each have unique variations, however, that also
differentiate them, indicating that they were not made to precisely the same pattern.
The possibility that these were purchased from the main producer in Mintaro (Priest)
or from an Adelaide firm is unlikely being that in the 1860s the residents of Navan
were recently arrived from famine-affected Ireland and thus unable to afford such
items. The early age of these three headstones and their uniqueness, is likely to be
indicative of a lack of a locally established masonry industry. All three examples
display evidence of hand-worked symbols and inscriptions and personal inclusions
representative of overt Irish symbolism. The connections made to family, with so
much detail of relationships and places of birth, continued the connection with
Ireland, while the symbols resembling those of Celtic ancestry, particularly the
spirals and geometric designs found on the O’Sullivan and O’Brien graves,
highlighted the Irish identity of these arrivals in the colony.

88
Figure 6.10: Fahey headstone 1858, Navan Catholic cemetery.
(Photo: J. McEgan)

89
Figure 6.11: O’Brien headstone 1860s, Navan Catholic cemetery.
(Photo: J McEgan)

90
Figure 6.12: O’Sullivan headstone 1863, Navan Catholic
cemetery (Photo: J McEgan)

91
Figure 6.13: Motifs on the top section of the O’Sullivan headstone 1863, Navan
Catholic cemetery.
(Note: non-specific motifs and possible Irish spirals)

92
Figure 6.14: Sketch of the O’Brien headstone, 1860s, Navan
Catholic cemetery, showing geometric design at base.

93
Irishness in the mid-north
Irish migrants to South Australia represented strong connections with family in their
graves. Relationships to the dead featured regularly among the Irish population as a
whole, particularly in inscriptions on headstones. This association increased from the
1850s to the 1870s (Fig. 5.49), while the mention of the deceased’s home varied
across the timeframe of the study, with a decline in the 1860s but an upward trend in
the 1890s. Unlike James (2009:8, 211), who indicated a decrease in Irish cultural
association in her study from the 1870s, the results of this study indicate a
continuance of such practices with either a general increase or stability in various
overtly ‘Irish’ grave features compared to the non-Irish population.
Religious differences between the Irish Catholic and Irish Protestant populations
were also apparent, presented mainly through the choice of motifs. Representations
of Catholic faith were significant in their use by Irish Catholics, while symbols of
grief were more common on Protestant headstones. Irish Protestants only used the
symbol of God and the Holy Spirit and symbols of new life in the 1870s and 1880s
(n=4). The use of religious motifs steadily declined among the Irish Catholics.
For both groups, emotion proved to be a distinctive Irish trait in a number of ways.
Symbols of emotion were common in both Irish populations, though affectionate
motifs were more prevalent on Catholic graves. Emotion proved to be a significant
difference between the Irish and non- Irish in the wording of inscriptions on
headstones. In both introductory phrases and epitaphs, bonds within families were
apparent in the wording used, with phrases such as ‘loving memory’ increasing over
time.
Overtly Irish symbols, such as shamrocks and Celtic crosses, being representative of
religious and Celtic traditions, were few in number, but including residence at time
of death, a practice still prevalent in Ireland today, was a subtle use of tradition from
the homeland.
Hall and Proudfoot (2007), in their study of Irish graves at the Stawell cemetery in
Victoria, suggested that Irish Catholics were more inclined to use Celtic Revival
symbolism than their Protestant countrymen – an erroneous statement considering
Hutchinson’s (2001) findings of a greater association between these symbols and the
Protestant population. Hall and Proudfoot found that symbols used on Irish graves in

94
Stawell were representative of their former lives in Ireland. They used this to argue
that Irish settlers had a greater attachment to Ireland than those who remained at
home. Hall and Proudfoot argue that greater use of Irish symbolism on headstones
after 1890 meant that ethnic identity was greater for Irish Catholics after this date but
no such commemoration was found on Irish Protestant graves. They suggest an
increase in the use of Celtic crosses, along with other symbols such as shamrocks
and harps, in Catholic sections of cemeteries Australia-wide, but do not justify the
statement with data.
The only significant result in this study with regards to Celtic Revival Irish
symbolism occurred in the use of shamrocks and Celtic crosses on iron fencing by
Catholics, connoting, as they did, religious affiliations with St Patrick and the Holy
Trinity. Such designs were readily found on early stone monuments throughout
Celtic lands.
Hall and Proudfoot also made much of the inclusion of place of residence at the time
of death on headstones in the Stawell cemetery, but, again, no data for the frequency
of these inscriptions is given, merely the occurrence of place of birth which was no
more prevalent among the Irish settlers than other British migrants. Again, Hall and
Proudfoot used this to argue that Irish settlers had a greater attachment to Ireland
than those who remained at home. Unfortunately, there was no indication that Hall
and Proudfoot undertook any statistical analysis to demonstrate that these results
were not just an outcome of their sampling strategy rather than a representation of
‘real’ differences amongst the larger population. While stating that shamrocks and
place of birth were significant, and thus representing a group identity for Irish
migrants to that region, the data provided does not substantiate such claims, and thus
their argument may be flawed. Had they conducted a statistical analysis, their
outcomes may have been very different.

95
Chapter 7: Conclusion
While the general concept of Irish people is one of strong ties to their homeland
displayed in overt ways, the memorialisation of Irish graves in the mid-north does
not support such an obvious scenario. In reality, the Irish immigrants used more
subtle symbolism in motifs or words to invoke an understanding of their origins,
which, however, do link to the wider stereotypes of the Irish being openly emotional
and steadfastly Catholic.
The three headstones at Navan that display personal influences were not mimicked in
any later headstones, or at other cemeteries. The lack of stonemasons would have
influenced the need to manufacture a grave marker, but more so the personal
symbols and detail of lives and origins was particularly poignant. The inclusion of
symbols associated with Celtic origins (scrolls on the O’Sullivan headstone and the
geometric shape on the O’Brien marker) are indications of these early Irish migrants
maintaining connections with a pre-English past. The detail with which the deceased
and their origins were recorded further indicates the need for these people to
continue associations with Ireland. Even the Fahey grave, while a simpler memorial,
detailed the names, ages and dates of death for each member who died. The
individuality of these graves indicates the opportunity for personal memorialisation
which diminished in some aspects with the later standardisation of memorials. With
mass production, only the choice of wording retained some individuality, while the
physical presentation of monuments became more uniform. This in itself could
create a dilemma for archaeologists in determining the individual contribution of the
family and the ‘Irishness’ of material culture.
The significance of the use of emotion and connection to family in this study, along
with the use of Celtic cross and shamrock symbols, however, shows that the Irish of
South Australia’s mid-north emphasised their Irish identity in particular ways, even
if not always in the overt manner usually associated with them. Unlike James’ study
(2009), which stated that a decline in Irish association was apparent after the 1870s,
the archaeology indicates a stability in the number of symbols and/or words
associated with the Irish after this time. The number of graves recorded in each
decade from the 1870s varied little from the other decades, as did the number of
recorded examples in each category. Emotive text and connection with Ireland or to
residence in South Australia also changed little, but both categories declined slightly
96
in the 1880s before increasing again. Mentioning relationships with the deceased
remained relatively stable over the last four decades of the study. Religious wording,
however, decreased from the 1870s. Motifs representing emotion and Ireland both
increased over time, and as with the text, religious affiliation decreased. Hence, this
study and the archaeology of the graves indicates that representations of Irish culture
did not diminish over the duration of the nineteenth century.
The initial settlement patterns of Irish migrants indicated a preference to be near
fellow countrymen, but with time they were willing to disseminate throughout South
Australia. While historians have argued that the Irish blended into society without a
trace, this study shows otherwise: that the Irish still displayed aspects of their
origins, and displayed them differently according to whether they were Catholic or
Protestant.
Although the differences in memorialisation appear to follow a religious divide (Irish
Catholic versus Irish Protestant) rather than a national one (Irish versus non-Irish),
the distinction may in fact be more of a political inclination. The Protestants tended
to be wealthier (e.g. Capt. Charles Bagot) and/or from the northern climes of Ireland,
thus more likely to be descended from an Anglo-Scottish heritage, resulting in a
greater affiliation with England. This contrasts to the Catholics who tended to be of
traditional Irish (Gaelic) ancestry. Furthermore, Miller (1980:108-110) identifies a
central tenet of Irish Catholic society as a dependence on family and tradition,
leaving little opportunity for individuality, which was further engrained by a
uniformity of belief in the Church. This was in comparison with Irish Protestants,
who considered individuality an important part of their identity.
The social identity of the Irish in the mid-north was conveyed in different ways,
depending on the material remains examined. Arthure (2014) found the houses of
Baker’s Flat to be closely clustered, suggesting a tightknit community whereas the
graves in this study suggest that the Irish were interspersed with other ethnicities.
Religion was a dominant factor, however, in both studies. The elements of Irishness
found by Arthure were more related to the spatial arrangement of the settlement
rather than specific items associated with the Irish. This grave study, while not
having large numbers of Celtic-related symbols, does show a greater inclination to
overtly Irish images and thus a greater degree of ethnicity being apparent, with
religion being an evident factor. Mass produced items such as headstones reduced

97
the opportunity to express Irishness in material culture, but the migrants found other
ways to do so through the settlement patterns at Baker’s Flat and the use of text and
motifs on graves.
With the idea that a person’s self-perception can change with time, it is to be
expected that variation in results over the time frame would occur in this study. As
stated by Jones (1997), traits may be shared by different groups. This is apparent in
the lack of diversity in many aspects of the recorded graves. The proximity of family
members proved to be an insignificant factor among the three groups, as did the form
of the headstones. However, as stated by Bottero and Irwin (2003), differences can
occur within a group (in this case, the Irish as a whole) where the type of motifs
incorporated on the headstones was a point of religious difference between the two
Irish groups. Affectionate symbols were favoured by the Catholics and expressions
of grief by the Protestants, while religious motifs were prevalent among the Irish
Catholics but not their Protestant countrymen.
As suggested by Brighton (2004), social identity evolves over time - a concept that is
apparent in this study. While religion was more obviously depicted in Catholic
memorialisation, a variation of this transpired with a decline in the use of crosses in
the 1880s. The land wars and Home Rule movement in Ireland at the time may have
temporarily diverted concern from religion and thus the social identity of the Irish
adjusted to different ideals.
The individuality of the graves at Navan Catholic cemetery (O’Sullivan, Fahey and
O’Brien) are examples of ‘assertive’ style, while the similarities of wording and
motifs in the three groups represent ‘emblemic’ style among the social groupings.
These three unique graves with the detail of family and origins expressed in great
detail is in agreement with Miller’s argument (1980) in which he determines a
commonality in Irish Catholic society of the importance of family and tradition.
However, these three graves do express a distinctiveness in style and motif use
compared with later memorials in the study.
While such individuality in graves was not apparent after the 1860s, the inclusion of
family and relationships in inscriptions does show an adherence to traditions.
Furthermore, the continued use of graves and headstones occurred throughout the
duration of the study period. Mytum found that graves in Ireland were often used

98
over a number of generations, particularly from the mid-eighteenth century until the
early 1900s. Over time the style of inscription reflected the era in which wording
was added, while the importance of familial connection and responsibility was
shown by continual re-use (Mytum 2003/2004:117). This study found similar re-use
of graves though most used the same font in the inscriptions. Some notable
exceptions were that of the Marron brothers’ grave at St Patrick’s Catholic cemetery,
Undalya, which used lead lettering for James (1878) and an engraved script for
Patrick (1896). A number of font variations for different interments occurred in the
Navan Catholic cemetery, while the Donoghue grave (James, 1887) had a different
surname spelling for the wife’s memorial (O’Donohue, 1892).
Future Directions
The number of Irish emigrants arriving in Australia over its first hundred years of
settlement was significant, suggesting that much knowledge can be garnered from
the memorials of these settlers. Furthermore, South Australia as a colony of free
settlers does not encompass the lives of those who migrated unwillingly as convicts.
Investigating differences between free and convict Irish settlers adds a further branch
future study, while an expanded timeframe from the beginnings of white settlement
in the colonies allows for other approaches to Irish settlement to be examined.
The significance of emotion used to commemorate lost family is an avenue that
could be pursued in further studies, with difference in memorialisation of gender
being one to pursue, as well as additional investigation of religious and ethnic
differences of memorialisation.
The opportunity to investigate the Irish through archaeology and fit more pieces of
Australia’s vast influx of immigrants into its complex past enables the archaeological
record to be further enhanced, and ensures that the lives and contributions of the
early settlers will not be lost.

99
REFERENCES
Alexander, M.A. 1950 The symbolism of Christianity. Archaeology 3(4):242-247.
Anonymous 1988 Nation building and immigration. Journal of the Australian
Population Association 5(1):44-67.
Arthure, S. 2014 The Occupation of Baker’s Flat: A Study of Irishness and Power in
Nineteenth Century South Australia. Unpublished MArch thesis, Department of
Archaeology, Flinders University, South Australia.
Australian Data Archives 2012 1861 Census for South Australia. Retrieved June 15
2014 from <http://hccda.ada.edu.au/regions/SA>
Australian Data Archives 2012 1871 Census for South Australia. Retrieved June 15
2014 from <http://hccda.ada.edu.au/regions/SA>
Australian Data Archives 2012 1881 Census for South Australia. Retrieved February 22
2015 from <http://hccda.ada.edu.au/regions/SA>
Australian Data Archives 2012 1891 Census for South Australia. Retrieved February 22
2015 from <http://hccda.ada.edu.au/regions/SA>
Australian Data Archives 2012 1901 Census for South Australia. Retrieved February 22
2015 from <http://hccda.ada.edu.au/regions/SA>
Bottero, W. and S.Irwin 2003 Locating difference: Class, 'race' and gender, and shaping
of social inequalities. The Sociological Review 51(4):463-483.
Brennan, M. L. 2011 Geological survey of historical cemeteries, Jamestown, Rhode
Island, 1693-1900. Historical Archaeology 45(4):102-114.
Brighton, S.A. 2011 Middle-class ideologies and American respectability: Archaeology
and the Irish immigrant experience. International Journal of Historical Archaeology
15(1):30-50.
Brighton, S.A. 2004 Symbols, myth-making, and identity: The Red Hand of Ulster in
late nineteenth-century Paterson, New Jersey. International Journal of Historical
Archaeology 8(2):149-164.
Brighton, S.A 2008
Brown, T.N. 1966 Irish-American Nationalism 1870-1890. Philadelphia: J.B.
Lippincott Company.
Bryce, D. 1989 Symbolism of the Celtic Cross. Felinfach, Wales: Llanerch Enterprises
Burke, H. 1999 Meaning and Ideology in Historical Archaeology: Style, Social Identity,
and Capitalism in an Australian Town. New York: Kluwer Academic / Plenum
Publishers.
Burke, H., C. Smith and L. Zimmerman 2009 The Archaeologist's Field Handbook.
Lanham: AltaMira Press.
Burrows, M. 1965 Riverton - Heart of the Gilbert Valley. Riverton: District Council.

100
Busteed, M.A. and R.I. Hodgson 1996 Irish migrant responses to urban life in early
nineteenth-century Manchester. The Geographical Journal 162(2):139-153.
Campbell, M. 2008 Ireland's New Worlds: Immigrants, Politics, and Society in the
United States and Australia, 1815-1922. Wisconsin: University of Wisconsin Press.
Campbell, M. 1998 Immigrants on the land: Irish rural settlement in Minnesota and
New South Wales, 1830-1890. New Hibernia Review/Iris Éireannach Nua. 2(1):43-
61.
Campbell, M. 1996 Irish nationalism and immigrant assimilation: Comparing the
United States and Australia. Australasian Journal of American Studies 15(2):24-43.
Carroll, H.S. (compiler) 1876 The District Atlas of South Australia and Northern
Territory, 1876. Adelaide: E.S. Wigg & Son.
Charlton, R. 1971 The History of Kapunda. Melbourne: The Hawthorn Press.
Chicora Foundation 2008 Cemetery Ironwork. Retrieved October 6 2014 from
<www.chicora.org/cemetery-fences.html>
Clark, B.J. 2005 Lived ethnicity: Archaeology and identity in Mexicano America.
World Archaeology 37(3):440-452.
Croucher, S.K. and L.Weiss 2011 The archaeology of capitalism in colonial contexts,
an introduction: Provincializing historical archaeology. In S.K. Croucher and
L.Weiss (eds), The Archaeology of Capitalism in Colonial Contexts: Postcolonial
Historical Archaeologies, pp.1-37. New York: Springer.
Deas, L. 1898 Flower Favourites: Their Legends, Symbolism and Significance. London:
Jarrold and Sons.
Dethlefsen, E.S. 1981 The cemetery and culture change: Archaeological focus and
ethnographic perspective. In R. A. Gould and M. B. Schiffer (eds), Modern Material
Culture, pp.137-161. New York: Academic Press.
Digital Globe 2017 Map of Kapunda. Retrieved July 10 2017 from
<https://www.google.com.au/maps/place/Kapunda+SA+5373>
Digital Globe 2015 Map of Mintaro Catholic cemetery. Retrieved September 28 2015
from
<https://www.google.com.au/maps/place/Mintaro+St+Mary+Catholic+Cemetery>
Digital Globe 2015 Map of Navan Catholic cemetery and Riverton. Retrieved
September 28 2015 from
<https://www.google.com.au/maps/place/Navan+Catholic+Cemetery,+Riverton>
Digital Globe 2017 Map of Saddleworth and Undalya. Retrieved July 10 2017 from
<https://www.google.com.au/maps/place/Saddleworth+SA+5413>
Donnelly, C. J. 2005 The I.H.S. monogram as a symbol of Catholic resistance in
seventeenth-century Ireland. International Journal of Historical Archaeology
9(1):37-42.

101
Egloff, B. and R. Morrison 2001 ‘Here ends, I trust forever, my acquaintance with Port
Arthur’: the archaeology of William Smith O’Brien’s cottage. Australasian
Historical Archaeology 19:14-24.
Farrell, Z.K. 2003 Sacred to the Memory: An Archaeological Investigation into
Emotion and Ideology within Two Regional Cemeteries. Unpublished BArch (Hons)
thesis, Department of Archaeology, Flinders University, South Australia.
Field, S.J. 1994 Becoming Irish: Personal identity construction among first-generation
Irish immigrants. Symbolic Interaction 17(4):431-452.
Fitzpatrick, D. 1991a ‘That beloved country, that no place else resembles: Connotations
of Irishness in Irish-Australian letters, 1841-1915. Irish Historical Studies,
27(108):324-351.
Fitzpatrick, D. 1991b ‘Over the foaming billows’: The organisation of Irish emigration
to Australia. In E. Richards (ed.), Poor Australian Immigrants in the Nineteenth
Century, Visible Immigrants: Two, pp.133-152. Canberra: Division of Historical
Studies and Centre for Immigration and Multicultural Studies, Research School of
Social Sciences, Australian National University.
Fitzpatrick, D. 1985 Irish Emigration 1801-1921. Dublin: The Economic and Social
History Society of Ireland.
Francavaglia, R. 1971 The cemetery as an evolving cultural landscape. Annals of the
Association of American Geographers 61(3):501-509.
Frazer, W. 1894 The shamrock: Its history. The Journal of the Royal Society of
Antiquaries of Ireland 4(2):132-135.
Frei, P. 2014 Cemeteries. Retrieved October 2 2014 from
<http://www.canberrahistoryweb.com/cemeteries.htm>
Fulford, K. and P. Gilbert 2008 The power of three: spirituality, leadership and values.
International Journal of Leadership in Public Services 6(2):2-5.
Gallasch, P. 1983 Damned whores & God's people. Off Our Backs 13(3):4-6.
Glennie, P. 1995 Consumption within historical studies. In D. Miller (ed.),
Acknowledging Consumption: A Review of New Studies, pp.163-204. London:
Routledge.
Greet, M. 1987 The Irish and Fenianism in South Australia during 1868. Unpublished
BArts (Hons) thesis, School of Social Sciences, Flinders University, South Australia.
Griffin, G.M. and D. Tobin 1982 In the Midst of Life…The Australian Response to
Death. Melbourne: Melbourne University Press.
Hall, D. and L. Proudfoot 2007 Memory and identity among Irish migrants in
nineteenth-century Stawell. Australasian Journal of Irish Studies 7:67-83.
Handlin, O. 1959 Boston’s Immigrants: A Study of Acculturation. Cambridge, USA:
Harvard University Press.

102
Harley, A.C. & Co. 1897 "Sun" Foundry: Illustrated Catalogue Adelaide: Stewart &
Harley.
Hilliard, D. and A.D. Hunt 1986 Religion. In E. Richards (ed.), The Flinders History of
South Australia: Social History, pp.194-234. Netley: Wakefield Press.
Hirsch, E. 1991 The imaginary Irish peasant. PMLA 106(5):1116-1133.
History SA Saddleworth District. Retrieved March 9 2015 from
<http://community.history.sa.gov.au/saddleworth-district-historical-society-
museum>
Hutchinson, J. 2001 Archaeology and the Irish rediscovery of the Celtic past. Nations
and Nationalism 7(4):505-519.
Ireland Valuation Office 1847 Primary Valuation Property Survey 1847-1864.
Retrieved November 2013 to October 2014 from
<http://www.irishtimes.com/ancestor/surname/>
Jalland, P. 2006 Changing Ways of Death in Twentieth-century Australia. Sydney:
University of New South Wales Press Ltd.
Jalland, P. 2002 Australian Ways of Death: A Social and Cultural History 1840-1918.
South Melbourne: Oxford University Press.
James, M.S. 2012 Mobility patterns of Irish immigrants in the Clare Valley. In M.A.
Kleinig and E. Richards (eds), On the Wing: Mobility Before and After Emigration to
Australia. Visible Immigrants:7. Spit Junction: NSW Anchor Books Australia.
James, M.S. 2009 Becoming South Australians? The Impact of the Irish on the County
of Stanley, 1841-1871. Unpublished MArts thesis, Department of History, Flinders
University, South Australia.
Jones, S. 1999 Historical categories and the praxis of identity: The interpretation of
ethnicity in historical archaeology. In P.P.A.Funari, M.Hall and S.Jones (eds),
Historical Archaeology: Back from the Edge, pp.219-232. London: Routledge.
Jones, S. 1997 The Archaeology of Ethnicity: Constructing Identities in the Past and
Present. London: Routledge.
Keenan, D.J. 1983 The Catholic Church in Nineteenth-century Ireland. Dublin: Gill and
Macmillan.
Lai, W. L. 2004 Chinese diasporas: An overview. Caribbean Quarterly 50(2): 1-14.
Lally, G. 2006 ‘A Landmark of Faith’: Church of the Immaculate Conception, Mintaro
– its parishioners, 1856-2006. Clare: Lally.
Lawes, A. 2013 Migration Histories: Journeys, routes and fares. Retrieved December
30 2014 from
<http://webarchive.nationalarchives.gov.uk/+/http://www.movinghere.org.uk/galleri
es/histories/irish/settling/settling.htm>

103
Leadbeater, B. 2014 South Australian passenger lists. Retrieved June 11 2014 from
<http://www.familyhistorysa.info/shipping/passengerlists.html>
Linden-Ward, B. 1990 The fencing mania: The rise and fall of nineteenth century
funerary enclosures. Markers: Journal of the Association for Gravestone Studies
VII: 35-58.
Mac Mathúna, L. 1999. Irish perceptions of the cosmos. Celtica, 23: pp.174-87.
Main, J.M. 1986 Social foundations of South Australia I: Men of capital. In E.
Richards (ed.), The Flinders History of South Australia: Social History, pp.96-104.
Netley: Wakefield Press.
Map.net.au Outline map of Australia. Retrieved July 8 2017 from
<www.map.net.au/outline-map>
Google Map data 2017 Mid-north, South Australia. Retrieved July 10 2017 from
<https://www.google.com.au/maps/@-34.062213,138.9060636>
Marston, S.A. 1988 Neighborhood and politics: Irish ethnicity in nineteenth century
Lowell, Massachusetts. Annals of the Association of American Geographers
78(3):414-432.
McCartney, D. 1968 The church and the Fenians. In M. Harmon (ed.), Fenians and
Fenianism: Centenary Essays, pp.11-23. Dublin: Scepter Books.
McCormick, F. 1976 A group of eighteenth century Clogher headstones. Clogher
Record 9(1):5-16.
McDougall, Vines and H. Hamnett 2004 Historic South Australian Graves and
Cemeteries Conservation Guidelines. Unpublished report for Department of
Environment and Heritage, SA Government.
McGuire, R.H. 1982 The study of ethnicity in historical archaeology. Journal of
Anthropological Archaeology 1:159-178.
McGuire, R.H. and L. Wurst 2002 Struggling with the past. International Journal of
Historical Archaeology 6(2):85-94.
Miller, K.A. 1980 Emigrants and exiles: Irish cultures and Irish emigration to North
America, 1790-1922. Irish Historical Studies 22(86):97-125.
Maloney, Rev. Fr. T.J. 1936 Early days and ways of Kapunda; Baker’s Flat, No man’s
land-a nursery of Catholicism in Australia. Southern Cross November 6, p.29.
Retrieved July 8 2017 from <http://trove.nla.gov.au/newspaper/article/167081160>
Moore, P. 1991 Half-burnt turf: Selling immigration from Ireland to South Australia,
1836-1845. In P. Bull, C. McConville and N. McLachlan (eds), Irish-Australian
Studies: Papers delivered at the Sixth Irish-Australian Conference July 1990,
pp.103-119. Bundoora: La Trobe University.
Morrissey, J. 2005 A lost heritage: The Connaught Rangers and multivocal Irishness. In
M. McCarthy (ed.), Ireland's Heritage: Critical Perspectives on Memory and
Identity, pp.71-88. Aldershot: Ashgate Publishing Limited.

104
Moyle, J. V. 1982 The Wakefield, its Waters and its Wealth: The Story of a Winding
River. Riverton: Moyle.
Muller, S. 2015 Colonial experiences of death, burial and memorialisation in West
Terrace Cemetery: applying a phenomenological approach to cultural landscapes in
historical archaeology. Australasian Historical Archaeology 33:15-26.
Muller, S. 2006 Colonial Experiences of Death and Burial: The Landscape Archaeology
of West Terrace Cemetery, Adelaide. Unpublished BArch (Hons) thesis, Department
of Archaeology, Flinders University, South Australia.
Mytum, H. 2013 Faith in action: Theology and practice in commemorative traditions. In
Symonds, J., A. Badcock and J. Oliver (eds), Historical Archaeologies of Cognition:
Explorations into Faith, Hope and Charity, pp.161-174. Sheffield: Equinox
Publishing.
Mytum, H. 2006 Popular attitudes to memory, the body, and social identity: the rise of
external commemoration in Britain, Ireland and New England. Post-Medieval
Archaeology 40(1):96-110.
Mytum, H. 2003/2004 Artefact biography as an approach to material culture: Irish
gravestones as a material form of genealogy. The Journal of Irish Archaeology
12/13:111-127.
Mytum, H. 2001 A long and complex plot: Patterns of family burial in Irish graveyards
from the 18th century. Church Archaeology 5/6:31-41.
Mytum, H. 2000 Recording and Analysing Graveyards. York: Council for British
Archaeology.
Mytum, H. and R. Evans 2002 The evolution of an Irish graveyard during the
eighteenth century: The example of Killeevan, Co. Monaghan. The Journal of Irish
Archaeology 11:131-146.
Nance, C. 1978 The Irish in South Australia. Journal of the Historical Society of South
Australia 5:66-73.
Niesingh, M. and A. Shackley 2009 Revegetation Action Plan, Clonlea Park.
Unpublished report for Town of Gawler Council and the Adelaide and Mount Lofty
Ranges Natural Resources Management Board.
Noye, R.J. 1975 Clare: A District History. Coromandel Valley: Lynton.
O'Farrell, P. 1987 The Irish in Australia. Kensington, NSW: New South Wales
University Press.
O’Halloran, Major T. 1849 St Patrick’s Society of South Australia. Adelaide Observer
July 14 1849. Retrieved February 24 2015 from
<http://trove.nla.gov.au/ndp/del/page/18836007>
Orser, C.E. Jr 1997 Archaeology and nineteenth-century rural life in County
Roscommon. Archaeology Ireland 11(1):14-17.

105
Phillips, J. 2012 Irish - Understanding the Irish conflict, Te Ara - the Encyclopedia of
New Zealand. Retrieved March 15 2015 from
<http://www.TeAra.govt.nz/en/irish/page-1>
Pike, D. 1967 Paradise of Dissent London: Longmans, Green and Co. Ltd.
Reckner, P.E. 2001 Negotiating patriotism at the Five Points: Clay tobacco pipes and
patriotic imagery among trade unionists and nativists in a nineteenth-century New
York neighborhood. Historical Archaeology 35(3):103-114.
Reid, R. 2011 Farewell My Children: Irish Assisted Emigration to Australia 1848-
1870. Spit Junction: Anchor Books Australia.
Richards, E. 1998 Irish women in colonial South Australia. In T. McClaughlin (ed.),
Irish Women in Colonial Australia. St. Leonards: Allen & Unwin.
Richards, E. 1991a The importance of being Irish in Colonial South Australia. In J.
O'Brien and P. Travers (eds) The Irish Emigrant Experience in Australia, pp.62-102.
Dublin: Poolbeg.
Richards, E. 1991b British poverty and Australian immigration in the nineteenth
century. In E. Richards (ed.), Poor Australian Immigrants in the Nineteenth Century,
Visible Immigrants: Two, pp.1-30. Canberra: Division of Historical Studies and
Centre for Immigration and Multicultural Studies, Research School of Social
Sciences, Australian National University.
Richards, E. 1991c Irish life and progress in colonial South Australia. Irish Historical
Studies 27(107):216-236.
Richards, E. 1986 The peopling of South Australia, 1836-1976. In E. Richards (ed.),
The Flinders History of South Australia: Social History, pp.115-142. Netley:
Wakefield Press.
Riordan, T.B. 1997 The 17th century cemetery at St Mary’s City: Mortuary practices in
the early Chesapeake. Historical Archaeology 31(4): 28-40.
Russell, M. 2015 Shamrock image. Retrieved January 10 2016 from
<http://www.theemeraldisle.org/irish-symbols/shamrock.htm>
Schulze, L. M. 2014 Graven Images: Gravestone motifs and their meanings. Retrieved
September 14 2014 from <http://www.olivetreegenealogy.com/misc/grave.shtml>
Sheehy, J. and G. Mott 1980 The Rediscovery of Ireland's Past: The Celtic Revival,
1830-1930. London: Thames and Hudson.
Smedley, A. 1998 "Race" and the construction of human identity. American
Anthropologist 100(3):690-702.
Smith, R. K. 2001 The cross: Church symbol and contest in nineteenth-century
America. Church History 70(4):705-734.
Sökefeld, M. 2001 Reconstructing identity. Anthropos 96(2):527-544.

106
South Australian Register 28 October 1899. Retrieved January 17 2014 from
<http://trove.nla.gov.au/ndp/del/article/54849821>
South Australian Register 6 June 1882. Retrieved January 17 2014 from
<http://trove.nla.gov.au/ndp/del/article/54849821>
Spencer, T. 1998 Colonel George Wyndham, 1st Lord Leconfield, and his agency in the
fledgling colony of South Australia, 1838-1860. South Australian Geographical
Journal 97:3-19.
Stangroom, J. 2014 Chi-square calculator. Retrieved October 6 2014 from
<http://www.socscistatistics.com/tests/chisquare2/Default2.aspx>
State Heritage Branch, Department of Environment and Natural Resources 1990
Mintaro: State Heritage Area. Retrieved April 14 2014 from
<www.environment.sa.gov.au>
Statton, J. and South Australian Genealogy and Heraldry Society 1986 Biographical
Index of South Australia, 1836-1886. Marden: South Australian Genealogy and
Heraldry Society.
Swiggum, S. 2014 The Ships List. Retrieved August 2013 to November 2014 from
<http://www.theshipslist.com/ships/australia/SAassistedindex.shtml>
Tarlow, S. 1999 Bereavement and Commemoration: An Archaeology of Mortality.
Oxford: Blackwell Publishers Ltd.
Topic Media 2014 Clare and Gilbert Valleys. Retrieved March 9 2015 from
<http://www.weekendnotes.com/gilbert-valley-sa/>
Trainor, T. Pers. Comm. via email November 1 2015.
University of Melbourne 2001 Basic outline map of South Australia. Retrieved July 1
2017 from
<http://library.unimelb.edu.au/collections/map_collection/map_collection_outline_m
aps>
Unknown 2014 Chi-square tutorial. Retrieved October 6 2014 from
<http://stattrek.com/chi-square-test/independence.aspx>
Unknown 2013 Headstone meanings. Retrieved October 1 2014 from
<http://www.gravesecrets.net/headstone-meanings.html>
Unknown 2010 Cremation in Australia. Retrieved June 28 2017 from
<https://australianmuseum.net.au/disposing-of-the-dead-cremation>
Unknown 1870 Vatican Council I Dogmatic Constitution “Dei Filius”. Retrieved
January 15 2016 from <inters.org/Vatican-Council-I-Dei-Filius>
Unknown 1857 The Shamrock. Ulster Journal of Archaeology 5:12-20.
Upton, D. 1996 Ethnicity, authenticity, and invented traditions. Historical Archaeology
30(2):1-7.

107
Walker, B. 1996 Irish Identity. In R. Davis, J. Livett, A. Whitaker and P. Moore (eds),
Irish-Australian Studies: Papers delivered at the Eighth Irish-Australian
Conference, Hobart July 1995, pp.37-51. Sydney: Crossing Press.
Walsh, K. 2001 The Changing Face of Australia: A Century of Immigration 1901-2000.
Crows Nest: Allen & Unwin.
Walter, B. 1986 Ethnicity and Irish residential distribution. Transactions of the Institute
of British Geographers, New Series 11(2):131-146.
Weiss, Prof. C. and K. Sosulski 2002-2003 Version 1.0 of the QMSS E-Lessons. The
Columbia Center for New Media Teaching and Learning (CCNMTL). Retrieved
October 6 2014 from <http://ccnmtl.columbia.edu/projects/qmss/home.html>
Whitworth, R.P. (compiler) 1866 Bailliere's South Australian Gazetteer and Road
Guide. Adelaide: Bailliere.
Wiessner, P. 1983 Style and social information in Kalahari San projectile points.
American Antiquity 48(2):253-276.

108
APPENDIX 1: Site Recording Form

109
APPENDIX 2: Photographic Recording Form
DATE PHOTO NUMBER
GRAVE REFERENCE
SUBJECT ORIENTATION SIGNATURE

110
Appendix 3: Mintaro Catholic Cemetery Site Plan

111
Appendix 4: Navan Catholic Cemetery Site Plan

112
Appendix 5: St John’s Catholic Cemetery, Kapunda, Site
Plan

113
Appendix 6: St Patrick’s Catholic Cemetery, Undalya, Site
Plan

114
Appendix 7: Christchurch Anglican Cemetery, Kapunda,
Site Plan

115
Appendix 8: Whip Street Anglican Cemetery, Saddleworth,
Site Plan

116
Appendix 9
Definition of terms
Irish – first generation migrant and two generations of their descendants
Grave Orientation
The direction in which the headstone faced, for example, if the head of the body was
situated at the eastern end of the grave the grave and the headstone were oriented
west. This was also considered and related to that of any church structure that may
have existed.
Family vs Individual Burial
Family proximity was considered in four ways: as a single burial, as a number of
family members buried in the same plot with multiple headstones, and as a single
headstone with multiple entries and as a number of single plots from the same family
who were buried adjacent to each other.
Headstones
Headstone shapes were categorised following Mytum (2000) as (Figure 9.1):
Celtic cross
Cross (all crosses other than Celtic)
Monument/Obelisk (tall structure atop stone base)
Slab/chest tomb
Tablet (Upright slab of stone)
Shape was assigned on the main feature of the headstone, e.g. if a tablet had a cross
as part of the structure, it was included in the cross section because it was a central
feature of the marker; similarly, this was adopted for a monument/obelisk, or similar,
with crosses at its apex.

117
Figure 9.1: Key headstone shapes. (Photos by J McEgan)
Motifs
Motifs on the graves were defined as any decorative element and images, but not
wording. The letters, ‘IHS’ were included as they are representative of the Greek
words for ‘Jesus’, but are not a word in themselves. Words were included in the
inscription category. All motifs associated with the grave were recorded, including
those on the headstone, footstone surrounding fencing.
The variation in motifs was extensive, requiring categorisation into groups of similar
sentiment according to the meanings of the individual motifs (Frei 2014; Schulze
2014; Unknown [Grave Secrets] 2013). The categories were as follows:
Emotive, which included affection, grief or loss. Motifs associated with
affection included those representing hope (e.g. anchors, or a cross that
represents Christ), remembrance (e.g. wreaths) and friendship (e.g. ivy,
which also represents immortality). Flowers denote innocence or
Celtic cross Cross Monument
Tomb
Tablet
Slab

118
immortality, while death and loss were represented by motifs such as
weeping cherubs or an urn covered with a cloth, and the fragility of life, or a
shortened life, was illustrated by a lily with a broken stem.
Irish symbols: Symbols known to have Irish connection, such as Celtic
crosses and shamrocks were included in this category. Examples of
geometric chevron design and scrolls (triskele) reminiscent of those at
Newgrange, County Meath (Figure 5.16) were also included.
No motifs (i.e. the headstone contained no decorative motifs)
Non-specific: Motifs with no apparent meaning were included in this
category. Examples were geometric designs, generic foliage (other than ivy
as previously mentioned or other significant species), waves and tulips.
Organisation/occupation: Any symbol associated with a particular
organisation, such as three linked chains for IOOF, or a symbol such as guns
for a soldier.
Religious: Symbols with Christian connotations, for example crosses, angels,
hands in prayer, crucifixes, chalices, rosary beads and the letters ‘IHS’.
The following groupings were devised for the numerous motifs which were
recorded, though some motifs, such as ivy, have two meanings (Table 9.1). Such
motifs were included in only one group.
Emotive
Affection Motifs
Friendship Urn with a flame
Hope Anchor, Rose
Immortality Ivy, Rope, Rocks
Innocence Daisy, Lily, Lily of the Valley
Life Lit candle, Tree
Remembrance Forget me not, Pansy, Wreath
Grief/loss
Death Urn draped with cloth
Fragility of life Lily with a broken stem
Mourning Draped cloth, Morning glory
Table 9.1: Emotive symbols and meanings.

119
Religious
This category had a number of depictions representing similar ideas. For example,
angels appeared in different poses but were all considered to be representative of
spirituality.
Motif Different depictions
Angel Pointing to heaven, praying, bowing, wings
Cherub Holding torch, Weeping
Christ Anchor & cross, IHS, Sacred heart
Cross Being held, on rocks, with kangaroo and sunrise
Crucifix
God Sun, Rays
Holy Spirit Dove
Holy Trinity Fleur de Lis
New life Scythe, Bundle of wheat
Objects associated with Mass Chalice, Communion stole, Rosary beads
Table 9.2 Religious motifs and meanings.
Fencing
Bow and Picket, illustration from Chicora Foundation
Spear head design Photo: J McEgan
Railing (Photo: J McEgan)
Figure 9.2: Elements of cast iron fencing.
(After Chicora Foundation 2008)

120
To simplify discussion of motifs represented in cast iron, motifs were grouped
according to the spear design on the fence under five collective headings. As no
definitive names for most of the cast iron spear designs were found, nominal titles
were given in order to distinguish them analytically. The variations were named, as
below, with the range in each category listed (See Figure 4.3 for some examples):
Arrowhead
a) Arrowhead picket and bow
b) Arrowhead picket within bow
c) Arrowhead/inverted Fleur de Lis picket
d) Arrowhead top railing, stylised Canterbury cross in body of fence
e) Double row, stylised arrowhead picket
f) Stylised arrowhead picket
g) Stylised arrowhead within bow.
Celtic cross
a) Celtic cross top railing
b) Double row, Celtic cross picket.
Fleur de Lis
a) Double row, stylised Fleur de Lis picket
b) Fleur de Lis picket within bow
c) Fleur de Lis top railing,
d) Stylised Fleur de Lis picket.
Shamrock
a) Double row, Shamrock picket
b) Shamrock and bow
c) Shamrock picket
d) Shamrock picket within bow
e) Shamrock top railing, stylised Canterbury cross in body of fence.

121
Figure 9.3: Examples of spear design fencing styles. (Other photos: J McEgan)
Results and discussion use the group name, as individual fence styles were
numerous, and variations not considered to be significant to this study. The
individual elements followed the descriptions given by the Chicora Foundation
(2008). (See Figure 4.2).
Railings
a) Double railing with marble corner posts
b) Double railing with metal corner posts
c) Double railing with wooden corner posts.
Fencing styles without a spear design were categorised as miscellaneous. This
included
a) Stylised Canterbury cross (Figure 4.4, left)
b) Inverted heart (Figure 4.4, right)
c) Stylised heart picket
d) Stylised cross.
All of these designs were in the body of the fences.
Celtic Cross Shamrock
Fleur de Lys Spear, photo from Chicora Foundation
Stylised Arrowhead

122
Figure 9.4: Miscellaneous fence styles. (Photos: J. McEgan)
The cornerstones and plinths beneath the structures were recorded for the sake of
completeness, but were not discussed in the results.
Inscriptions
Inscriptions were classified into five categories, with all wording analysed:
Emotive which was further divided into two sections: closeness and sadness.
Each included words, phrases and verses with sentimental connotations.
Closeness included examples such as ‘in loving memory’, ‘beloved’, ‘rest in
peace’. Sadness included words such as ‘loss’, ‘grief’, or ‘lamented’.
Euphemisms of death: phrases such as ‘departed from this life’, ‘asleep’,
‘gone home’, ‘passed from us’ and the word, ‘died’.
Biographical: basic information about the person/s buried including name,
date of birth/age at death/date of death, country of birth, relationship to
deceased, who erected the grave marker, time in Australia and occupational
or organisational membership.
Religious: any reference to Christian beliefs, such as God, Mary, Jesus,
heaven, souls and prayer. These occurred as phrases, verses or biblical
quotes, as well as the individual words of ‘pray’ and ‘Amen’.
Memento Mori: Literal evocations of death and the decay of the body These
were:
1. Beneath this stone lieth the mortal remains…..
2. Here lies all that is mortal….
3. Here lies the body…
Stylised Canterbury
Cross Inverted Heart
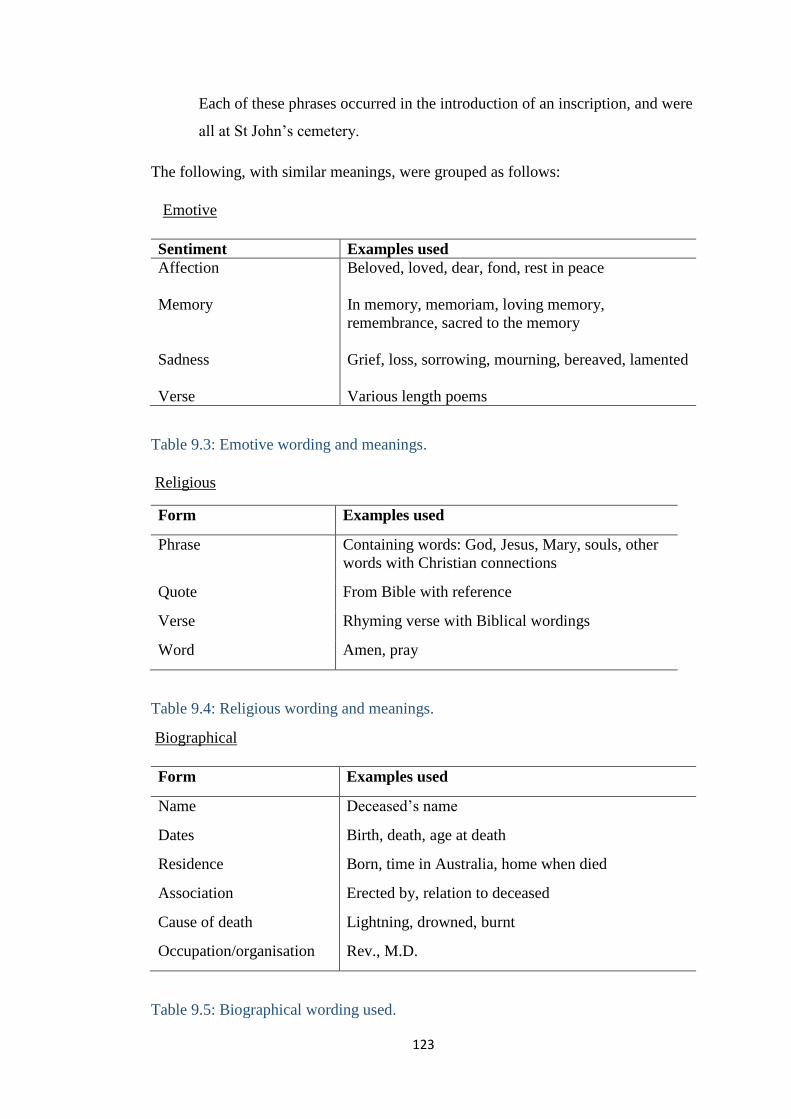
123
Each of these phrases occurred in the introduction of an inscription, and were
all at St John’s cemetery.
The following, with similar meanings, were grouped as follows:
Emotive
Sentiment Examples used
Affection Beloved, loved, dear, fond, rest in peace
Memory In memory, memoriam, loving memory,
remembrance, sacred to the memory
Sadness Grief, loss, sorrowing, mourning, bereaved, lamented
Verse Various length poems
Table 9.3: Emotive wording and meanings.
Religious
Form Examples used
Phrase Containing words: God, Jesus, Mary, souls, other
words with Christian connections
Quote From Bible with reference
Verse Rhyming verse with Biblical wordings
Word Amen, pray
Table 9.4: Religious wording and meanings.
Biographical
Form Examples used
Name Deceased’s name
Dates Birth, death, age at death
Residence Born, time in Australia, home when died
Association Erected by, relation to deceased
Cause of death Lightning, drowned, burnt
Occupation/organisation Rev., M.D.
Table 9.5: Biographical wording used.

124
The inscription was considered in two sections — the introduction (introductory
inscriptions), defined as any wording before the deceased person’s name, and the
epitaph, which included all wording from the name to the end of the inscription.
Chi-square test
The test required a sampling method for data collection with distinct variables. Four
steps were required to enable a Chi-square calculation to be performed:
1. Stating hypotheses
a. null hypothesis: variables A and B are independent
b. alternative hypothesis: variables A and B are not independent
2. Devising a plan of analysis to determine if the data rejects or accepts the
hypotheses, by
a. defining a significance level: 0.05 was used
b. having a test method which determined if a connection existed
between variables
3. Analysing the data by producing
a. Degrees of freedom
b. Expected frequencies
c. Test result: chi-square variable
d. P-value: the probability of a sample result as extreme as the test result
4. Interpreting the results by comparing the probability to the level of
significance. If it is less, the null hypothesis is rejected.
The formula to calculate the Chi-square is shown below:
The observed is the actual data of a feature.
Expected Frequencies
The expected frequency is the total of the features for a variable, multiplied by the
total of a particular feature divided by total of the sample, as seen by the following
formula,

125
Degrees of Freedom
Degrees of freedom were calculated by the following method. The number of
degrees is ‘equal to the number of columns in the table minus one multiplied by the
number of rows in the table minus one’ (Weiss and Sosulski 2002/2003). For
example, the rows in this study were two (variables) and the columns were also two
(features, such as types of headstones), thus
df = (2-1)(2-1)= 1
P-value
This is the probability that the chi-square statistic having the degree of freedom is
more extreme than the test result.
(Weiss and Sosulski 2002/2003; Unknown [Stattrek] 2014)
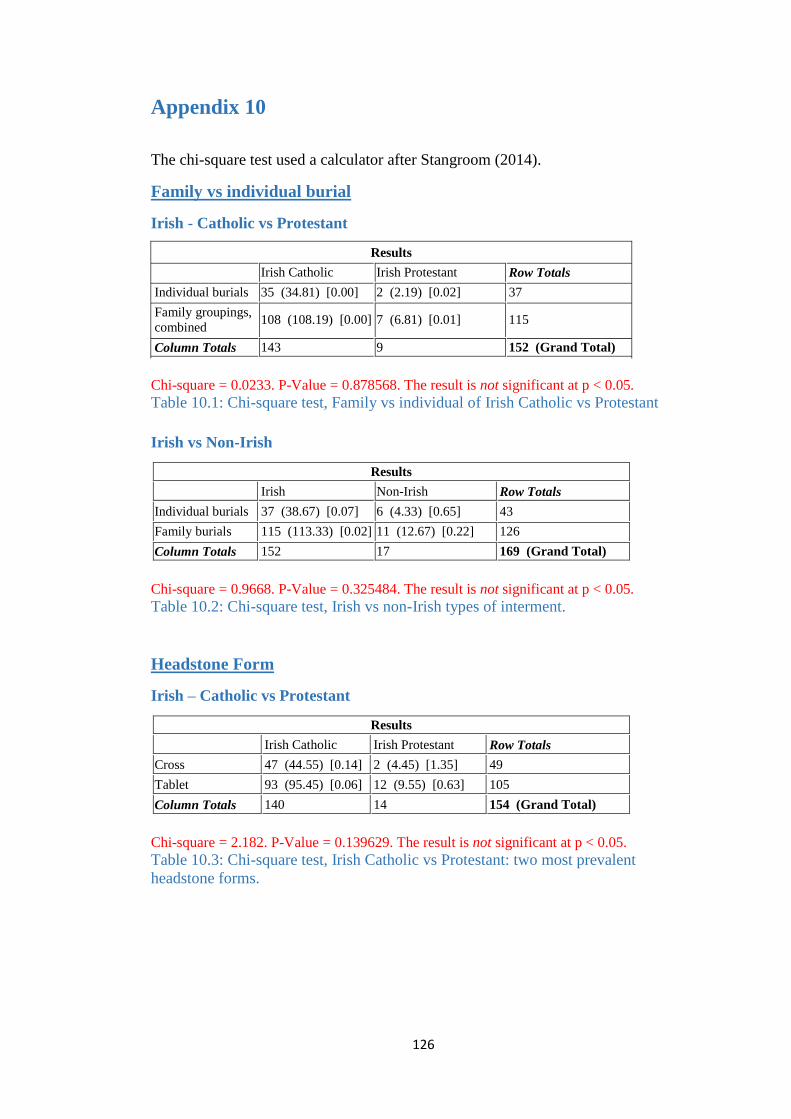
126
Appendix 10
The chi-square test used a calculator after Stangroom (2014).
Family vs individual burial
Irish - Catholic vs Protestant
Results
Irish Catholic Irish Protestant Row Totals
Individual burials 35 (34.81) [0.00] 2 (2.19) [0.02] 37
Family groupings,
combined 108 (108.19) [0.00] 7 (6.81) [0.01] 115
Column Totals 143 9 152 (Grand Total)
Chi-square = 0.0233. P-Value = 0.878568. The result is not significant at p < 0.05.
Table 10.1: Chi-square test, Family vs individual of Irish Catholic vs Protestant
Irish vs Non-Irish
Results
Irish Non-Irish Row Totals
Individual burials 37 (38.67) [0.07] 6 (4.33) [0.65] 43
Family burials 115 (113.33) [0.02] 11 (12.67) [0.22] 126
Column Totals 152 17 169 (Grand Total)
Chi-square = 0.9668. P-Value = 0.325484. The result is not significant at p < 0.05.
Table 10.2: Chi-square test, Irish vs non-Irish types of interment.
Headstone Form
Irish – Catholic vs Protestant
Results
Irish Catholic Irish Protestant Row Totals
Cross 47 (44.55) [0.14] 2 (4.45) [1.35] 49
Tablet 93 (95.45) [0.06] 12 (9.55) [0.63] 105
Column Totals 140 14 154 (Grand Total)
Chi-square = 2.182. P-Value = 0.139629. The result is not significant at p < 0.05.
Table 10.3: Chi-square test, Irish Catholic vs Protestant: two most prevalent
headstone forms.

127
Results
Irish Catholic Irish Protestant Row Totals
Celtic cross 8 (8.53) [0.03] 1 (0.47) [0.61] 9
Cross 47 (46.47) [0.01] 2 (2.53) [0.11] 49
Column Totals 55 3 58 (Grand Total)
Chi-square = 0.766. P-Value = 0.381457. The result is not significant at p < 0.05.
Table 10.4: Chi-square test, Irish Catholic vs Protestant: Celtic cross and other
cross forms.
Irish vs Non-Irish
Results
Irish Non-Irish Row Totals
Tablet 110 (109.95) [0.00] 8 (8.05) [0.00] 118
Slab/tomb 13 (13.05) [0.00] 1 (0.95) [0.00] 14
Column Totals 123 9 132 (Grand Total)
Chi-square = 0.0026. P-Value = 0.959345. The result is not significant at p < 0.05.
Table 10.5: Chi-square test, Irish vs non-Irish headstone forms: tablet and slab/tomb.
Chi-square = 2.9812. P-Value = 0.084236. The result is not significant at p < 0.05.
Table 10.6: Chi-square tests, Irish vs non-Irish headstone forms: tablet and cross
Motifs
Irish – Catholic vs Protestant
Results
Irish Catholic Irish Protestant Row Totals
Affection 58 (55.47) [0.12] 7 (9.53) [0.67] 65
Grief 6 (8.53) [0.75] 4 (1.47) [4.38] 10
Column Totals 64 11 75 (Grand Total)
Chi-square = 5.9167. P-Value = 0.014998. The result is significant at p < 0.05.
Table 10.7: Chi-square test, Irish Catholic vs Protestant: affection and grief.
Results
Irish Non-Irish Row Totals
Tablet 110 (106.96) [0.09] 8 (11.04) [0.84] 118
Cross 45 (48.04) [0.19] 8 (4.96) [1.86] 53
Column Totals 155 16 171 (Grand Total)

128
Results
Irish Catholic Irish Protestant Row Totals
Religious 143 (139.18) [0.10] 4 (7.82) [1.87] 147
No motif 35 (38.82) [0.38] 6 (2.18) [6.69] 41
Column Totals 178 10 188 (Grand Total)
Chi-square = 9.0341. P-Value = 0.0265. The result is significant at p < 0.05.
Table 10.8: Chi-square test, Irish Catholic vs Protestant: religious motifs and
no motifs.
Irish vs Non-Irish
Results
Irish Non-Irish Row Totals
Affection 65 (64.29) [0.01] 1 (1.71) [0.30] 66
Grief 10 (10.71) [0.05] 1 (0.29) [1.79] 11
Column Totals 75 2 79 (Grand Total)
Chi-square = 2.1389. P-Value = 0.143606. The result is not significant at p < 0.05.
Table 10.9: Chi-square tests, Irish vs non-Irish: affection and grief.
Results
Irish Non-Irish Row Totals
Religious 146 (145.02) [0.01] 12 (12.98) [0.07] 158
No motif 44 (44.98) [0.02] 5 (4.02) [0.24] 49
Column Totals 190 17 207 (Grand Total)
Chi-square = 0.3378. The P-Value is 0.561121. The result is not significant at p <
0.05. Table 10.10: Chi-square tests, Irish vs non-Irish: religious motifs and no motifs.
Fences/borders
Irish – Catholic and Protestant
Results
Irish Catholic Irish Protestant Row Totals
Cast iron picket 85 (84.32) [0.01] 6 (6.68) [0.07] 91
Railing 16 (16.68) [0.03] 2 (1.32) [0.35] 18
Column Totals 101 8 109 (Grand Total)
Chi-square = 0.451. P-Value = 0.501866. The result is not significant at p < 0.05.
Table 10.11: Chi-square test, Irish Catholic vs Protestant: cast iron picket and railing.

129
Results
Irish Catholic Irish Protestant Row Totals
Celtic cross 2 (2.81) [0.23] 1 (0.19) [3.52] 3
Shamrock 28 (27.19) [0.02] 1 (1.81) [0.36] 29
Column Totals 30 2 32 (Grand Total)
Chi-square = 4.1441. P-Value = 0.041781. The result is significant at p < 0.05.
Table 10.12: Chi-square test, Irish Catholic vs Protestant: Celtic cross and shamrock
as fencing spearheads.
Results
Irish Catholic Irish Protestant Row Totals
Cast iron picket 85 (85.44)[0.00] 6 (5.56) [0.04] 91
No border 38 (37.56) [0.01] 2 (2.44) [0.08] 40
Column Totals 123 8 131 (Grand Total)
Chi-square = 0.123. P-Value =0.725765. The result is not significant at p < 0.05.
Table 10.13: Chi square test, Irish Catholic vs Protestant: cast iron picket border and
no border.
Results
Irish Catholic Irish Protestant Row Totals
Kerb 12 (11.54) [0.02] 0 (0.46) [0.46] 12
No border 38 (38.46) [0.01] 2 (1.54) [0.14] 40
Column Totals 50 2 52 (Grand Total)
Chi-square = 0.624. P-Value =0.429565. The result is not significant at p < 0.05.
Table 10.14: Chi-square test, Irish Catholic vs Protestant: kerb border and no border.
Irish vs Non-Irish
Results
Irish Non-Irish Row Totals
Kerb 12 (11.61) [0.01] 1 (1.39) [0.11] 13
No border 38 (38.39) [0.00] 5 (4.61) [0.03] 43
Column Totals 50 6 56 (Grand Total)
Chi-square = 0.1616. P-Value =0.687668. The result is not significant at p < 0.05.
Table 10.15: Chi-square test, Irish vs non-Irish: kerb border and no border.
Results
Irish Non-Irish Row Totals
Celtic cross 3 (2.74) [0.02] 0 (0.26) [0.26] 3
Shamrock 29 (29.26) [0.00] 3 (2.74) [0.01] 32
Column Totals 32 3 35 (Grand Total)
Chi-square = 0.3076. P-Value =0.579146. The result is not significant at p < 0.05.
Table 10.16: Chi-square test, Irish vs non-Irish: Celtic cross and shamrocks as
fencing spearheads.
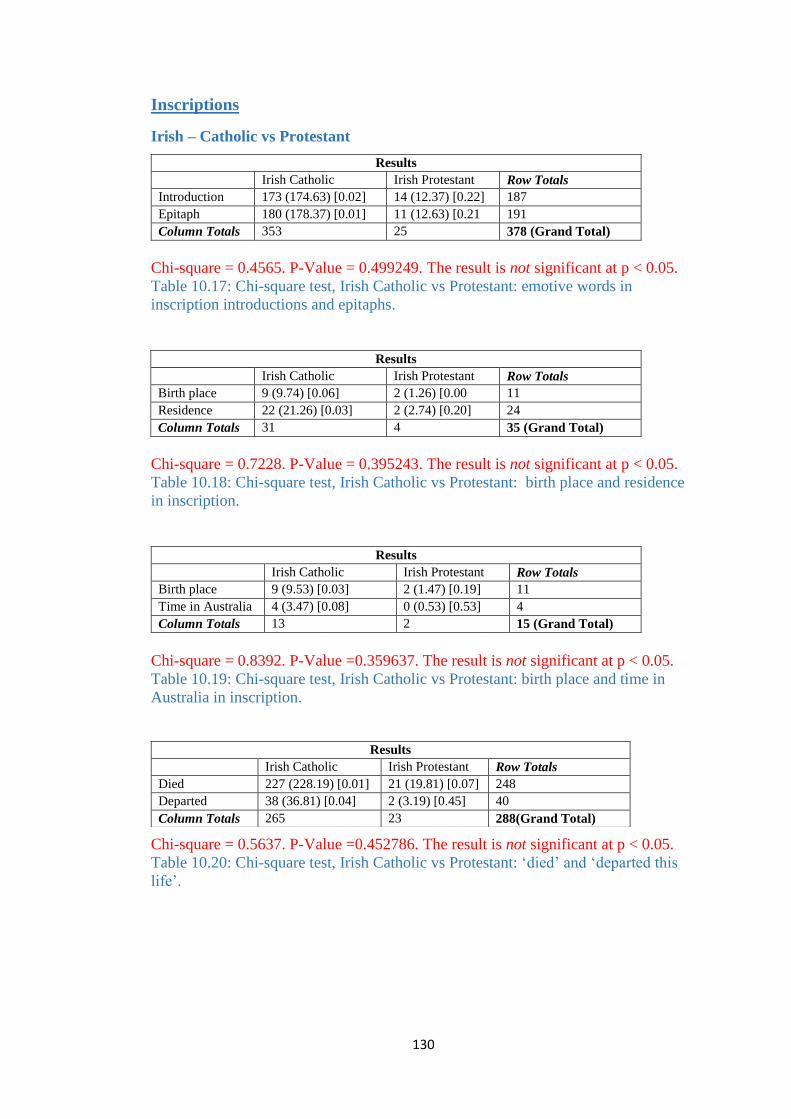
130
Inscriptions
Irish – Catholic vs Protestant
Results
Irish Catholic Irish Protestant Row Totals
Introduction 173 (174.63) [0.02] 14 (12.37) [0.22] 187
Epitaph 180 (178.37) [0.01] 11 (12.63) [0.21 191
Column Totals 353 25 378 (Grand Total)
Chi-square = 0.4565. P-Value = 0.499249. The result is not significant at p < 0.05.
Table 10.17: Chi-square test, Irish Catholic vs Protestant: emotive words in
inscription introductions and epitaphs.
Results
Irish Catholic Irish Protestant Row Totals
Birth place 9 (9.74) [0.06] 2 (1.26) [0.00 11
Residence 22 (21.26) [0.03] 2 (2.74) [0.20] 24
Column Totals 31 4 35 (Grand Total)
Chi-square = 0.7228. P-Value = 0.395243. The result is not significant at p < 0.05.
Table 10.18: Chi-square test, Irish Catholic vs Protestant: birth place and residence
in inscription.
Results
Irish Catholic Irish Protestant Row Totals
Birth place 9 (9.53) [0.03] 2 (1.47) [0.19] 11
Time in Australia 4 (3.47) [0.08] 0 (0.53) [0.53] 4
Column Totals 13 2 15 (Grand Total)
Chi-square = 0.8392. P-Value =0.359637. The result is not significant at p < 0.05.
Table 10.19: Chi-square test, Irish Catholic vs Protestant: birth place and time in
Australia in inscription.
Chi-square = 0.5637. P-Value =0.452786. The result is not significant at p < 0.05.
Table 10.20: Chi-square test, Irish Catholic vs Protestant: ‘died’ and ‘departed this
life’.
Results
Irish Catholic Irish Protestant Row Totals
Died 227 (228.19) [0.01] 21 (19.81) [0.07] 248
Departed 38 (36.81) [0.04] 2 (3.19) [0.45] 40
Column Totals 265 23 288(Grand Total)

131
Results
Irish Catholic Irish Protestant Row Totals
Sleep 1 (0.50) [0.50] 1 (1.50) [0.17] 2
Passed 0 (0.50) [0.50] 2 (1.50) [0.17] 2
Column Totals 1 3 4 (Grand Total)
Chi-square = 1.3333. P-Value =0.248213. The result is not significant at p < 0.05.
Table 10.21: Chi-square test, Irish Catholic vs Protestant: death euphemisms –
‘sleep’ and ‘passed’.
Results
Irish Catholic Irish Protestant Row Totals
Biblical verse 17 (18.45) [0.11] 4 (2.55) [0.82] 21
Religious phrase 77 (75.55) [0.03] 9 (10.45) [0.20] 86
Column Totals 94 13 107 (Grand Total)
Chi-square = 1.1648. P-Value = 0.280468. The result is not significant at p < 0.05.
Table 10.22: Chi-square test, Irish Catholic vs Protestant: biblical verses and
phrases.
Results
Irish Catholic Irish Protestant Row Totals
Religious word 29 (28.09) [0.03] 0 (0.91) [0.91] 29
Biblical quote 2 (2.91) [0.28] 1 (0.09) [8.76] 3
Column Totals 31 1 32 (Grand Total)
Chi-square = 9.9785. P-Value = 0.001584. The result is significant at p < 0.05.
Table 10.23: Chi-square test, Irish Catholic vs Protestant: biblical words and quotes.
Results
Irish Non-Irish Row Totals
Introduction 194 (201.44) [0.27] 22 (14.56) [3.80] 216
Epitaph 221 (213.56) [0.26] 8 (15.44) [3.58] 229
Column Totals 415 30 445 (Grand Total)
Chi-square = 9.264. P-Value = 0.002337. The result is significant at p<0.05.
Table 10.24: Chi-square test, Irish vs non-Irish: emotive words in introductions and
epitaphs.
Results
Irish Non-Irish Row Totals
Died 226 (226.36) [0.00] 23 (22.64) [0.01] 249
Departed this life 44 (43.64) [0.00] 4 (4.360 [0.03] 48
Column Totals 270 27 297 (Grand Total)
Chi-square = 0.0398. P-Value = 0.841952. The result is not significant at p < 0.05.
Table 10.25: Chi-square test, Irish vs non-Irish: ‘died’ and ‘departed this life.

132
Results
Irish Non-Irish Row Totals
Introduction 55 (52.47) [0.12] 1 (3.53) [1.82] 56
Epitaph 138 (140.53) [0.05] 12 (9.47) [0.68] 150
Column Totals 193 13 206 (Grand Total)
Chi-square = 2.6634. P-Value = 0.102684. The result is not significant at p < 0.05.
Table 10.26: Chi-square test, Irish vs non-Irish: words of association with deceased
in introductions and epitaphs.
Results
Irish Non-Irish Row Totals
Relationship 193 (193.18) [0.00] 13 (12.82) [0.00] 206
Erected by 48 3 (3.18) [0.01] 51
Column Totals 241 16 257 (Grand Total)
Chi-square = 0.0128. P-Value = 0.909759. The result is not significant at p < 0.05.
Table 10.27: Chi-square test, Irish vs non-Irish: relationship with the deceased and
who erected the headstone.
Results
Irish Non-Irish Row Totals
Birth place 11 (11.33) [0.01] 1 (0.67) [0.17] 12
Residence 23 (22.67) [0.00] 1 (1.33) [0.08] 24
Column Totals 34 2 36 (Grand Total)
Chi-square = 0.2647. P-Value = 0.606905. The result is not significant at p < 0.05.
Table 10.28: Chi-square test, Irish vs non-Irish: mention of birth place and residence
at death.

133
Appendix 11: Grave Data and Historical Research Data
The grave data and photographs are attached in electronic files:
Folder named Grave Data containing Excel files of recorded graves
Folder named Genealogical Data containing Excel files of historical research
Folder named Grave Reference Numbers containing Word files
Folder named Photographs containing 395 cropped images in jpg format