iron ore futures trading manual iron ore...figure 5: global iron ore and main steel producing area...
TRANSCRIPT


Dalian Commodity Exchange Investor Education Material
Futures Trading Manual Series
IRON ORE FUTURESTRADING MANUAL

23
2813
13
8
3
3
3
52
3
6
5
3
3
2
2
3
1
11
1
23
4
51
2
Distribution of DCE MembersBy Dec. 31, 2015
Guangdong
H.K.Macao
Hainan
GuangxiTaiwan
Fujian
Jiangxi Guizhou
Yunnan
Sichuan ChongqingHubei
Hunan
Anhui
HenanShaanxi
Shanxi
Hebei Tianjin
Beijing
Jilin
Heilongjiang
Gansu
Ningxia
Qinghai
Xinjiang
Tibet
Inner Mongolia
Shandong
Zhejiang
Shanghai
Jiangsu
Liaoning

CONTENTS
IRON ORE FUTURES TRADING MANUAL
01
010106
15
16161617
181818222223
24
25
28
I. Overview of Iron Ore
II. Overview of Production, Consumption and Circulation of Iron Ore
(I) Overview of Production, Consumption and Trade of Iron Ore in the World
(II) Overview of Production, Consumption and Trade of Iron Ore in China
III. Main Factors Influencing Iron Ore Price
IV. Measures of Risk Management of Iron Ore Futures Trading
(I) Margin Requirements
(II) Price Limits
(III) Position Limits
V. Procedures and Relevant Rules for Delivery of Iron Ore Futures
(I) General Delivery Rules
(II) Delivery Forms and Workflows
(III) Delivery Expenses
(IV) Flow of Warehouse Receipts
(V) Delivery Locations
Annex 1: DCE Iron Ore Futures Contract
Annex 2: DCE Iron Ore Delivery Quality Standard
Annex 3: List of Designated Delivery Warehouses for DCE Iron Ore Futures

1
I. Overview of Iron OreIron ore refers to the ore that has use value, contains iron element or iron compounds, and is exclusively used as the raw material for iron and steel production. Steel is the pillar industry of the national economy, and the iron ore is the most important raw material for iron and steel production. It takes about 1.6 tons of iron ore to produce 1 ton of cast iron, and iron ore accounts for more than 60% in the cast iron cost. Therefore, the iron ore is also an important raw material closely related to the national economy.
According to different physical forms, the iron ore family is divided into raw ore, lump ore, fine ore, ore concentrate, sintering ore, and pellet ore. The lump ore is a high grade ore that can be directly put into furnace; fine ore and ore concentrate can only be put into blast furnace after artificial agglomeration. Where, the fine ore is the main raw material to produce sintering ore, and ore concentrate is the main raw material to produce pellet ore. Based on the requirements of the spot market, the fine ore is selected as the subject matter for futures trading of iron ore.
In recent years, the steel industry has been rapidly developing in China, and the demand for iron ore is greatly increased, driving the iron ore output to constantly increase in China. The raw iron ore output in China was 218 million tons in 2001, which was increased year by year in the following years. By 2005, it reached 420 million tons with the year-on-year growth of 35.6%, which almost doubled that in 2001. In 2015, China had the raw iron ore output of 1.38 billion tons, equivalent to 470 million tons of ore concentrate, consumed about 1.105 billion tons of iron ore, and imported 950 million tons of iron ore and its ore concentrate.
In recent years, the annual price negotiation system of iron ore is collapsed, and the trade price violently and frequently fluctuates along with market changes, so enterprises have strong demand for risk avoidance. From 2014 to the beginning of 2016, the price fluctuates between RMB300-900/ton, with the maximum fluctuation of more than RMB600/ton, and the maximum drawdown of nearly 45% within a year. Dalian Commodity Exchange (DCE) pushes forward futures trading of iron ore following the financialization trend of iron ore, so as to facilitate spot enterprises’ management of market price fluctuation risks, improve the iron ore pricing system.
II. Overview of Production, Consumption and Circulation of Iron Ore(I) Overview of Production, Consumption and Trade of Iron Ore in the World
1. Production of Iron Ore in the World
(1) The Iron Ore Output is on the Rise in the World as a Whole
After 2000, rapid development of the iron and steel industry in the world, especially in Asia, drove the iron ore consumption in the world to significantly increase, thereby promoting the global iron ore production. Between 2002 and 2011, the overall output was increased by 1.05 billion tons. The annual growth was about 105 million tons, and the average annual growth rate was 8.49%. Especially from 2003 to 2007, the average annual growth rate was more than 10%. In 2011, the global iron ore output was 1.943 billion tons.

2
(2) Iron Ore Production is Centralized in the World
South America, Asia and Oceania provide the main sources of global iron ore in recent years, and the countries producing iron ore in these regions mainly include Brazil, China, India and Australia. The raw ore output in Australia was 804 million tons in 2015, increased by 32% compared with that in 2013. The raw ore output in Brazil was 417.83 million tons in 2015, increased by 6.8% compared with that in 2013. Sum of the output of Australia and Brazil producing iron ore accounting for 56.1% of the global.
In 2012, influenced by the price fluctuation of iron ore, the global output, seeing its first decline since the 2009 financial crisis, was reduced to 1.87 billion tons. However, it roseagain and reached 1.927 and 2.0 billon tons in 2013 and 2014, respectively. The global output of iron ore in 2015 was 2.178 billion tons.
Table 1: Production situation of iron ore in top 5 countries ranked according to the iron ore output except China between 2008 and 2015
Source: IISI, Steel Statistical Yearbook
Iron Ore Futures Trading Manual
Unit:million tons
Source: IISI, Steel Statistical Yearbook
Figure 1: Global iron ore output trend between 2001 and 2015
2500
2001 2002 2003 2004 2005 2006 2007 2008 2009 2010 2011 2012 2013 2014 2015
2000
1500
1000
500
0
Unit:million tons
Brazil
Australia
India
United States
CIS
Whole world
% of the top 5 countries
2008
346.00
349.82
223.00
53.60
171.08
1716.77
66.61%
2009
305.00
394.07
223.60
26.70
157.88
1589.09
69.68%
2010
372.00
432.78
209.00
49.90
178.23
1870.06
66.41%
2011
397.00
477.33
191.80
54.70
185.00
1943.79
67.18%
2012
380.09
520.03
152.60
54.00
184.17
1931.36
66.84%
2013
391.10
608.90
136.10
52.00
186.20
1977.24
69.51%
2014
399.40
723.70
129.80
54.30
183.86
2001.13
74.51%
2015
417.83
804.75
106.94
39.97
186.71
2178.27
71.44%

3
Table 2: Iron ore output of 3 major manufacturers between 2008 and 2015(Unit: million tons)
Source: Annual report disclosed by each company
Manufacturer
VALE
BHP
RIO
Total
Proportion in the global output (%)
2008
293.37
112.26
153.40
559.06
31%
2009
229.34
125.11
171.50
525.95
33%
2010
309.46
128.06
184.63
622.15
33%
2011
322.60
149.40
191.77
663.77
32.5%
2012
319.90
160.80
199.00
679.70
36%
2013
300.00
170.00
266.00
736.00
38%
2014
332.00
204.00
295.00
831.00
32.5%
2015
339.00
261.00
328.00
928.00
42.6%
(3) The Three Major Mines Have Obvious Supply Advantages
The three largest iron ore production companies in the world include the Rio-Tinto, BHP Billiton in Australia and VALE in Brazil, which respectively produced 328, 261 and 339 million tons of iron ore in 2015.
2. Iron Ore Consumption in the World
(1) Global Iron Ore Consumption was Decreased in 2015
In 2015, the global iron ore consumption was 2086 million tons, decreased by 2.04% compare to 2014, where the iron ore consumption was decreased by 2.23%, 3.48%, 12.45% and 0.91% respectively in China, Japan, United States and Europe. However, the iron ore consumption in India and Korea was increased by 2.36% and 1.58% in 2015.
(2)The Demand in China is the Main Driving Force
Even though Chinese demand for iron ore slipped since the raw steel output decreased in 2015, the consumption of iron ore in China ranks the top, accounting for 60.94% in the world. The proportion of Europe, Japan and India consumption in the aggregate consumption of the world was 7.36%, 6.14% and 5.37% respectively.

4
Figure 3: Distribution of countries exporting iron ore to China in 2015
Source: General Administration of Customs of the People's Republic of China
(3) Import Sources are Different in Each Country of the World
Japan depends on import of more than 99% of iron ore, 61% of which was imported from Australia, 21% from Brazil, 8% from India and 4% from South Africa. South Korea, Germany and Italy also depend on import of almost 100% iron ore mainly from Brazil and Australia; the United States depends on import of about 50% iron ore mainly from Australia, Brazil, India, South Africa and Venezuela; the iron ore in Russia, Ukraine, India and Brazil mainly comes from themselves. In 2015, among China’s imported iron ore, 65.12% came from Australia, 20.55% from Brazil, 0.22% from India and 4.87% from South Africa.
Australia
Brazil
India
South Africa
Others
Iron Ore Futures Trading Manual
Source: IISI, Steel Statistical Yearbook
Figure 2: Changes of the proportion of the apparent consumption of iron orein main countries in the global consumption between 2010 and 2015
100%
90%
80%
70%
60%
50%
40%
30%
20%
10%
0%
China Japan Russia United States Brazil Germany Ukraine India Korea France
2010 2011 2012 2013 2014 2015
5
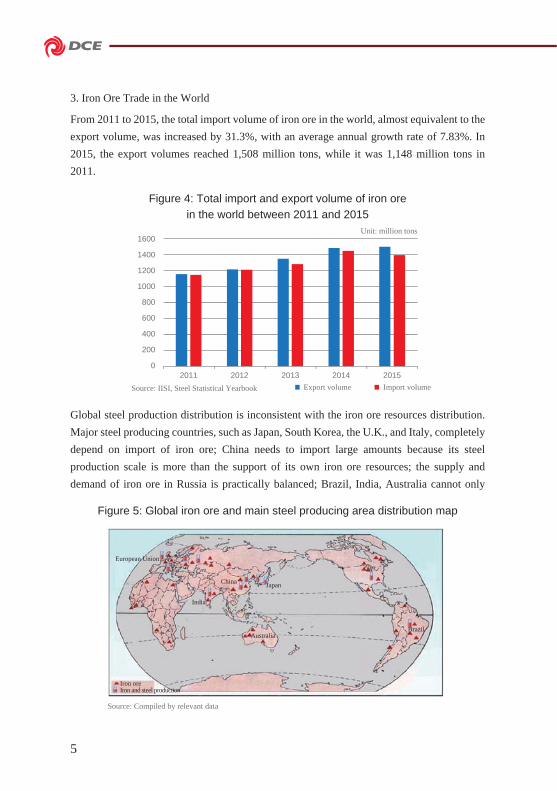
3. Iron Ore Trade in the World
From 2011 to 2015, the total import volume of iron ore in the world, almost equivalent to the export volume, was increased by 31.3%, with an average annual growth rate of 7.83%. In 2015, the export volumes reached 1,508 million tons, while it was 1,148 million tons in 2011.
Global steel production distribution is inconsistent with the iron ore resources distribution. Major steel producing countries, such as Japan, South Korea, the U.K., and Italy, completely depend on import of iron ore; China needs to import large amounts because its steel production scale is more than the support of its own iron ore resources; the supply and demand of iron ore in Russia is practically balanced; Brazil, India, Australia cannot only
Figure 4: Total import and export volume of iron ore in the world between 2011 and 2015
Source: IISI, Steel Statistical Yearbook
Unit: million tons
Import volumeExport volume
1600
2011 2012 2013 2014 2015
1400
1200
1000
800
600
400
200
0
Figure 5: Global iron ore and main steel producing area distribution map
Source: Compiled by relevant data
Iron oreIron and steel production
European Union
India
China Japan
AustraliaBrazil

6
meet their own domestic demand for iron ore, but also export large amounts. The world iron ore trade forms a pattern of exporting from Australia, Brazil and India etc. to China, Japan and the European Union countries etc.
(II) Overview of Production, Consumption and Trade of Iron Ore in China
1. Production of Iron Ore in China
(1) The Production is Increasing
In recent years, the steel industry in China has rapidly developed, and there is substantially increased demand for iron ore, driving the iron ore output in China to be constantly increased.
The raw ore output in China was 218 million tons in 2001, decreased by 2.5% compared with that in 2000. After that, it was increased year by year. By 2005, it reached 420 million tons with the year-on-year growth of 35.6%, which almost doubled that in 2001. The raw iron ore output reached 1.38 billion tons in 2015.
(2) Production in the Bohai Rim Region is the Largest
From the perspective of different regions, the raw iron ore output in the Bohai Rim Region represented by Hebei and Liaoning provinces is the largest, and is close to 50% of the total output of China. If Shanxi and Inner Mongolia near the Bohai Rim Region are considered, the output in this region will account for more than 60% in the national output.
Unit: million tons
Figure 6: Raw iron ore output in China between 2000 and 2015
Source: Metallurgical Mines' Association of China (MMAC)
1600
2000 2001 2002 2003 2004 2005 2006 2007 2008 2009 2010 2011 2012 2013 2014 2015
1400
1200
1000
800
600
400
200
0
Iron Ore Futures Trading Manual

7
Table 3: Details of raw iron ore output in main provinces of China in 2015
Source: China Iron and Steel Association (CISA)
Figure 7: Regional distribution of raw iron ore output in China in 2015
Source: National Bureau of Statistics of the People's Republic of China
Region
Hebei
Sichuan
Liaoning
Shanxi
Inner Mongolia
Output (million tons)
510
200
176
70
82
37.0
4.50
12.80
5.00
5.90
Proportion in thenational output (%)
(3) Iron Ore Production Areas are Centralized
From the perspective of different provinces, iron ore is not exploited in Tianjin, Shanghai, Ningxia and Tibet due to restrictions by resources, but is produced in all other areas. Where in 2015, the output in Hebei and Sichuan is high, and is respectively 510 million tons and 200 million tons. In addition, the output in Liaoning, Shanxi and Inner Mongolia is also high, and is respectively 176, 69.80 and 81.56 million tons. The iron ore output in Hebei, Liaoning, Sichuan, Inner Mongolia and Shanxi accounts for about 75% of the total output in China. As shown in the figure, the proportion of output in Hebei is the highest (37%); followed by Sichuan (14.5%); the proportion of output in Liaoning, Shanxi and Inner Mongolia is respectively 12.8%, 5.0% and 5.9%.
The output in Hebei and Liaoning is high, and is more than 50% of the total output. The iron ore output in Sichuan is increased rapidly in recent five years, and that in other provinces and cities is not significantly changed. The iron ore production areas are centralized in China.
14% Sichuan
13% Liaoning
5% Shanxi
6% Inner Mongolia
Hebei 37%
Others 25%

8
Table 4: Top 10 raw iron ore producers in China in 2015
Source: China Iron and Steel Association (CISA)
Company
Anshan Iron & Steel Mining
Taiyuan Iron & Steel Mining
Panzhihua Iron & Steel Mining
Hebei Iron & Steel Mining
Benxi Iron & Steel Group
Baosteel Group
Jiuquan Iron & Steel Group
Maanshan Iron & Steel Mining
Minmetals Hanxing Mining
Shougang Mining
Total
Proportion in the total output of China (%)
Province
Liaoning
Shanxi
Sichuan
Hebei
Liaoning
Inner Mongolia
Gansu
Anhui
Hebei
Hebei
Raw ore output
51.2553
33.8247
32.0726
32.8086
22.7986
20.6532
9.7926
17.4874
11.1722
12.8316
244.6968
17.72%
Figure 8: Proportion of iron ore output in various provinces and cities of China between 2010 and 2015
Source: China Iron and Steel Association (CISA)
Unit: million tons
(4) Concentration Degree of Iron Ore Production is Relatively LowMost iron ore producers in China are small miners, and the concentration degree of iron ore production is low. The sum of output in top 10 producers, which are all state-owned enterprises, is less than 18% of the total output.
Iron Ore Futures Trading Manual
90%
Hebei
20112010 2012 2013 2014 2015
80%
70%
60%
50%
40%
30%
20%
10%
0%
Liaoning Sichuan Inner Mongolia Shanxi Anhui

9
Figure 9: Iron ore demand trend in China between 2010 and 2015
Source: Metallurgical Mines' Association of China (MMAC)
2. Iron Ore Consumption in China
(1) The Iron Ore Demand is Increasing Year by Year in China
Steel mills are final consumers of iron ore, and the steel productivity distribution determines the iron ore consumption pattern. From the perspective of historical situation, the iron ore demand is gradually increasing in China. In 2008, the cast iron output was 469 million tons in China, and the demand for iron ore was about 750 million tons. By 2009, the cast iron output was increased to 544 million tons, and the demand for iron ore was about 870 million tons with the year-on-year growth of 15.9%. In 2014, the cast iron output rose to 712 million tons and the demand for iron ore was about 1,140 million tons. In 2015, the cast iron output dropped slightly to 691 million tons, and the demand for iron ore was about 1,105 million tons. The iron ore output in China was also increased with the increase of the consumption all the time. But in 2010, the iron ore consumption growth rate in China was obviously slowed down. On the one hand, the restricted steel productivity reduced the demand for iron ore; on the other hand, the constantly increasing iron ore price also increased the risks of hoarding and speculation of iron ore, and inhibited the speculative demand.
(2) Demand for Iron Ore in China is Centralized
From the perspective of cast iron output, the cast iron output is high in Hebei. The iron and steel output was 170 million tons in Hebei in 2015, and the cast iron output in Shandong, Liaoning and Jiangsu is more than 65 million tons in recent two years. There is main demand for iron ore in these provinces.
From the perspective of proportion in various provinces and cities, in recent six years, the proportion of cast iron output in Hebei, Shandong, Liaoning, Jiangsu, Shanxi, Hubei and Henan is practically stable with a little change, and the sum of proportion in other provinces and cities is decreased slightly. From the perspective of overall proportion, the output in the top 7 provinces and cities ranked according to the cast iron output accounts for about 67% of the total output, suggesting that the demand for iron ore in China is also centralized.
2010
1200Unit: million tons
1000
800
600
400
200
02011 2012 2013 2014 2015

10
Source: SteelHome.com
Table 5: Cast iron output in various regions of China in 2015
Province
Hebei
Shandong
Liaoning
Jiangsu
Shanxi
Hubei
Henan
Output (million tons)
174
67
61
70
36
23
29
Proportion in the totaloutput of China (%)
25.18
9.70
8.83
10.13
5.21
3.33
4.20
Figure 10: Proportion of cast iron output in various provinces and cities of China
Source: Statistical Yearbooks of China over the years
(3) Demand for Iron Ore is Centralized in the Bohai Rim RegionFrom the perspective of regions, the cast iron output in Hebei, Shandong and Liaoning accounts for 43% of the total output of China; the cast iron output in Jiangsu is 70 million tons, accounts for 10% of the total output, which is only about 1/3 of that in the above three provinces. From the perspective of the regional demand, the demand for iron ore is also centralized in the Bohai Rim Region.
3. Iron Ore Trade in China
(1) Rapid Growth of Import Volume of Iron Ore in China
China is the biggest iron and steel producer in the world. However, as its iron ore cannot meet the demand of iron and steel production due to output and grade etc., China needs to import a large amount of iron ore.
Iron Ore Futures Trading Manual
100%
90%
80%
70%
60%
50%
40%
30%
20%
10%
0%2010 2011 2012 2013 2014 2015
Hebei Shandong Liaoning Jiangsu Shanxi Hubei Henan Others

11
In 2001, China imported iron ore of 92.393 million tons, which was increased by 32.04% than the previous year. By 2002, the iron ore imported by China was more than 100 million tons, reaching 111 million tons with the year-on-year growth of 20.67%. Since then, the import volume of iron ore in China has always remained high with the annual growth rate of over 30%. In 2010, the import growth of iron ore in China was somewhat slowed down, slightly lower than that in 2009, and terminated the rapidly rising trend since 2000, followed by the slowly rising trend. During this period, the average annual growth rate of import volume of iron ore in China was 21.8%. The constantly rising import volume also allows the iron ore import dependency of China to be constantly improved. The iron ore import dependency of China was about 63% in 2012. China imported 930 and 950 million tons of iron ore in 2014 and 2015, respectively.
(2) Import Proportion of Iron Ore in China is Stable and Tends to be Diversified
From the perspective of the import proportion, the proportion of iron ore imported to China is stable. Since 2012, the volume and amount of iron ore imported by China from the top 5 countries ranked according to the volume of iron ore exported to China have always accounted for about 80% of the total import volume. In particular, the total proportion of Australia and Brazil over the years is over 65%. The proportion of Australian iron ore was considerably increased. From the perspective of the scope of countries, China imported from increasing number of countries, showing that the sources of iron ore imported by China are gradually diversified.
Figure 11: Import volume of iron ore in China between 2000 and 2015
Source: General Administration of Customs of the People's Republic of China, The Chinese Academy of Industry Economy Research
Unit: million tons
1200
1000
800
600
400
200
2000 2001 2002 2003 2004 2005 2006 2007 2008 2009 2010 2011 2012 2013 2014 2015
0

12
Table 6: Top 5 countries ranked according to the volume and amount exported to China between 2012 and 2015
Source: Mysteel.com
Country
Australia
Brazil
India
South Africa
Iran
Total
Australia
Brazil
South Africa
Iran
Ukraine
Total
Australia
Brazil
South Africa
Iran
Ukraine
Total
Australia
Brazil
Ukraine
South Africa
Iran
Total
351
164
33
40
17
605
417
155
43
22
16
537
548
171
44
21
19
803
607
192
20
45
13
877
44,905
22,630
3,681
5,528
1,815
78,559
54,936
21,424
6,024
2,377
2,329
69,581
54,370
17,991
4,874
1,859
2,273
81,367
35,859
12,165
1,518
3,063
688
53,293
47.24
22.07
4.44
5.38
2.29
81.42
50.85
18.90
5.24
2.68
1.95
79.63
58.92
18.39
4.73
2.26
2.04
86.34
63.89
20.21
2.10
4.74
1.37
92.31
46.97
23.67
3.85
5.78
1.90
82.17
51.97
20.27
5.70
2.25
2.20
82.39
58.09
19.22
5.21
1.99
2.43
86.93
62.26
21.12
2.64
5.32
1.19
92.53
Year
2012
2013
2014
2015
Export volume (million tons)
Export amount (US$ million)
Proportion ofvolume (%)
Proportion ofamount (%)
Iron Ore Futures Trading Manual
(3) Imported Iron Ore is Mainly Centralized in the Bohai Rim Region
From the perspective of import customs, over 50% of imported iron ore is declared to customs in the Bohai Rim Region, showing that the Bohai Rim Region is the most important region for China to import iron ore. Besides, iron ore imported to China is often unloaded in ports of these customs.

13
Figure 12: Proportion of iron ore imported from various customs in 2015
Figure 13: Proportion of imported iron ore in various provinces and cities in 2015
Source: Mysteel.com
Source: Mysteel.com
As can be seen from the provinces importing iron ore in 2015, the proportion of import was higher than 15% in Hebei and Shandong, slightly lower but still more than 13% in Jiangsu, and more than 4% in Shanghai and Tianjin. The total proportion of the top 5 provinces in the total import volume was 69%. As can be seen from the situation over the years, the overall proportion of the top 5 provinces and cities is stable, but the proportion of some provinces and cities fluctuates.
As can be seen from the proportion of imported iron ore in various provinces and cities between 2012 and 2015, the proportion of import in Hebei, Shandong and Jiangsu was still high, while the ranking of other provinces and cities was basically stable.
2% Shanghai Customs
6% Hangzhou Customs
5% Dalian Customs
5% Tianjin Customs
11% Nanjing Customs
28% Hebei
16% Shandong
13% Jiangsu
28% Shijiazhuang Customs
Qingdao Customs 15%
Shanghai 5%
Tianjin 7%
Liaoning 4%
Others 27%
Others 28%

14
Source: Mysteel.com
Table 7: Proportion of imported iron ore in the top 6 provinces between 2012 and 2015
Province
Hebei
Shandong
Jiangsu
Shanghai
Tianjin
Liaoning
Others
Province
Hebei
Shandong
Jiangsu
Shanghai
Beijing
Liaoning
Others
Province
Hebei
Shandong
Jiangsu
Shanghai
Tianjin
Liaoning
Others
Province
Hebei
Shandong
Jiangsu
Shanghai
Tianjin
Liaoning
Others
22.88
19.53
11.51
6.05
5.6
3.8
30.62
Proportionof import
Proportionof import
Proportionof import
Proportionof import
2012
22.83
20.02
13.06
4.88
5.86
3.91
29.43
2013
25.05
18.92
13.12
4.62
7.63
3.76
26.88
2014
28.12
15.95
13.64
4.83
6.72
3.99
26.76
2015
(4) International Transportation Depends on Sea Transportation, While Internal Transportation Combines a Variety of Ways
The international trade of iron ore is basically focused on sea trade, and rail transport and other means account for less than 10%. In 2015, the total volume of global iron ore trade was 1.381 billion tons, with year-on-year growth of 1.8% which was the lowest since 2001.
The iron ore produced in China, seldom inter-provincially transported, is generally consumed nearby, and is usually transported by means of short haul, auto for instance. Imported seaborne iron ore is transferred to inland through long-distance transportation tools, such as water transport and train, because the iron ore must be unloaded in port.
(5) Regional Flow Direction is Clear
As can be seen from the table below, there are surplus iron ore in Hebei, Shandong, Beijing, Shanghai and Inner Mongolia, which are the main places for outflow of iron ore, while Shanxi, Henan, Hubei, Jiangsu, Hunan and Yunnan are short of iron ore, and are the main places for inflow of iron ore. Therefore, China may be divided into three regions according to the latitude:
a. North region: It means the area to the north of Huaihe River and Tongbai Mountain line, which can be further subdivided into Bohai Rim and surrounding areas, other northeast areas, central area and northwest area. This region is mainly intended to unload imported ore through the Bohai Rim port, and transport the ore to steel mills by rail.
b. Yangtze River Delta Region and areas along the Yangtze River: It is mainly intended to import ore using the port near Yangtze Estuary, which is then transported to docks along the Yangtze River through waterway-waterway transit; some ore is transported to inland steel mills by rail via Beilun port or after going ashore.
Iron Ore Futures Trading Manual

15
c. South China: It refers to the area to the south of Nanling, including four provinces, namely Guangdong, Guangxi, Yunnan and Hainan. The ore unloaded in southern coastal ports is mainly transported to steel mills by rail.
III. Main Factors Affecting Iron Ore Price1. Cost
The iron ore cost is influenced by a series of factors, such as mining equipment, labor cost, water and electricity cost required for mining, relevant taxes, and freight etc., which all affect the CIF of iron ore, thereby affecting the ore market price.
2. Policy
Iron ore is an international bulk commodity, and its price is influenced by all kinds of policy factors, such as import and export policy in the country of origin, tariff policy in the importing country, and steel and iron industry development policy in the consumer country, which all affect the iron ore price.
3. Output Changes
The productivity and output fluctuations of iron ore influence the market price. If the mining enterprises stop production or reduce output due to equipment maintenance and natural conditions etc. of the production enterprises, the iron ore price will also change accordingly.
4. International Trade Price
As the iron ore import dependency is high in China and the international ore price is strongly correlated with the domestic price, the changes of the international market price will be transferred to the domestic price, thereby affecting the market price of iron ore.
5. Downstream Demand Changes
The market price of iron ore will also fluctuate with the downstream demand changes. The market price will rise when the downstream consumption grows under short supply, and will fall when the downstream consumption declines under ample supply.
6. Substitute Product Price
The price will decline when the iron ore market price is high and the price of the substitute product such as scrap steel is low.
7. Inventory Changes
Inventory changes will also affect the market price of iron ore. For example, the price will decline when local inventory level rises and traders are willing to sell, and will fall when traders hoard up goods for short of local inventory.
8. Macroeconomic Situation
Healthy and rapid macroeconomic development plays a role in strongly supporting and driving the iron ore market. Macroeconomics affects the iron ore market changes mainly

16
Table 8: Margins of Iron Ore Futures Contract Approaching Delivery Day
Trading Date
The tenth trading day of the monthimmediately preceding the delivery month
The first trading day of the delivery month
Margins
10% of contract value
20% of contract value
Table 9: Margins of Iron Ore Futures Contract with Different Sizes of Open Interest
Long and Short total open interest ofcontracts matured in a certain month (N)
N ≤ 800,000 contracts
N > 800,000 contracts
Margins
5% of contract value
7% of contract value
Table 10: Levels of Margins When Price Limits are Touched Consecutively(*Subject to the latest announcement of the Exchange)
Price Limit
4%
6%
8%
Margins
5%
8%
10%
through influencing the needs of the downstream industry. In other words, macroeconomic performance is a barometer of the market demand for iron ore, and has significant influence on the pricechanges. When the macroeconomic operation is good, construction industry, automobile manufacturing industry and other related industries have strong demand for steel, which will drive the demand of iron ore correspondingly, and support to keep its price high.
IV. Measures of Risk Management of Iron Ore Futures Trading(I) Margin Requirements
The minimum trading margin of iron ore futures contract is 5% of the contract value. The Exchange sets up different levels of margins which are increased with the size of open interest and the time approaching the delivery day. (Subject to the latest announcement of the Exchange)
(II) Price Limits
The price limit of iron ore futures contract is 4% of the settlement price of the previous trading day. When the price limits are touched consecutively, the Exchange will raise the price limit. See Table 10.
Iron Ore Futures Trading Manual
Trading Situation
1 price limit
2 price limit
3 price limit
st
nd
rd

17
Product
Iron Ore
Open interests
Open interests≤200,000
Open interests>200,000
Broker members
Unlimited
Open interests×25%
The position limits of Non-Brokerage members and clients in ordinary months (from the contract launch day to the 9th trading day of the month immediately preceding the delivery month)
(Unit: Contract)
When three price limits in the same direction are touched consecutively, the same risk control measures as those for coke and coking coal futures trading will be resorted to. When one-sided market in the same direction occurs and an iron ore futures contract touches the price limits on a trading day and the following two trading days (D and D , D respectively), i.e., the price limits in the same direction are touched on three consecutive days, if D is the last trading day of the contract, then physical delivery is conducted; if
D is the last trading day, then the trading on D continues at the price limit and level of margin of D . Except for the two circumstances above, on D the Exchange can decide and announce to take either of the two following measures according to market situation:
Measure I: On D , the Exchange may take one or several of the following measures to avert market risks: increasing some or all members’ one-way or bilateral margins with the same or different proportions, suspending new positions of some or all members, adjusting price limits, restricting withdrawing capital, setting a deadline for liquidation, forced liquidation and so on.
Measure II: The Exchange will automatically match the liquidation application, which is unmatched at the close of the market on Day at the price limit. The Exchange may also take other measures flexibly to well attend to the interests of the investors.
(III) Position Limits
The position limit refers to the Exchange-stipulated maximum amount of speculative positions of a certain contract that a member or client can hold. Positions established for the purpose of hedging, which should go through the approval procedures, are exempted from position limit.
Position limits of broker members: (Unit: Contract)
N N+1 N+2
N+2
N+2 N+2
N+2
N+3
N+3
N+3

18
Product
Iron Ore
Open interests
Open interests≤200,000
Open interests>200,000
Non-Brokerage members
40,000
Open interests×20%
Clients
20,000
Open interests×10%
Product
Iron Ore
Trading Date
From the 10th trading day of the monthimmediately preceding the delivery month
The delivery month
Non-Brokerage Members
12,000
4,000
Clients
6,000
2,000
The position limits of Non-Brokerage members and clients from 10th trading day of the month immediately preceding the delivery month to the delivery month (Unit: Contract)
V. Procedures and Relevant Rules for Delivery of Iron Ore Futures
(I) General Delivery Rules
1. Iron ore futures can be delivered through bill of lading or warehouse receipt on par in the form of physical delivery, with the delivery unit of 10,000 metric tons.
2. Physical delivery should be conducted by the members on behalf of the clients, and in the name of the members within the Exchange.
3. No position shall be liquidated by delivery if its holder is a natural person client or the total number of positions in a contract is not an integral multiple of its delivery unit.
4. At the close of the last trading day, all contracts that remain open shall be performed by delivery. The Exchange will match the contracts matured in the delivery month in computerized systems on the principle of “Least Matched Pairs”.
5. The circulation of the VAT invoice: the selling client issues a VAT invoice for the buying client; the invoice is transferred, collected, and verified by both the selling and buying members under the supervision of the Exchange.
(II) Delivery Forms and Workflows
The delivery of iron ore futures can be conducted in the form of exchange of futures for physicals (EFP), one-off delivery and bill of lading delivery.
Iron Ore Futures Trading Manual

19
Time Flow Notes
Flow Chart of EFP
Before11:30 of theapplication day
After the closeof theapplication day
After thesettlement ofthe approval day
The seller and the buyer apply for EFP by submitting Application Form of Exchange of Futures for Physicals.
The positions of eligible buying and selling applicantsin the opposition directions should be closed out at the negotiated price.
Applications for EFP by warehouse receipts on par should be submitted with the right amount of payment and receipts.Delivery fees of EFP by warehouse receipts on par will be examined and approved on the very same day upon receiving of the application; Trading fees of EFP by other warehouse receipts are examined and approved within three days upon receiving of the application.The eligible period for EFP is the time from the launch day of the contract to the third to the last trading day (including the very same day) of the month preceding the delivery month.
Positions of EFP shall be deducted from the open interests of that very day, and the trading result shall not be counted into the settlement price and trading volume of that very day. The relevant data on EFP can be found among the delivery information on the website of the Exchange.
1. EFP
The transfer of goods and payments in EFP by other warehouse receipts shall be negotiated and settled by both trading parties. For EFP by warehouse receipts on par, the Exchange will transfer 80% of the payment to the selling member, and issue
to the buying member; the Exchange shall return the trading margins in full amount after offsetting the contracts of the delivery month held in different directions by the selling and buying parties.
Voucherof Warehouse Receipt On Par
Value-Added Tax invoices shall be handled according to the relevant rules in theDetailed Settlement Rules of Dalian
Commodity Exchange.
Note: For detailed procedures, see Detailed Delivery Rules of Dalian Commodity Exchange.

20
2. One-off Delivery
Note: For detailed procedures, see Detailed Delivery Rules of Dalian Commodity Exchange.
Iron Ore Futures Trading Manual
Time
After market closing
Before Market Closing
Before Market Closing
Before Market Closing
Buyer Seller The ExchangeDate
Flow Chart of One-off Delivery
Last trading day
Transform the trading margins of the buying
positions of the spot-month to be the delivery advances
Publish such information as the
products delivered at each delivery warehouse and the quantities of the warehouse receipts on
par
Submit to the Exchange all the
warehouse receipts on par
corresponding to its spot-month
Submit the VAT special
invoice within seven days after
matching
Additionally pay the balance
payments corresponding
to its spot-month
contract positions
Declare the delivery intent to the Exchange according to the
information published by the Exchange
The 1st trading day after the last trading day (The day for submitting
the warehouse receipts on
par
The 2nd trading
day after the last trading
day (The matching
day)
The 3rd trading
day after the last trading
day (The handover
day)
After the determination of
the matching result, the buyer shall, within one trading day after
the matching day, notify the seller of the items related to issuance of the
VAT special invoice, including the name, address,
taxpayer’s registration
number, amount and other
information, in accordance with the provisions of the tax authorities
Carry out delivery matching, and the
matching result and other information will be
sent to the buying member and the selling
member through the member service system
Issue to the buying member the Voucher of Warehouse Receipts on
Par
After market closing
After market closing
After market closing

21
Time Flow Notes
Applicationday
3. Bill of Lading Delivery
Notificationday
Spotdelivery
Before theclosing ofthe lasttrading day
The buyer initiates applications for delivery with specifications on the delivery locations, and the Exchange pools and publishes all the applications at the closing of the market. On the following day, the seller submits applications, and the Exchange matches the opposite applications on the principle of “maximum delivery amount”.
The seller shall send out a notification in advance, and the seller and the buyer shall supply corresponding margins within the time frame stipulated.
Both the seller and the buyer shall be present to supervise the delivery; a third party quality inspection organization shall be entrusted for moisture testing and quality determination; the tolerance for difference in actual weight is 3%; details of the delivery should be submitted and confirmed based on the weight note of the harbor.
The seller declares the commodities to the customs; the buyer submits the quality inspection report and completes the payment to the stipulated amount; the seller, the buyer and the harbor shall confirm the details of the delivery; the Exchange transfers corresponding payment.
Natural persons shall not be allowed for application; multiple applications can be submitted and the amount in each application shall be 40,000 metric tons or the integral multiples of it; the applications of the seller can involve two locations; the offsetting prices shall be the settlement prices of that day; the Exchange shall transmit corresponding information on matching.
The seller shall send out a notification three days ahead of the arrival of shipment at the harbor or the examination and acceptance of the goods at the harbor; within three days after the notification day, the level of margins shall be raised to 20%; the last notification day is the third to the last trading day of the month immediately preceding the delivery month.
The buyer shall entrust and pay the quality inspection organizations; the weight of commodities is the confirmed full weight after making conversion of the weight of commodities loading out of the warehouse in accordance with the result of moisture testing.
Any objection to the result of the quality inspection on the part of the seller shall be submitted within stipulated time; the Exchange settles the premiums and discounts and the weight tolerance; upon settlement, the Exchange shall transfer 80% of the payment first and the remaining 20% upon receiving of VAT invoices.
Note: For detailed procedures, see Detailed Delivery Rules of Dalian Commodity Exchange.

22
(III) Delivery Expenses
1. The delivery fee for iron ore is 0.5 CNY/MT.
2. The storage fee for iron ore is 0.5 CNY/MT per day.
3. The inspections fee for iron ore is negotiated between the clients and the designated inspection organizations.
4. A price ceiling is implemented for the delivery-in and delivery-out fees of iron ore. The charging standards will be published upon the approval of the Exchange.
(IV) Flow of Warehouse Receipts
Warehouse receipts on par for iron ore are issued by the designated delivery warehouses. In accordance with different natures of the designated warehouses, warehouse receipts on par are categorized into receipts of warehouses and factory warehouses. Warehouse receipts on par of iron ore are collectively cancelled on the last trading day of March each year.
1. Flow of Warehouse Receipts
Intention Report: The seller shall report the intention for delivery to the Exchange through the member and pay a deposit of 20 CNY/MT. Commodities that have been delivered, cancelled and converted to spot goods need no intention report if they are to be delivered again by the same designated warehouse, but a renewed inspection on them is requested.
Warehouse Receipt Registration: Members can register warehouse receipts by the right of the registration documents which are submitted to the Exchange by the delivery warehouse after the inspection of the designated quality inspection organization on the commodities and the examination and acceptance of the commodities by the delivery warehouse.
Warehouse Receipt Delivery: In delivery, the seller submits warehouse receipts and VAT invoices and collects the payment while the buyer submits the payment and collects the warehouse receipts.
Warehouse Receipt Cancellation: Holders of warehouse receipts go through the cancellation procedures in the Exchange and collect the Notification of Delivery or the security code.
Delivery-out: Three days before the actual day of delivery-out, the owner of commodities shall contact the designated warehouse by virtue of the Notification of Delivery or the security code for the relevant arrangements.
2. Flow of Factory Warehouse Receipts
Warehouse Receipt Registration: The buyer submits the payment and relevant fees to the factory warehouse, who then issues the Application Form of Warehouse Receipts on Par to the seller. The exchange shall register the receipts after verifying the bank guarantee or cash margin and other items submitted by the factory warehouse.
Warehouse Receipt Delivery: In delivery, the seller submits the warehouse receipts and VAT invoices and collects the payments while the buyer submits the payment and collects the warehouse receipts.
Iron Ore Futures Trading Manual

23
Warehouse Receipt Cancellation: Holders of warehouse receipts go through the cancellation
procedures in the Exchange and collect the Notification of Delivery or the security code.
Delivery-out: The factory warehouse shall deliver the goods out within four days after the
issuing day (the issuing day excluded) of the Notification of Delivery.
(For details, please refer to the Measures for the Management of Warehouse Receipts on Par of Soybean Oil, RBD Palm Olein, Coke, Coking Coal, and Iron Ore of Dalian Commodity Exchange.)
(V) Delivery Locations
The delivery warehouses for iron ore are located in the major harbors surrounding the
Huanghai Sea and the Bohai Sea such as Qingdao and Lianyungang. The factory warehouses
are located near the mines in the hinterland and the harbors, without premiums or discounts
based on regions. (Subject to the relevant announcement of the Exchange)

24
Annex 1:DCE Iron Ore Futures Contract
DCE Iron Ore Futures Contract
Product
Trading Unit
Price Quote
Tick Size
Daily Price Limit
Contract Months
Trading Hours
Last Trading Day
Last Delivery Day
Deliverable Grades
Delivery Location
Minimum Trading Margin
Delivery Method
Ticker Symbol
Exchange
Iron Ore
100 MT/Contract
CNY/MT
0.5 CNY/MT
4% of last settlement price
12 consecutive months
9:00 - 11:30 am, 1:30 - 3:00 pm Beijing Time, Monday - Friday, and other hours noticed by DCE
10th trading day of the delivery month
3rd business day after the last trading day of the delivery month
DCE Iron Ore Delivery Quality Standards
The warehouses and deliverylocations appointed by DCE
5% of the contract value
Physical delivery
I
DCE
Iron Ore Futures Trading Manual

25
1. Content and Scope
1.1 The standard herein dictates the quality requirement, testing methods, inspection guidelines and transportation requirements for iron ore delivered at DCE.
1.2 The standard herein refers to mined natural iron ores made into fines and concentrates through crushing and screening that can be used to produce artificial lumps such as sinters and pellets.
1.3 The standard herein applies to iron ore products and substitutes delivered under the iron ore futures contract of DCE.
2. Cited Rules
The provisions of the following rules are incorporated herein by reference. For those rules noted with dates, their amendments (excluding corrections) and revised versions may not be applied to this standard; for those without noted dates, their latest versions shall be applied to this standard.
GB/T 10322.1-2000 Sampling and preparation of samples of iron ore
GB/T 6730.5-2007 Determination of total iron content of iron ore
GB/T 6730.62-2005 Determination of calcium, silicon, magnesium, titanium, phosphorus, manganese, aluminum and barium content of iron ore
GB/T 6730.61-2005 Determination of carbon and sulfur content of iron ore
GB/T 6730.54-2004 Determination of lead content of iron ore
GB/T 6730.53-2004 Determination of zinc content of iron ore
GB/T 6730.36-1986 Determination of copper content by atomic absorption spectrophotometry
GB/T 6730.45-2006 Determination of arsenic content of iron ore
GB/T 6730.69-2010 Determination of fluorine and chlorine content of iron ore
GB/T 6730.49-1986 Determination of sodium and potassium content by atomic absorption spectrophotometry
GB/T 6730.22-1986 Determination of titanium content by diantipyrine methane photometry
GB/T 10322.7-2004 Determination of size distribution of iron ore by sieving
GB/T 10322.5-2000 Determination of moisture content of iron ore of a consignmentTerms and definitions under GB/T 20565 apply to this standard.
Annex 2: DCE Iron Ore Delivery Quality Standard
(F/DCE I001-2013)
DCE Iron Ore Delivery Quality Standard
26
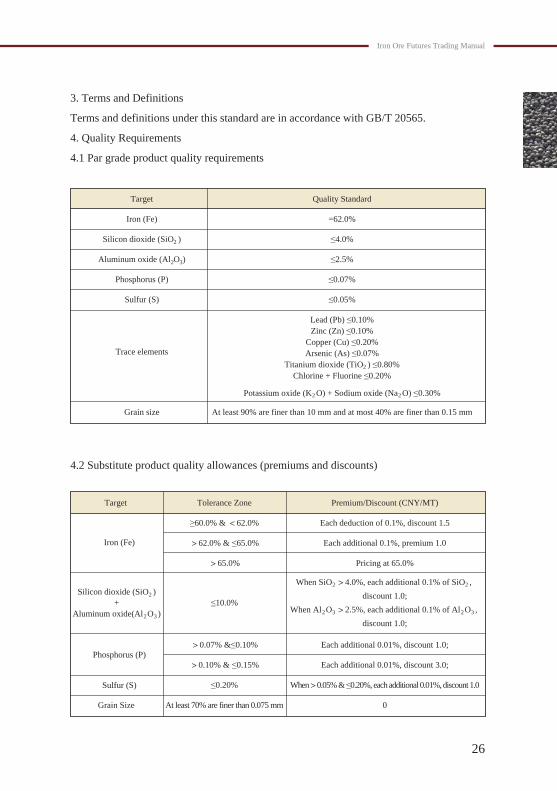
3. Terms and Definitions
Terms and definitions under this standard are in accordance with GB/T 20565.
4. Quality Requirements
4.1 Par grade product quality requirements
4.2 Substitute product quality allowances (premiums and discounts)
Premium/Discount (CNY/MT)
Each deduction of 0.1%, discount 1.5
Each additional 0.1%, premium 1.0
Pricing at 65.0%
Tolerance Zone
≥60.0% & <62.0%
>62.0% & ≤65.0%
>65.0%
When SiO >4.0%, each additional 0.1% of SiO , discount 1.0;
When Al O >2.5%, each additional 0.1% of Al O , discount 1.0;
Each additional 0.01%, discount 1.0;
Each additional 0.01%, discount 3.0;
When>0.05% & ≤0.20%, each additional 0.01%, discount 1.0
0
>0.07% &≤0.10%
>0.10% & ≤0.15%
≤0.20%
At least 70% are finer than 0.075 mm
≤10.0%
Target
Iron (Fe)
Phosphorus (P)
Sulfur (S)
Silicon dioxide (SiO )+
Aluminum oxide(Al O )
Grain Size
22
32 32
2
32
Target
Iron (Fe)
Silicon dioxide (SiO )
Aluminum oxide (Al O )
Phosphorus (P)
Sulfur (S)
Trace elements
Grain size
Quality Standard
=62.0%
≤4.0%
≤2.5%
≤0.07%
≤0.05%
Lead (Pb) ≤0.10%Zinc (Zn) ≤0.10%
Copper (Cu) ≤0.20%Arsenic (As) ≤0.07%
Titanium dioxide (TiO ) ≤0.80%Chlorine + Fluorine ≤0.20%
Potassium oxide (K O) + Sodium oxide (Na O) ≤0.30%
At least 90% are finer than 10 mm and at most 40% are finer than 0.15 mm
2
2
2
2 2
3
Iron Ore Futures Trading Manual
27
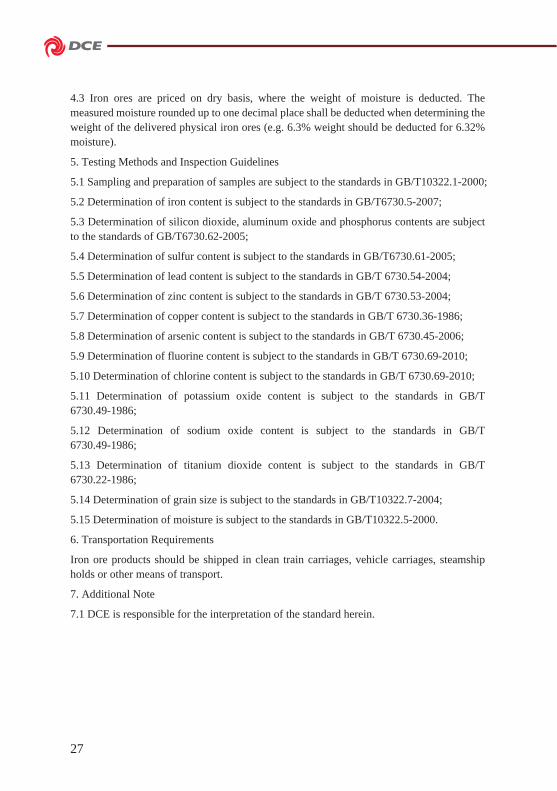
4.3 Iron ores are priced on dry basis, where the weight of moisture is deducted. The measured moisture rounded up to one decimal place shall be deducted when determining the weight of the delivered physical iron ores (e.g. 6.3% weight should be deducted for 6.32% moisture).
5. Testing Methods and Inspection Guidelines
5.1 Sampling and preparation of samples are subject to the standards in GB/T10322.1-2000;
5.2 Determination of iron content is subject to the standards in GB/T6730.5-2007;
5.3 Determination of silicon dioxide, aluminum oxide and phosphorus contents are subject to the standards of GB/T6730.62-2005;
5.4 Determination of sulfur content is subject to the standards in GB/T6730.61-2005;
5.5 Determination of lead content is subject to the standards in GB/T 6730.54-2004;
5.6 Determination of zinc content is subject to the standards in GB/T 6730.53-2004;
5.7 Determination of copper content is subject to the standards in GB/T 6730.36-1986;
5.8 Determination of arsenic content is subject to the standards in GB/T 6730.45-2006;
5.9 Determination of fluorine content is subject to the standards in GB/T 6730.69-2010;
5.10 Determination of chlorine content is subject to the standards in GB/T 6730.69-2010;
5.11 Determination of potassium oxide content is subject to the standards in GB/T 6730.49-1986;
5.12 Determination of sodium oxide content is subject to the standards in GB/T 6730.49-1986;
5.13 Determination of titanium dioxide content is subject to the standards in GB/T 6730.22-1986;
5.14 Determination of grain size is subject to the standards in GB/T10322.7-2004;
5.15 Determination of moisture is subject to the standards in GB/T10322.5-2000.
6. Transportation Requirements
Iron ore products should be shipped in clean train carriages, vehicle carriages, steamship holds or other means of transport.
7. Additional Note
7.1 DCE is responsible for the interpretation of the standard herein.

28
List of Designated Delivery Warehouses for DCE Iron Ore Futures
Iron Ore Futures Trading Manual
Name
Tianjin Port Exchange Market
Co., Ltd.
Jiangsu Lianyungang Port Co., Ltd.
Rizhao Port Co., Ltd.
Qingdao Port International
Co., Ltd.
Tangshan Port Logistics Co., Ltd.
Tianjin Gangjun Logistics Development
Co., Ltd.
Caofeidian Port Co., Ltd.
Tangshan Caofeidian Shiye Port Co., Ltd.
Address
481 Jin'an No.2 Avenue, Tianjin Port Bulk Cargo
Logistics Center
Room 2220, Xin'gang Building, Lianyun District,
Lianyungang
Room 107, Control Center Building, Shanghai Road,
Rizhao, Shandong Province
Room 309, Qingdao Port Group Business Department,
6 Gangqing Rd., Qingdao
South Office Building of Tangshan Port Group
Co., Ltd.
North Section of Nanhang Rd., Xingang, Tanggu District, Tianjin
Room 508, Hongyi Dock, Caofeidian Industrial Park, Tangshan, Hebei Province
Tangshan Caofeidian Shiye Port Co., Ltd., Tangshan
Caofeidian Industrial Park
300452
222042
276826
266011
063611
300452
063210
063200
Li Gang
Li Hao
Li Ping
Fu Yafeng
Lu Zhigang
Su Xin
Wang Xin
Li Jinlu
Shan Chunpeng
ChenPeng
Zhang Fangfang
13389023855022-25703089
022-2570389213389953530
0518-8238926713605132219
0633-838282313686333206
0532-8298835613805428892
0315-291647113931521582
022-2570394713820893028
0315-885058713313297826
0315-882162813582586199
0315-882117618633131983
0315-882155713483571603
Tel.
Tianjin Port Area
Lianyungang Port Area
Rizhao Port Area
Qingdao Port Area
Jingtang Port Area
Tianjin Port Area
Caofeidian Port Area
Caofeidian Port Area
1
0.2
0.4
3
0.5
0.5
1
0.5
Yes
Yes
Yes
Yes
Yes
Yes
Yes
Yes
0
0
0
0
0
0
0
0
1
2
3
4
5
6
7
8
No.
Railway: Dongdagu Station
Shipping: Dock at Tianjin Port
Railway: East Lianyungang StationShipping: Dock at Lianyungang Port
Railway: Rizhao Station
Shipping: Dock at Rizhao Port
Railway: Huangdao StationShipping: Dock at
Qingdao Port
Railway: Tanggang StationShipping: Dock at
Jingtang Port
Railway: Dongdagu Station
Shipping: Dock at Tianjin Port
Railway: Caofeidian StationShipping: Dock at
Caofeidian Port
Railway: South Caofeidian StationShipping: Dock at
Caofeidian Port
P.C. ContactContractual
Capacity (million tons)
Shipment Station / Port
Delivery Area
Delivery Warehouse
on Par (Yes/No)
Premium and Discount
(CNY/MT) Compared
with Delivery Warehouse
on Par
Note: The contractual capacity refers to the minimum guaranteed warehouse capacity in the agreement signed by the delivery warehouses with the Exchange. The actual storage of goods by a delivery warehouse may exceed the contractual capacity.
Annex 3: List of Designated Delivery Warehouses for DCE Iron Ore Futures

Name
Hebei Iron & Steel Group Mining
Co., Ltd.
Jiangsu Shagang International Trade
Co., Ltd.
Ruiganglian Group Co., Ltd.
Shanxi Minmetals Industrial Trading
Co., Ltd.
Hangzhou CIEC Group Co., Ltd.
Rizhao Steel Holding Group Co., Ltd.
Sinosteel Resources Co., Ltd.
Shandong Huaxin Industry & Trade
Co., Ltd.
Angang Steel Company Limited
Address
81 North Jianshe Rd., Tangshan, Hebei Province
Room 605, Shagang Building, Jinfeng Town,
Zhangjiagang, Jiangsu Province
23/F, New Poly Plaza, 1 Chaoyangmen North
Street, Dongcheng District, Beijing
F309 Yuanyang Building, 158 Fu Xing Men Nei Street,
Xicheng District, Beijing
32/F, 8 Haidian Street, Haidian District, Beijing
600 Yanhai Rd., Lanshan District, Rizhao,
Guangdong Province
35/F, Hanjia International, 8 Dangui Street,
Fuchun Rd., Jianggan District,
Hangzhou
42 Tuanjie Street, Tiedong District, Anshan,
Liaoning Province
20/F, Building B, Industrial Fortune Plaza, 257 Ji'nan Rd., Rizhao,
Shandong Province
Gu Lili
Jia Haijian
Huang Ying
Yu Jie
Du Fang
Wu Lei
Fu Yao
Wang Hongwei
Liu XuWei
Qingfeng
Hou Dianyin
Xu Shaoqing
Hu Hao
Ding Guoping
Zhu Yiwen
Yao HesongChen
PengfeiZhang AipingGong Wei
0315-279318715081656960
0315-279319818732511756
0512-5895386118662232026
0512-5895386113914919041
010-84193799139112019736596989160
010-6649369718600027771010-6649378713488845788
010-6268929213693546961010-6268896718910556593
1866030078713562368527
139571725511358847329618958002699
1886337636315863363188
1332211949213390087743
Tel.
150,000
200,000
150,000
150,000
100,000
100,000
200,000
200,000
100,000
150,000
100,000
150,000
200,000
10,000
15,000
10,000
10,000
10,000
10,000
15,000
15,000
10,000
10,000
10,000
10,000
15,000
0
0
0
0
0
0
0
0
0
0
0
0
-10
Yes
Yes
Yes
Yes
Yes
Yes
Yes
Yes
Yes
Yes
Yes
Yes
No
063000
215625
100010
100031
100080
276800
310020
276800
114001
1
2
3
4
5
6
7
8
9
No.
Railway: Baizhuang Station
Railway: East Lianyungang StationShipping: Dock at Lianyungang Port
Railway: East Lianyungang StationShipping: Dock at Lianyungang Port
Shipping: Ore Dock at Dalian Port
Railway: Jin'gang Station
P.C. Contact
Maximum of Warehouse
Receipts on Par (MT)
Shipment Station / Port
Daily Delivery Speed
(MT/Day)
Delivery Warehouse
on Par (Yes/No)
Premium and Discount
(CNY/MT) Compared
with Delivery Warehouse
on Par
Railway: Dongdagu Station
Shipping: Dock at Tianjin Port
Railway: Rizhao Port Station
Shipping: Dock at Rizhao Port
Railway: Tanggang StationShipping: Dock at
Jingtang Port
Railway: South Caofeidian StationShipping: Dock at
Caofeidian Port
Railway: Fenshui Station
Shipping: Dock at Lanshan Port
Railway: Huangdao StationShipping: Dock at
Qingdao Port
Railway: Dongdagu StationShipping: Dock at
Tianjin Port
Railway: South Caofeidian StationShipping: Dock at
Caofeidian Port
Railway: Rizhao Port Station
Shipping: Dock at Rizhao Port
Name of Bonded Delivery
Warehouse
Dalian Port Bulk Cargo Logistics Center Co., Ltd.
Address
Dalian Port Ore Terminal Co., Ltd., Xin'gang, Dalian
Economic and Technological Development Zone
Shipping: Ore Dock at Dalian Port
Railway: Jin'gang Station
Bonded Warehouse
of Ore Dock at Dalian Port
0411-8759557713604250299
0411-8759559115998648127
Tel.Product
Iron Ore 116601 55 No -10Zhao Meng
Liu Hu
P.C. ContactContractual
Capacity (million tons)
Shipment Station / Port
Delivery Area
Delivery Warehouse
on Par (Yes/No)
Premium and Discount
(CNY/MT) Compared
with Delivery Warehouse
on Par
List of Designated Delivery Factory Warehouses for DCE Iron Ore Futures
List of Designated Bonded Delivery Warehouses for DCE Iron Ore Futures
29

Dalian Commodity Exchange Investor Education Material
Futures Trading Manual Series
IRON ORE FUTURESTRADING MANUAL

DCE Investor Education MaterialFutures Trading Manual Series
2nd Edition, 2016
Dalian Commodity Exchange. All rights reserved.
Nothing in this document constitutes an offer or a solicitation of an offer to buy or sell any security or other financial instrument or constitutes any investment advice or recommendation of any security or other financial instrument. To the best of the DCE's knowledge and belief, statements made are correct at the time of going to press.As such statements and all opinions expressed herein are published for the general information of readers but are not to be taken as recommendations of any course of action. The DCE accepts no liability for the accuracy of any statement or representation.
www.dce.com.cn
Service & Consultation:
Add: 129 Huizhan Road, Dalian, Liaoning Province, China 116023
Tel: +86-0411-84808888 Fax: +86-0411-84808588
Trading: +86-0411-84808687 Delivery: +86-0411-84808839 Clearing: +86-0411-84808897 Compliant: +86-0411-84808888