irpc public company limitedirpc.listedcompany.com/misc/presn/20170223-irpc-am-4q2016.pdf$/bbl $/bbl...
TRANSCRIPT
IRPC Public Company Limited
23 February 2017
2016 Analyst Meeting
Disclaimer
This presentation material has been prepared solely for informational purposes only. IRPC is furnishing it solely for use byprospective investors / analysts in the proposed event. IRPC makes no representations or warranties as to the accuracy orcompleteness of such information. By accepting this material each recipient agrees that IRPC shall not have any liability forany representations (express or implied) contained in, or for any omissions from this presentation.
The information contained herein does not purport to be all-inclusive or to contain all of the information that may be material to the recipient’s decision. Each recipient of the information and data contained herein should perform its own independent investigation and analysis of the transaction and the creditworthiness of IRPC . Reference in this Disclaimer to this shall include references to the Appendices (if any) hereto.
2
3
2016 Performance Highlight 1
Achievement in 2016
Operation & Financial Performance
Industry Outlook
Agenda
Highlight from CEO
28%
62%
10%
67%
31%
2%
44%
48%
8%
10%
85%
5%
38%
57%
5%
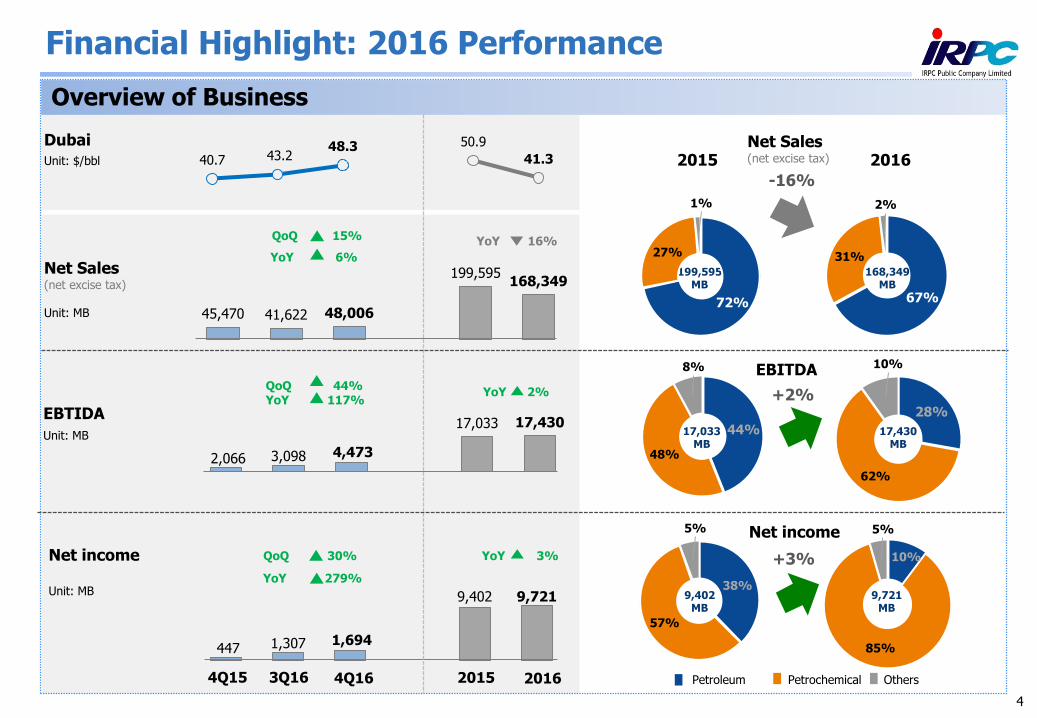
45,470 41,622 48,006
199,595 168,349
YoY 6%
QoQ 15%
Overview of Business
Net Sales(net excise tax)
Dubai
Unit: $/bbl
447 1,307 1,694
9,402 9,721
Net income
Unit: MB
Unit: MB
4
4Q15 4Q16 2016
YoY 279%
QoQ 30%
2015
YoY 16%
40.7 43.2 48.3 50.9
41.3
YoY 3%
3Q16
EBTIDA
Unit: MB
2,066 3,098 4,473
17,033 17,430
QoQ 44% YoY 117%
YoY 2%
168,349MB
199,595MB
2015 2016
Financial Highlight: 2016 Performance
Petroleum Petrochemical Others
17,430MB
17,033MB
9,721MB
9,402MB
72%
27%
1%
-16%
+2%
+3%
Net Sales(net excise tax)
EBITDA
Net income
5
2016 Performance Highlight
Achievement in 2016 1
Operation & Financial Performance
Industry Outlook
Agenda
Highlight from CEO
6
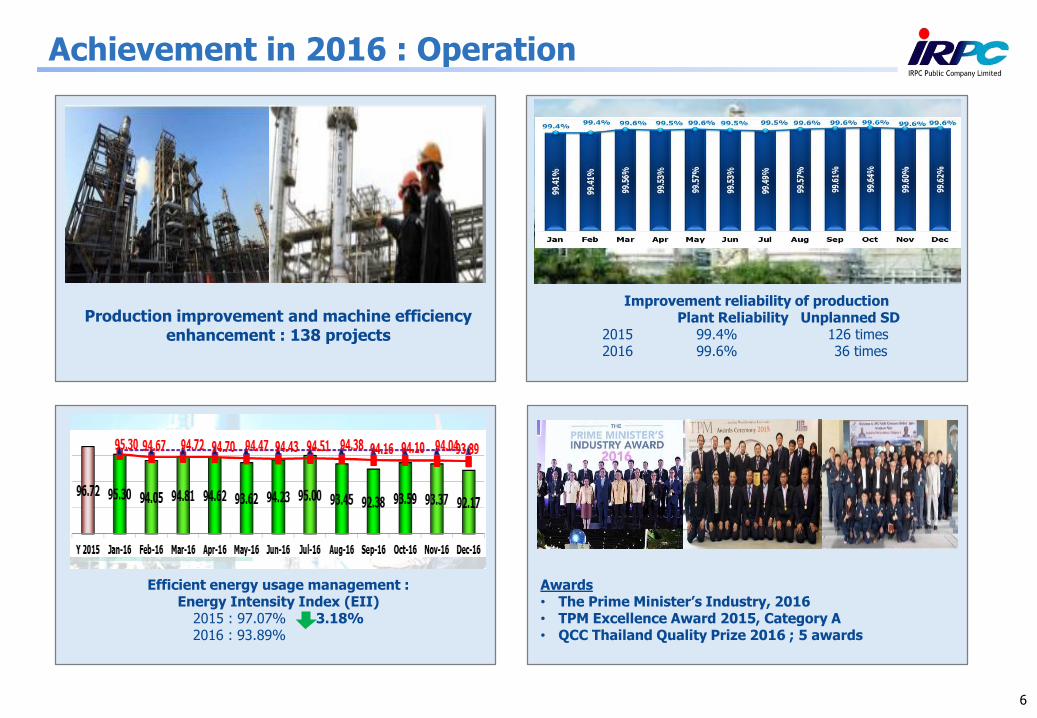
Achievement in 2016 : Operation
Production improvement and machine efficiency enhancement : 138 projects
Awards• The Prime Minister’s Industry, 2016• TPM Excellence Award 2015, Category A• QCC Thailand Quality Prize 2016 ; 5 awards
Efficient energy usage management :Energy Intensity Index (EII)
2015 : 97.07% 3.18%2016 : 93.89%
Improvement reliability of productionPlant Reliability Unplanned SD
2015 99.4% 126 times2016 99.6% 36 times

7
Achievement in 2016 : Commercial
Affirmed Customer
Technology Support customer
IRPC - Darby Trading Inc.entered into Slack Wax Sales Agreement in USA and EU amounting 120 MB
MOU with Lao-China Dongyan Petrochemical Co., Ltd.
“Krungsri e-Payment Service” Agreement for Petroleum products via IRON system
Efficiency tool for Price Analysis “Athena 2.0”
An advanced CRM System
Increase High Value Added and Specialty Products Volume Ratio
Increase Specialty products from 39% (2015) to 42% (2016)
Product Diversification Market Expansion to ASEAN
8
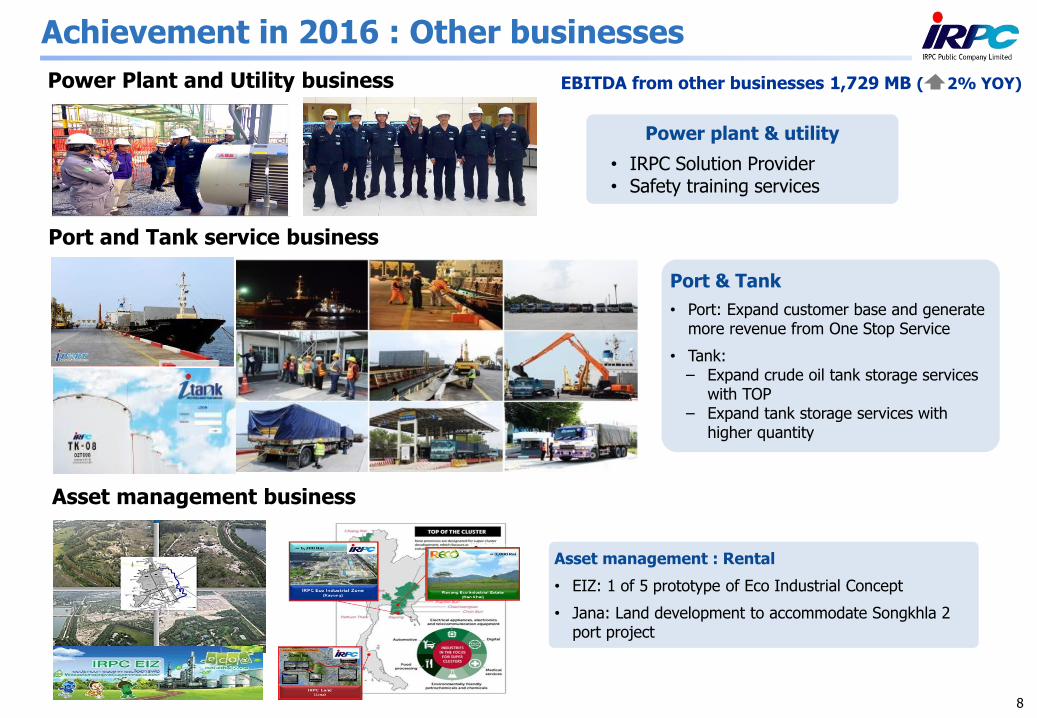
Achievement in 2016 : Other businesses
Power Plant and Utility business
Port and Tank service business
Asset management business
Port & Tank
• Port: Expand customer base and generate more revenue from One Stop Service
• Tank:– Expand crude oil tank storage services
with TOP– Expand tank storage services with
higher quantity
Asset management : Rental
• EIZ: 1 of 5 prototype of Eco Industrial Concept
• Jana: Land development to accommodate Songkhla 2 port project
Power plant & utility
• IRPC Solution Provider• Safety training services
EBITDA from other businesses 1,729 MB ( 2% YOY)
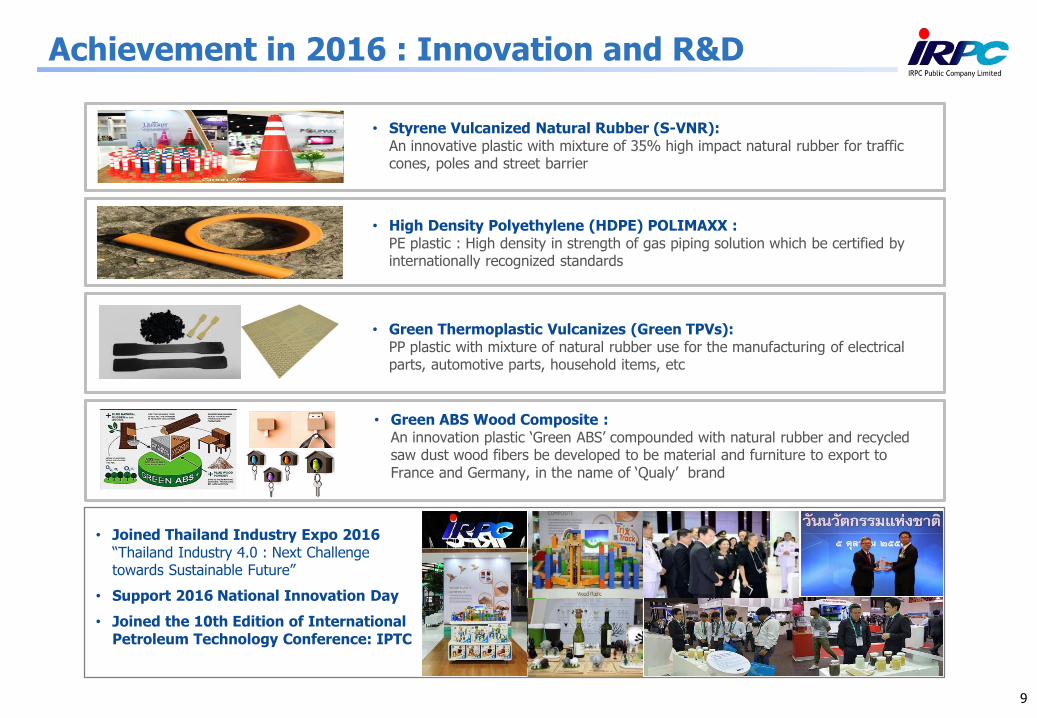
Achievement in 2016 : Innovation and R&D
• Styrene Vulcanized Natural Rubber (S-VNR): • An innovative plastic with mixture of 35% high impact natural rubber for traffic
cones, poles and street barrier
• High Density Polyethylene (HDPE) POLIMAXX :• PE plastic : High density in strength of gas piping solution which be certified by
internationally recognized standards
• Green Thermoplastic Vulcanizes (Green TPVs):• PP plastic with mixture of natural rubber use for the manufacturing of electrical
parts, automotive parts, household items, etc
• Green ABS Wood Composite :• An innovation plastic ‘Green ABS’ compounded with natural rubber and recycled
saw dust wood fibers be developed to be material and furniture to export to France and Germany, in the name of ‘Qualy’ brand
• Joined Thailand Industry Expo 2016 “Thailand Industry 4.0 : Next Challenge towards Sustainable Future”
• Support 2016 National Innovation Day
• Joined the 10th Edition of International Petroleum Technology Conference: IPTC
9
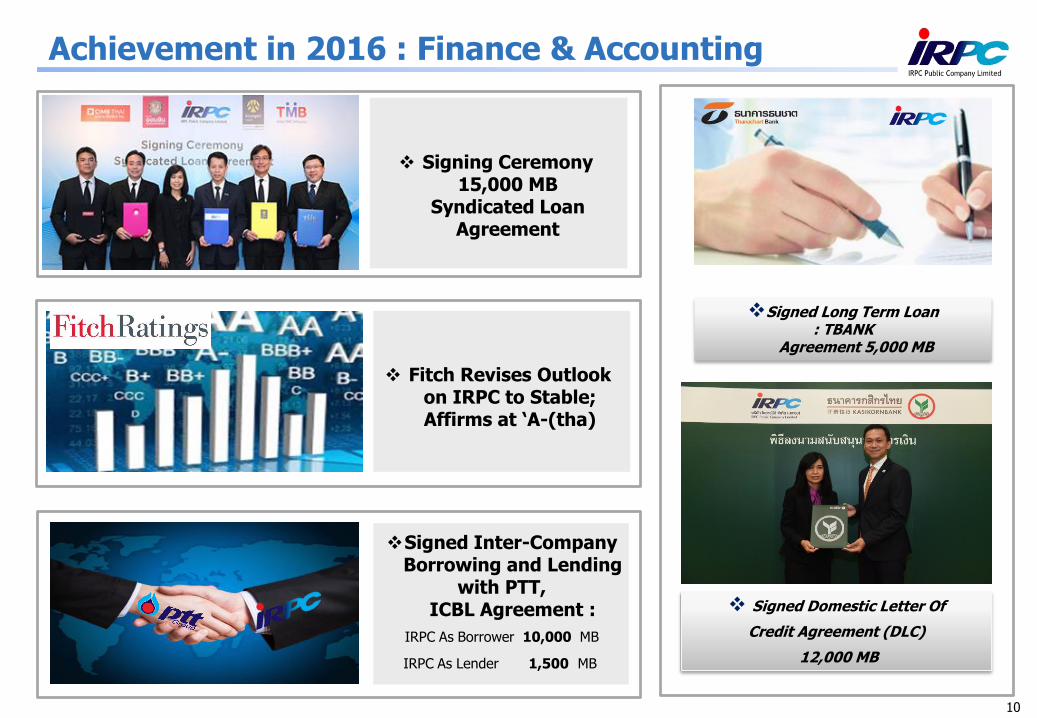
Achievement in 2016 : Finance & Accounting
Signed Inter-Company Borrowing and Lending
with PTT, ICBL Agreement :
IRPC As Borrower 10,000 MB
IRPC As Lender 1,500 MB
Signed Long Term Loan : TBANK
Agreement 5,000 MB
Fitch Revises Outlook on IRPC to Stable; Affirms at ‘A-(tha)
Signed Domestic Letter Of
Credit Agreement (DLC)
12,000 MB
Signing Ceremony 15,000 MB
Syndicated Loan Agreement
10
11
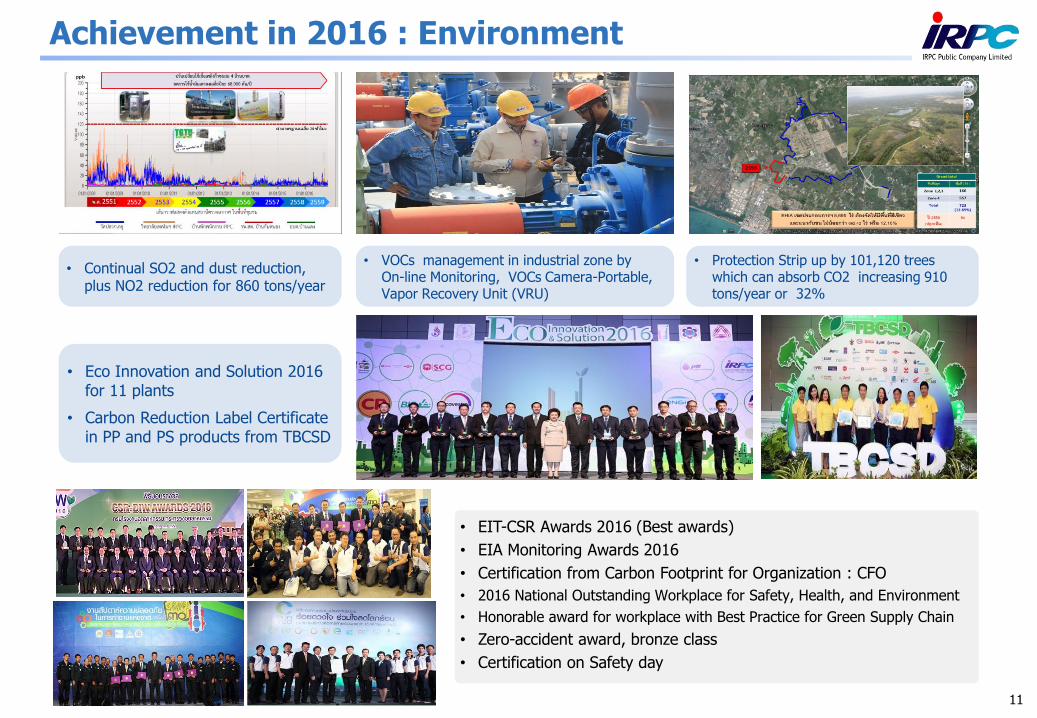
Achievement in 2016 : Environment
• Continual SO2 and dust reduction, plus NO2 reduction for 860 tons/year
• EIT-CSR Awards 2016 (Best awards)
• EIA Monitoring Awards 2016
• Certification from Carbon Footprint for Organization : CFO
• 2016 National Outstanding Workplace for Safety, Health, and Environment
• Honorable award for workplace with Best Practice for Green Supply Chain
• Zero-accident award, bronze class
• Certification on Safety day
• Protection Strip up by 101,120 trees which can absorb CO2 increasing 910 tons/year or 32%
• Eco Innovation and Solution 2016 for 11 plants
• Carbon Reduction Label Certificatein PP and PS products from TBCSD
• VOCs management in industrial zone by On-line Monitoring, VOCs Camera-Portable, Vapor Recovery Unit (VRU)

Achievement in 2016 : Corporate Governance
Corporate Governance
• CGR assessment from IOD: 5 stars
• AGM assessment: 100/100 scores
• Set up rules and licenses monitoring team through GRC criteria
• Provide conflict report through the system
• IRPC Cubic Academy
• IRPC CG Day: The Code To Victory / PTT Group CG Day: See Through The Future
• Diamond Awards 2016
UN Global Compact
• Co-establish Global Compact Network Thailand Association
• UN Global Compact Website (UN Global Compact Standard-LEAD)
• Children’s Rights and Business Principles of UNICEF
• Promote women and children’s rights with UNFPA: Leaving No One Behind
Anti-Corruption
• CAC member with partners attending
• Anti-Corruption training course
• “Follow the footsteps of honesty of our Father for the goodness of our country” to commemorate His Majesty King BhumibolAdulyadej, Rama 9
• DJSI Emerging Market: Oil & Gas Refining and Marketing (3th year)• Thailand Sustainable Investment 2016• Sustainability Report Awards 2016 (Outstanding)• NACC Integrity Awards 2016• Thailand Top Company Awards 2016 (Outstanding)• Golden Peacock Global Award for Excellence in Corporate Governance 2016 • Certificate of ESG 100 Company (Resources)
12
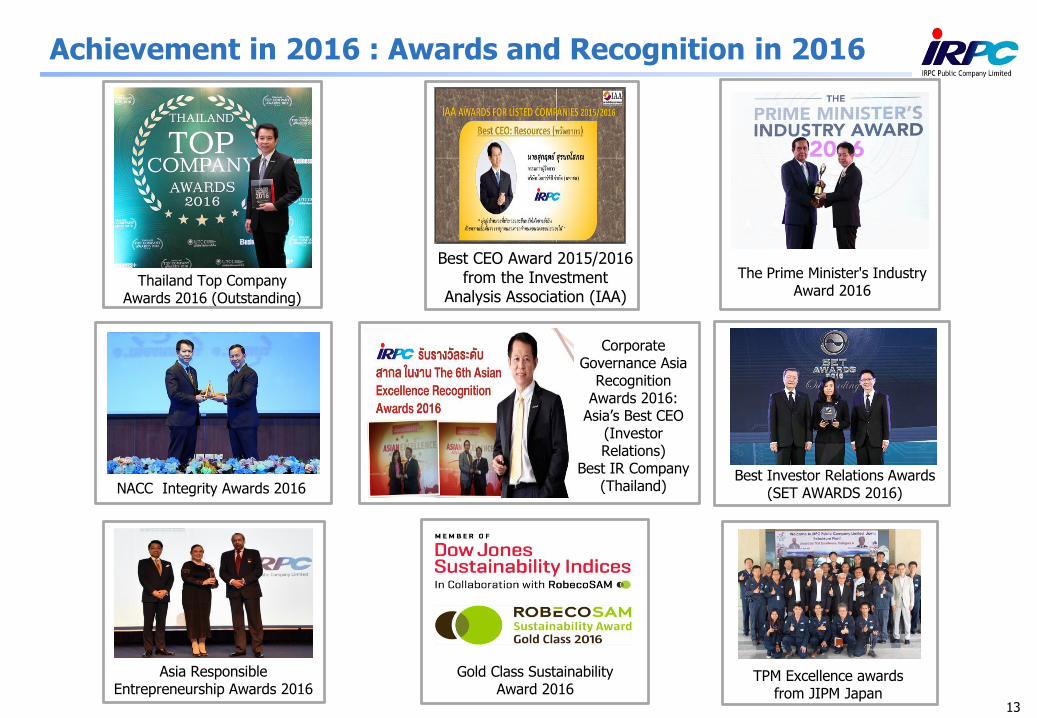
Achievement in 2016 : Awards and Recognition in 2016
Thailand Top Company Awards 2016 (Outstanding)
Corporate Governance Asia
Recognition Awards 2016:
Asia’s Best CEO (Investor Relations)
Best IR Company (Thailand)
Asia Responsible Entrepreneurship Awards 2016
Gold Class Sustainability Award 2016
The Prime Minister's Industry Award 2016
Best CEO Award 2015/2016 from the Investment
Analysis Association (IAA)
TPM Excellence awards from JIPM Japan
Best Investor Relations Awards (SET AWARDS 2016)NACC Integrity Awards 2016
13
14
2016 Performance Highlight
Achievement in 2016
Operation & Financial Performance
Industry Outlook
Agenda
Highlight from CEO
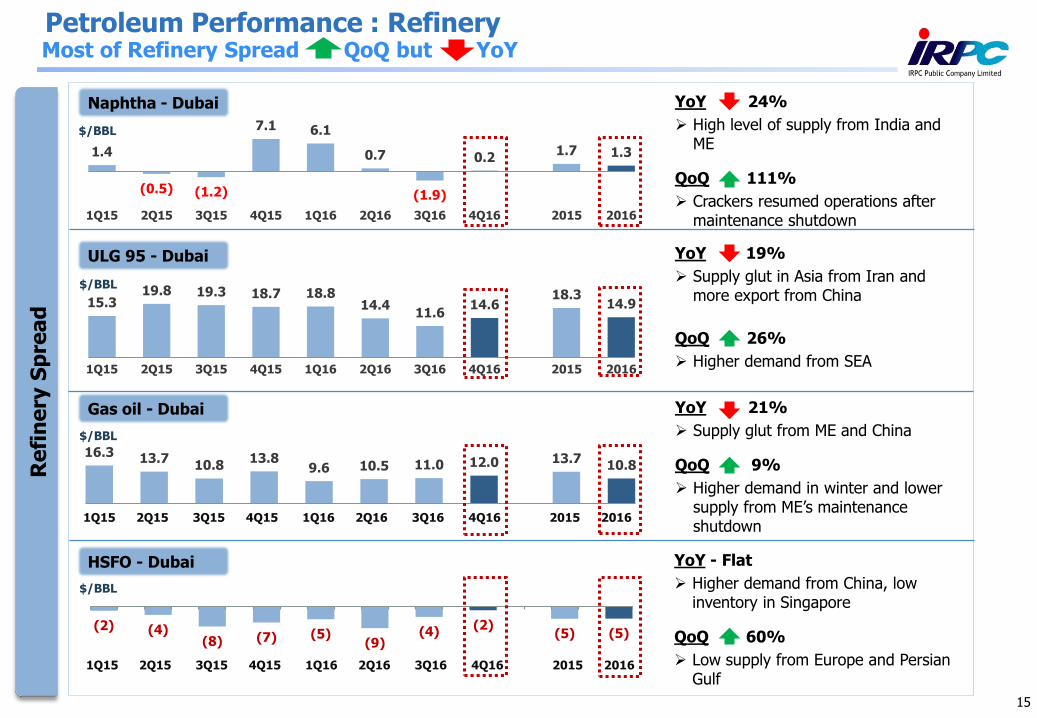
YoY 19%
Supply glut in Asia from Iran and more export from China
QoQ 26%
Higher demand from SEA
YoY 21%
Supply glut from ME and China
QoQ 9%
Higher demand in winter and lower supply from ME’s maintenance shutdown
YoY - Flat
Higher demand from China, low inventory in Singapore
QoQ 60%
Low supply from Europe and Persian Gulf
YoY 24%
High level of supply from India and ME
QoQ 111%
Crackers resumed operations after maintenance shutdown
1.4
(0.5) (1.2)
7.1 6.1
0.7
(1.9)
0.2 1.7 1.3
1Q15 2Q15 3Q15 4Q15 1Q16 2Q16 3Q16 4Q16 2015 2016
15
15.319.8 19.3 18.7 18.8
14.411.6
14.618.3
14.9
1Q15 2Q15 3Q15 4Q15 1Q16 2Q16 3Q16 4Q16 2015 2016
16.3 13.710.8
13.89.6 10.5 11.0 12.0 13.7
10.8
(2) (4)(8) (7) (5)
(9)(4)
(2)(5) (5)
1Q15 2Q15 3Q15 4Q15 1Q16 2Q16 3Q16 4Q16 2015 2016
Petroleum Performance : RefineryMost of Refinery Spread QoQ but YoY
Gas oil - Dubai
ULG 95 - Dubai
HSFO - Dubai
Naphtha - Dubai
$/BBL
$/BBL
$/BBL
$/BBL
Re
fin
ery
Sp
rea
d
1Q15 2Q15 3Q15 4Q15 1Q16 2Q16 3Q16 4Q16 2015 2016
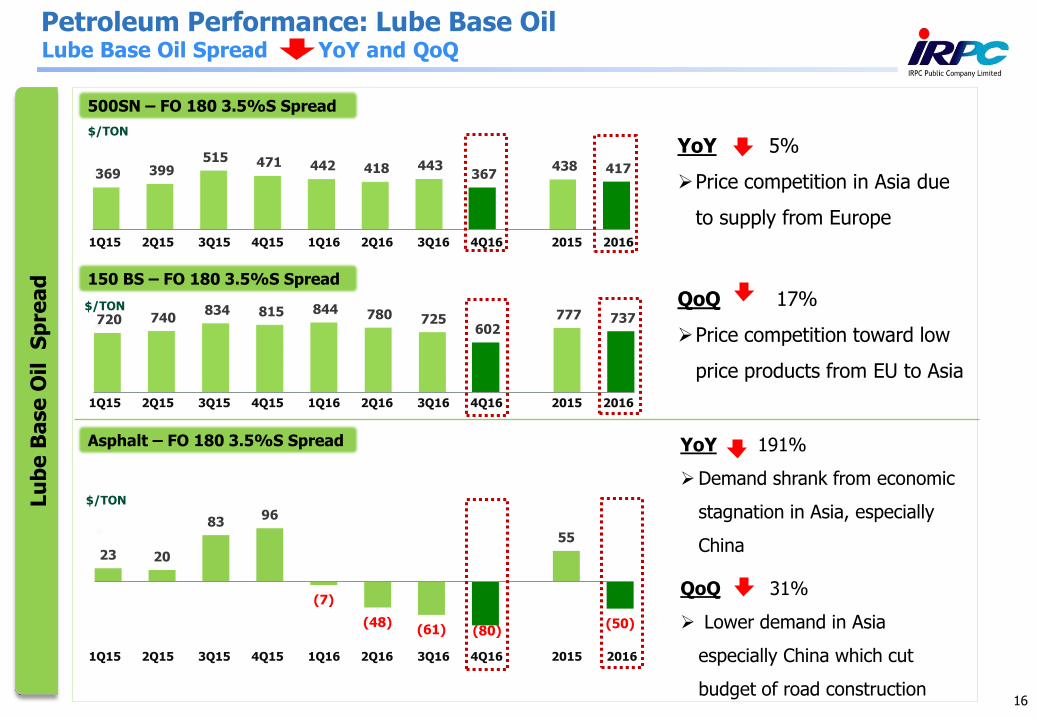
YoY 5%
Price competition in Asia due
to supply from Europe
QoQ 17%
Price competition toward low
price products from EU to Asia
YoY 191%
Demand shrank from economic
stagnation in Asia, especially
China
QoQ 31%
Lower demand in Asia
especially China which cut
budget of road construction
23 20
83 96
(7)
(48)(61) (80)
55
(50)
$/TON
720 740 834 815 844 780 725
602 777 737
$/TON
16
369 399 515 471 442 418 443
367 438 417
$/TON
500SN – FO 180 3.5%S Spread
150 BS – FO 180 3.5%S Spread
Asphalt – FO 180 3.5%S Spread
Petroleum Performance: Lube Base OilLu
be
Ba
se
Oil
S
pre
ad
Lube Base Oil Spread YoY and QoQ
1Q15 2Q15 3Q15 4Q15 1Q16 2Q16 3Q16 4Q16 2015 2016
1Q15 2Q15 3Q15 4Q15 1Q16 2Q16 3Q16 4Q16 2015 2016
1Q15 2Q15 3Q15 4Q15 1Q16 2Q16 3Q16 4Q16 2015 2016
1.0 0.7 0.9 3.8 3.4 0.9 0.8 0.9
3.7 3.4
Petroleum Production
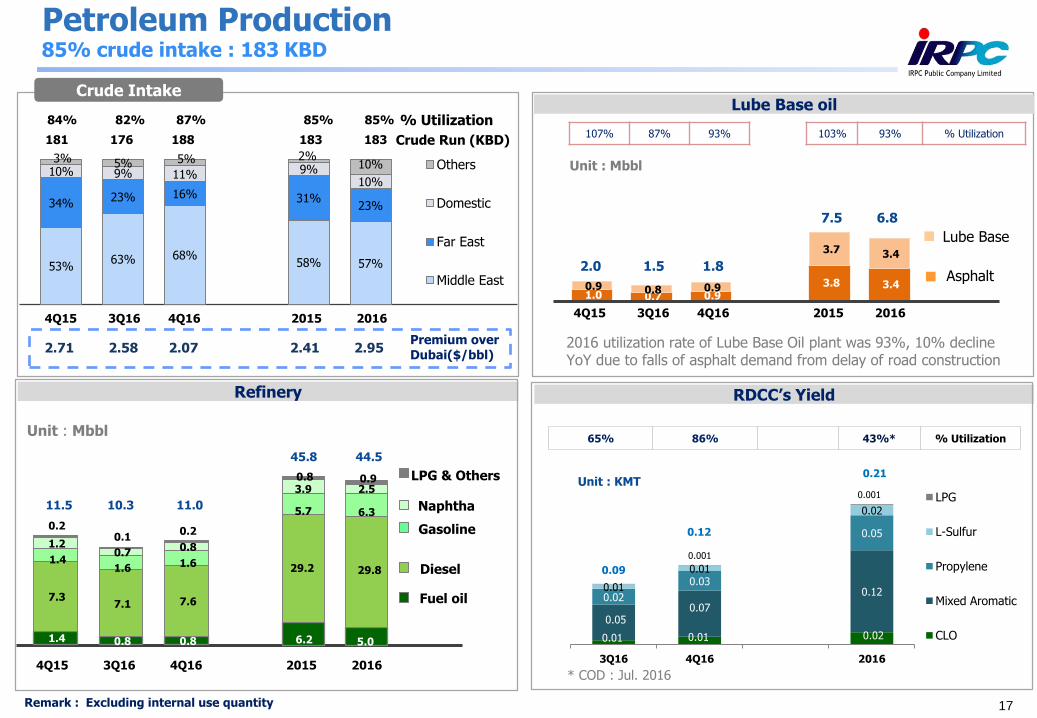
Remark : Excluding internal use quantity 17
Crude Run (KBD)
Crude Intake
53%63% 68%
58% 57%
34%23% 16% 31%
23%
10% 9% 11% 9%10%
3% 5% 5% 2%10% Others
Domestic
Far East
Middle East
Premium over Dubai($/bbl)
4Q15 3Q16 4Q16 2015 2016
84% 82% 87% 85% 85%
181 176 188 183 183
2.71 2.58 2.07 2.41 2.95
Lube Base oil
2.0 1.5 1.8
Unit : Mbbl
Refinery
LPG & Others
Unit : Mbbl
Naphtha
Gasoline
Diesel
Fuel oil
6.2 5.0
29.2 29.8
5.7 6.3
3.9 2.5 0.8 0.9
1.4 0.8 0.8
7.3 7.1 7.6
1.4 1.6 1.6
1.2 0.7
0.8
0.2 0.1
0.2
11.5 10.3 11.0
45.8 44.5
7.5 6.8
Asphalt
Lube Base
% Utilization
4Q15 3Q16 4Q16 2015 2016
4Q15 3Q16 4Q16 2015 2016
85% crude intake : 183 KBD
0.01 0.01 0.02
0.050.07
0.120.02
0.03
0.05
0.01
0.01
0.02
0.001
0.001
0.09
0.12
0.21
3Q16 4Q16 2016
LPG
L-Sulfur
Propylene
Mixed Aromatic
CLO
RDCC’s Yield
Unit : KMT
65% 86% 43%* % Utilization
107% 87% 93% 103% 93% % Utilization
2016 utilization rate of Lube Base Oil plant was 93%, 10% decline YoY due to falls of asphalt demand from delay of road construction
* COD : Jul. 2016
4.4 2.0
4.0 3.9 2.7
2.7
2.1
1.4 2.3
2.2
7.1
4.1 5.4
6.2
4.9
4Q15 3Q16 4Q16 2015 2016
Lube Base
Refinery
Market GRM
Sales Volume & Revenue
13.7 12.9 13.9
54.0 52.0 1.8 1.6 1.7
8.1 7.2
15.5 14.5 15.6
62.1 59.2
4Q15 3Q16 4Q16 2015 2016
Lube Base
Refinery
Unit : Mbbl
16.7 16.2 17.3 66.6 67.0 Crude intake (M.bbl)
Unit : $/bbl
Sales Distribution
Unit : MB
18
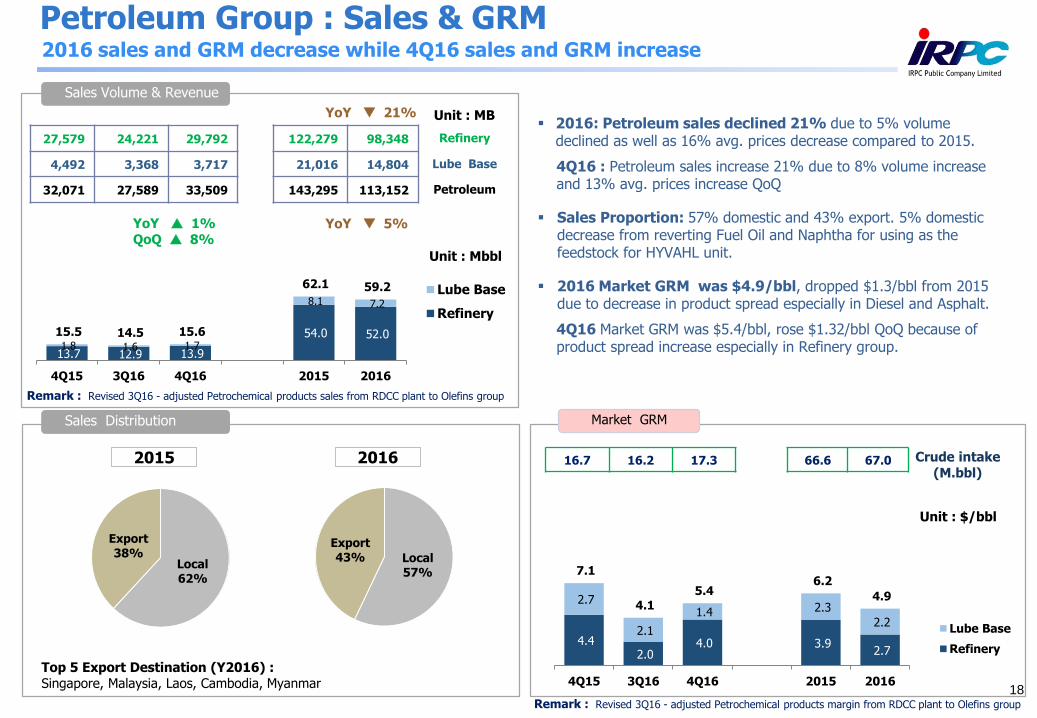
27,579 24,221 29,792 122,279 98,348 Refinery
4,492 3,368 3,717 21,016 14,804 Lube Base
32,071 27,589 33,509 143,295 113,152 Petroleum
Local62%
Export38%
2015
Top 5 Export Destination (Y2016) :Singapore, Malaysia, Laos, Cambodia, Myanmar
2016: Petroleum sales declined 21% due to 5% volume declined as well as 16% avg. prices decrease compared to 2015.
4Q16 : Petroleum sales increase 21% due to 8% volume increase and 13% avg. prices increase QoQ
Sales Proportion: 57% domestic and 43% export. 5% domestic decrease from reverting Fuel Oil and Naphtha for using as the feedstock for HYVAHL unit.
2016 Market GRM was $4.9/bbl, dropped $1.3/bbl from 2015 due to decrease in product spread especially in Diesel and Asphalt.
4Q16 Market GRM was $5.4/bbl, rose $1.32/bbl QoQ because of product spread increase especially in Refinery group.
Petroleum Group : Sales & GRM
YoY 1% QoQ 8%
YoY 5%
Local57%
Export43%
2016
Remark : Revised 3Q16 - adjusted Petrochemical products sales from RDCC plant to Olefins group
Remark : Revised 3Q16 - adjusted Petrochemical products margin from RDCC plant to Olefins group
2016 sales and GRM decrease while 4Q16 sales and GRM increase
YoY 21%
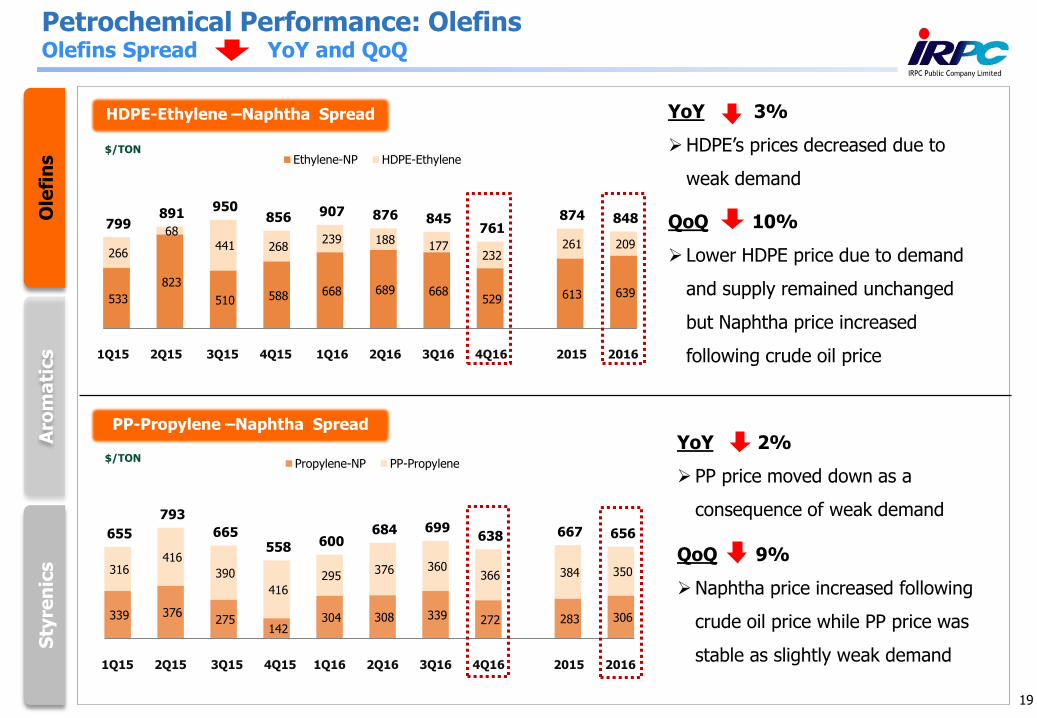
YoY 2%
PP price moved down as a
consequence of weak demand
QoQ 9%
Naphtha price increased following
crude oil price while PP price was
stable as slightly weak demand
YoY 3%
HDPE’s prices decreased due to
weak demand
QoQ 10%
Lower HDPE price due to demand
and supply remained unchanged
but Naphtha price increased
following crude oil price
19
Petrochemical Performance: Olefins
533
823
510 588 668 689 668 529 613 639
266
68
441 268 239 188
177 232
261 209
799 891
950 856 907 876 845
761 874 848
Ethylene-NP HDPE-Ethylene
HDPE-Ethylene –Naphtha Spread
Ole
fin
sS
tyre
nic
sA
rom
ati
cs
339 376 275
142 304 308 339 272 283 306
316 416
390
416 295
376 360 366 384 350
655
793
665 558 600
684 699 638 667 656
Propylene-NP PP-Propylene
PP-Propylene –Naphtha Spread
Olefins Spread YoY and QoQ
$/TON
$/TON
1Q15 2Q15 3Q15 4Q15 1Q16 2Q16 3Q16 4Q16 2015 2016
1Q15 2Q15 3Q15 4Q15 1Q16 2Q16 3Q16 4Q16 2015 2016
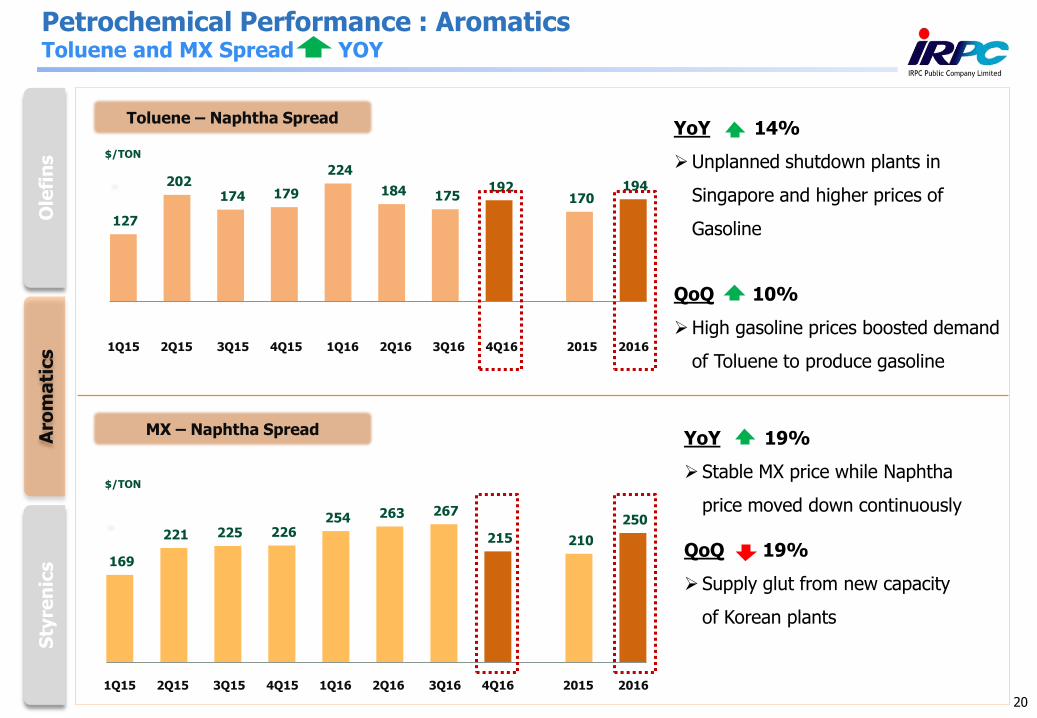
YoY 19%
Stable MX price while Naphtha
price moved down continuously
QoQ 19%
Supply glut from new capacity
of Korean plants
YoY 14%
Unplanned shutdown plants in
Singapore and higher prices of
Gasoline
QoQ 10%
High gasoline prices boosted demand
of Toluene to produce gasoline
127
202 174 179
224
184 175 192
170 194
20
Petrochemical Performance : Aromatics
169
221 225 226 254 263 267
215 210
250
MX – Naphtha Spread
Toluene – Naphtha Spread
Ole
fin
sS
tyre
nic
sA
rom
ati
cs
Toluene and MX Spread YOY
$/TON
$/TON
1Q15 2Q15 3Q15 4Q15 1Q16 2Q16 3Q16 4Q16 2015 2016
1Q15 2Q15 3Q15 4Q15 1Q16 2Q16 3Q16 4Q16 2015 2016
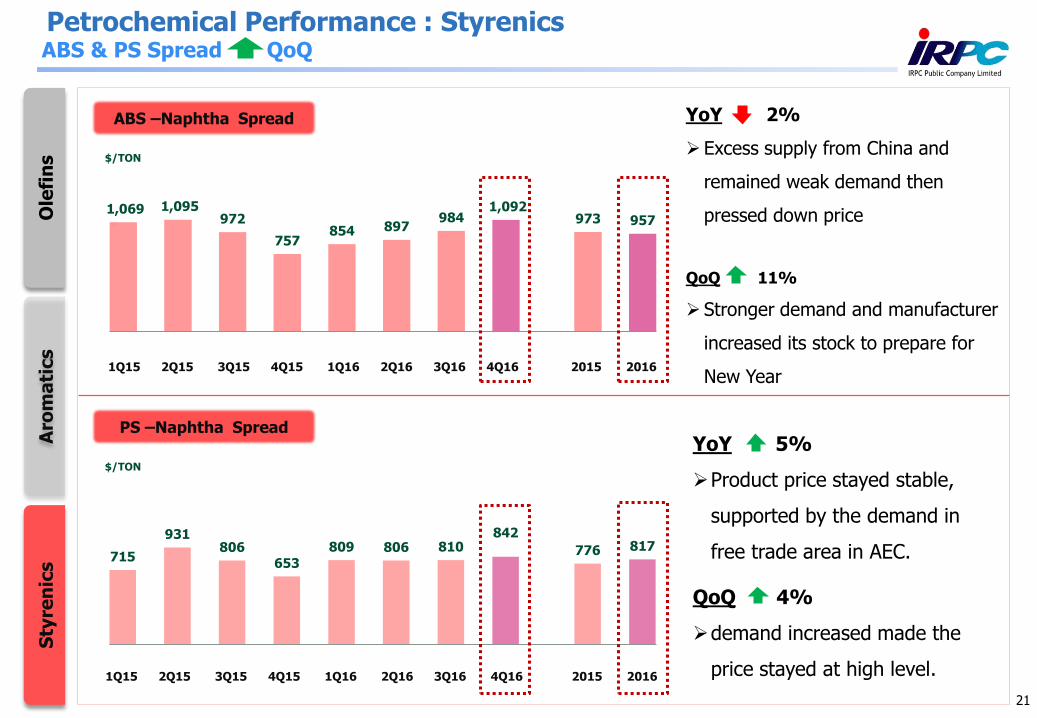
YoY 5%
Product price stayed stable,
supported by the demand in
free trade area in AEC.
QoQ 4%
demand increased made the
price stayed at high level.
YoY 2%
Excess supply from China and
remained weak demand then
pressed down price
QoQ 11%
Stronger demand and manufacturer
increased its stock to prepare for
New Year
21
Petrochemical Performance : Styrenics
715
931806
653
809 806 810842
776 817
1,069 1,095 972
757854 897
9841,092
973 957
PS –Naphtha Spread
ABS –Naphtha Spread
Ole
fin
sS
tyre
nic
sA
rom
ati
cs
$/TON
ABS & PS Spread QoQ
$/TON
1Q15 2Q15 3Q15 4Q15 1Q16 2Q16 3Q16 4Q16 2015 2016
1Q15 2Q15 3Q15 4Q15 1Q16 2Q16 3Q16 4Q16 2015 2016

4Q15 3Q16 4Q16 2015 2016
89% 88% 84% 90% 90% %Utilization
84% 89% 82% 83% 87% Polyolefins
94% 87% 85% 97% 92% Olefins
Styrenics
Aromatics
2016 : 90% utilization rate, same rate as 2015. Higher polyolefins after 2015 shutdown (Auto Saftey System) but lower olefins from RDCC integration and shutdown of Butadiene
4Q16: 84% Olefins utilization rate , 4% decrease QoQ as integration with RDCC plant and maintenance shutdown in Butadiene unit to repair the corrosion
Aromatics & StyrenicsOlefins
4Q15 3Q16 4Q16 2015 2016
95% 80% 93% 91% 91% %Utilization
78% 77% 80% 85% 84% Polystyrenics
105% 49% 105% 94% 82% Styrenics
104% 100% 98% 94% 100% Aromatics
Polystyrenics
52 43 36
226 185 121 136 126
506 534
173 179 162
732 718
Olefins
Polyolefins
Unit : KMTUnit : KMT
Remark : - Utilization rate calculated based on the main products- volume excluded internal use 22
Petrochemical Group : Production
2016 : 91% utilization rate, increase of Aromatics utilization rate after BTX unit shutdown 2015 while decrease of styrenics’ from EBSM shutdown
4Q16: 93% utilization rate, increase QoQ due to EBSM resumed its operation after Planned Shutdown in 3Q16
YoY Utilization rate unchanged
83 97 96
311 370
12 - 5
34 10
60 47 78
251 263
155 144 179
596 643
1.9 1.5 2.4 2.0 2.0
4.7 5.7 3.8 4.7 5.1
6.6 7.2
6.2 6.7 7.1
4Q15 3Q16 4Q16 2015 2016
Unit : $/bbl
Olefins &Polyolefins
Aromatics &Styrenics
172 163 180
633 677 184 226 224
791 857
356 389 404
1,424 1,534
4Q15 3Q16 4Q16 2015 2016
Olefins &Polyolefins
Aromatics &Styrenics
Unit : KMT
Market PTF ($/bbl)
Crude intake (Mbbl)
Sales Volume and Revenue
16.7 16.2 17.3 66.6 67.0
Sales DistributionUnit : MB
23
Petrochemical Group : Sales & PTF
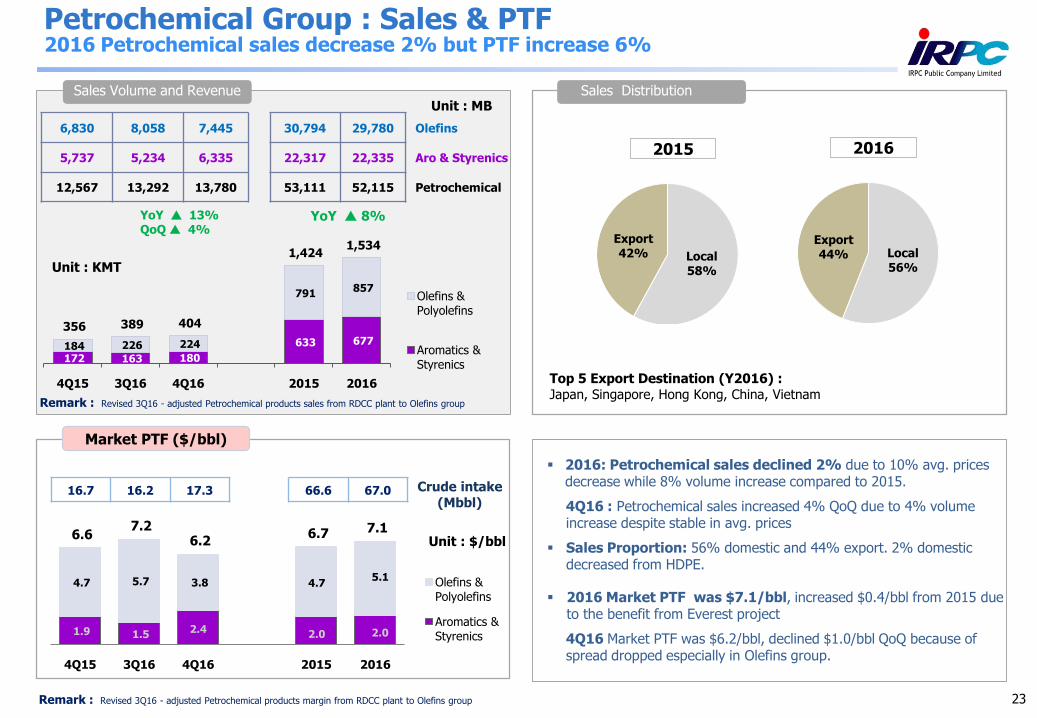
6,830 8,058 7,445 30,794 29,780 Olefins
5,737 5,234 6,335 22,317 22,335 Aro & Styrenics
12,567 13,292 13,780 53,111 52,115 Petrochemical
YoY 13%QoQ 4%
YoY 8%
Local58%
Export42%
2015
Top 5 Export Destination (Y2016) :Japan, Singapore, Hong Kong, China, Vietnam
Local56%
Export44%
2016
Remark : Revised 3Q16 - adjusted Petrochemical products sales from RDCC plant to Olefins group
Remark : Revised 3Q16 - adjusted Petrochemical products margin from RDCC plant to Olefins group
2016 Petrochemical sales decrease 2% but PTF increase 6%
2016: Petrochemical sales declined 2% due to 10% avg. prices decrease while 8% volume increase compared to 2015.
4Q16 : Petrochemical sales increased 4% QoQ due to 4% volume increase despite stable in avg. prices
Sales Proportion: 56% domestic and 44% export. 2% domestic decreased from HDPE.
2016 Market PTF was $7.1/bbl, increased $0.4/bbl from 2015 due to the benefit from Everest project
4Q16 Market PTF was $6.2/bbl, declined $1.0/bbl QoQ because of spread dropped especially in Olefins group.

13.99 13.04
0.70 0.34 0.79
2.63
0.39 0.54
7.1 6.0 4.0 4.1 5.4 6.2 4.9
6.6 6.7
8.3 7.2 6.2 6.7
7.1
1.0 1.0 1.1
1.2 1.0 1.1
1.0
14.7 13.7 13.4
12.5 12.6 14.0 13.0
4Q15 1Q16 2Q16 3Q16 4Q16 2015 2016
Petroleum Petrochem Power & Utility
Gross Integrated Margin (GIM)
24
2016 Net stock gain/(loss) was $-0.2/bbl(-576 MB) VS $-1.5/bblin 2015 (-3,415 MB)
2016 Accounting GIM was $12.8/bbl (30,457 MB) vs $12.5/bbl(28,741 MB) in 2015.
Accounting GIM
Product spreads $0.4/bblEverest project $0.5/bbl
Market GIM
$/bbl
2016 Market GIM decrease from lower spread though Acct. GIM increase from lower stock loss
Accounting GIM
$/bbl
14.7 13.7 13.4 12.5 12.6 14.0 13.0
(3.5)(1.2)
3.8 0.1 2.4
(1.0)
1.3
(1.3)(1.5) (1.4) (1.2) (1.9)
(0.5)(1.5)
9.9 11.0
15.811.4 13.1 12.5 12.8
4Q15 1Q16 2Q16 3Q16 4Q16 2015 2016
Hedging Stk G/(L) & LCM Market GIM
• 4Q16 Net stock gain/(loss) was $0.5/bbl (277 MB), vs $-1.1 /bbl in 3Q16 (-642 MB)
• 4Q16: Accounting GIM was $13.1/bbl (8,039 MB), vs $11.4/bbl(6,437 MB) in 3Q16
Product spreads $1.7/bblEverest project $0.8/bbl
MKT GIMY15
MKT Spread
Sales Performance
Premiumon Dubai
Fuel Loss& Internal
Use
UHV Project
EverestProject
Y15 = 4.02Y16 = 4.41
Y15 = (2.41)Y16 = (2.95)
Y15 = (3.66)Y16 = (2.96)
Y15 = 0Y16 = 0.34
Y15 = 0Y16 = 0.79
MKT GIMY16
MKT GIM: $0.95/bblYoY: -0.95$/bblQoQ: +0.1$/bbl
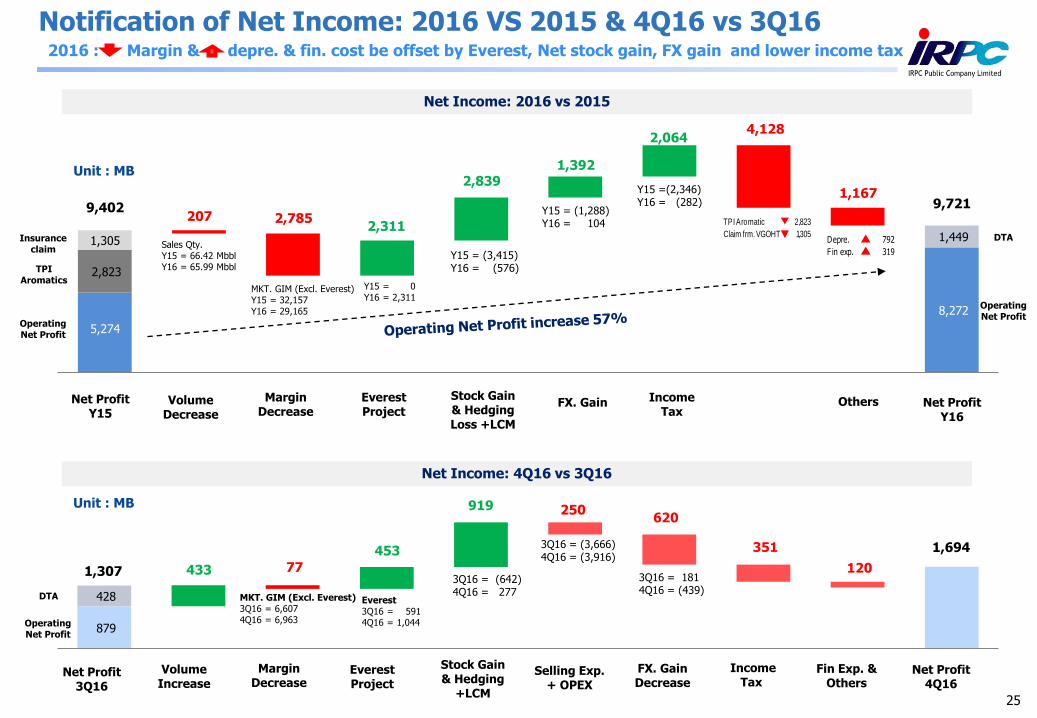
5,274
2,823
207
1,305
2,7852,311
2,839 1,392
2,064 4,128
1,167
8,272
1,449
Y15 = 0Y16 = 2,311
Y15 = (3,415)Y16 = (576)
Y15 = (1,288)Y16 = 104
Sales Qty.Y15 = 66.42 MbblY16 = 65.99 Mbbl
MKT. GIM (Excl. Everest)Y15 = 32,157Y16 = 29,165
Y15 =(2,346)Y16 = (282)
TPI Aromatic 2,823
Claim frm. VGOHT 1,305Depre. 792
F in exp. 319
25
Notification of Net Income: 2016 VS 2015 & 4Q16 vs 3Q16
Unit : MB
Net ProfitY15
Net ProfitY16
Volume Decrease
Margin Decrease
Stock Gain& Hedging Loss +LCM
OthersEverest Project
FX. Gain IncomeTax
9,402
Operating Net Profit
TPI Aromatics
Insurance claim
9,721
Operating Net Profit
DTA
Net Income: 2016 vs 2015
879
428
433 77
453
919 250 620
351
120
1,694
Everest3Q16 = 5914Q16 = 1,044
MKT. GIM (Excl. Everest)3Q16 = 6,6074Q16 = 6,963
3Q16 = (642)4Q16 = 277
3Q16 = (3,666)4Q16 = (3,916)
3Q16 = 1814Q16 = (439)
Net Profit3Q16
Net Profit4Q16
Volume Increase
Margin Decrease
Stock Gain& Hedging
+LCM
Fin Exp. & Others
Everest Project
FX. Gain Decrease
Selling Exp. + OPEX
Income Tax
Unit : MB
Net Income: 4Q16 vs 3Q16
2016 : Margin & depre. & fin. cost be offset by Everest, Net stock gain, FX gain and lower income tax
1,307
Operating Net Profit
DTA
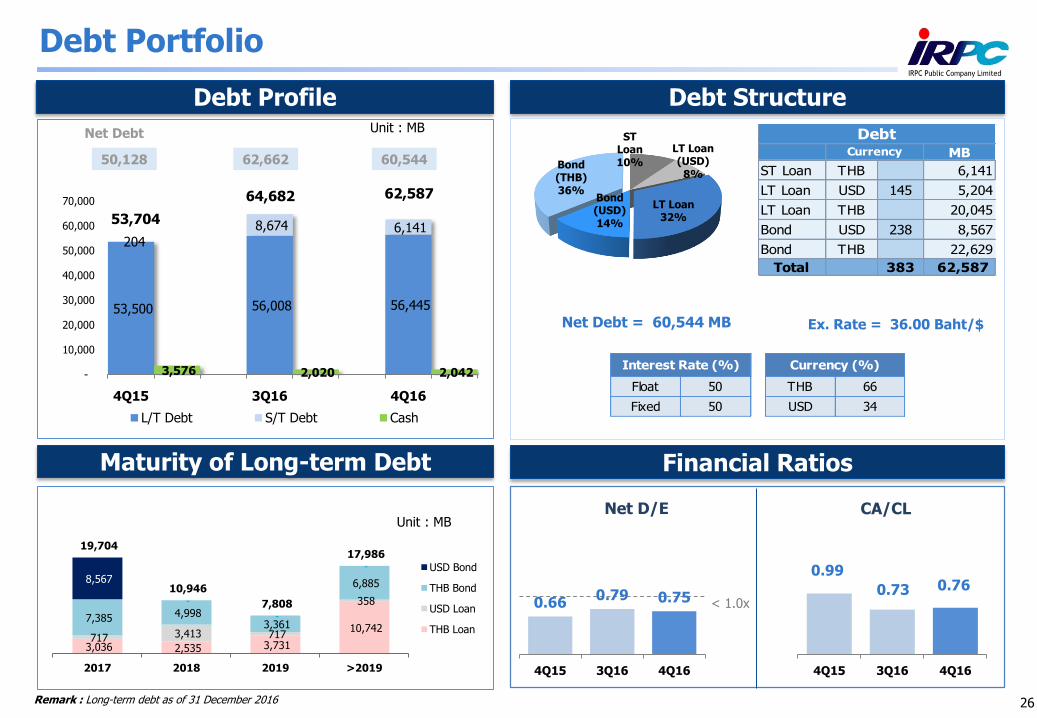
ST Loan10%
LT Loan (USD)
8%
LT Loan32%
Bond (USD)14%
Bond (THB)36%
Debt StructureDebt Profile
Debt Portfolio
Float 50 THB 66
Fixed 50 USD 34
Currency (%) Interest Rate (%)
Net Debt = 60,544 MB Ex. Rate = 36.00 Baht/$
Financial Ratios
0.99
0.73 0.76
4Q15 3Q16 4Q16
0.660.79 0.75
4Q15 3Q16 4Q16
< 1.0x
Net D/E CA/CL
Unit : MBNet Debt
Maturity of Long-term Debt
Unit : MB
53,500 56,008 56,445
204
8,674 6,141 53,704
64,682 62,587
3,576 2,020 2,042 -
10,000
20,000
30,000
40,000
50,000
60,000
70,000
4Q15 3Q16 4Q16
L/T Debt S/T Debt Cash
26
MB
ST Loan THB 6,141
LT Loan USD 145 5,204
LT Loan THB 20,045
Bond USD 238 8,567
Bond THB 22,629
Total 383 62,587
Debt Currency
50,128 60,54462,662
3,036 2,535 3,731
10,742 717 3,413 717
358
7,385 4,998 3,361
6,885 8,567
-
-
-
19,704
10,946
7,808
17,986
2017 2018 2019 >2019
USD Bond
THB Bond
USD Loan
THB Loan
Remark : Long-term debt as of 31 December 2016
27
2016 Performance Highlight
Achievement in 2016
Operation & Financial Performance
Industry Outlook 1
Agenda
Highlight from CEO

Challenging Crude Oil Market: Volatile Crude Oil Price
28
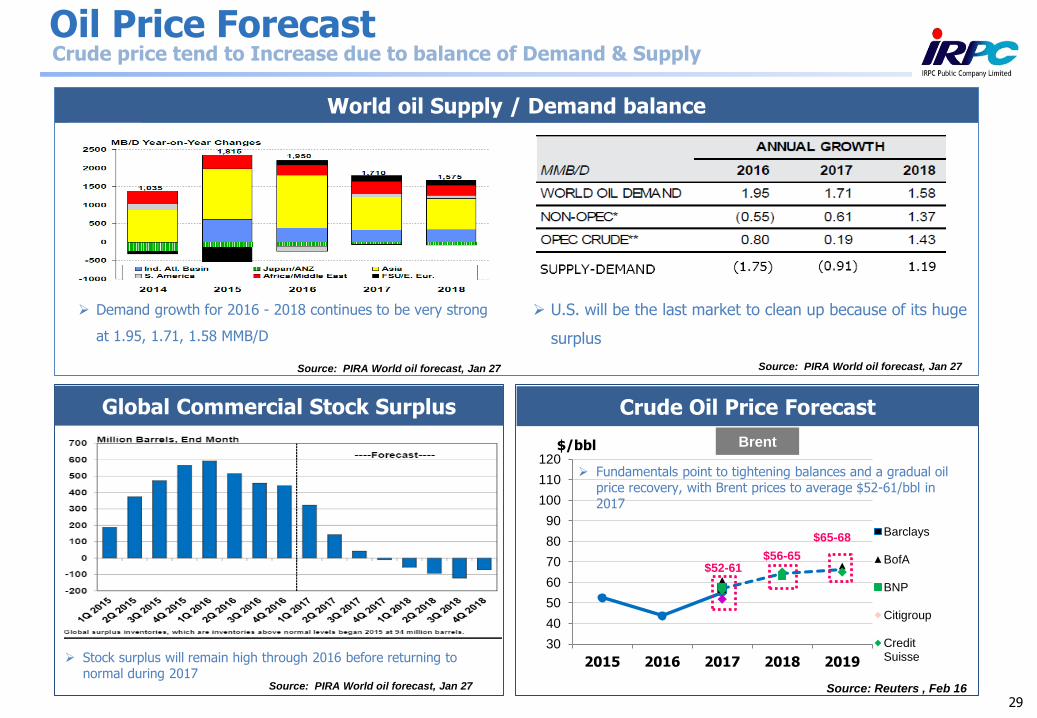
30
40
50
60
70
80
90
100
110
120
2015 2016 2017 2018 2019
Barclays
BofA
BNP
Citigroup
CreditSuisse
$52-61$56-65
$65-68
29
Oil Price Forecast
World oil Supply / Demand balance
Source: Reuters , Feb 16
$/bbl Brent
Source: PIRA World oil forecast, Jan 27
Demand growth for 2016 - 2018 continues to be very strong
at 1.95, 1.71, 1.58 MMB/D
Stock surplus will remain high through 2016 before returning to normal during 2017
Global Commercial Stock Surplus Crude Oil Price Forecast
Source: PIRA World oil forecast, Jan 27
Fundamentals point to tightening balances and a gradual oil price recovery, with Brent prices to average $52-61/bbl in 2017
U.S. will be the last market to clean up because of its huge
surplus
Source: PIRA World oil forecast, Jan 27
Crude price tend to Increase due to balance of Demand & Supply
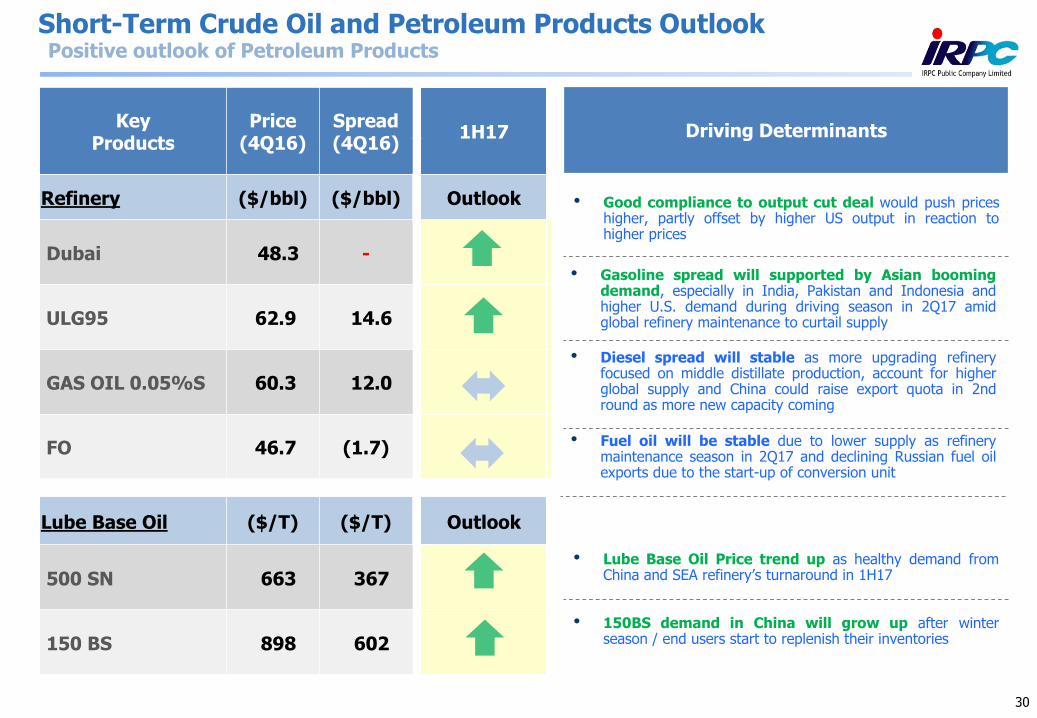
Short-Term Crude Oil and Petroleum Products Outlook
Driving Determinants
30
KeyProducts
Price(4Q16)
Spread(4Q16)
1H17
Refinery ($/bbl) ($/bbl) Outlook
Dubai 48.3 -
ULG95 62.9 14.6
GAS OIL 0.05%S 60.3 12.0
FO 46.7 (1.7)
Lube Base Oil ($/T) ($/T) Outlook
500 SN 663 367
150 BS 898 602
• Good compliance to output cut deal would push prices higher, partly offset by higher US output in reaction to higher prices
• Gasoline spread will supported by Asian booming demand, especially in India, Pakistan and Indonesia and higher U.S. demand during driving season in 2Q17 amid global refinery maintenance to curtail supply
• Diesel spread will stable as more upgrading refinery focused on middle distillate production, account for higher global supply and China could raise export quota in 2nd round as more new capacity coming
• Fuel oil will be stable due to lower supply as refinery maintenance season in 2Q17 and declining Russian fuel oil exports due to the start-up of conversion unit
• Lube Base Oil Price trend up as healthy demand from China and SEA refinery’s turnaround in 1H17
• 150BS demand in China will grow up after winter season / end users start to replenish their inventories
Positive outlook of Petroleum Products
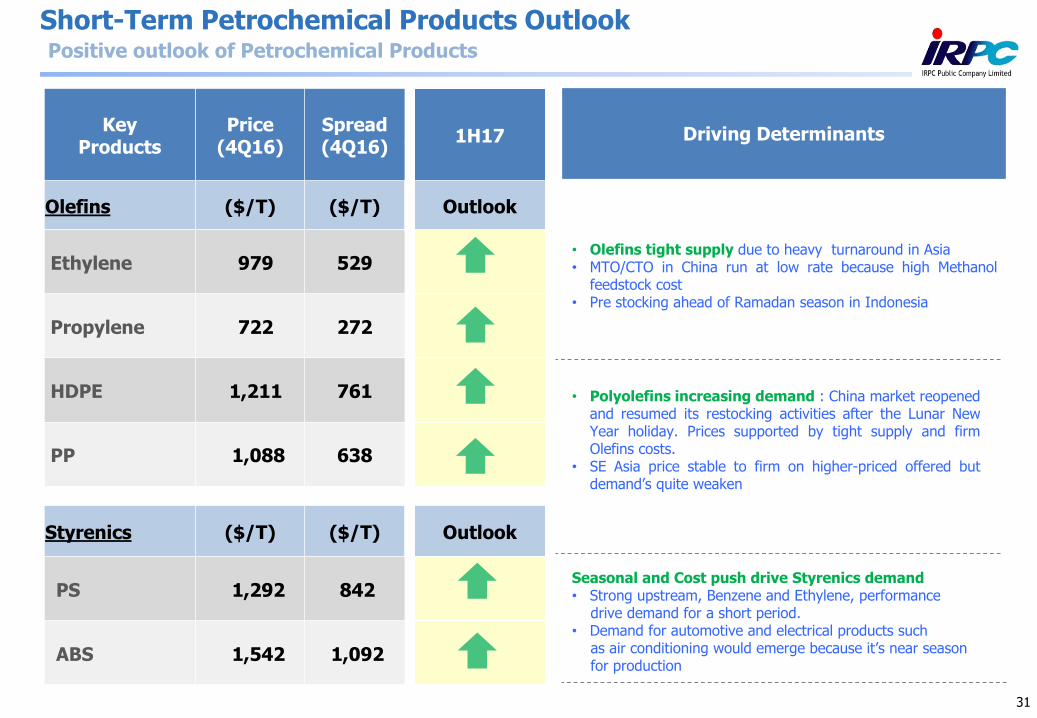
Short-Term Petrochemical Products Outlook
31
KeyProducts
Price(4Q16)
Spread(4Q16)
1H17
Olefins ($/T) ($/T) Outlook
Ethylene 979 529
Propylene 722 272
HDPE 1,211 761
PP 1,088 638
Styrenics ($/T) ($/T) Outlook
PS 1,292 842
ABS 1,542 1,092
Driving Determinants
Seasonal and Cost push drive Styrenics demand • Strong upstream, Benzene and Ethylene, performance
drive demand for a short period.• Demand for automotive and electrical products such
as air conditioning would emerge because it’s near seasonfor production
• Olefins tight supply due to heavy turnaround in Asia• MTO/CTO in China run at low rate because high Methanol
feedstock cost• Pre stocking ahead of Ramadan season in Indonesia
Positive outlook of Petrochemical Products
• Polyolefins increasing demand : China market reopened and resumed its restocking activities after the Lunar New Year holiday. Prices supported by tight supply and firm Olefins costs.
• SE Asia price stable to firm on higher-priced offered but demand’s quite weaken

32
2016 Performance Highlight
Achievement in 2016
Operation & Financial Performance
Industry Outlook
Agenda
Highlight from CEO1
33
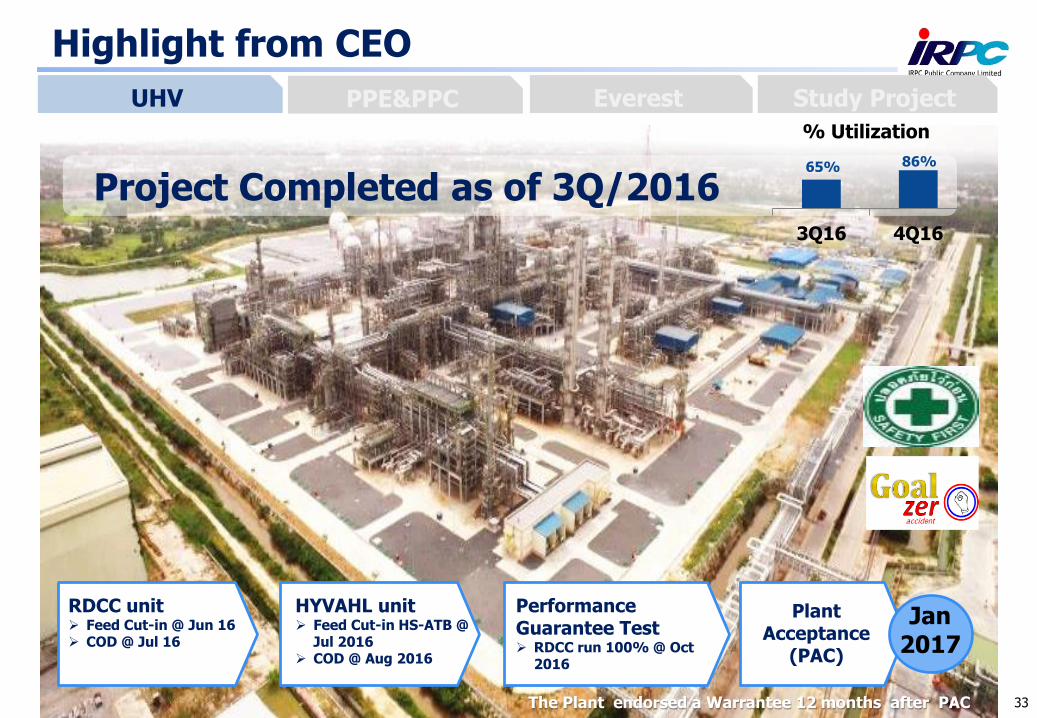
Highlight from CEO
Project Completed as of 3Q/2016
The Plant endorsed a Warrantee 12 months after PAC
RDCC unit Feed Cut-in @ Jun 16 COD @ Jul 16
HYVAHL unit Feed Cut-in HS-ATB @
Jul 2016 COD @ Aug 2016
Performance Guarantee Test RDCC run 100% @ Oct
2016
Plant Acceptance
(PAC)
65% 86%
3Q16 4Q16
% Utilization
Jan 2017
PPE&PPCUHV Study ProjectEverest
33

34
UHV Yield
PPE&PPCUHV Study ProjectEverest
43%
84%
95%
2016 2017 2018
RDCC Utilization RateProduct Yield
**
Including Turnaround period
*
***
COD : Jul. 2016

ERUC2’s
Next step of UHV: 1. Gasoline Maximization Project
35
RDCC Plant
Prime G Unit
PRU Unit
PNU Unit
LCN
Benzene rich cut 8 t/h
HCN (benzene <0.5 volume %) 27 t/h Gasoline pool
Naphtha
C4’s
Ne
w c
olu
mn
Poly-gasoline (C8’s)20 t/hr. to gasoline pool
Heavy Oligomerate (C12+’s)5 t/hr. to RDCC
Gasoline Blending Pool
Modification
Modification
Capex : 1,100 MB
COD : by end 2017
C3’s
ERU – Ethylene Recovery Unit PRU – Propane-Propylene Splitting Unit PNU – Naphtha Oligomer Unit Prime G – Naphtha Hydro-treating Unit
PPE&PPCUHV Study ProjectEverest
Objective : To capture domestic market gasoline deficit
36
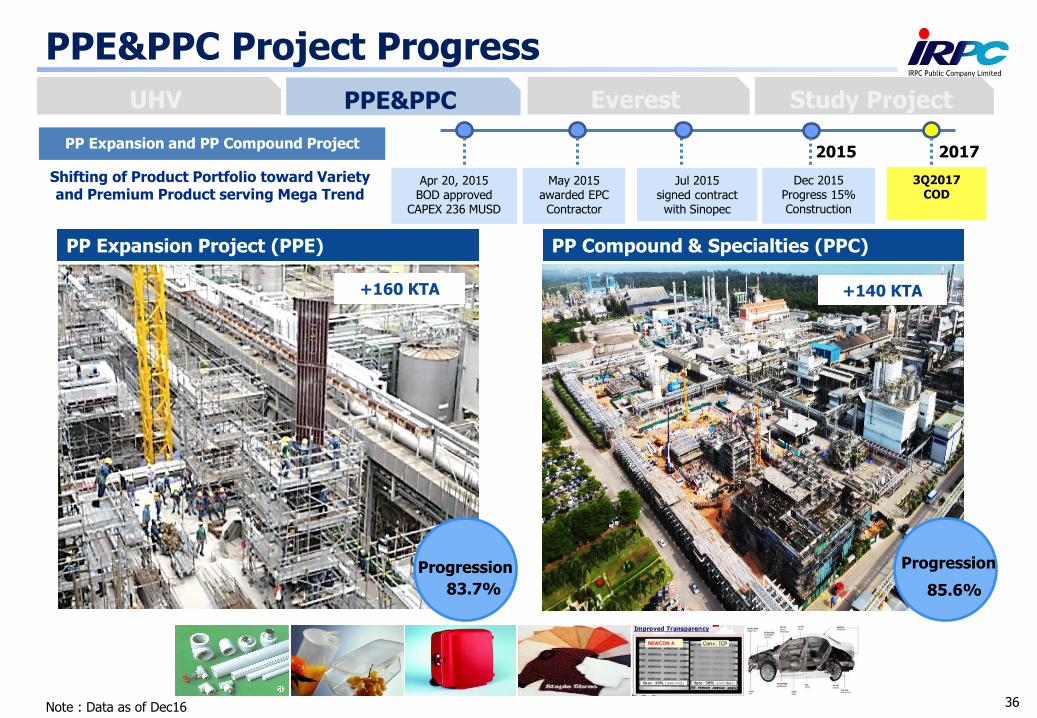
PPE&PPC Project Progress
PP Compound & Specialties (PPC)
+140 KTA
85.6%
Progression
PP Expansion Project (PPE)
+160 KTA
Progression
83.7%
PPE&PPCUHV Study ProjectEverest
Note : Data as of Dec16
3Q2017COD
Apr 20, 2015BOD approved
CAPEX 236 MUSD
May 2015awarded EPCContractor
Jul 2015signed contractwith Sinopec
Dec 2015 Progress 15%Construction
20172015
Shifting of Product Portfolio toward Variety and Premium Product serving Mega Trend
PP Expansion and PP Compound Project

37
Procurement area
Commercial area
Operations area
Corporate area
• Optimize crude selection, product blending and hydrocarbon stock
• Enhance throughput & yield by adjusting production unit parameter
• Maximize energy efficiency and reduce loss in production units
• Improve efficiency and effectiveness of maintenance
• Reduce production unit downtime and minimize operating days lost
• Maximize commercial value generation from refined petroleum and
petrochemical products
• Optimize timing, duration and cost of turnaround
• Spend optimization with key expenditure categories
• Optimize small CAPEX spend for highest value expenditures
• Develop capabilities to sustain both performance and health
• Improve organizational health practices for top quartile outcomes
• Optimize planning and policies to ensure continued productivity enhancement
2,083
549
399
385
1,091
778
277
165
3,416 2,311Total
Target
Y2016
Actual
Y2016
Everest Project : Y2016 Benefit
PPE&PPCUHV Study ProjectEverestEBIT
(Unit : MB)

38
Procurement Area
Commercial Area
Operations Area
Corporate Area - Non HR
• Maximize energy efficiency and reduce loss in production units
• Improve efficiency and effectiveness of maintenance
• Reduce production unit downtime and minimize operating days lost
• Maximize commercial value generation from refined petroleum and petrochemical products
• Asset Port and Tank management
• Optimize timing, duration and cost of turnaround
• Spend optimization with key expenditure categories
• Optimize small CAPEX spend for highest value expenditures
• Budget management
• Optimize planning and policies to ensure continued productivity
enhancement
2,560
1,921
177
281
1,091
778
277
165
7,003 2,311Total
Y2017 (Target) Y2016 Actual
Unit: MB of EBIT
Everest Project : Y2017 Target
PPE&PPCUHV Study ProjectEverest
$
Integrated Supply Chain• Optimize crude selection, product blending and hydrocarbon stock
• Enhance throughput & yield by adjusting production unit parameter
Corporate Area - HR
• Develop capabilities to sustain both performance and health
• Improve organizational health practices for top quartile outcomes
1,348
716

39
IRPC Strategic Roadmap to 2020
2010
2014
20162017
Margin Improvement
• Operational Excellence
• Commercial Excellence
• Procurement & HR
Excellence
Benefit +134 MUSD
Incremental MarginOrganization Health• Capability Building
• Owner mindset &
Performance Orientation
• Cultural Changes
• Ethylene Revamp
• PX
• AA/SAP
Potential Investments
INDIVIDUAL OWNERSHIP
SYNERGY
PERFORMANCE EXCELLENCE
INNOVATION
RESPONSIBILITY FOR SOCIETY
INTEGRITY & ETHICS
TRUST & RESPECT
BIG
Revenue Growth of 5%
EBITDA Growth of 10%
1st Quartile ROIC in
Petroleum &
Petrochemical Industry STRONGLONG
Member of DJSI
Emerging Markets
Universe
Project Completion
Operational Efficiency ImprovementAsset Utilization EnhancementProduct and Service ImprovementCapacity and Products Expansion
Fully Integrated PP
Capacity Before After
CHP I
- Electricity 108 MW 328 MW
- Steam 200 T/hr 620 T/hr
PRP 312 KTA 412 KTA
EBSM 200 KTA 260 KTA
Capacity Before AfterPropylene
(UHV)412 KTA
732
KTA
Capacity Before AfterPP
(PPE&PPC)475 KTA 775 KTA
To capture benefits and growth after investment to reach TQ ROIC
PPE&PPCUHV Study ProjectEverest

ETP Revamp Project
Naphtha , LPG
Px Project (new)
Paraxylene
Benzene
Other Products
Available Feedstock
HN ,HCN , MX ,Tol
Project under study: Beyond Everest
40
PygasRaffinate LPG
Total 1,100-1,270 KTA
Total 280 - 300 KTA
Existing + UHV : Petrochem. Yield 15 %
PPE&PPC Study projectUHV Everest
After “Beyond Everest”: Petrochem. Yield 28-30%
Ethylene
Propylene
Other Product

Thank You
Investor Relations Contact: [email protected]
Tel. 02-649-7380, Fax. 02-649-7379
Presentation is available at
www.irpc.co.th
Click “Presentations”
This presentation material has been prepared solely for informational purposes only. IRPC is furnishing it solely for use by prospective investors / analysts in
the proposed event. IRPC makes no representations or warranties as to the accuracy or completeness of such information. By accepting this material each
recipient agrees that IRPC shall not have any liability for any representations (express or implied) contained in, or for any omissions from this presentation.
The information contained herein does not purport to be all-inclusive or to contain all of the Information that may be material to the recipient’s decision. Each
recipient of the information and data contained herein should perform its own independent investigation and analysis of the transaction and the creditworthiness of IRPC . Reference in this Disclaimer to this shall include references to the Appendices (if any) hereto.
115,997 121,361
11,192 11,169
32,408 37,806
3,576 2,042
75,878 81,005
1,851 2,203
53,500 56,445
31,94532,725
43
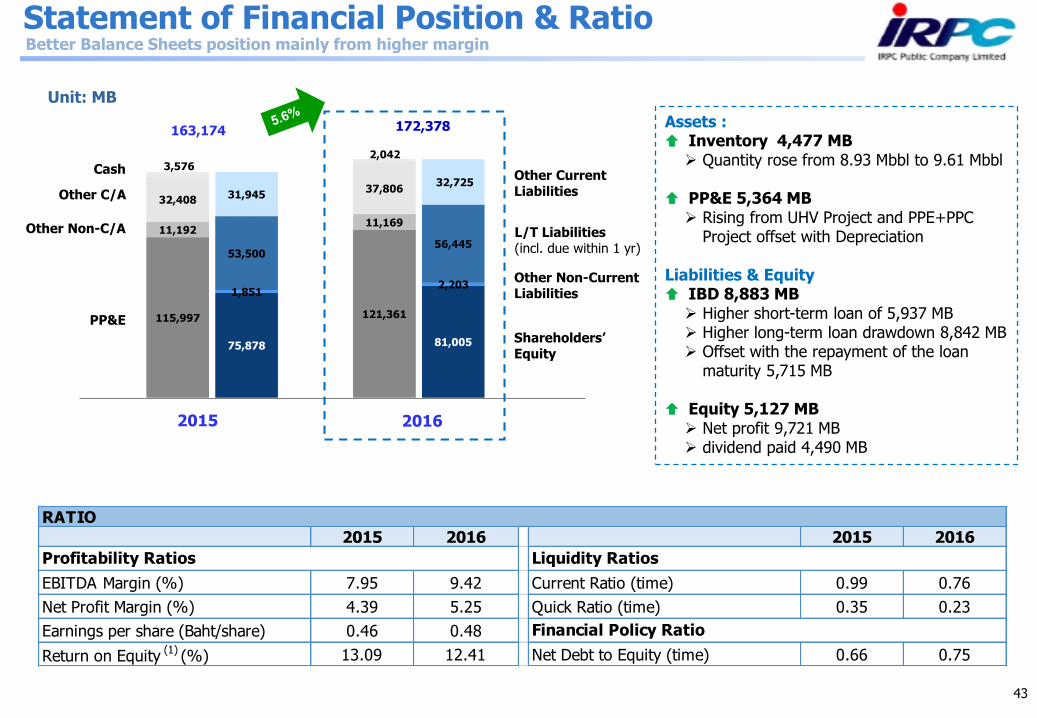
Statement of Financial Position & Ratio
Unit: MB
PP&E
Other Non-C/A
Cash
163,174
Other CurrentLiabilities
L/T Liabilities(incl. due within 1 yr)
Shareholders’Equity
2016
172,378
2015
Assets : Inventory 4,477 MB Quantity rose from 8.93 Mbbl to 9.61 Mbbl
PP&E 5,364 MB Rising from UHV Project and PPE+PPC
Project offset with Depreciation
Liabilities & Equity IBD 8,883 MB Higher short-term loan of 5,937 MB Higher long-term loan drawdown 8,842 MB Offset with the repayment of the loan
maturity 5,715 MB
Equity 5,127 MB Net profit 9,721 MB dividend paid 4,490 MB
Other C/A
2015 2016 2015 2016
EBITDA Margin (%) 7.95 9.42 Current Ratio (time) 0.99 0.76
Net Profit Margin (%) 4.39 5.25 Quick Ratio (time) 0.35 0.23
Earnings per share (Baht/share) 0.46 0.48
Return on Equity (1)
(%) 13.09 12.41 Net Debt to Equity (time) 0.66 0.75
RATIO
Financial Policy Ratio
Profitability Ratios Liquidity Ratios
Other Non-CurrentLiabilities
Better Balance Sheets position mainly from higher margin
2016 2015
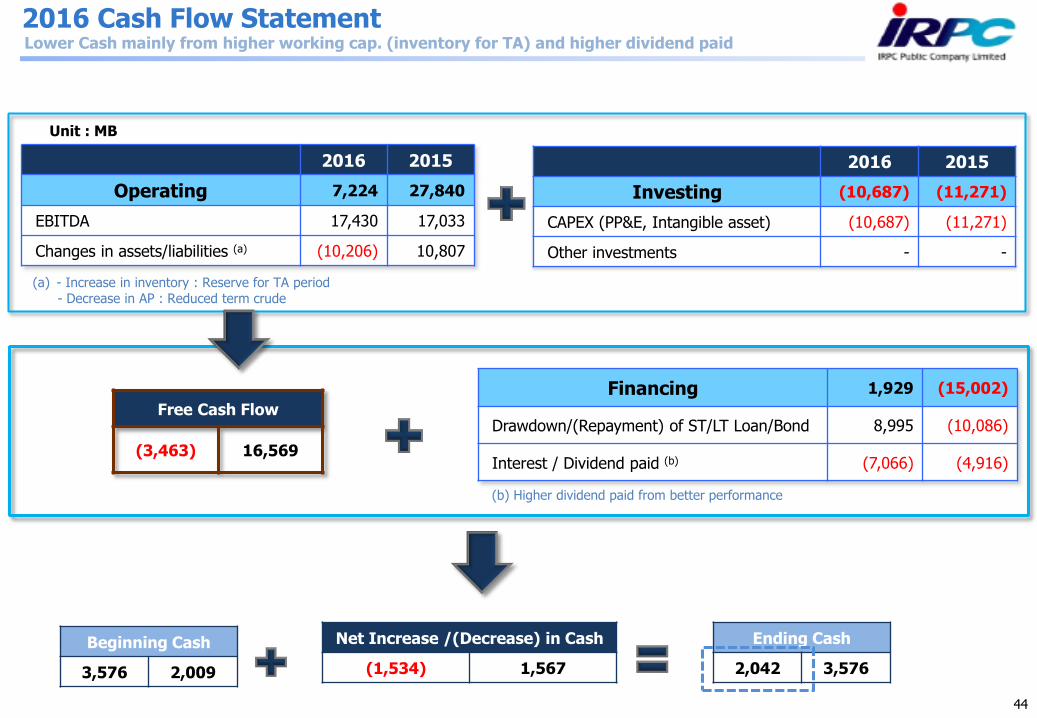
Operating 7,224 27,840
EBITDA 17,430 17,033
Changes in assets/liabilities (a) (10,206) 10,807
Unit : MB
Financing 1,929 (15,002)
Drawdown/(Repayment) of ST/LT Loan/Bond 8,995 (10,086)
Interest / Dividend paid (b) (7,066) (4,916)
Free Cash Flow
(3,463) 16,569
2016 2015
Investing (10,687) (11,271)
CAPEX (PP&E, Intangible asset) (10,687) (11,271)
Other investments - -
Net Increase /(Decrease) in Cash
(1,534) 1,567
Beginning Cash
3,576 2,009
Ending Cash
2,042 3,576
2016 Cash Flow Statement
44
Lower Cash mainly from higher working cap. (inventory for TA) and higher dividend paid
(a) - Increase in inventory : Reserve for TA period- Decrease in AP : Reduced term crude
(b) Higher dividend paid from better performance