is a vc partnership greater than the sum of its partners?
TRANSCRIPT

Is a VC Partnership Greater Than the Sum of its Partners?
MICHAEL EWENS and MATTHEW RHODES-KROPF∗
ABSTRACT
This paper investigates whether individual venture capitalists have repeatable investment skill and
the extent to which their skill is impacted by the VC firm where they work. We examine a unique
data set that tracks the performance of individual venture capitalists’ investments over time and as
they move between firms. We find evidence of skill and exit style differences even among venture
partners investing at the same VC firm at the same time. Furthermore, our estimates suggest the
partner’s human capital is two to five times more important than the VC firm’s organizational
capital in explaining performance.
JEL classification: G24, G30.
∗Ewens is with Carnegie Mellon University, Tepper School of Business and Rhodes-Kropf is with Harvard BusinessSchool. We thank Viral Acharya, Joshua Coval, Peter DeMarzo, Joan Farre-Mensa, Thomas Hellmann, Bill Kerr, JoshLerner, Ramana Nanda, David Robinson, Merih Sevilir, and Morten Sorensen for fruitful discussion and commentsas well as participants at the American Finance Association meetings, Fed/NYU Conferences on Private Equity,Washington University 9th Annual Corporate Finance Conference, Stanford / JOIM Private Equity conference,Jackson Hole Finance Group conference, Harvard University, Stanford University GSB, Case Western University, aswell as Correlation Ventures and VentureSource for access to the data. Both authors are advisors to and investors inCorrelation Ventures. All errors are our own.
Venture capital (VC) investments are an important engine of innovation and economic growth,
but extremely risky from an individual investor’s point of view. For instance, Sahlman (2010)
reports that 85% of returns come from just 10% of investments, and over the period 1987 to
2012 only 12.8% of investments achieved an initial public offering.1 Furthermore, there are large
differences in fund performance between top-quartile and bottom-quartile VC funds. In spite of
the rarity of top-performing investments, however, Kaplan and Schoar (2005) report persistence
in fund performance. They show that in contrast to other asset classes such as mutual funds, VC
firms that have a fund that outperforms the industry are likely to outperform with their next fund.
The ability to consistently produce top-performing investments implies that there is something
unique and time-invariant about VC firms. For example, deal flow (Sorensen (2007)) and networks
(Hochberg, Ljungqvist, and Lu (2007)) can explain much of the cross section of VC fund perfor-
mance. Hellmann and Puri (2002) report that higher quality VCs have industry experience and
Gompers, Kovner, and Lerner (2009) find that VC partner specialization can explain cross-sectional
differences in performance. There could also be firm policies or complementarities among partners
or other attributes that facilitate consistent top performance.
However, the extent the attributes important to performance are part of the VC firm’s organi-
zational capital versus embodied in the human capital of the people inside the VC firm is an open
question. An extreme possibility is that such attributes are embedded in the firm and the people are
substitutable. At the other extreme, a venture firm is simply a collection of people. To illustrate,
consider another human-capital-intensive environment we all know well, namely, universities. The
question we explore is similar to asking whether an academic performs better at a top institution
or whether top institutions are just collections of top academics. The greater resources, reduced
teaching, better students, better colleagues, etc. of top institutions could make any researcher
more productive, which would imply a large effect from organizational capital. Alternatively, bet-
ter research could come from human capital differences, implying that researchers would perform
equally well at any school. In the context of VC firms, features such as brand, resources, reputation,
firm deal flow, firm network, investment processes, better colleagues, etc. could all help a partner
perform better. Alternatively, an individual might have the reputation, network, deal flow, and
ability to find, identify, or make investments. Furthermore, just as university quality may be more
important to researchers who do particular types of research, the firm may be more important to
2
partners involved in IPOs rather than acquisitions.
Shedding light on the sources of performance in VC firms improves our understanding of whether
a firm is more than the sum of its parts. Williamson and Winter (1993) credit (Klein, 1988, p.
220) with distinguishing physical from human asset specificity. They note that Klein (1988), in a
response to Coase (1988), was the first to argue that while an “organization is embedded in the
human capital of the employees” at the firm, it is “greater than the sum of its parts. The employees
come and go but the organization maintains the memory of past trials and the knowledge of how
to best do something.” Under this hypothesis, the venture firm holds some of the knowledge of
how to make great investments. Hart(1989, p. 1772) further argues that “the observation that the
whole of organizational capital is typically greater than the sum of its parts is equivalent to the
observation that the total output of a group of workers typically exceeds the sum of the workers’
individual outputs, to the extent that there are complementarities.” Complementarities with a VC
firm would imply that partners should match on quality and thus firms should contain partners
of similar ability (see Becker (1981), Kremer (1993), Burdett and Coles (1997), and Shimer and
Smith (2000) for work on complementarities and matching).
VC provides an opportunity to study this question because we can assign individual investments
to partners and follow the latter over time as they move between firms, which allows us to analyze
the relative importance of partners and firms in performance. On the other hand, focusing on VC
limits the generalizability of our results.
We begin by examining persistence at the individual partner-investment level. To do so, we
use the VentureSource database of VC investments in entrepreneurial firms founded between 1987-
2005 (to allow time to observe outcomes) augmented with hand-collected data. We find evidence
of venture partner skill. For example, controlling for observable firm, partner, and investment
characteristics such as time, industry, dollars invested, VC experience, investment round number,
firm founding date, etc., we find that among partners who made at least three investments, a
one standard deviation increase in past IPO rate implies a 18% higher probability of an IPO in
their third investment.2 Given the rarity of IPOs, the strength of persistence at the partner-
investment level is quite high, particularly in light of recent work by Phalippou (2010), who argues
that ex-ante persistence comes only from low performance and that the Kaplan and Schoar (2005)
results are exaggerated. Our evidence of strong persistence in IPOs, even with numerous deal- and
3
partner-level controls not before possible, provides support for Kaplan and Schoar’s (2005) original
fund-level persistence results as well as recent work on fund persistence by Hochberg, Ljungqvist,
and Vissing-Jrgensen (2014) and Harris, Jenkinson, Kaplan, and Stucke (2014).
We also investigate persistence in other types of exits. On average, the same partners who
have IPO’d will continue to IPO, those who achieve top exits through a merger or acquisition will
continue to do so, and those who fail will continue to fail. Overall, it seems that partners have exit
“styles” insofar as they make investments that tend to exit in the same way.3
Next, we include the past performance of the firm’s other partners to study the role of the firm
in partner performance persistence. We find that a firm’s past IPO success rate also correlates
with a partner’s probability of achieving an IPO on his next investment. Of course, we cannot tell
if this is because similar-quality partners join together to form a firm (as implied by assortative
matching), in which case past firm performance is just more information about partner quality, or
if better firms make it more likely that a partner will IPO.
When we include a measure of VC fund fixed effects using five-year investment windows, we
continue to find significant persistence. That is, even comparing partners in the same firm investing
at the same time, we find persistence in their relative ability to IPO or achieve top merger and
acquisition exits. This finding demonstrates the strength of the persistence. Assortative matching
should have driven like-quality partners to join together, but on average VC firms do not seem to
be collections of similar-quality partners.
The performance persistence of the average VC partner highlights the potential importance of
the partner as well as the firm but does not reveal their relative importance. To separate the firm
and the partner, we exploit partner movement between firms. To the extent that partners change
performance as they move firms, “ability” will be allocated to the firm based on complementarities,
policies, brand, etc. If moving partners do not alter their own or their co-partners’ performance,
then “ability” will be allocated to the partner. Bertrand and Schoar (2003) employ a similar
idea when they examine CEOs who move firms to identify manager effects on firm policies, while
Graham, Li, and Qiu (2012) use executives who move to determine the relative importance of firm
and person in executive compensation. We employ the method developed by Abowd, Kramarz,
and Margolis (1999) (henceforth AKM) and Abowd, Creecy, and Kramarz (2002) to distinguish
partner and firm effects on the performance of VC investments.4
4

Estimates of the VC partner and firm fixed effects provide evidence on the relative importance
of VC partner human capital and VC firm organizational capital. Across different specifications we
find that the partner fixed effects are more likely to be jointly significant than the VC firm fixed
effects, and that the partner fixed effects estimates explain two to five times the variation in exit
values relative to VC firm fixed effects. Thus, our estimates suggest that both the partner and the
VC firm can affect performance, but the partner’s human capital is more important. The partner
fixed effect estimates also demonstrate significant heterogeneity in partner type. Translated into
level of exit valuation, the distribution of partner fixed effects implies that top-quartile partners
produce at least $82m on average in exit valuation, while bottom-quartile partners produce less
than $4m. To put this in context, the mean exit value is $151m and the median is zero. The strong
partner fixed effects calls for further study of individual partner characteristics (see Zarutskie (2010),
Bottazzi, Da Rin, and Hellmann (2008), and Acharya, Gottschalg, Hahn, and Kehoe (2013)), such
as gender, education, networks, and experience, to better understand VC outcomes.
The use of movers in this part of the analysis clearly restricts our sample to partners at firms
where someone transferred to or away from the firm. The excluded sample covers 40% of VC firms
that are less active and smaller. The included sample represents the active and central part of the
VC community as it covers 74% of venture-backed investments.
The use of movers also introduces the concern that endogenous moving affects our results. In
our final sample, over 30% of partners change firms and thus provide ample data on movement.
However, our findings only tell us the average effect of movement on partners who move. The
extent to which partners who do not move would be similarly affected is unknown. As in all papers
that use movement as an identification strategy, some endogeneity concerns cannot be eliminated.
What we can do is consider the probable impacts from endogenous movement as well as examine
different subsamples and controls to address empirical concerns.
Recall that the estimation technique uses changes in movers’ investment performance around
the move to identify firm fixed effects. We separately study partners who move to historically worse-
performing firms compared to those who move to historically better-performing firms. Movers to
better firms are more likely choosing to move and doing so in anticipation of changes to their
performance. We also consider partners who move to very different firms versus partners who
move to similar firms. In all cases, the conclusions about the relative value of the firm are similar.
5
Despite these and other attempts to deal with endogeneity, however, we acknowledge that we cannot
completely eliminate the issue and thus our results must be interpreted with some caution.
The balance of the paper is organized as follows. First, in Section I we explore the data and
variables of interest. Next, in Section II we study persistence at the partner level across a range
of outcomes. Section III presents estimation of a full fixed effects model, and Sections IV and V
present subsample and robustness results for all estimates. Section VI concludes.
I. Data Description
The main data set begins with the VC financings, investors, partners, and entrepreneurial
firms from the VentureSource database maintained by Dow Jones. Using quarterly surveys, press
releases, and regulatory filings, VentureSource provides a comprehensive picture of the VC market.
The full database covers 1987 to 2012 and includes 27,079 financings in 16,897 entrepreneurial firms
financed by 3,777 investing firms. We augment the data on three fronts with information provided
confidentially by several VC firms, limited partners, web searches and public data sources.5 First,
we extend exit or investment valuations – more often missing in similar databases – for a larger set
of acquisitions and public offerings through searches of S-1 filings, a merge of VentureSource with
SDC’s merger and acquisition data, and analysis of some limited partner and VC firm portfolios.6
We believe the resulting exit valuations are more representative of exits than those in the standard
data sources. Second, we conduct web searches of VC firm websites, Capital IQ biography data, and
other pieces of data within VentureSource to identify where VC partners in VentureSource worked
when they made their investments. These consistency checks also ensure that we separately identify
partners with the same name. The resulting database covers the employment history of VC partners
from 1987 to 2012. We further validate a large, random pool of board seats using VentureXpert and
“Form D” regulatory filings. The latter are the required filings of sales of private securities that
report amounts invested and directors (i.e., VC board members). This analysis found no systematic
errors and confirmed that we have a comprehensive data set of venture partner investments.
The panel of VC partner board members covers 1987 to 2012, where a board member is any
investor listed on an entrepreneurial board and associated with a VC or other investing firm. This
definition excludes outside board members or any of the management team of the entrepreneurial
6

firm. We only include board members in the data that have at least two entrepreneurial board
seats for firms founded prior to 2006 and whose investing firm has made at least four investments
over the full sample period. The latter restriction eliminates small VCs, those that rarely take
board seats, and many corporate venture capitalists. The major sample includes 19,031 financings,
11,885 entrepreneurial firms, 1,573 investing firms, and 5,324 unique VC partners.7 The average
board member has six board seats (median four).
VC partners who switch VC firms are an important part of our analysis. After correcting data
on board membership that matches partners to board seats, we can track movement of individuals
between VC firms. We label a mover as a VC partner with multiple board seats assigned to different
VC firms. Analyzing the change in titles for mover’s first move shows that the vast majority are
promoted or remain at the same level. In particular, 45% of movers start as general partners (GP),
with 76% moving up to managing director or remaining a GP, while only 27% of the movers who
start as managing directors appear to be demoted after their first move.8 Section III provides
additional information about movers and the firms they move to and from, as well as a comparison
with nonmovers.
We employ several dependent variables of interest throughout the analysis.9 We initially follow
the literature and characterize success by whether the entrepreneurial firm had an IPO. Some 12% of
entrepreneurial firms in the sample and 10% of board seats have such an exit (some entrepreneurial
firms have multiple observations because there are multiple board seats). The IPO variable is a
weaker measure of success since 2002, as 90% of nonfailure exits are acquisitions.
We also consider success through acquisitions. We create the dummy variable Successful ac-
quisition that equals one if the entrepreneurial firm sold via a merger or acquisition at a reported
value at least twice the total capital invested. We cannot determine actual returns for acquisitions
because we do not know the amount returned to the VC at exit, but if the total sale value was
more than twice the amount invested, then it is likely to be a more successful exit on average than
exits with a smaller exit value to investment ratio.10 We also cannot use all acquisition outcomes
because some do not report a value and many appear to be disguised failures. However, the largest
acquisitions (greatest successes) tend to have reported values because the acquisition is material to
the public acquirer and thus required to be disclosed.
Combining IPOs and successful acquisitions into a single outcome, the fraction of success is
7

23% for entrepreneurial firms and 21% for board seats. Along with these two success variables, a
dummy variable Failure is set to one if the firm shutdown, is still private by the end of the sample
(through 2012), or was acquired for less than twice total capital invested. The sample only includes
entrepreneurial firms founded prior to 2006, so this allows still private firms six years to exit. In
total there are six possibilities for an investment in our sample: IPO, successful acquisition, low
acquisition, no-reported-value acquisition, failure, or still private. As a final measure, we summarize
all outcomes into one variable using the log of one plus the exit value, which we set to zero for
failures. Since some firms have yet to exit or have a missing exit valuation, we deal with these firms
in two ways. In the main analysis we treat them as zeros, but we also drop them from the sample
and find similar results.11 Table II details these dependent variables and a host of controls that we
use through the analysis.
[Place Table II about here]
II. Results: VC Partner Performance Persistence
When a VC firm makes an investment in an entrepreneurial firm, the partner who led the
investment at the VC firm often takes a seat on the board. For each of these events, we calculate
the VC partner’s investment history. In particular, % IPO t − 1 measures the fraction of the
partner’s investments made prior to t that exited via an IPO. Performance persistence implies that
past performance has predictive power for future outcomes. Our analysis of persistence tracks the
relationship between a partner’s investment success and the outcome of the current board seat
investment (IPOt). Thus, we ask whether VC partners who have made more investments that
IPO’d in the past are more likely to IPO their current investment.
Attrition in the data may lead to a spurious relationship between past success and future
outcomes. The null hypothesis of no persistence implies that each new investment is a random
draw. Presumably, worse-performing partners are more likely to leave the sample. If this is true,
then under the null hypothesis of pure luck, the majority of active partners in the data would
be those that got lucky. Naively examining the data would thus result in a finding of positive
persistence. However, if we looked only at partners who did at least t investments, then these
8

partners’ past success would have no correlation with the outcome of their next investment.
To avoid labeling luck as persistence, the following regressions only consider cross sections within
the set of partners with t investments. That is, we ask whether partners with at least three (or five
or seven) investments and a greater fraction of IPOs in their first two (or four or six) investments
are more likely to IPO their third (or fifth or seventh) investment. Our results therefore concern
persistence conditional on having a level of partner experience in number of investments.12
Before reporting regression results we note that the probability that a partner’s second invest-
ment IPOs is unconditionally 12.5%. However, conditional on the first investment IPOing the
probability of the second IPOing is 35%, while conditional on the first investment not IPOing the
probability of the second IPOing is 8%. This same persistence is found formally in the regressions
below.
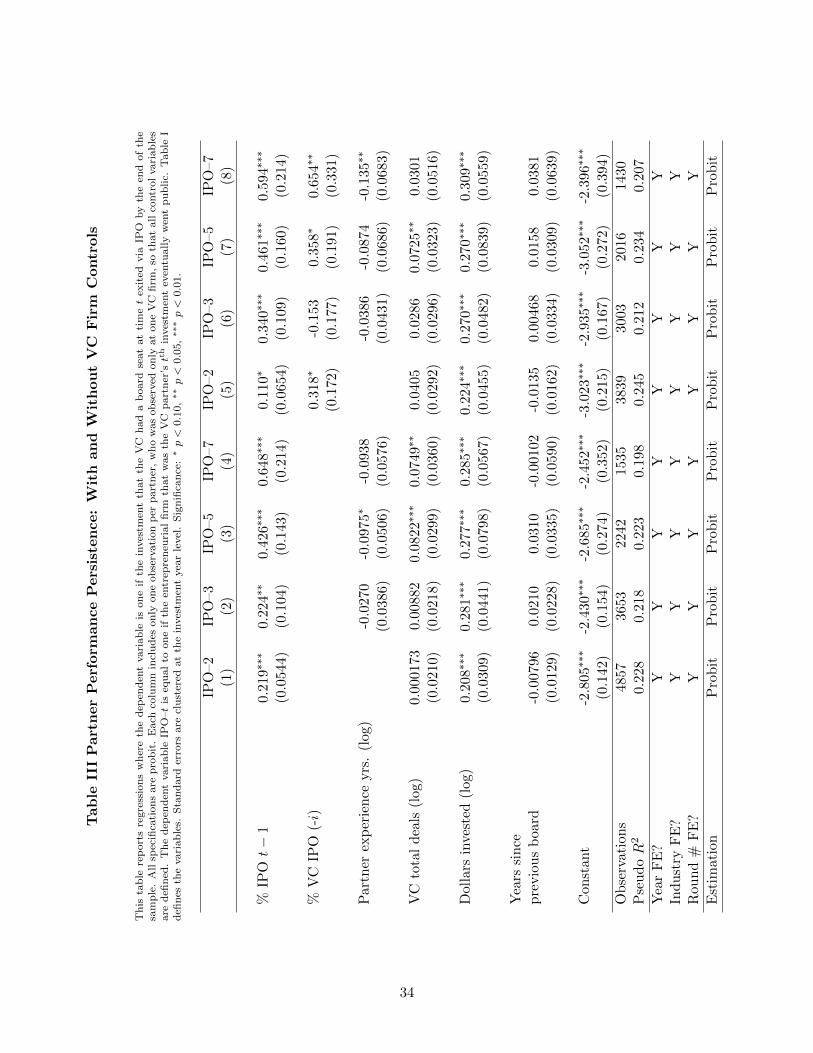
[Place Table III about here]
Table III reports the results of a probit regression on cross sections of partner experience for
the second, third, fifth, and seventh investment. Controls include the age of the VC firm, the time
the VC has been taking board seats, and entrepreneurial firm characteristics such as industry (“In-
formation Technology,” “Healthcare,” “Consumer/Retail,” and “Other”), investment year, dollars
invested, and development stage (round number fixed effects), with standard errors clustered at the
investment year.13 The estimates imply a strong relationship between a partner’s earlier investment
outcomes and current success.14 A one standard deviation increase in the the fraction of IPOs for
investments made prior to t implies a 18%, 15%, and 18% increase in the predicted IPO probability
for the third, fifth, and seventh investments respectively (where one standard deviation is 29%,
24%, and 21% respectively). The signs on the coefficients on the major control variables are as
expected, although the estimate for the log of partner experience in years merits discussion. Each
subsample conditions on experience, so this control gives the relative speed at which a partner gets
to t investments. The negative coefficient in some specifications implies that partners that take
longer to get to that tth investment are relatively less likely to have a subsequent IPO.
Note that the coefficient on persistence is from a comparison with other partners who made the
same number of investments. It would seem that skill might differentiate partners as they start
their career, but attrition could reduce the sample to only increasingly more skilled partners, which
9

would result in narrower, or possibly no, skill differences in the most experienced group. At the
same time, for partners with a greater number of investments we have more data about the partner,
and thus presumably more accurate estimates of partner quality. Overall, although each subsample
is possibly quite different, we find significant skill differences at each experience level.
Note that the analysis above uses the eventual outcome of earlier investments even if the exit
has not yet occurred by the t’th investment. Thus, we are not asking if the quality of the VC
was in the public information set but only whether VC partners who invest in eventual IPOs are
more likely to produce an IPO with their next investment. In the Internet Appendix, we repeat
the analysis in Table III using the public IPO rate, that is, the fraction of board seats with known
success as of the current board seat. The results are similar.15 Knowledge about initial success
at the time of the next investment does not measurably affect the quality of the next investment.
This result runs against the idea that persistence comes from initial luck that provides a “halo”
making it easier to access future good investments.
A. Alternative Outcome Measures
While IPO is an accepted measure of partner and VC firm success, there is a large range of
other outcome variables for entrepreneurial investments. Consider the three additional outcome
variables discussed above: successful acquisition, failure, and exit valuation. For each, we create an
analogue to % IPO t− 1 that summarizes a partner’s fraction of success or failure: % Acq. t− 1 is
the fraction of the partner’s investments made prior to t that had a successful acquisition, % Fail
t− 1 measures the same but uses investment failure, and Avg. Exit value t− 1 uses the average of
one plus the exit value of all investments made prior to t (logged).
Columns 1 and 3 of Table IV again show a strong correlation between the success (or failure)
of earlier investments and future outcomes. Recall that a one standard deviation increase in the
fraction of IPOs at the third investment implies a 18% increase in future success probability.
The predicted impacts for a one standard deviation increase in historical successful acquisitions
or failures at the third investment is 10% and 8%, respectively. For the fifth investment these
magnitudes are 15% (IPO), 10% (acquisition), and 6% (failure). The analogous predictions for a
one standard deviation increase in historical exit value at investments three and five are 13% and
14%.
10

[Place Table IV about here]
The results show that additional controls and measures of quality further our understanding
of partner performance persistence. Persistence in returns exists not simply at the portfolio level,
but also investment by investment at the partner level for IPOs, successful acquisition exits, and
failure, even controlling for partner, firm, industry, and time-varying characteristics in a way that
was not possible in other work. Overall, partners seem to have an exit “style.”16
B. Persistence and the VC Firm
Does the persistence above stem from the partner or the firm where the partner works? That
is, do VC partners simply match to high quality firms and inherit the firm’s deal flow and resources
(e.g., (Sorensen (2007))? To address this question, we include the past performance of the other
partners in the firm. Define %VC IPO (−i) as the fraction of board seats in the partner’s VC firm
that had an IPO excluding those investments made by the partner. If a partner is merely successful
because of the firm, then the inclusion of this control should eliminate or at least dramatically
reduce the coefficient on the partner’s past success. The last four columns of Table III introduce
this control. The inclusion of other-partner VC performance does not alter the explanatory power
of the partner’s past investment success. In fact, both measures are statistically meaningful in
nearly all specifications. This evidence suggests that both the partner and the firm play a role in
investment outcomes, but additional analysis is required to separate the two. If similarly skilled
partners join together then data on other partners’ performance may just provide more information
about the partner in question. Alternatively, a significant part of the performance of all the partners
stems from the firm. We next introduce a VC fund fixed effects to compare partners in the same
firm investing at the same time.
C. VC Fund Fixed Effects
VC firms are potentially long-lived and each firm raises a new fund to invest typically every few
years. Partners, as well as the size of funds, can change. To compare partners at the same firm
investing at the same time we would like to include fund fixed effects. Lacking a comprehensive
mapping of fund to board seat, however, we create VC fund fixed effects. For each VC firm in the
11

sample, we create “cohorts” of active VC partners by five-year windows. Starting from the first
investment made by the VC firm, each five years is associated with a new firm cohort.
[Place Table V about here]
Table V presents VC cohort fixed effects results for each of the exit outcomes from Table IV
using a conditional logit framework. This estimation compares partners investing at the same firm
in the same time period. The estimates show that the success of earlier investments as measured by
IPO or successful acquisition predicts higher probabilities of such events in the future for IPOs and
successful acquisitions. The results for failure persistence are weaker and statistically insignificant,
while the exit value results in columns 7 and 8 remain strong. The results demonstrate that the
partner matters and that assortative matching among partners is significantly less than perfect –
partners at the same firms have observably different abilities.
Taken together, our findings suggest that persistence does not arise simply because funds tend
to make the same type of investments at similar times. Rather, persistence seems to be due to real
partner skill.
III. Three-Way Fixed Effects Model
The results in Table III indicate that both the VC firm and the partner are important variables in
the cross section of outcomes. The results in Tables III or V that include historical firm performance
or VC fund fixed effects have two interpretations. First, VC firm characteristics explain part of the
partner performance persistence. Alternatively, partners with significant skill match together with
similar (but not perfectly similar) partners. Separating the effects of the firm and the partner on
investment outcomes requires moving away from a study of persistence to a general cross-sectional
analysis with fixed effects for both actors.
Consider the following linear model of exit valuation Vijkt:
Vijkt = β1Xit + β2Zjt + β3Ukt + αi + φj + γt + εijkt. (1)
In equation (1), i denotes the VC partner, j the VC firm, k the entrepreneurial firm, and t
the date of the investment; γt captures the investment year fixed effects. The variables Xit, Zjt,
12

and Ukt include time-varying controls for partner, VC firm, and entrepreneurial firm. The unit
of observation is partner i sitting on entrepreneurial firm k’s board of directors while the partner
works at VC firm j (which invests in firm k). The date t is defined by the first investment made
by VC firm j in firm k. Our focus is the retrieval of the partner and firm fixed effects αi and φj ,
which requires movements of partners between firms.
Bertrand and Schoar (2003) use movers within a sample of CEOs to identify whether individual
fixed effects can explain cross-sectional variation in corporate policy variables. We use the AKM
refinement of this methodology developed further in Abowd, Creecy, and Kramarz (2002). AKM
are part of a large literature in labor economics that attempts to isolate sources that are statistically
related to employment compensation. Graham, Li, and Qiu (2012) use this refinement to examine
the impact of the firm and the individual on executive compensation. The AKM method provides
estimates of firm and partner fixed effects for both movers and stayers. The inclusion of fixed
effects for all partners and firms results in a potentially large set of parameter estimates, typically
reduced by transforming the data using the within estimator. This transformation demeans by one
of the fixed effects dimensions. AKM show that this approach does not simultaneously address
heterogeneity and allow parameter recovery, but including firm fixed effects after first sweeping out
partner heterogeneity produces the standard result from a dummy variable regression. As in the
Bertrand and Schoar (2003) study, one also has to define the sample in which fixed effects can be
estimated, theirs being the mobility sample of CEOs. The analogous group in the AKM method is
the “connected” group.
As detailed by Abowd, Creecy, and Kramarz (2002), the “connectedness” sample comprises the
set of firms and partners that can be identified with the AKM method. Graph theory is used to
determine groups of individuals that are connected. Abowd, Creecy, and Kramarz (2002) further
detail the normalization procedure used to ensure that the fixed effects estimates are comparable
in the full sample.
The connectedness sample requires some that partners be employed by multiple firms. Any two
firms are connected if a partner moves from one to the other and any string of firms is connected
if they are connected to a firm that is connected to another firm. For example, if a partner from
firm A moved to firm B and another partner moved from firm B to firm C, then firms A, B, and
C are connected. If another partner moved from firm D to A, B, or C, then A, B, C, and D are
13

all connected. Abowd, Creecy, and Kramarz (2002) show that connections invite computationally
feasible estimation of the firm and person fixed effects for each connected group, relative to a
within-group benchmark. The benefit of this method is the ability to estimate the partner fixed
effects for both movers and nonmovers.17
It is useful to understand the basic features of how the AKM method separately identifies
partner and firm effects using the movers.18 Define Filt as a dummy variable equal to one if partner
i works at firm l at time t, and zero otherwise. We can rewrite equation (1) as
Vijkt = β1Xit + β2Zjt + β3Ukt + αi +
J∑l=1
Filtφl + γt + εijkt. (2)
The AKM method first sweeps out the partner fixed effects by averaging over partner i’s investments
to get
V i = β1Xi + β2Zi + β3U i +
J∑l=1
F ilφl + αi + γt + εi. (3)
Here, V i is partner i’s average exit valuation across the full sample period. Next, demean (2) with
(3) to get:
Vijkt − V i =β1(Xit −Xi) + β2(Zjt − Zi) + β3(Ukt − U i)
+J∑
l=1
(Filt − F il)φl + (γt − γt) + (εijkt − εi).(4)
Above, the partner fixed effects have been removed with demeaning. Moreover, the term (Filt −
F il)φl makes clear that the VC firm fixed effects are only identified using partners that move
(i.e., Filt 6= F il). Analogous to the description in Graham, Li, and Qiu (2012), the differences in
performance for partners changing VC firms allow us to estimate the firm fixed effects for firms in
which the mover was a partner.
Finally, we recover the partner fixed effects using the estimates from the standard least square
dummy variable regression in (4) and the following equation:
α̂i = V i − β̂1Xi − β̂2Zi − β̂3U i −J∑
l=1
F ilφ̂l. (5)
14

Equation (5) uses the beta estimates and firm fixed effects estimates from equation (4) and multi-
plies them by partner i′s average characteristics. Note that the last term ensures that the partner
fixed effects are reduced by the firm fixed effects estimates of all VC firms in which the partner
worked multiplied by the fraction of his time he spent at each VC firm.
Several properties of the AKM estimator are worth highlighting. An important source of vari-
ation is the mobility of partners, which if limited can bias the estimates of the fixed effects. While
this issue exists in all studies that use mobility, it is not severe in our sample with 30% movers.
Next, an important benefit of including both movers and stayers in the connectedness sample is
the increased precision of a larger sample. Including only movers as in Bertrand and Schoar (2003)
would shrink the number of partners nearly 70%. Next, the fixed effects estimates themselves have
properties similar to other estimators. As shown by Wooldridge (2010), the estimates of the time-
varying variable coefficients are unbiased and consistent, while the fixed effects estimates are only
unbiased. Last, the connectedness sample requires dropping one partner by normalizing the group
mean to zero for each of the connected groups, and comparison of fixed effects across these groups
requires a normalization as discussed in Abowd, Creecy, and Kramarz (2002). None of the results
discussed below change when we focus on the one main connected group or simply avoid using the
latter normalization procedure.
A. Fixed Effects Results
Estimation of equation (1) starts with the data on the board seat and its investment outcome
for VC partners with at least four investments. This restriction ensures an ample set of outcomes
for estimating both partner and firm fixed effects. Next, the connectedness grouping eliminates
all partners and firms that lack a mover (to or from) during the sample period. Based on this
procedure, the sample in the AKM estimates for exit valuation has 2,114 partners, 623 VC firms,
and 603 movers. This collection of VC firms accounts for 70% of all financing events, 74% of all
entrepreneurial firms, and 84% of all dollars invested.
Estimation of the full fixed effects model includes time-varying controls for VC firm experience,
entrepreneurial firm stage, dollars invested, and VC partner experience. Additionally, the model
has year fixed effects, but initially excludes industry fixed effects because most partners and firms
rarely switch industries.19 Importantly, all regressions include a control for the round number of
15

the investment, which addresses concerns about risk differences at different stages. We use the
four major outcome variables from above, but focus on the estimates from the log exit valuation
regressions.20 The 60% correlation between valuation and the IPO dummy shows that the exit
valuation variable contains much of the information in the standard outcome measure.
[Place Table VI about here]
Table VI presents the results of estimating equation (1) using the AKM method. We focus on
the estimates’ relative contribution to the model R2 and on the p-values from a test that the set
of fixed effects are jointly zero (or the same).21 The ratio cov(Y, partnerFE)var(Y ) reports the covariance
of the dependent variable with the partner and firm fixed effects, each scaled by the dependent
variable’s variance. Rather than focus on the level of R2, these measures present the fraction of the
total R2 attributable to each type of fixed effects. For exit valuation, some 46% of the total R2 is
attributable to the partner fixed effects (the omitted category is all other control variables), while
8% of the total R2 is attributable to the firm fixed effects.22 Thus, the partner has almost five times
more explanatory power than the firm. These stark differences in explanatory power are reflected
in the hypothesis tests on the fixed effects. The F -test that all partner fixed effects are the same
is rejected in all but the successful acquisitions specifications. The p-value for the analogous test
on VC firm fixed effects consistently fails to reject the null. The estimates imply that the average
partner has explanatory power in the outcome regressions.
Not only do the estimated fixed effects point to the relative importance of the firm and the
partner, but they also provide insights into partner heterogeneity. In Figure 1, the plot of the
demeaned partner fixed effects from the largest connected group provides economic magnitudes
for the estimates.23 The reported fixed effects are in units of log exit valuation and demeaned.
The largest connected group – 86% of the full AKM sample – exhibits significant variation in the
fixed effects estimates. Adding the group mean and taking the exponential of the fixed effects, the
implied exit value advantage of the top-quartile versus bottom-quartile partner fixed effects is at
least $82m. To put this in perspective, 55% of exits result in no return and the mean exit value is
$151m.
[Place Figure 1 about here]
16

IV. Subsamples
Additional estimation of the full fixed effects model allows us to better understand the role of
the firm versus person, as well as address some possible empirical concerns. Table VII presents five
separate regressions for log exit valuation. Column 1 considers the set of VC firms that are in the
top 10% of experience as measured by total board seats (the 81 most active firms). The movers
and stayers of these firms are then included if they satisfy the connectedness criterion. Focusing on
this sample helps us examine whether there are VC firms that have built up organizational capital
over time. The results from the F -test are much more favorable towards the firm. This suggests
that in the sample of top VC firms, the partner and the VC firm are both important in explaining
the cross section of outcomes, with the partner explaining over three times as much as the firm.
Column 2 considers the first six investments of all VC partners from the full sample. Here, we
examine whether the firm is relatively more important for partners with less experience. For exam-
ple, in an academic setting, younger faculty members may be more impacted by their university.
We find some support for this idea in that the partner again explains roughly three times more exit
value variation than the firm.
The main model (1) excludes industry fixed effects as they are only identified for partners that
invest in multiple industries.24 We include industry fixed effects in column 3 of Table VII and find
very similar results. However, a large fraction of partners invest in only one industry (primarily
biotech), and thus, in column 4 we consider only partners who make biotech investments. We
again find very similar results. These tests suggest that the relative firm and partner effects stem
from within-industry variation. We also reestimate column 3 including industry fixed effects with
firms categorized into 17 or alternatively 115 different industries (results reported in the Internet
Appendix). The partner continues to explain more than three times more than the firm. We also
directly compare partners versus industries dropping firm fixed effects and directly employing the
AKM methodology on partners and industries. Now partners who invest in only one industry
are the stayers and partners who invest across industries are the movers that provide the needed
variation. The variance decomposition reported in the Internet Appendix shows that the partner
explains six times more than the industry when using the four, 17, or 115 industry categorizations.
Thus, partner performance persistence does not seem to arise from industry effects. Partners
17

still demonstrate performance persistence when they change industries (even with coarsely defined
industry classifications). This is a remarkable finding as it suggests that investing skill comes from
something other than industry knowledge.
[Place Table VII about here]
The last column of Table VII attempts to address concerns about the relative sample size of
partners to firms. The main specification has approximately 2,100 partners to 623 firms, possibly
giving less power to identify firm fixed effects. Here, we use a random sampling procedure to
generate 1,000 different samples where the total number of partners equals the total number of
firms. Fixing the set of movers to 300, we construct the connectedness sample and then select
stayers to equal the total number of firms and partners. The estimation is run on each sample. The
table reports median F -test p-values and means of the R2 contributions. The R2 contributions still
favor the partner, by two-to-one, while the F -test continues to fail to reject the null that all firm
fixed effects are the same or zero.
V. Robustness
The results above are robust to a wide array of specifications. In our main analysis, a large
set of investments lack an outcome. We treat these firms as non-IPOs, zero exit values, or failed
acquisitions depending on the specification. This treatment is reasonable because we only consider
entrepreneurial firms founded prior to 2006, so many of the better firms will have exited. Nonethe-
less, it is possible that this assumption is driving some of the results. To address this concern, we
repeat each estimation without investments that lack an exit event as of the end of the sample.
The results – persistence, F -tests, and R2 contributions – are similar for exit value, successful
acquisitions, and IPO/acquisitions. The results for IPOs are weaker for the partner fixed effects in
the AKM model, which is likely driven by the near absence of IPOs post-2001. We conclude that
our main results are not driven by our assumptions on outcomes for non-exited investments.
Next, a potential concern with the AKM method is its use of movers. Partner movement
provides the variation necessary to estimate VC firm fixed effects and in turn the fixed effects of
nonmovers. However, movers’ decisions are potentially endogenous to their own performance or
18

that of their past firm. To address this concern, we first examine the similarities between movers
and stayers and their firms, and run some robustness checks. We then consider the potential
implications for interpretation of our results.
Panel A of Table VIII summarizes characteristics of the firms that are the source of the movers
and their destinations. Not surprisingly, we find that firms movers leave are larger and older. These
firms also invest in earlier-stage companies than firms without movers, but in similar industries.
[Place Table VIII about here]
In addition, performance is higher at the firms people leave and lower at the firms they go to.
This result suggests that the average mover is being fired from good firms or otherwise selecting
relatively worse firms to join. However, in the Internet Appendix we find that exclusion of year
fixed effects in the AKM specification increases the size and importance of VC fixed effects. This
difference implies that much of the partner movement is correlated with changes in investment
performance over time, that is, partners seem to leave around (before and after) a peak in VC
performance. Thus, the perceived difference is due to market timing and the inclusion of year fixed
effects is important.
Panel B of Table VIII compares the characteristics of movers and stayers, reporting the means
and resulting two-sample t-tests for a set of observables. Movers and stayers are similar across
most dimensions, excluding investment stage (round number) and total number of investments.
Similarly, the analysis of title changes discussed in Section I (and in the Internet Appendix) shows
that the majority of movers take positions at their second firm with a higher or similar title.
Finally, Panel C of Table VIII presents a similar comparison at the firm level. The AKM firm
sample comprises 55% (623) of VC firms with at least two partners who sat on at least four board
seats. The excluded firms are those that never had a mover move to or from the firm. Such firms are
likely very young or those that failed after their first fund. The exit value and IPO rate differences
show that the included firms are larger and generally more successful.
The AKM method is also robust to the time-varying performance measures used in Tables III
and IV, which Graham, Li, and Qiu (2012) note help control for any assortative matching between
firms and movers. A better match may result in improved firm performance, which could bias the
firm fixed effects estimates. Inclusion of both lagged partner performance and firm performance
19

from Table IV has no measurable impact on the conclusion that the partner fixed effects are nonzero
and explain a large fraction of the R2. However, inclusion of these variables does reduce the p-value
on the F -test that the firm fixed effects are all zero.
While the AKM results control for year fixed effects, one might argue that much of the large
exit values generated in the asset class were driven by those in the late 1990s. If we exclude all
financings over the 1997 to 1999 period, the results in Table VI are quantitatively similar. The
p-value on the F -test for VC firm fixed effects is smaller (9%), but, the partner fixed effects are
still jointly significant and explain much of the variation in exit valuation.
The estimation of Table VI produces fixed effects estimates relative to a benchmark within each
group in the connected sample, and thus, we cannot compare estimated fixed effects between these
groups without the normalization procedure of Cornelissen (2008). We address this concern by
reestimating the full model with the largest connected group (86% of the full sample). The results
in Table VI are basically unchanged.
Turning now to potential implications for interpretation of our results, Panel B of Table VIII
shows that movers and stayers are similar across many dimensions, while Panel C of Table VIII
demonstrates that firms in the AKM sample are larger, more active VC firms. If firms and partners
in the AKM sample are also unobservably different, this could limit our inference. Below, we discuss
the impact of selection or omitted variables for VC firm and partner fixed effects estimates.
Recall that identification of the VC firm fixed effects comes from changes in mover performance
around the move as shown in equation (4). Suppose that movers are simply partners fired by their
past firms. If such partners move to worse firms post-firing and this affects their performance,
then the estimation will find large firm fixed effects. Now suppose that movers are on average high
quality partners seeking better prospects at relatively better firms. Again, if these partners move to
better firms and this affects their performance, the estimation will attribute the performance change
to larger average firm fixed effects. These two scenarios seem the most economically plausible and
suggest that nonrandom movement does not necessarily lead to any bias in the estimated firm fixed
effects.
However, it is likely that movers who choose to move (i.e., those not asked to leave) do so in
anticipation of improvements to performance. If partners most likely to be helped by a move are
those that make a costly move, then the firm fixed effects may be overestimated relative to the
20

true effects of the average partner. Alternatively, movers could be those partners who are relatively
unaffected by their location. In this case, the firm effects estimates may be biased downwards. We
cannot rule out either concern so one must be cautious in interpreting our results. However, we
can examine different subsamples to gauge the generalizability of the main result.
[Place Table IX about here]
In Table IX columns 1 and 2 we divide partners into two groups, namely, those that moved to
a firm with a historically worse IPO rate than their current firm and those that moved to a firm
with a relatively better historical IPO rate (where the historical rate is calculated as of the date of
the move). These two groups are likely moving for different reasons. On average, those that move
to a worse firm are presumably those that are asked to leave, while those that move to a better
firm may be those choosing to seek a better opportunity. In column 1 we see that the partner is
about six times as important as the firm in the group that moved to a worse firm. In column 2 we
see that the partner is only 2.5 times as important as the firm. If the group of partners that moved
to higher-performing firms chose to do so, then it is likely that they anticipated positive benefits
to their own performance. This sample, therefore, may have too large an estimate of the true firm
effects on the average partner. Alternatively, the firm effects may simply be larger among higher
quality firms. The relatively lower explanatory power of the partner in this sample suggests that
endogeneity affects our results but does not substantially bias our overall conclusions.
Perhaps firms in the connected sample are connected because partners only move between very
similar firms. Note that 86% of the sample is in our largest connected group. This argument would
thus mean that the majority of firms have a relatively similar impact on the partner – which is
what our findings suggest. Further, the average absolute difference in performance for all moves
between existing firms is 18.5% (standard deviation 14%). This means that on average partners
are moving to firms with very different IPO rates given that the average IPO rate is 12.8%. To
address concerns about the characteristics of firms involved in moves, Table IX columns 3 and 4
divide partners into two groups. Column 4 uses only movers that moved to firms with very similar
historical IPO rates (below-median absolute difference), while column 3 considers those movers
that moved to a firm with a historical IPO rate very different from their own firm’s historical rate
(better or worse). We find very similar results among partners that move to different firms but
21
the estimate of firm effects is even smaller among partners that move to more similar firms (as
expected). Thus, some of the finding that the firm is relatively unimportant comes from partners
moving between similar firms.25
Movers may also exit their firms for reasons related to the characteristics of their partners. The
specification in equation (1) ignores externalities between VC partners. For example, all partners
may benefit from working with top partners (i.e., both improve) and movers will want to exploit
this by working with them. Any positive externalities would increase the partner’s performance
post-move, which the estimator would attribute to VC firm fixed effects because performance would
differ between positions at VC firms. In the Internet Appendix, we analyze the similarity of the fixed
effects among partners at the same firm and find significant matching in partner quality. However,
as Table VI makes clear, most specifications find limited VC firm fixed effects. Thus, while the
estimation cannot separate partner externalities from pure firm effects, our findings suggest that on
average both externalities and other firm characteristics are less important than individual partner
characteristics.
Similar arguments suggest that mean-reversion in VC partner performance may bias the es-
timated VC firm fixed effects. If partners who are lucky leave to go to a better firm, they will
subsequently mean-revert. Similarly, if partners who are unlucky get fired and go to a new firm,
they will also mean-revert. The estimation attributes any change in performance across a move to
firm fixed effects. Thus, one would expect that all else equal the performance change due to mean-
reversion would be assigned to the firm. If so, this would lead to an overestimate of the importance
of the VC firm. This plausible scenario does not alter our conclusions as we find statistically small
average VC firm fixed effects. Mean-reversion, however, could combine with other effects to dampen
the estimated firm effects. If, for example, partners get lucky and move to a better firm and are
helped by the new firm but simultaneously mean-revert, then the mean-reversions will bias down
effects of the firm.
Our findings suggest that on average firms have relatively limited impact on partner perfor-
mance, but this is a relative statement. That is, all firms could be quite important but have a
similar impact, in which case the fixed effects estimation would find a small relative importance
and an insignificant joint p-value. This conclusion would only relate to connected firms as firms in
different connect samples cannot be compared. However, the largest connected sample in the AKM
22

specification comprises 86% of our sample. Thus, economically, what we find is that on average
VC firms seem to be relatively similar to each other. This implies that the location of an average
partner is not particularly relevant to investing outcomes.
In general, endogeneity issues could artificially attribute too large or too small an effect to the
VC firm. Since our main finding is that the average firm has relatively little impact on performance,
endogeneity concerns that result in too large an effect would only reinforce this finding. Thus, we
are only concerned that the endogeneity in movement has biased our results to produce firm effects
that are too low. Although we find a similar effect in many subsamples, if the 30% of partners who
move are those whose performance is unaffected by their location, then we have underestimated
the effect of a move on those partners who stay.
VI. Conclusion
In this paper, we find that the VC partner can explain a large fraction of the cross-sectional
variation in investment outcomes. Further, the partner’s performance is persistent over time, even
after controlling for a large set of individual and VC firm controls. VC partners also appear to have
a style of exit. Overall, our work provides strong support for the idea the venture partners have
investing skill, as well as new insights into the allocation of performance to the firm or partner.
The new evidence that VC firm attributes are relatively less important than partner attributes
shed light on another unexplained aspect of VC. The optimal VC firm size seems to be a few
hundred million in assets under management. Few VC firms are larger and many top firms cap the
amount of money they will accept below total demand. Typical explanations suggest that partner
time is the limiting resource but this does not explain why firms do not simply increase the number
of partners. Why are there not a few huge VC firms with hundreds of partners instead of many
firms with a few partners? Other human capital intensive organizations such as investment banks
or law firms become quite large. Furthermore, why don’t we see mergers or acquisitions between
VC firms? Zingales and Rajan (1998) argue that without a critical firm asset there is nothing to
hold a firm together or make it larger other than what is just needed to overcome Coasian frictions.
Our findings are consistent with the idea that the organizational capital inside a VC firm is limited,
which limits firm size. Given this result, it appears that brand, process, deal flow, etc. are not
23

critical firm-level characteristics, but rather are partner attributes.
Our work may also benefit limited partners (LPs) who are concerned about investing in a new
fund of a venture partner or group of venture partners who have left a VC firm to start another
VC firm.26 Many LPs express reservations because the venture partners may have left the “secret
sauce” behind. This decision requires LPs to disentangle individual partner impacts on performance
from the possibility that the performance was due to the firm organizational capital the partners
left behind. Our results suggest that venture partners are relatively unaffected by movement and
that individual venture partner past performance is a good predictor of future performance.
Overall, the results suggest that VC partners are often significantly different from each other,
but high quality firms are those with a group of better partners. What then is a VC firm? We
suspect that the benefits of joining together may relate to fundraising. This would be an interesting
avenue for future research.
24

REFERENCES
Abowd, John M., Robert H. Creecy, and Francis Kramarz, 2002, Computing person and firm
effects using linked longitudinal employer-employee data, Technical Report 2002-06, U.S. Census
Bureau.
Abowd, John M., Francis Kramarz, and David N. Margolis, 1999, High wage workers and high
wage firms, Econometrica 67, 251–333.
Acharya, Viral V, Oliver F Gottschalg, Moritz Hahn, and Conor Kehoe, 2013, Corporate governance
and value creation: Evidence from private equity, Review of Financial Studies 26, 368–402.
Becker, Gary S., 1981, Treatise on the Family (Harvard University Press, Cambridge).
Bertrand, Marianne, and Antoinette Schoar, 2003, Managing with style: The effect of managers on
firm policies, Quarterly Journal of Economics 118, 1169–1208.
Bottazzi, Laura, Marco Da Rin, and Thomas Hellmann, 2008, Who are the active investors?:
Evidence from venture capital, Journal of Financial Economics 89, 488–512.
Burdett, Kenneth, and Melvyn G. Coles, 1997, Marriage and class, Quarterly Journal of Economics
112, 141–168.
Chemmanur, Thomas J., Mine Ertugrul, and Karthik Krishnan, 2014, Is it the investment bank or
the investment banker: A study of the role of investment banker human capital in acquisitions,
Working paper, Boston College.
Coase, Ronald H., 1988, The nature of the firm: Origin, meaning, influence, Journal of Law,
Economics, and Organization 4, 3–17.
Cornelissen, Thomas, 2008, The Stata command felsdvreg to fit a linear model with two high-
dimensional fixed effects, Stata Journal 8, 170–189.
Gompers, Paul, Anna Kovner, and Josh Lerner, 2009, Specialization and success: Evidence from
venture capital, Journal of Economics & Management Strategy 18, 817–844.
25

Gompers, Paul, Anna Kovner, Josh Lerner, and David Scharfstein, 2010, Performance persistence
in entrepreneurship, Journal of Financial Economics 96, 18–32.
Graham, John R., Si Li, and Jiaping Qiu, 2012, Managerial attributes and executive compensation,
Review of Financial Studies 25, 144–186.
Harris, Robert S., Tim Jenkinson, Steven N. Kaplan, and Ruediger Stucke, 2014, Has persistence
persisted in private equity? Evidence from buyout and venture capital funds, Working Paper,
NBER.
Hart, Oliver, 1989, An economist’s perspective on the theory of the firm, Columbia Law Review
89, 1757–1774.
Hellmann, Thomas, and Manju Puri, 2002, Venture capital and the professionalization of start-up
firms: Empirical evidence, Journal of Finance 57, 169–197.
Hochberg, Yael V., Alexander Ljungqvist, and Yang Lu, 2007, Whom you know matters: Venture
capital networks and investment performance, Journal of Finance 62, 251–301.
Hochberg, Yael V., Alexander Ljungqvist, and Annette Vissing-Jørgensen, 2014, Informational
holdup and performance persistence in venture capital, Review of Financial Studies 27, 102–152.
Kaplan, Steven N, and Antoinette Schoar, 2005, Private equity performance: Returns, persistence,
and capital flows, The Journal of Finance 60, 1791–1823.
Klein, Benjamin, 1988, Vertical integration as organizational ownership: The Fisher Body-General
Motors relationship revisited, Journal of Law, Economics and Organization 4, 199–213.
Kremer, Michael, 1993, The O-ring theory of economic development, Quarterly Journal of Eco-
nomics 103, 551–575.
Lerner, Josh, Antoinette Schoar, and Wan Wongsunwai, 2007, Smart institutions, foolish choices:
The limited partner performance puzzle, Journal of Finance 62, 731–764.
Phalippou, Ludovic, 2010, Venture capital funds: Flow-performance relationship and performance
persistence, Journal of Banking & Finance 34, 568–577.
26

Sahlman, William, 2010, Risk and reward in venture capital, Harvard Business School Note 811-
036, 1–37.
Shimer, Robert, and Lones Smith, 2000, Assortative matching and search, Econometrica 68, 343–
369.
Smith, Richard, Roberto Pedace, and Vijay Sathe, 2010, Venture capital fund performance: The
effects of exits, abandonment, persistence, experience, and reputation, Working paper, University
of California, Riverside.
Sorensen, Morton, 2007, How smart is smart money? An empirical two-sided matching model of
venture capital, Journal of Finance 62, 2725–2762.
Williamson, Oliver E., and Sidney G. Winter, eds., 1993, The Nature of the Firm, Origins, Evolu-
tions, and Development (Oxford University Press, London).
Wooldridge, Jeffrey M., 2010, Econometric Analysis of Cross Section and Panel Data (The MIT
Press).
Zarutskie, Rebecca, 2010, The role of top management team human capital in venture capital
markets: Evidence from first-time funds, Journal of Business Venturing 25, 155–172.
Zingales, Luigi, and Ragu Rajan, 1998, Power in a theory of the firm, Quarterly Journal of Eco-
nomics 113, 387–432.
27

Notes
1Of the investments included in the VentureSource databases, 12.8%eventually complete an IPO.
2In a complementary paper, Gompers, Kovner, Lerner, and Scharfstein (2010) examine whether
the entrepreneurs receiving VC demonstrate performance persistence. They find an explanation for
the source of persistence, while we attempt to separate the importance of the firm and the person
in outcomes.
3Venture partners determine which deals they want to do and then seek approval from their
other partners. Partners are not assigned deals, nor do they have to give deals they like to other
partners. Deals are typically passed between partners if the partner who finds a particular deal does
not feel he has the time or expertise to investigate or manage the deal. Thus, this style persistence
seems to be a quality of the VC partner.
4Chemmanur, Ertugrul, and Krishnan (2014) use the AKM method to examine whether invest-
ment bankers matter for merger and acquisition outcomes.
5We thank Correlation Ventures for allowing us to use the extensive data they have collected on
historical investments, partners, and outcomes. Correlation Ventures is a VC fund that uses quan-
titative methods for investment selection. As such, they are attempting to build a comprehensive
set of historical venture deals and outcomes.
6An additional 1,200 exit valuations (a 20% increase) results from this search.
7We define anyone who invests in venture financing and sits on the board as a “VC” although
some VC investors may work for a firm that also does later-stage investing in more established
firms (often referred to as a PE firm), and some may be individual, or so-called “angel,” investors.
8The full analysis of title changes can be found in the Internet Appendix, available in the online
version of the article on the Journal of Finance website.
9All outcomes are measured as of the end of 2012.
10 Note that this variable is zero for IPOs. The results are insensitive to defining “successful” as
1.5− 3X of total capital raised.
11Firms that have not exited are often thought to be the living dead and firms that don’t re-
port exit values tend to have smaller exits. The cutoff of founding dates pre-2006 implies the
entrepreneurial firms have six years to exit. This suggests we should treat them as zeros.
28

12As we condition on partners with increasingly more investments, the sample becomes less
representative. The persistence estimates we find are conditional on making t investments. They
are not the average amount of skill but rather the relative skill among partners with t investments.
The Internet Appendix provides the results from a regression that pools all the experience levels.
13We also use a 17 industry classification as well as a 115 industry classification with similar
results.
144Phalippou (2010) argues that fund-level persistence is nonexistent or mainly driven by the left
tail. Our results support the original Kaplan and Schoar (2005) persistence result as partner-level
persistence should lead to fund persistence unless fees are adjusted to match skill (something rarely
done in VC firms).
15Also in the Internet Appendix, we introduce a longer history to the persistence regressions, such
as the partner’s IPO rate as of two investments previous (IPOt−2). Longer lags remain statistically
significant, while the size falls as we go further back in the partner’s investment history.
16This result echos findings in a working paper by Smith, Pedace, and Sathe (2010) who report
that funds that have a high percentage of IPOs or merger and acquisition exits tend to have a
higher percentage in their next fund.
17The analysis of managerial compensation in Graham, Li, and Qiu (2012) has more detail on
the methodology, its strengths, and its limitations.
18This discussion follows Graham, Li, and Qiu (2012).
19Industry fixed effects can only be identified from partners who invest in different industries
over time (much like firm fixed effects). Table VII includes industry fixed effects and finds similar
results. Sections IV discusses possible biases due to industry effects.
20For the outcome variables IPO, Successful acquisition, and Failure, we use the linear probability
model. The major cost of the linear probability model is bounded fixed effects estimates. Let Xiβ̂ be
the predicted values from a general model with this form. Here, the estimates of the one-way fixed
effects are bounded −Xiβ ≤ αi ≤ 1− xiβ. Nonlinear models that do not suffer from the incidental
parameters problem, such as the conditional logit, do not invite a rich analysis separating person
and firm fixed effects. This restriction forces us to focus our discussion of the AKM results to
the continuous variable outcome Exit valuation, while still reporting those of the linear probability
specification for illustration.
29

21The reported F -test results only consider the largest connected group.
22We also repeated the analysis using the more memory-intensive method of including dummy
variables for partner, firm, and year. The results, as expected, are the same.
23Any report of the estimated fixed effects from AKM must condition on such a grouping because
the estimates are relative to a within-group reference fixed effect.
24The main industries include “Information Technology,” “Healthcare,” “Consumer/Retail,” and
“Other.” A finer level of industries introduces 17 categories, each a subset of these four.
25Even though the partners are moving to firms that are observably very different, it is possible
that partners move to firms that are operationally quite similar, in which case the limited effect of
the firm could stem from this similarity.
26See Gompers, Kovner, Lerner, and Scharfstein (2010) for work on LP decisions and their ability
to select funds.
30

Figure 1. Distribution of Partner Fixed Effects This figure displays the distribution ofestimated fixed effects from the AKM regression using the log valuation for IPO or successfulacquisition as the dependent variable (zero if no exit, failure, or unreported). The estimates arenormalized so the mean value of the partner fixed effects is zero. The sample of estimated fixedeffects only includes those in the largest connected sample (i.e., sets of firms connected by movers),which comprise 86% of VC partners in the full specification. This restriction ensures that the fixedeffects estimates are comparable.
31

Table I Variable Definitions
Notes: Tables describes the main variables used throughout the paper.
Variable Description
IPO A dummy variable for an IPO exit.% IPO t− 1 Fraction of IPOs in the partner’s history as of that investment.% Acq. t− 1 Fraction of the partner’s investments prior to t that has a successful
acquisition.% Fail rate t− 1 Fraction of the partner’s investments prior to t that has a successful
acquisition.Avg. Exit value t− 1 The log of one plus average exit values for investments done prior to the
partner’s current investment.Successful Acq. A dummy for an acquisition exit that has a reported exit value greater
than two times capital invested.Fail A dummy variable for entrepreneurial firm failure.Log exit value The log of one plus the exit value (in millions) for a given investment.% VC IPO (-i) The fraction of IPOs for all partners not including the one of interest at
the VC firm as of a board seat at time t.Years experience A partner’s number of years experience as of the board seat.# VC firm investments The total number of board seat investments made by the partners VC
firm.Round # The round number of the board seat investment (all truncated to a
maximum of seven).Dollars invested (log) The total investment (in millions) in the financing event.Years since previous board The number of years between the current and last board seat for a VC
partner.CA A dummy variable equal to one if the entrepreurial firm is based in
California.MA A dummy variable equal to one if the entrepreurial firm is based in
Massachusetts.IT The fraction of a VC partner’s investments in information technology.Biotech The fraction a VC partner’s investments in biotech investments.Partner experience yrs. (log) The log of the years since the partner took the first board seat as of t.VC total deals (log) The log of the total board seats taken by the VC firm of the partner as
of t.Year FE Fixed effects for the year of the investment at the date of the dependent
variable t.Industry FE Fixed effects for the entrepreneurial firm industry:“Information Tech-
nology,” “Healthcare,” “Consumer/Retail” and “Other.”“VC experience yrs. (log)” The log of the total board seats made by the VC firm as of the current
investment.“Fund sequence (log)” The log of the fund sequence, set to the five-year windows since VC firm
founding.
32

Table II Summary Statistics
This table reports characteristics of the sample of partners in most analyses below. The unit of observation isthe VC partner matched to an entrepreneurial investment through a board seat. Column “Two” summarizes thepartners at their second investment, “Three” at their third investment and so on. “Other” pools all the excludedinvestment numbers and “Total” is the full sample. See Table I for variable definitions.
Investment Experience
Two Three Five Seven Other Total
IPO 0.129 0.126 0.139 0.126 0.126 0.128(0.335) (0.332) (0.346) (0.332) (0.332) (0.334)
% IPO t− 1 0.166 0.178 0.184 0.199 0.221 0.202(0.372) (0.294) (0.238) (0.217) (0.210) (0.259)
Successful acq. 0.100 0.0942 0.103 0.104 0.0987 0.0991(0.300) (0.292) (0.304) (0.305) (0.298) (0.299)
% Fail t− 1 0.379 0.368 0.353 0.346 0.327 0.345(0.484) (0.359) (0.270) (0.227) (0.217) (0.303)
Log exit value 1.613 1.594 1.720 1.701 1.719 1.684(2.282) (2.261) (2.344) (2.363) (2.412) (2.363)
% VC IPO (-i) 0.212 0.216 0.228 0.226 0.226 0.223(0.236) (0.227) (0.211) (0.190) (0.177) (0.199)
Years experience 1.689 2.811 4.345 5.650 7.483 5.506(1.910) (2.481) (2.911) (3.261) (4.722) (4.555)
# VC firm investments 76.37 85.22 106.7 125.5 174.8 137.4(124.5) (126.7) (146.5) (147.6) (188.7) (171.4)
Round # 2.004 2.051 2.075 1.997 1.991 2.009(1.391) (1.451) (1.502) (1.433) (1.412) (1.423)
Dollars invested 12.43 12.05 11.75 11.09 12.53 12.29(23.39) (20.52) (18.63) (15.71) (20.84) (20.78)
Years sinceprevious board 1.671 1.178 0.905 0.757 0.740 0.968
(1.890) (1.357) (1.038) (0.852) (0.877) (1.233)
CA 0.367 0.401 0.418 0.446 0.486 0.446(0.482) (0.490) (0.493) (0.497) (0.500) (0.497)
MA 0.125 0.118 0.119 0.129 0.128 0.125(0.331) (0.322) (0.324) (0.335) (0.334) (0.331)
IT 0.534 0.547 0.545 0.565 0.571 0.559(0.499) (0.498) (0.498) (0.496) (0.495) (0.497)
Biotech 0.245 0.247 0.250 0.249 0.240 0.243(0.430) (0.431) (0.433) (0.432) (0.427) (0.429)
Observations 4,860 3,636 2,083 1,536 13,551 25,666
33
Tab
leII
IP
art
ner
Perf
orm
an
ce
Pers
iste
nce:
Wit
han
dW
ith
ou
tV
CF
irm
Contr
ols
Th
ista
ble
rep
ort
sre
gre
ssio
ns
wh
ere
the
dep
end
ent
vari
ab
leis
on
eif
the
inves
tmen
tth
at
the
VC
had
ab
oard
seat
at
tim
et
exit
edvia
IPO
by
the
end
of
the
sam
ple
.A
llsp
ecifi
cati
on
sare
pro
bit
.E
ach
colu
mn
incl
ud
eson
lyon
eob
serv
ati
on
per
part
ner
,w
ho
was
ob
serv
edon
lyat
on
eV
Cfi
rm,
soth
at
all
contr
ol
vari
ab
les
are
defi
ned
.T
he
dep
end
ent
vari
ab
leIP
O–t
iseq
ual
toon
eif
the
entr
epre
neu
rial
firm
that
was
the
VC
part
ner
’stth
inves
tmen
tev
entu
ally
wen
tp
ub
lic.
Tab
leI
defi
nes
the
vari
ab
les.
Sta
nd
ard
erro
rsare
clu
ster
edat
the
inves
tmen
tyea
rle
vel
.S
ign
ifica
nce
:∗p<
0.1
0,∗∗
p<
0.0
5,∗∗
∗p<
0.0
1.
IPO
–2IP
O–3
IPO
–5IP
O–7
IPO
–2IP
O–3
IPO
–5IP
O–7
(1)
(2)
(3)
(4)
(5)
(6)
(7)
(8)
%IP
Ot−
10.
219∗∗∗
0.22
4∗∗
0.42
6∗∗∗
0.64
8∗∗∗
0.11
0∗
0.34
0∗∗∗
0.46
1∗∗∗
0.59
4∗∗∗
(0.0
544)
(0.1
04)
(0.1
43)
(0.2
14)
(0.0
654)
(0.1
09)
(0.1
60)
(0.2
14)
%V
CIP
O(-i)
0.31
8∗
-0.1
530.
358∗
0.65
4∗∗
(0.1
72)
(0.1
77)
(0.1
91)
(0.3
31)
Part
ner
exp
erie
nce
yrs
.(l
og)
-0.0
270
-0.0
975∗
-0.0
938
-0.0
386
-0.0
874
-0.1
35∗∗
(0.0
386)
(0.0
506)
(0.0
576)
(0.0
431)
(0.0
686)
(0.0
683)
VC
tota
ld
eals
(log)
0.0
0017
30.
0088
20.
0822∗∗∗
0.07
49∗∗
0.04
050.
0286
0.07
25∗∗
0.03
01(0
.021
0)(0
.021
8)(0
.029
9)(0
.036
0)(0
.029
2)(0
.029
6)(0
.032
3)(0
.051
6)
Doll
ars
inves
ted
(log
)0.2
08∗∗∗
0.28
1∗∗∗
0.27
7∗∗∗
0.28
5∗∗∗
0.22
4∗∗∗
0.27
0∗∗∗
0.27
0∗∗∗
0.30
9∗∗∗
(0.0
309)
(0.0
441)
(0.0
798)
(0.0
567)
(0.0
455)
(0.0
482)
(0.0
839)
(0.0
559)
Yea
rssi
nce
pre
vio
us
board
-0.0
0796
0.02
100.
0310
-0.0
0102
-0.0
135
0.00
468
0.01
580.
0381
(0.0
129)
(0.0
228)
(0.0
335)
(0.0
590)
(0.0
162)
(0.0
334)
(0.0
309)
(0.0
639)
Con
stan
t-2
.805∗∗∗
-2.4
30∗∗∗
-2.6
85∗∗∗
-2.4
52∗∗∗
-3.0
23∗∗∗
-2.9
35∗∗∗
-3.0
52∗∗∗
-2.3
96∗∗∗
(0.1
42)
(0.1
54)
(0.2
74)
(0.3
52)
(0.2
15)
(0.1
67)
(0.2
72)
(0.3
94)
Ob
serv
atio
ns
485
736
5322
4215
3538
3930
0320
1614
30P
seu
doR
20.
228
0.21
80.
223
0.19
80.
245
0.21
20.
234
0.20
7
Yea
rF
E?
YY
YY
YY
YY
Ind
ust
ryF
E?
YY
YY
YY
YY
Rou
nd
#F
E?
YY
YY
YY
YY
Est
imati
on
Pro
bit
Pro
bit
Pro
bit
Pro
bit
Pro
bit
Pro
bit
Pro
bit
Pro
bit
34

Table IV Partner Performance Persistence by Exit Types
This table reports probit regressions (OLS for columns 3 and 6) for three different dependent variables using thesame specification as Table III. Each column includes only one observation per partner, who was observed atonly one VC firm. ACQ–t is one if the partner’s tth board seat investment resulted in a successful acquisition(i.e., sold for at least twice capital invested) and Fail–t is one if it resulted in a failure or the firm had yet toexit by the end of the sample. Exit value t is the log of the exit value at sale of the entrepreneurial firm (zero iffailure or missing). See Table I for control variable definitions. Standard errors are clustered at the investmentyear level. Note that observation counts differ slightly from Table III because of observations dropped due tomulticollinearity. Significance: ∗ p < 0.10, ∗∗ p < 0.05, ∗∗∗ p < 0.01.
ACQ–3 Fail–3 Exit Value–3 ACQ–5 Fail–5 Exit value–5(1) (2) (3) (4) (5) (6)
% Acq. t− 1 0.275∗∗ 0.442∗∗
(0.134) (0.189)
% Fail t− 1 0.0709∗ 0.297∗∗
(0.0412) (0.126)
Avg. exit value t− 1 0.0844∗∗∗ 0.107∗∗∗
(0.0167) (0.0348)
Partner experience yrs. (log) -0.0181 0.0624∗∗∗ -0.0516 -0.0570 0.0547 -0.183(0.0365) (0.0190) (0.0473) (0.0609) (0.0401) (0.113)
VC total deals (log) 0.0321 -0.0521∗∗∗ 0.0236 0.0299 -0.0575∗∗∗ 0.113∗∗
(0.0205) (0.0164) (0.0221) (0.0361) (0.0144) (0.0420)
Dollars invested (log) 0.0178 -0.0828∗∗∗ 0.375∗∗∗ -0.0812∗ -0.0229 0.254∗∗∗
(0.0273) (0.0301) (0.0514) (0.0471) (0.0286) (0.0706)
Years sinceprevious board 0.0248 -0.0282∗ 0.0256 -0.0627 0.0404 0.00977
(0.0326) (0.0161) (0.0461) (0.0456) (0.0356) (0.0465)
Constant -2.127∗∗∗ 1.119∗∗∗ 2.654∗∗∗ -1.558∗∗∗ 0.675∗∗∗ 2.783∗∗∗
(0.109) (0.0833) (0.126) (0.243) (0.139) (0.206)
Observations 3566 3566 3566 2239 2239 2239R2 0.143 0.144Pseudo R2 0.048 0.062 0.043 0.073
Year FE? Y Y Y Y Y YIndustry FE? Y Y Y Y Y YRound # FE? Y Y Y Y Y Y
Model Probit Probit OLS Probit Probit OLS
35

Tab
leV
Part
ner
Perf
orm
an
ce
Pers
iste
nce
VC
Fir
mF
ixed
Eff
ects
Th
ista
ble
rep
ort
sfi
xed
effec
tsre
gre
ssio
ns
wh
ere
the
un
itis
the
VC
firm
infi
ve-
yea
rin
ves
tmen
tw
ind
ow
s(i
.e.,
VC
coh
ort
).T
he
esti
mati
on
use
sth
eco
nd
itio
nal
logit
spec
ifica
tion
for
the
lim
ited
dep
end
ent
vari
ab
leIP
O–t,
wh
ich
iseq
ual
toon
eif
the
entr
epre
neu
rial
firm
that
was
the
VC
part
ner
’stth
inves
tmen
tev
entu
ally
wen
tp
ub
lic.
AC
Q–t
iseq
ual
toon
eif
thetth
inves
tmen
tw
as
asu
cces
sfu
lacq
uis
itio
n.
Fail–t
iseq
ual
toon
eif
that
inves
tmen
tfa
iled
.T
he
con
dit
ion
al
logit
requ
ires
som
evari
ati
on
inth
ed
epen
den
tvari
ab
lefo
rea
chp
art
ner
,w
hic
his
why
the
sam
ple
ssi
zes
diff
eracr
oss
spec
ifica
tion
s.E
xit
valu
eis
the
log
of
on
ep
lus
the
exit
valu
ati
on
(zer
oif
failu
re).
Th
em
od
elin
colu
mn
s7
an
d8
use
sim
ple
fixed
effec
tses
tim
ato
rs.
Th
eV
Cfi
rmco
hort
mu
sth
ave
at
least
thre
eact
ive
part
ner
sto
be
incl
ud
ed.
Contr
ols
are
defi
ned
inT
ab
leI.
“A
dd
itio
nal
contr
ols
”in
clu
de
dollars
inves
ted
an
dyea
rssi
nce
pre
vio
us
board
seat
as
defi
ned
inT
ab
leI.
Sta
nd
ard
erro
rsare
clu
ster
edat
the
inves
tmen
tyea
rle
vel
.S
ign
ifica
nce
:∗p<
0.1
0,∗∗
p<
0.0
5,∗∗
∗p<
0.0
1.
IPO
–3IP
O–5
AC
Q–3
AC
Q–5
Fai
l–3
Fai
l–5
Exit
valu
e–3
Exit
valu
e–5
(1)
(2)
(3)
(4)
(5)
(6)
(7)
(8)
%IP
Ot−
10.
648∗∗
1.11
3∗∗
(0.2
61)
(0.5
33)
%A
cq.t−
10.
573∗
1.48
6∗∗
(0.3
21)
(0.6
58)
%F
ailt−
10.
0207
0.33
2(0
.153)
(0.3
27)
Avg.
exit
valu
et−
10.
0640∗∗∗
0.12
5∗∗∗
(0.0
246)
(0.0
481)
Par
tner
exp
erie
nce
yrs
.(l
og)
0.10
7-0
.063
90.0
388
-0.0
297
0.05
930.
136
0.05
39-0
.096
8(0
.070
4)(0
.147
)(0
.070
5)
(0.1
36)
(0.0
428)
(0.0
854)
(0.0
488)
(0.0
979)
VC
tota
ldea
ls(l
og)
-0.7
15∗∗∗
-1.5
55∗∗∗
-0.1
40
-0.2
130.
283∗∗∗
0.45
8∗∗∗
-0.4
42∗∗∗
-0.7
05∗∗∗
(0.1
28)
(0.3
33)
(0.1
34)
(0.2
18)
(0.0
791
)(0
.144
)(0
.083
9)(0
.151
)
Obse
rvat
ions
1522
650
1366
550
2897
1232
4554
2145
R2
0.03
80.
046
Pse
udoR
20.
103
0.12
80.
026
0.05
40.
014
0.02
5T
otal
VC
Coh
orts
302
154
273
130
658
326
177
7959
VC
Coh
ort
FE
?Y
YY
YY
YY
YY
ear
FE
?N
NN
NN
NN
NIn
dust
ryF
E?
YY
YY
YY
YY
Rou
nd
#F
E?
YY
YY
YY
YY
Addit
ional
contr
ols?
YY
YY
YY
YY
Est
imat
ion
Con
d.
Log
itC
ond.
Log
itC
ond.
Logi
tC
ond.
Log
itC
ond
.L
ogit
Con
d.
Log
itO
LS
OL
S
36

Table VI Partner and VC Firm Fixed Effects
This table reports three-way fixed effects regressions using the method detailed in Abowd, Creecy, and Kramarz(2002) and AKM to estimate both VC firm and VC partner fixed effects. The estimation is implemented using theStata command “felsdvreg” as described in Cornelissen (2008). The unit of observation is the VC partner, boardseat, and entrepreneurial firm outcome. Column 1 uses the log of one plus the exit valuation as the dependentvariable (zero if failed or missing), column 2 uses the dummy variable IPO, and column 3 uses a successfulacquisition (≥ 2 times capital invested) dummy variable. Column 4 uses the dummy variable Failure, definedas one if the investment failed. Firms without an IPO or successful acquisition have a zero as the dependentvariable in columns 2 and 3. The rows for “F -test on FE” report the p-value from the null that the estimated
VC partner or VC firm fixed effects are jointly zero.cov(Y,PartnerFE)
var(Y )reports the “beta” for the partner fixed
effects (similarly for the last row and VC fixed effects). The percentages in parentheses report the fraction ofthe R2 that are attributable to the firm and partner fixed effects (see Graham, Li, and Qiu (2012)) for details).Table I defines the control variables. “Mean dep. variable” reports the mean of the dependent variable. “# VCfirms” is the total VC firms in the sample. Robust standard errors clustered at the VC firm level are reportedin parentheses. Significance: ∗ p < 0.10, ∗∗ p < 0.05, ∗∗∗ p < 0.01.
Exit Valuation IPO Acquisition Failure(1) (2) (3) (4)
Relative importance of estimates in R2. %’s are fraction R2 explained by covariate.cov(Y,PartnerFE)
var(Y ) 0.12 (46%) 0.10 (38%) 0.10 (62%) 0.12 (57%)cov(Y,V CFE)
var(Y ) 0.02 (8%) 0.04 (12%) 0.03 (25%) 0.02 (10%)
F -test on FE (p-value)VC Partner FE < 0.01 0.06 0.79 < 0.01VC Firm FE 0.78 0.70 0.3 0.74
Round # (log) 0.352∗∗∗ 0.0506∗∗∗ -0.00526 -0.0760∗∗∗
(0.0473) (0.00679) (0.00615) (0.00861)
Dollars invested (log) 0.281∗∗∗ 0.0348∗∗∗ -0.00222 -0.0380∗∗∗
(0.0296) (0.00409) (0.00360) (0.00604)
Partner experience yrs. (log) -0.115 -0.00966 -0.00746 0.0132(0.0763) (0.0103) (0.00981) (0.0137)
VC experience yrs. (log) -0.0414 -0.00678 -0.0150∗ 0.00850(0.0653) (0.00878) (0.00782) (0.0128)
Fund sequence (log) 0.231 0.00472 0.0387∗ -0.0560∗
(0.146) (0.0182) (0.0210) (0.0308)
Observations 19617 19617 19617 19617R2 .26 .27 .16 .22Mean dep. variable $151m .14 .11 .40# Movers 603 603 603 603# Stayers 1511 1511 1511 1511# VC Firms 625 625 625 625
Year FE? Y Y Y YIndustry FE? N N N N
37

Table VII Partner and VC Firm Fixed Effects: Subsamples
This table reports three-way fixed effects regressions using the method detailed in Abowd et al. (2002) andAKM to estimate both VC firm and VC partner fixed effects. The estimation is implemented using the Statacommand “felsdvreg” as described in Cornelissen (2008). The unit of observation is the VC partner, board seat,and entrepreneurial firm outcome. All regressions use the log of exit valuation as in Table VI, column 1. “TopVCs” considers only the set of VCs in the top 10% of total investment experience who are also connected by atleast on VC partner mover. “≤ 6 inv.” includes only movers and stayers for the first six of their investments overtheir whole career (i.e., when the partners are young). “Ind. FE” runs the full AKM specification with industryfixed effects. “Bio.” includes only partners that made healthcare investments. “Subset stayers” is the result of aset of random samples of partners and firms such that the total number of partners equals the number of firms.The AKM regression was run 1,000 times over the random samples. We report the median p-values and averageproportion of R2. Coefficient estimates are excluded, but mimic those of column 1 of Table VI. Robust standarderrors clustered at the VC firm level reported in parentheses. Significance: ∗ p < 0.10, ∗∗ p < 0.05, ∗∗∗ p < 0.01.
Top VCs ≤ 6 inv. Ind. FE Bio. Subset stayers(1) (2) (3) (4) (5)
Relative importance of estimates in R2. %s are fraction R2 explained by covariate.cov(Y,PartnerFE)
var(Y ) 0.09 (40%) 0.23 (57%) 0.12 (46%) 0.13 (50%) 0.13 (42%)cov(Y,V CFE)
var(Y ) 0.03 (13%) 0.04 (17%) 0.02 (8%) 0.02 (8%) 0.06 (20%)
F -test on FE (p-value) MedianVC Partner FE < 0.01 < 0.01 0.01 < 0.01 0.04VC Firm FE 0.08 0.49 0.50 0.51 0.61
Round # (log) 0.325∗∗∗ 0.326∗∗∗ 0.371∗∗∗ 0.316∗∗∗
(0.0705) (0.0752) (0.0523) (0.0699)
Dollars invested (log) 0.295∗∗∗ 0.272∗∗∗ 0.291∗∗∗ 0.334∗∗∗
(0.0430) (0.0442) (0.0341) (0.0395)
Partner experience yrs. (log) -0.157 -0.135 -0.137 -0.176(0.143) (0.107) (0.0865) (0.122)
VC experience yrs. (log) -0.136 0.0480 -0.0381 -0.138(0.0905) (0.0972) (0.0730) (0.0988)
Fund sequence (log) 0.283 0.0480 0.315∗∗ 0.221(0.248) (0.217) (0.152) (0.219)
Observations 9720 9381 14730 7981R2 .24 .37 .28 .25 .31# Movers 90 432 462 278 300# Stayers 846 1440 972 509 105# VC Firms 81 515 530 373 427
Year FE? Y Y Y Y YIndustry FE? N N Y N N
38

Tab
leV
III
Ch
ara
cte
rist
ics
of
Fir
ms,
Part
ners
,an
dFu
llA
KM
Sam
ple
Th
ista
ble
rep
ort
sch
ara
cter
isti
csof
firm
sth
at
mover
sle
ftan
dm
oved
to,
part
ner
sth
at
move
an
dst
ay
an
dfi
rms
inan
dou
tof
the
sam
ple
.A
mover
isa
VC
part
ner
that
swit
ched
VC
firm
sd
uri
ng
the
sam
ple
per
iod
.E
ach
pan
elco
nsi
der
sa
diff
eren
tse
tof
ob
serv
ati
on
s.In
Pan
elA
,ob
serv
ati
on
sare
entr
epre
neu
rial
firm
an
dV
Cin
ves
tor
wit
ha
board
seat,
wh
ere
the
form
erre
ceiv
edit
sfi
rst
cap
ital
pri
or
to2006.
Nu
mb
ers
rep
ort
edare
the
mea
nacr
oss
each
sub
sam
ple
.“M
oved
To”
com
pri
ses
firm
sth
at
on
lyh
ad
am
over
move
toth
at
firm
.“M
oved
Fro
m”
com
pri
ses
firm
sth
at
on
lyh
ad
am
over
leave
the
firm
.C
olu
mn
3re
port
sth
ed
iffer
ence
sin
mea
ns
an
dth
eir
sign
ifica
nce
bet
wee
nth
etw
osa
mp
les.
Pan
elB
rep
ort
sth
ech
ara
cter
isti
csof
part
ner
sw
ho
move
an
dst
ay
inth
efu
llfi
xed
effec
tsre
gre
ssio
ns.
Nu
mb
ers
rep
ort
edare
the
mea
nacr
oss
each
sub
sam
ple
.“M
over
”co
mp
rise
sp
art
ner
sth
at
moved
at
least
on
ce.
“S
tayer
”co
mp
rise
sp
art
ner
sth
at
are
inth
eco
nn
ecte
dsa
mp
le(i
.e.,
work
edat
afi
rmw
ith
am
over
).C
olu
mn
6re
port
sth
ed
iffer
ence
inm
ean
san
dth
eir
sign
ifica
nce
.P
an
elC
rep
ort
sth
ech
ara
cter
isti
csof
VC
firm
sin
an
dou
tof
the
full
fixed
effec
tsre
gre
ssio
ns
inT
ab
leV
I.N
um
ber
sre
port
edare
the
mea
nacr
oss
each
sub
sam
ple
.“N
on
-AK
MF
irm
s”are
the
VC
firm
sth
at
had
ap
art
ner
wit
hat
least
fou
rb
oard
seats
,b
ut
lack
eda
mover
to/fr
om
the
firm
.“A
KM
Fir
ms”
are
those
firm
sin
Tab
leV
I.C
olu
mn
9re
port
sth
ed
iffer
ence
san
dst
ati
stic
al
sign
ifica
nce
.“E
xit
valu
ati
on
”is
the
tota
ld
ollars
the
entr
epre
neu
rial
firm
sold
for
at
exit
(0if
failu
reor
still
pri
vate
by
end
of
sam
ple
).T
ab
leI
defi
nes
the
vari
ab
les.
“D
iff/s.
e.”
rep
ort
sth
ed
iffer
ence
,th
est
an
dard
erro
r,an
dsi
gn
ifica
nce
from
the
two-s
ided
t-te
st.
Sig
nifi
can
ce:
∗p<
0.1
0,∗∗
p<
0.0
5,∗∗
∗
p<
0.0
1.
Pan
elA
:F
irm
sfr
oman
dto
Pan
elB
:S
taye
rsvs.
mov
ers
Pan
elC
:F
irm
sin
and
out
ofsa
mp
leM
oved
Mov
edD
iffM
over
Sta
yer
Diff
AK
MN
on-A
KM
Diff
To
Fro
m(s
.e.)
(s.e
.)F
irm
sF
irm
s(s
.e.)
(1)
(2)
(3)
(4)
(5)
(6)
(7)
(8)
(9)
Exit
valu
e(m
)62.
0778.2
8-1
6.20
97.1
212
4.1
-26.
9889
.52
51.4
338
.10∗∗∗
(21.
74)
(24.
39)
(11.
10)
%IP
O0.0
574
0.1
81
-0.1
24∗∗∗
0.12
00.
118
0.01
980.
115
0.09
350.
0220∗
(0.0
143)
(0.0
0728
)(0
.009
85)
$in
ves
ted
16.2
211
.83
4.38
9∗
11.7
412
.58
-0.8
4412
.99
11.6
31.
365
(1.8
69)
(0.4
81)
(0.7
77)
Rou
nd
#2.
540
1.80
00.
739∗∗∗
2.08
81.
989
0.09
88∗∗
2.16
82.
053
0.11
5∗
(0.1
11)
(0.0
358)
(0.0
550)
Inve
stm
ent
year
200
2.6
1996.
56.
041∗∗∗
2000
.220
00.3
-0.0
911
(0.3
64)
(0.2
02)
Yea
rfi
rst
inv.
1999.
9199
2.2
7.77
3∗∗∗
2000
.020
00.0
0.01
5519
96.7
1997
.7-0
.941∗∗∗
(0.4
94)
(0.1
45)
(0.2
64)
Info
rmati
on
tech
.0.5
270.5
35
-0.0
082
0.53
60.
563
-0.0
261
0.52
60.
517
0.00
933
(0.0
319)
(0.0
173)
(0.0
202)
Tot
al
inve
stm
ents
8.9
67
7.32
81.
640∗∗
10.7
99.
964
0.82
2∗
12.0
86.
810
5.26
5∗∗∗
(0.5
57)
(0.3
30)
(0.4
17)
Ob
serv
atio
ns
304
174
602
1511
623
500
39

Table IX Partner and VC Firm Fixed Effects: Different Movers
This table reports three-way fixed effects regressions using the method detailed in Abowd, Creecy, and Kramarz(2002) and AKM to estimate both VC firm and VC partner fixed effects. The estimation is implemented usingthe Stata command “felsdvreg” as described in Cornelissen (2008). The unit of observation is the VC partner,board seat, and entrepreneurial firm outcome. All regressions use the log of exit valuation. “Similar” startswith movers who moved to a firm that was in the lower 50% of the difference between new versus previous firmperformance. “Different” starts with the movers who moved to a firm that was in the top 50% of the differencebetween new versus previous firm performance. The connected group is constructed after restricting to this setof movers. “Moved down” includes movers whose new firm’s IPO rate was higher than their previous firm’sIPO rate as of the move. “Moved up” is the same, but when the new firm has the same or better historicalperformance. If a mover moves to a new firm or forms a new firm, the firm and mover are excluded from theseregressions. All other variables are defined in Table I. Robust standard errors clustered at the VC firm level arereported in parentheses. Significance: ∗ p < 0.10, ∗∗ p < 0.05, ∗∗∗ p < 0.01.
Moved down Moved up Similar Different(1) (2) (3) (4)
Relative importance of estimates inR2. %s are fraction R2 explained by covariate.cov(Y,PartnerFE)
var(Y ) 0.12 (50%) 0.10 (43%) 0.14 (70%) 0.11 (47%)cov(Y,V CFE)
var(Y ) 0.02 (8%) 0.04 (17%) < 0.001 (0%) 0.02 (9%)
F -test on FE (p-value)VC Partner FE < 0.01 0.01 < 0.01 < 0.01VC Firm FE 0.72 0.51 0.57 0.68
Round # (log) 0.335∗∗∗ 0.359∗∗∗ 0.366∗∗∗ 0.277∗∗∗
(0.0572) (0.0636) (0.0587) (0.0588)
Dollars invested (log) 0.261∗∗∗ 0.281∗∗∗ 0.286∗∗∗ 0.246∗∗∗
(0.0330) (0.0390) (0.0383) (0.0350)
Partner experience yrs. (log) -0.0952 -0.0181 -0.0533 -0.0232(0.115) (0.115) (0.113) (0.119)
VC experience yrs. (log) -0.0251 -0.124 -0.0921 -0.0670(0.0860) (0.0916) (0.0892) (0.0848)
Fund sequence (log) 0.104 0.261 0.159 0.241(0.175) (0.217) (0.193) (0.208)
Observations 13163 10213 11813 10498R2 .25 .24 .24 .25# Movers 254 155 218 191# Stayers 1134 878 1040 891# VC Firms 311 240 288 261
Year FE? Y Y Y YIndustry FE? N N N N
40