is echo a complex adaptive system? - reed collegemab/publications/papers/smith.pdfrichard m. smith...
TRANSCRIPT

Is Echo a Complex Adaptive System?
Richard M. SmithBinghamton UniversityP.O. Box 6000Binghamton, NY 13902, [email protected]
Mark A. BedauReed College3203 SE Woodstock Blvd.Portland, OR 97202, [email protected]
Abstract
We evaluate whether John Holland’s Echo model exemplifies his theory of complex adaptivesystems. After reviewing Holland’s theory of complex adaptive systems and describing hisEcho model, we describe and explain the characteristic evolutionary behavior observedin a series of Echo model runs. We conclude that Echo lacks the diversity of hierarchi-cally organized aggregates that typify complex adaptive systems, and we explore possibleexplanations for this failure.
Keywords
Echo, John Holland, complex adaptive systems, artificial life, genetic algorithms.
1 Introduction
In the second edition of Adaptation in Natural and Artificial Systems (ANAS), John Hollandsituates his book within a general attempt to understand complex adaptive systems (CAS).He makes it clear that, from the beginning, he has sought to understand general principlesthat apply across a wide variety of adaptive systems, and we see Holland in ANAS drawingupon fields as diverse as genetics, economics, and neurophysiology (Holland, 1992, 32–65).It is in this context of a general understanding of CAS that Echo was initially conceived.
Holland’s original impetus for creating Echo was a request from Murray Gell-Mannto produce a model illustrating the creation of complex structures by natural selection(Holland, 1995, 94–95). Echo shares many features with the mathematical framework laidout in ANAS, but it is not merely an implementation of ANAS’s mathematical framework ofschema and optimal trial allocation. Commenting upon the relationship between Echo andclassifier systems (a mathematical refinement of ANAS’s “broadcast languages”), Hollandstates,
Echo and classifier systems are similar in many ways. The conditions em-ployed by an agent in Echo are quite similar to the condition/action rules of aclassifier system. However, the actions in Echo (combat, trading, mating) aremuch more concrete than the rule-activating messages used by a classifier sys-tem. They are much easier to interpret when one is trying to understand aspectsof distributed control and emergent computation in complex adaptive systems(Holland, 1992, 195).
c 2000 by the Massachusetts Institute of Technology Evolutionary Computation 8(4): 419-442
R. Smith and M. Bedau
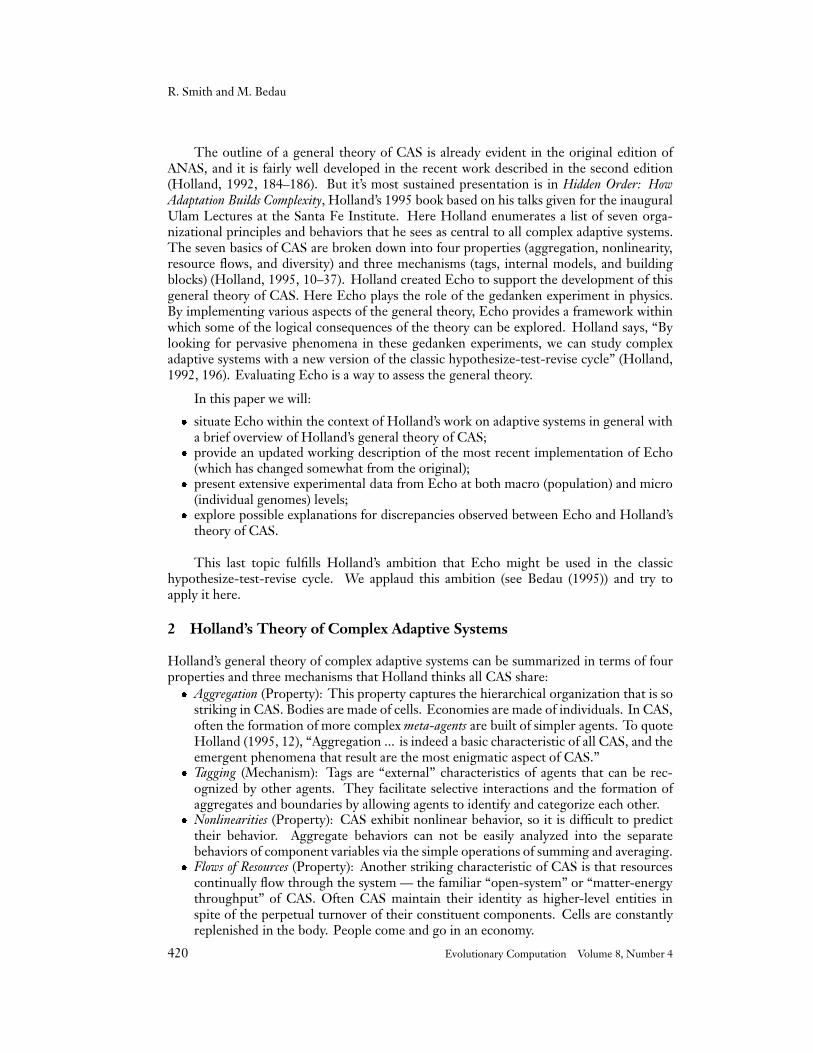
The outline of a general theory of CAS is already evident in the original edition ofANAS, and it is fairly well developed in the recent work described in the second edition(Holland, 1992, 184–186). But it’s most sustained presentation is in Hidden Order: HowAdaptation Builds Complexity, Holland’s 1995 book based on his talks given for the inauguralUlam Lectures at the Santa Fe Institute. Here Holland enumerates a list of seven orga-nizational principles and behaviors that he sees as central to all complex adaptive systems.The seven basics of CAS are broken down into four properties (aggregation, nonlinearity,resource flows, and diversity) and three mechanisms (tags, internal models, and buildingblocks) (Holland, 1995, 10–37). Holland created Echo to support the development of thisgeneral theory of CAS. Here Echo plays the role of the gedanken experiment in physics.By implementing various aspects of the general theory, Echo provides a framework withinwhich some of the logical consequences of the theory can be explored. Holland says, “Bylooking for pervasive phenomena in these gedanken experiments, we can study complexadaptive systems with a new version of the classic hypothesize-test-revise cycle” (Holland,1992, 196). Evaluating Echo is a way to assess the general theory.
In this paper we will:
� situate Echo within the context of Holland’s work on adaptive systems in general witha brief overview of Holland’s general theory of CAS;
� provide an updated working description of the most recent implementation of Echo(which has changed somewhat from the original);
� present extensive experimental data from Echo at both macro (population) and micro(individual genomes) levels;
� explore possible explanations for discrepancies observed between Echo and Holland’stheory of CAS.
This last topic fulfills Holland’s ambition that Echo might be used in the classichypothesize-test-revise cycle. We applaud this ambition (see Bedau (1995)) and try toapply it here.
2 Holland’s Theory of Complex Adaptive Systems
Holland’s general theory of complex adaptive systems can be summarized in terms of fourproperties and three mechanisms that Holland thinks all CAS share:� Aggregation (Property): This property captures the hierarchical organization that is so
striking in CAS. Bodies are made of cells. Economies are made of individuals. In CAS,often the formation of more complex meta-agents are built of simpler agents. To quoteHolland (1995, 12), “Aggregation ... is indeed a basic characteristic of all CAS, and theemergent phenomena that result are the most enigmatic aspect of CAS.”
� Tagging (Mechanism): Tags are “external” characteristics of agents that can be rec-ognized by other agents. They facilitate selective interactions and the formation ofaggregates and boundaries by allowing agents to identify and categorize each other.
� Nonlinearities (Property): CAS exhibit nonlinear behavior, so it is difficult to predicttheir behavior. Aggregate behaviors can not be easily analyzed into the separatebehaviors of component variables via the simple operations of summing and averaging.
� Flows of Resources (Property): Another striking characteristic of CAS is that resourcescontinually flow through the system — the familiar “open-system” or “matter-energythroughput” of CAS. Often CAS maintain their identity as higher-level entities inspite of the perpetual turnover of their constituent components. Cells are constantlyreplenished in the body. People come and go in an economy.
420 Evolutionary Computation Volume 8, Number 4

Is Echo a Complex Adaptive System
� Diversity (Property): Populations in CAS are diverse and tend to operate far fromequilibrium. To quote Holland: “It should be evident then that we will not find CASsettling to a few highly adapted types that exploit all opportunities. Perpetual noveltyis the hallmark of CAS” (Holland, 1995, 31).
� Internal Models (Mechanism): CAS form internal models that allow them to predictand anticipate their environment. These internal models are generally of two types:Tacit models prescribe a current action under an implicit prediction of some desiredfuture state, such as when bacteria follow chemical gradients. Overt models are used asa basis for explicit, but internal, explorations of alternative behaviors, e.g., lookaheadin chess. In both types of models the organism’s chances of survival are enhanced bythe prediction.
� Building Blocks (Mechanism): Building blocks play several roles in CAS. Often physicalconstruction of CAS involves lower level building blocks in the sense of aggregationdescribed above. CAS also use building blocks to help navigate their environment andgenerate internal models. CAS tend to decompose their environment by clusteringtogether similar objects and ignoring unnecessary details. Then actions are taken basedupon these higher level categories, e.g., friend or foe.
According to Holland, these seven attributes are the essential attributes of complexadaptive systems. Furthermore, these are the attributes that Holland aims to capture in theEcho model. With this in mind, we now will take a closer look at Echo itself.
3 The Echo Model
It is important to note that Echo is really a family of models as opposed to a single model.The original version was implemented by Terry Jones at the Santa Fe Institute (Jones andForrest, 1993), and it has undergone a variety of revisions since then. The present workwas performed using Echo version 1.3 beta 2 in a UNIX environment. This version,prepared by Simon Fraser while maintaining Echo at the Santa Fe Institute, includes anumber of simplifications of the original version. The graphical interface was disabled, thedetermination of the outcome of a combat interaction was simplified, and a number of newdata collection tools were added.1 In this section, we present a detailed summary of Echoversion 1.3 beta 2. Our decision to study this particular version of Echo was based on thefact that it was the most current available version when this study was undertaken.2
There are three levels of parameter-defined structures in Echo: the world, sites, andagents. Each of these structures and the parameters that define them are discussed in detailbelow. Sample parameter files for each of the three structures can be found in the Appendix.
3.1 Worlds
An Echo world is a square toroidal lattice of sites. Each site can have different characteristics.World parameters are universal in the sense that they constrain all sites and all agents. Worldparameters control the following properties: the percentage of the population that will beselected for possible interactions in a given cycle; the amount of excess resources an agentmust have accumulated in order to reproduce; what percentage of an agent’s resources
1The source code and additional information on this version of Echo can be found athttp://www.santafe.edu/projects/echo/#research.
2Fraser describes the motivation for the revisions in literature available at the Echo web site mentioned earlier.
Evolutionary Computation Volume 8, Number 4 421

R. Smith and M. Bedau
will be given to its offspring; the neighborhood relationship on the world; how many sitesthe world contains; and how many distinct kinds of resources are available in the world.Each type of resource in the world is represented by a different letter of the alphabet (e.g.,a, b, c, and d for a four resource world). The world parameters also specify the payoffmatrix for combat interactions, but in the version of Echo studied here, the outcome ofcombat interactions is determined by a simple Hamming distance calculation. The combatinteraction is discussed in detail in Section 3.4. Finally, the world parameters determinehow many of which type of sites the world contains.
3.2 Sites
As mentioned above, the parameters for different sites in a given world can differ. Theparameters for a given site include the probability of mutation; the probability of inser-tion/deletion; the probability of cross-over; the probability of random death; the initialresource levels; how many and which resources are produced per model cycle; and themaximum resources that can accumulate at the site. Each of the parameters for resourceavailability must be set for each of the world’s resources. Finally, the site parameters specifyhow many of which types of agents initially populate the site.
3.3 Agents
An Echo agent is defined by a “chromosome” that consists of a collection of arbitrary lengthsub-strings. Each sub-string is made up of the letters of the alphabet that represent theavailable resources in the world (e.g., “bbdcb”). The sub-strings of the chromosome eachdefine a distinct characteristic of the agent. These characteristics fall into four classes: tags,conditions, uptake masks, and traded resource.
Tags and conditions determine the outcome of the three types of interactions betweenagents: combat, trade, and mating. Whether two agents interact and what type of in-teraction they have is determined by comparing tags and conditions. A string match ofthe appropriate tag and condition allows the interaction to take place. Tags are externalin the sense that they represent information that is available to other agents. There arefour tags: interaction tags, mating tags, offense tags, and defense tags. Conditions, on theother hand, are not accessible by other agents. There are three condition strings, one eachfor combat, mating, and trading. How each of these strings affects the outcome of thevarious interactions is discussed in Section 3.4. The existence of external tags and internalconditions is one of Echo’s critical features. Tags and conditions allow for complex (e.g.,non-transitive) relationships to exist between the agents. They are also central to one ofthe features Holland has stressed about Echo (Holland, 1992, 195): its endogenous fitnessfunction, i.e., a fitness function that is an emergent property of the environment and theother agents (a feature perhaps first emphasized by Norman Packard (1989)).
An agent has an uptake mask for each of the available resources in the world. Anagent’s facility at collecting a particular resource from the environment is determined bythe length of the uptake mask for the given resource. How much of each resource an agentis able to take up is determined by the length of the substring corresponding to the givenresource, with longer strings indicating greater facility. The particular letters that composethe uptake mask are irrelevant. Finally, the last sub-string of each agent is a single lettercalled the “traded resource.” It determines what resource the agent will trade in a tradinginteraction.
422 Evolutionary Computation Volume 8, Number 4

Is Echo a Complex Adaptive System
A sample agent chromosome from a four resource world is given below (IT is theinteraction tag, MT is the mating tag, OT is the offense tag, DT is the defense tag, CCis the combat condition, TC is the trading condition, MC is the mating condition, UMathrough UMd are the uptake masks, and TR is the traded resource):
IT MT OT DT CC TC MC UMa UMb UMc UMd TRdba bb cca db ddc aa bbc b ddc cca b
Note the possibility of zero length strings as in the defense tag above. In addition to achromosome, each agent has a reservoir in which it stores resources that it acquires viainteractions and foraging.
3.4 Agent Interactions
In a given cycle of an Echo world, agents are selected at random to participate in interactions.If the interaction fraction parameter in the world file is set to 0:5 and there are 100 agentsin the world, then 50 of the agents will be selected to interact. For each of these agents, asecond agent is selected from the population at random. These two agents then comparetags and conditions to determine what, if any, interactions they will have. They are testedin sequence for combat, trading, and mating.
The combat interaction takes place if the combat condition of one agent is a prefix ofthe other agent’s interaction tag. Combat only requires a one-way match. The outcome ofa combat interaction is, at present, determined by a Hamming distance calculation betweenthe offense tag of one agent and the defense tag of the other agent (in both directions).The Hamming distance is equal to the number of points at which the two strings differ.Both of these tags are visible to each of the agents. They know the likely outcome of afight in advance. If one agent’s offense tag is similar enough to another agent’s defense tag,then the former agent is more likely to prevail. Extra points are given to either agent forhaving the longer tag. Once these calculations have been made the outcome of the battleis determined probabilistically. Each agent is given a chance to flee (which it does with aprobability equivalent to the probability of it losing in the combat encounter).
Mating and trading interactions both require two-way matches. The mating interactiontakes place if the mating conditions of both agents are prefixes of each other’s mating tags.The result of a successful mating interaction is more analogous to the types of geneticexchange seen in bacteria as opposed to sexual reproduction. The two participating agentsexchange genetic material via crossover (at a random point in the chromosome) and replacetheir “parents” in the population. Trading takes place if there is a prefix match between thetrading condition of the first agent and the interaction tag of the other agent and vice versa.A trading interaction between two agents results in each agent transferring the excess ofits traded resource (the amount of resources in the agent’s reservoir over and above what itneeds for reproduction) to the other agent.
Agents that have acquired enough resources in their reservoir to copy their chromo-some (as determined by the self replication threshold parameter in the world file) are ableto reproduce asexually. Asexual reproduction is subject to a probability of mutation, whichis normally a point mutation, but can also be further subject to a probability of mutationby crossover or insertion-deletion within the parent chromosome. As a part of asexual re-production, parents give a fixed percentage of the resources remaining in their reservoir totheir offspring. It is mutation, together with the selection pressure due to competition for
Evolutionary Computation Volume 8, Number 4 423
R. Smith and M. Bedau
resources, that drives the evolution of Echo agents. Agents acquire resources via foraging,fighting, and trading. Agents lose resources via a fixed metabolic tax, trading, and asexualreproduction.
An illustrative example of interacting agents was created by Holland based on a threeway ecology given by Holldobler and Wilson (1990). The ecology consists of ants, cater-pillars, and parasitic flies. In this ecology the flies are parasites on the caterpillars. Theants benefit the caterpillars by attacking the flies and in turn are rewarded by collectinghoneydew that the caterpillars excrete from their skin. Agent parameters for the caterpillar,ant, and fly ecology are given below (asterisks represent wild cards).
Name cat ant flyInitial Rsrv 10 10 10 10 10 10 10 10 10 10 10 10Trade Rsrc b a cUptake Msk * * * * * * * * * * * *Interact Tag d b aOffense Tag d b aDefense Tag a b bMating Tag a a aComb Cond c a dTrade Cond b d cMate Cond b b b
Note the following relationships: The caterpillar trading condition is a prefix match of theant interaction tag and vice versa. Thus a caterpillar and ant will trade with each other.The fly combat condition is a prefix match with the caterpillar interaction tag. Thus thefly will initiate combat with the caterpillar. Also, the fly offense tag matches the caterpillardefense tag making the match ‘close’ in the sense of Hamming distance and thus giving thefly the upper hand in a fight. On the other hand the caterpillar offense string is not ‘close’to the fly defense string. A similar relationship holds between the ant and fly (ant attacksfly). Finally note that the ant chromosome consists of many b’s thus making b a valuableresource to the ant. The caterpillar trading resource is b, so when ant and caterpillar trade,the ant receives the excess b’s in the caterpillar’s reservoir. This helps the ant acquire theparticular resources it needs to replicate.
3.5 The Model Cycle
One time step in the Echo model consists of the following cycle of events: A proportion ofthe agents are selected to undergo interactions, and the interactions take place. Resources ata site are distributed to those agents that can accept them (according to their uptake masks).Agents are taxed probabilistically. Some agents are randomly killed (if there is a non-zeroprobability of random death) and their resources returned to the environment. Agents thathave not collected resources migrate to a randomly chosen neighboring site (in multi-siteworlds). Finally, agents that have acquired sufficient resources reproduce asexually. In thispaper we will sometimes refer to one Echo time step as a “generation” even though there isno guarantee that any agents will reproduce or die during a given model cycle.
424 Evolutionary Computation Volume 8, Number 4

Is Echo a Complex Adaptive System
4 Description of Echo’s Behavior
We have generated thousands of Echo runs, many of them for as long as 106 generations.Here we describe a particular set of runs in which we varied the mutation rate, but ourpresent goal is not to study the effect of mutation rate; instead, we want to identify andexplain the characteristic kinds of evolutionary dynamics exhibited by Echo.
The runs described here all use the “simple” parameters given in the Appendix. Withthe exception of their initial resource levels, all agents in the initial population have randomlychosen chromosomes (as indicated by the wildcard characters in the agent parameters).The only parameter that varies from run to run is the probability of mutation — a siteparameter. In this section we analyze several runs and identify their robust evolutionarydynamics. Section 5 explains those characteristic dynamics.
We generated many Echo runs at each of six different mutation probabilities: 0.00001,0.0001, 0.001, 0.005, 0.01, and 0.05. (Populations with significantly higher mutationprobabilities tended not to survive.) Each run lasted 105 generations. Our story aboutEcho is told through a detailed analysis of one characteristic run at five of these mutationprobabilities.
Studies like ours must choose an evolutionary unit upon which to focus attention.Should we focus on the whole population? the genomes within it? each individual agent?something else? Should similar genomes be considered a single evolutionary unit, i.e., beregarded as a species? In this study we choose to focus on genomes for purely pragmaticreasons: it explains the observed behavior.
Many agents can have identical genomes. Though there may be multiple copies ofa given genome in a population we still refer to the genome as a singular entity. A givengenome exists for as long as there are agents possessing that genome. We consider genomesto be significant if they persist in the population for a long time or if a large number of agentspossess them. We present both macro-level and micro-level dynamics. Macro-level data aretypically time series of agent population levels and genome diversities (i.e., number of extantgenomes), though sometimes we also show the frequency of the various interactions andthe presence of the different resources in the agents’ reservoirs. Micro-level data typicallyare lists of all the significant genomes in the population. The genomes in such lists arepresented in the following form:
Born it mt ot dt cc tc mc a b c d tr #tr Die13476 c c a ac d c a cba a b c a 6 34000
This representation indicates the generation in which the agent was born, the componentsof the chromosome (interaction tag through traded resource — see Section 3.3 for anexplanation of the components), the number of traded resources in the agent’s genome, andthe generation in which the genome died (rounded down to the nearest thousand). As willbecome clear below, in most cases the next to last entry — the number of traded resources inthe genome (indicated by “#tr”) — turns out to be a genome’s most significant feature. Weuse the convention of naming a genome with the generation number at which it arose; thusthe genome shown above is g13476. Although this would create an ambiguity if multiplegenomes arose in a single generation, in practice this never happens.
Evolutionary Computation Volume 8, Number 4 425
R. Smith and M. Bedau
0
20
40
60
80
100
0 10000 20000 30000 40000 50000 60000 70000 80000 90000 100000
Pop
ulat
ion
0
5
10
15
20
25
30
35
40
45
0 10000 20000 30000 40000 50000 60000 70000 80000 90000 100000
Var
iety
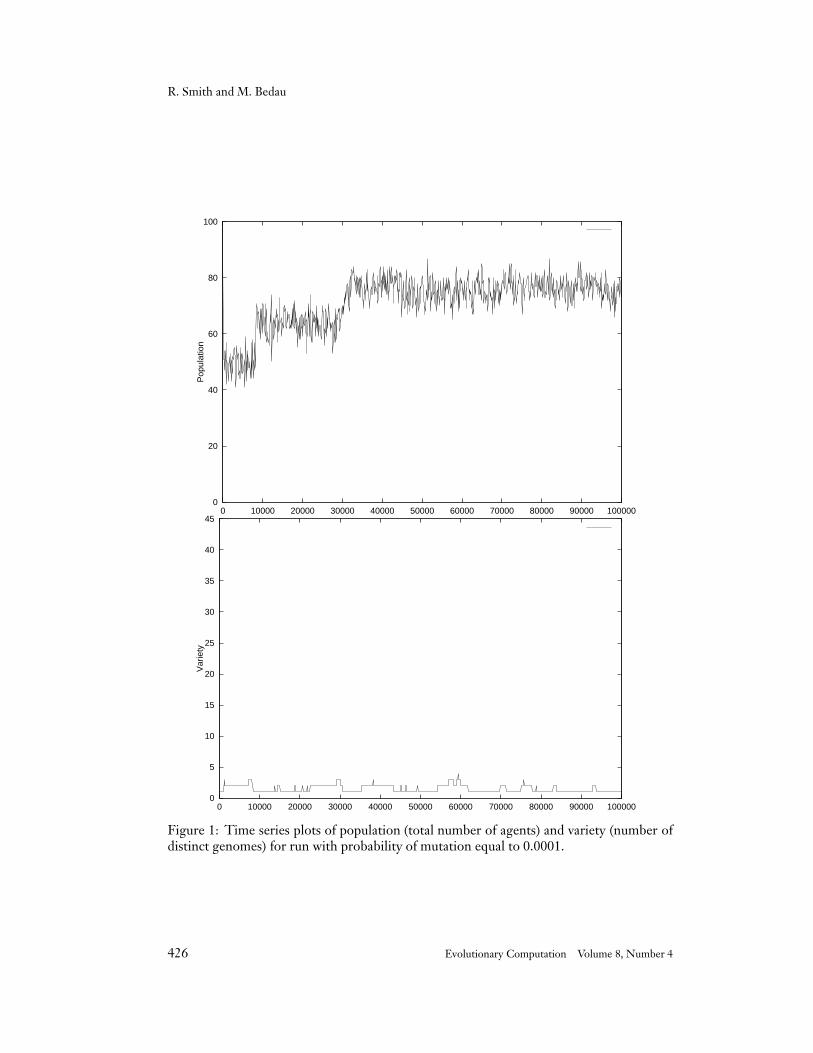
Figure 1: Time series plots of population (total number of agents) and variety (number ofdistinct genomes) for run with probability of mutation equal to 0.0001.
426 Evolutionary Computation Volume 8, Number 4

Is Echo a Complex Adaptive System
4.1 Probability of Mutation 0.0001
We will describe this first run in considerable detail since it illustrates many recurringthemes especially clearly. The population graph (Figure 1) shows three distinct epochs inthe population levels. The variety graph (Figure 1) shows that usually one or two genomesexhaust the population, though sometimes as many as four distinct genomes exist at once.The significant genomes in this run are listed here:
Born it mt ot dt cc tc mc a b c d tr #tr Die0 a d c b c a b c a d d a 4 80001121 a b c b c a b c a d d a 4 80007135 a b c a c a b c a d d a 5 3000022592 a b c a c a b c a d a a 6 10000035352 a b c a c a b b a d a a 6 4300054248 a b c a c a b c a c a a 6 58000
Micro-analysis reveals the following story. By generation 2,000 we have a two-genomeecology of g0 and g1121. Both genomes trade with themselves and with one another, andboth share the same traded resource — a. Genome g1121 differs from g0 at the mating tag.In principle, this could be a significant mutation since it enables agents with genome g1121to mate with each other, but interaction statistics show that no mating actually happens.The ability to mate is no advantage if mating never occurs. As it happens, rampant tradingactivity blocks mating; agents are tested for trading before being tested for mating and theycannot mate if they trade. So, genomes g0 and g1121 coexist through generation 8,000,with genome g1121 tending to be more populous (presumably through random geneticdrift).
At generation 8,000 we meet genome g7135. Genome g7135 is a mutation of g1121,with a defense tag of a instead of d. As it happens, this mutation is actually irrelevant tocombat since combat never occurs in this population. But the mutation is quite significantbecause it increases the presence of the population’s traded resource (a) in g7135’s genome.We will see this this kind of innovation occur in every single Echo run, usually many times.Genome g7135 has 5 a’s as opposed to 4 in g0 and g1121, and genome g7135 has taken overthe population by generation 9,000 when genomes g0 and g1121 go extinct. Note also thatit is at about this point that the population level makes its first significant jump. Again andagain we will see such population level jumps occurring when the population is taken overby a new genome with more of the traded resource.
Genome g7135 is joined at generation 23,000 by genome g22592. Genome g22592differs from g7135 at the uptake mask for resource d. This mutation is not a functionaladvantage for g22592 since only the length of an uptake mask affects a genome’s capacityto gather a given resource, and the d uptake mask is the same length for both g7135 andg22592. However, the mutation puts another copy of the traded resource (a) in genomeg22592, and by generation 31,000 genome g22592 has taken over the population. Note theincrease in the population level at the demise of genome g7135.
Genomes g35352 and g54248 join g22592 for a period of time at different points in therun. Genome g35352 differs from g22592 in the a uptake mask, and g54248 differs fromg22592 in the b uptake mask. As mentioned before, these are both neutral mutations froma resource collecting perspective, and neither increases the traded resource in the genome.
Evolutionary Computation Volume 8, Number 4 427

R. Smith and M. Bedau
This run illustrates several important themes. First, all of the significant genotypestrade the same resource. Second, mutations which increase the traded resource in a genometend to take over the population, though not immediately. Third, when the new genomedoes take over the population, the population level distinctly increases; i.e., the genomecontaining more of the traded resource supports a larger population of agents.
4.2 Probability of Mutation 0.001
The following list of significant genomes shows that the same themes are repeated whenthe mutation rate is increased an order of magnitude.
Born it mt ot dt cc tc mc a b c d tr #tr Die2022 a b a b c a c b d a d d 3 50003775 a b a b d a c b d a d d 4 110009853 a b d b d a c b d a d d 5 3300028027 a b d b d a c b d d d d 6 8200057028 a d d b d a c b d d d d 7 100000
All of the genomes trade d’s, and each mutation increases the number of d’s. Note thenew d’s, highlighted in bold, and note the steadily increasing representation of the tradedresource shown in the column #tr. Note that none of the mutations result in a functionaldifference for the genome since they don’t create any new interactions, affect the outcomeof an interaction, or increase the genomes ability to gather resources.
The first genome to get a foothold is g2022. It has 3 d’s in its genome. It is displacedby g3775, which has 4 d’s. Genome g3775 is displaced by g9853, which has 5 d’s. We seea jump in the population level when g3775 goes extinct at generation 11,000 (Figure 2).Genome g9853 is overtaken by g28027, which has 6 d’s. There is a corresponding jumpin the population level upon the demise of g9853 at generation 33,000. Finally, g57028takes over from g28027, but not before the two coexist for over 24,000 generations. Thepopulation level jumps up when g28027 perishes.
Increasing the mutation rate increases the diversity in the population (Figure 2), asexpected. But other than that, the evolutionary dynamics in this run are essentially likethose in the previous run.
4.3 Probability of Mutation 0.005
With the increase in the mutation probability, we see the expected increase in genomicvariety (Figure 3), though the population levels are not significantly changed. What ismost interesting about this run is that the now familiar trading succession is interruptedby a second typical evolutionary dynamic in Echo — a “combat spike,” which is a briefproliferation of fighting agents that decimate a trading ecology. The sharp drop in thepopulation level at generation 45,000 is caused by such a combat spike. These are thesignificant genomes before the combat spike:
Born it mt ot dt cc tc mc a b c d tr #tr Die1074 a b d b c a d b d d d d 6 100001145 a b d b c a a d d d d d 6 90002160 a b d b d a d b d d d d 7 32000
428 Evolutionary Computation Volume 8, Number 4

Is Echo a Complex Adaptive System
0
20
40
60
80
100
0 10000 20000 30000 40000 50000 60000 70000 80000 90000 100000
Pop
ulat
ion
0
5
10
15
20
25
30
35
40
45
0 10000 20000 30000 40000 50000 60000 70000 80000 90000 100000
Var
iety
Figure 2: Time series plots of population (total number of agents) and variety (number ofdistinct genomes) for run with probability of mutation equal to 0.001.
Evolutionary Computation Volume 8, Number 4 429

R. Smith and M. Bedau
2397 a d d b c a d b d d d d 7 1900016866 a d d b d a d b d d d d 8 4300021056 a b d d d a d b d d d d 8 4300030596 a d d b d a d a d d d d 8 4300030749 a d d d d a d b d d d d 9 43000
Genomes g1074, g1145, g2160, and g2397 are the first genomes to get a foothold, and theyall trade d’s. Genomes g2160 and g2397 outlive g1074 and g1145. Genome g2160 persiststhrough generation 32,000 and is superseded by the ecology of g16866, g21056, g30596,and g30749. Note the steadily increasing representation of the traded resource in thesegenomes (the #tr column). This group persists through generation 43,000, at which pointthe whole ecology is brought down by a burst of combat.
At generation 44,000, during the period of combat, the following are the most persistentand populous genomes:
Born it mt ot dt cc tc mc a b c d tr #tr Die43980 d b a a d a c c d c a d 4 4400043989 d b a a d a c b d c a d 4 4400043994 d b c a d a c c d c a d 4 4400043996 d b a a d a c c d c c d 4 44000
Note that all of the genomes can fight one another and that none of them exist for more than20 generations. They are all gone by generation 44,000. This is typical of combat spikes.When combat is a significant feature of the landscape, no genome can get a foothold. Thecombat is brief. It covers the period from 43,600 to 44,200. Once it ceases the demolishedpopulation begins to rebuild and a new trading ecology emerges doing their business in c’s.This trading ecology gradually builds throughout the remainder of the run, as the list ofsignificant genomes below shows:
Born it mt ot dt cc tc mc a b c d tr #tr Die44260 d b b a a b c c d c a d 3 4800047722 b d b a a b c c d c a c 4 5100049809 b d b a a b c c c c a c 5 5300050708 b d c a a b c c d c a c 5 6200051761 b d c d a b c c d c a c 5 6200053929 b d c c a b c c d c a c 6 7900066276 b d c c a b c c d c c c 7 10000070124 b d c c a b c c c c a c 7 8500073228 b d c c c b c c d c a c 7 9200079594 b d c c c b c c c c a c 8 10000080255 b b c c a b c c c c a c 7 100000
4.4 Probability of Mutation 0.01
Another increase in the probability of mutation simply increases the frequency of thepatterns we have already seen. In this run, we see seven cycles of trading populationsdestroyed by combat spikes occurring at generations 5800, 9400, 10700, 15100, 28300,31700, and 49200 (Figure 4). The longest bout of combat lasts for 400 generations. After
430 Evolutionary Computation Volume 8, Number 4

Is Echo a Complex Adaptive System
0
20
40
60
80
100
0 10000 20000 30000 40000 50000 60000 70000 80000 90000 100000
Pop
ulat
ion
0
5
10
15
20
25
30
35
40
45
0 10000 20000 30000 40000 50000 60000 70000 80000 90000 100000
Var
iety
Figure 3: Time series plots of population (total number of agents) and variety (number ofdistinct genomes) for run with probability of mutation equal to 0.005.
Evolutionary Computation Volume 8, Number 4 431

R. Smith and M. Bedau
0
20
40
60
80
100
0 10000 20000 30000 40000 50000 60000 70000 80000 90000 100000
Pop
ulat
ion
0
5
10
15
20
25
30
35
40
45
0 10000 20000 30000 40000 50000 60000 70000 80000 90000 100000
Var
iety
Figure 4: Time series plots of population (total number of agents) and variety (number ofdistinct genomes) for run with probability of mutation equal to 0.01.
432 Evolutionary Computation Volume 8, Number 4

Is Echo a Complex Adaptive System
the last combat spike, a genome with a 2-character combat condition arises. This makesthe population less susceptible to combat spikes, for combat can occur only if the combatcondition prefix matches the interaction tag but the interaction tag is only one characterlong. Thus the population stabilizes and repeats the familiar pattern as indicated by thegenomes below:
Born it mt ot dt cc tc mc a b c d tr #tr Die50212 b b dacc dad d b d c d d c d 8 6700050810 b d dacc dad cd b d c a d c d 8 6200050937 b b dacc dad cd b d c d d c d 8 6100051089 b b dacc dad cd b d c a d d d 8 6700051526 b b dacc dad cd b d b a d d d 8 6700054321 b b dbcc dad dd b d c d d c d 9 7100054631 b d dacc dad cd b d c d d c d 9 7200055858 b d dacc dbd cd b d c d d c d 9 7800055979 b b dacc dad dd b d c a d d d 9 9800057325 b b dacc dad cd b d c d d d d 9 7200058722 b b dacc ddd cd b d d a d b d 9 9800059150 b b dadc dad cd b d b a d d d 9 9600060714 b b dacc dad cd b d b d d d d 9 8900061400 b b dacc dad d b d c d d d d 9 8800063853 b d dacc dad cd b d b a d d d 9 9700064593 b b dacc dad dd b d d a d c d 9 8700064714 b d dacc dad cd b d c d d d d 10 10000068678 b b dacc dad dd b d b d d d d 10 100000
We can see a sort of arms race occurring in the offense and defense tags. The long tagsattained their final lengths by generation 30,000. These tags are used to determine theoutcome of a combat interaction as discussed in Section 3.4. Extra points are awarded inthe payoff calculation for the longer tag.
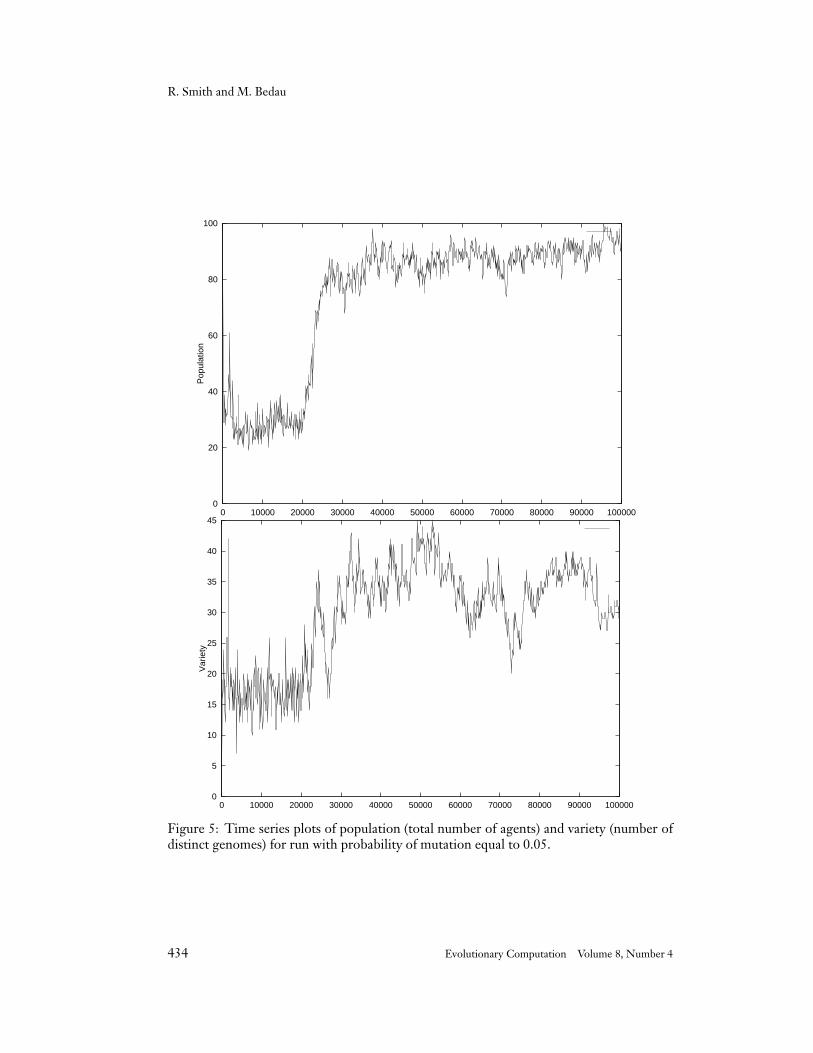
4.5 Probability of Mutation 0.05
The last run we analyze begins with a period of sustained combat and trading. Combatand trading alternate and even coexist up through roughly generation 4,000. At this pointgenomes with a zero length interaction tag take over. A zero length interaction tag canonly be matched by a zero length condition. Thus trading and combat do not take placeduring this period. No genome seems to get a foothold in this interactionless environment.At any given time slice the oldest genome has usually not been around for more than 500generations. Eventually, at generation 21,000, the population evolves genomes with a zerolength trading condition, and the familiar pattern resumes (see Figure 5). Sample genomesfrom throughout the run are given below:
Born it mt ot dt cc tc mc a b c d tr #tr Die943 d a ac ca a d d c b c d a 5 10001888 d a bb ac d c c a b da c d 4 20003887 b c bd abda d b b d dba ba c b 8 40008780 b dc ac d c a d bcb ba d a 4 900013713 bd cc d b b aac db a b 5 14000
Evolutionary Computation Volume 8, Number 4 433
R. Smith and M. Bedau
0
20
40
60
80
100
0 10000 20000 30000 40000 50000 60000 70000 80000 90000 100000
Pop
ulat
ion
0
5
10
15
20
25
30
35
40
45
0 10000 20000 30000 40000 50000 60000 70000 80000 90000 100000
Var
iety
Figure 5: Time series plots of population (total number of agents) and variety (number ofdistinct genomes) for run with probability of mutation equal to 0.05.
434 Evolutionary Computation Volume 8, Number 4
Is Echo a Complex Adaptive System
20493 bd dd d ab cca db d d 7 3100021184 bd dd d dc cca bb d d 7 3300022968 ad dd d ab cca db d d 7 3400023504 bd dd d dd cca bb d d 8 5000029883 ad dd d dd cca bb d d 8 5200030891 cd dd d ad dca bd b d 8 5400033614 cd dd d ad dca bd d d 9 6700045832 cd dd d ad dca ddc a d 9 8600062993 cd dd d ad dca ddc d d 10 100000
4.6 Robust Echo Behavior
What is interesting about the runs we have analyzed is the recurrence of a few robustbehavioral patterns. At the heart of each run is a simple trading ecology in which agentswith identical (or nearly identical) genomes all trade the same single resource. A successionof such trading ecologies dominates each run, and each succeeding genome incorporatesmore of the traded resource. Although the new genome may coexist with its predecessor fora while, eventually its predecessor goes extinct and at this point the population level rises.These simple trading ecologies can be decimated by a combat spike, and no genome persistsin a combat spike for very long. A combat spike is eventually broken when a genome thatcan avoid the combat arises, and this sets off another succession of trading ecologies.
5 Explanations of Echo’s Behavior
Resource flow, driven by trading, is behind most of Echo’s robust evolutionary dynamics.To understand these dynamics we must clarify how resources flow in Echo. We now brieflydigress to cover these details.
5.1 Echo’s Resource Flows
Resource flow in Echo is governed by six things: foraging, combat, trading, reproduction,taxes, and death. Agents can acquire resources from foraging. At each time step a fixedamount of resources is added to each site (20 units in these runs). Although the resourcesreleased by taxes and death are returned to a site, the present Echo implementation makesthese freed resources unavailable for foraging, so for all practical purposes it’s as if thoseresources did not exist. The length of an agent’s uptake mask for a given resource indicatesits facility at gathering that resource. So if all agents have the same length uptake mask, asin our runs, they are all equally successful foragers.
Agents can also acquire resources through combat and trading interactions. Whencombat occurs, the winning combatant ends up with all the resources in the losing com-batant. Trading is more complicated. Trading agents exchange the amount of the tradedresource in their reservoir over and above what they need to make a single copy of them-selves. When agents all trade the same resource, the average effect of trading is to equalizethe amount of the traded resource possessed by each agent in the population. When theinteraction fraction is high enough and when agents typically pass the trading interactiontest, virtually all 50 agents successfully trade (trading levels in our runs average about 50%).Under these circumstances, we can expect trading to distribute the traded resource relativelyevenly across the resource reservoirs in the population.
Evolutionary Computation Volume 8, Number 4 435

R. Smith and M. Bedau
0
0.2
0.4
0.6
0.8
1
0 10000 20000 30000 40000 50000 60000 70000 80000 90000 100000
Inte
ract
ions
CombatTrade
Figure 6: Time series plot of relative frequencies of combat and trading interactions in theworld reported on in Sections 4.3 and 5.2. Interactions are difficult to distinguish in thefigure because of the density of the trading frequency time series. Trading is the interactionat the 0.5 level, except for the period from roughly 45000 to 50000, a period of combat.
Reproduction dramatically affects resource flow in Echo. Agents are tested eachgeneration to see if they can replicate. In order to replicate, an agent must have enoughresources in its reservoir to make two copies of itself. When an agent replicates, it makesone copy of its genome for its child, and it divides the remaining resources in its reservoirwith its child. For example, an agent with 5 c’s in its genome needs 10 c’s in its reservoir toreplicate. It uses 5 of those c’s to create its child’s chromosome, and the 5 remaining c’s arethen divided between parent and child reservoirs: the child gets 2 c’s and the parent is leftwith 3.
Echo’s metabolic tax also has a dramatic effect on resource flow. At each time step eachagent can be served with a tax bill; the probability of receiving a tax bill is one of the worldparameters. In the runs studied here, this maintenance probability is 0.2, which means thatagents must pay a metabolic tax once every five generations, on average. When an agent iscalled upon to pay a metabolic tax, it is first tested to see if it has enough resources in itsreservoir to make one copy of its genome. If the agent passes this test, it pays the tax asspecified in the maintenance vector of the site file. For the worlds studied here, this tax isa single unit of each resource. On the other hand, if the agent fails this test, it immediatelydies. So metabolic tax is a very severe selection pressure. Agents cannot sustain theirmetabolism if they go very long without enough resources to copy their genome.
5.2 Probability of Mutation 0.005 Revisited
In order to understand the robust evolutionary dynamics we have observed in Echo, we willtake a more detailed look at one of the runs: the one with probability of mutation 0.005(recall Section 4.3). Looking more closely at the interactions and reservoir resource levels
436 Evolutionary Computation Volume 8, Number 4

Is Echo a Complex Adaptive System
0
10
20
30
40
50
60
0 10000 20000 30000 40000 50000 60000 70000 80000 90000 100000
Res
ervo
ir C
onte
nts
abcd
Figure 7: Time series plot of frequencies of each resource in an average agents reservoir,normalized by population level. Again, the time series are difficult to distinguish due totheir density. The lowest resource is the traded resource. In the first half of the run it is c.In the second half of the run it is d. See Section 5.2 for additional details.
will help illuminate what is happening.
Figure 6 shows the relative frequency of combat and trading interactions. Tradingis constant at the 0.5 level except during the period following the combat spike aroundgeneration 44000. We also see an earlier combat spike just before generation 20000, butit was not sufficiently intense to destroy the trading ecology. Recall that this run showedtwo distinct epochs separated by a combat spike. The first epoch was characterized by apopulation of agents that traded d’s. The bottom time series from generations 0 to 44000 isfor the resource d. The second epoch consists of a population that trades c’s. The bottomtime series from the period of roughly generation 48000 to the end of the run is for theresource c. The figure shows very clearly that the traded resource is driving the populationand is the limiting resource for this population. Also note that the traded resource timeseries contains much of the information that we see in the population time series for thisrun. The level of the traded resource increases at precisely those points at which a genomecontaining more of that resource takes over the population. (Since the resource level datais normalized by population level, we can be sure the resource level dynamics are not anartifact of changing population levels.)
Figure 7 shows the average level of each resource in the average agent’s reservoir.We sum the total resources in all the agents reservoirs for a given resource and then wenormalize (divide) by the population level. Because the sampling is so dense (every 10generations), it is difficult to distinguish the four time series in this plot, but the tradedresource is always the time series at the bottom of the plot. The time series for the otherthree resources are all clustered together above the time series for the traded resource.
A probabilistic analysis can reveal the adaptive advantage of those genomes with more
Evolutionary Computation Volume 8, Number 4 437
R. Smith and M. Bedau
of the traded resource. Consider two genomes from the latter half of this run — g50708and g53929, containing 5 and 6 units of the traded resource (c), respectively. And considerthe period from generation 57000 to 82000. We will analyze how a genome’s reproductionrate affects the selection pressure it feels from the process of metabolization. The essentialmechanism is that increasing the limited traded resource in a genome makes it harder foragents with that genome to reproduce, which allows agents with that genome to live longer,enabling that genome to support larger populations.
Note that during the epoch of the run in question, dominated by genome g50708(roughly generations 50000 to 62000), the population level averages about 65 agents, andthe frequency of the traded resource in the reservoir of the agents averages about 6.5. Inorder for an agent with genome g50708 to replicate, it will have to have 10 c’s in its reservoir,as described above. We know it will replicate as soon as it acquires the 10 c’s, since Figure 7shows that it has plenty of each of the other resources to replicate itself twice over. Since20 units of the traded resource are coming into the population at each time step, an agentwith genome g50708 will acquire a unit of the traded resource about every 3.25 generations.Since our agent needs 10 c’s to replicate, it will take, on average, about 13 generations toacquire the requisite resources if it does not trade during those 13 generations. Recall thattrading equalizes the level of the traded resource among agents. We know that a populationof agents with genome g50708 is only able to support a certain level of the traded resourceas shown in Figure 7. Thus an agent, on average, has to go 13 generations without tradingin order to replicate. We can determine the probability that an agent will not trade in a givencycle using a binomial distribution, since an agent’s probability of being picked to trade canbe viewed as a problem of sampling with replacement. Since 50% of the population isselected at random to trade at each time step, and each selected agent picks another agentto trade with at random, there will be 65 agents selected to trade (out of a population of 65)each time step. Note though that this is sampling with replacement. Using the binomialdistribution (and considering each generation a separate trial), we can roughly estimate thatthe probability of an average agent being selected to trade is 0.3707. Thus the probabilityof going 13 generations without trading in this population is (1� 0:3707)13 = 0:0024. Thismeans that the average agent in a population of agents with genome g50708 is likely toreproduce every 412 generations (1=0:0024 = 412). So, on average, an agent reproduces inthis population every 6.34 generations (412=65 = 6:34).
Once an agent with genome g50708 self replicates, as in our example given at the endof Section 5.1, it is left with 3 c’s in its genome and its child has 2. If the tax man comesaround soon, both parent and child are history. They will not be able to pass the test ofhaving the 5 c’s in their reservoirs necessary to reproduce their genome. Let us look athow difficult it is for an agent (or its progeny) from this population to survive after havingself replicated. Recall that, in this population, a recently self-replicated agent can expectto receive 1.5 c’s in a trade. This is because, on average, agents in this population have6.5 c’s in their reservoirs and 5 in their makeup. The average agent will give 1.5 c’s to theself replicated agent. The self replicated agent, on the other hand, won’t give away anyc’s since it doesn’t have enough in its reservoir to make a copy of itself. An agent in thispopulation can expect to trade 37% of the time (recall our binomial analysis) or about everythree generations. Also recall that an agent can expect to forage a single c in this populationevery 3.25 generations. The parent agent from the self replication needs to trade once andforage once before the tax man comes in order to get the amount of the traded resource inits reservoir up to the requisite 5 instances. The child agent from the self replication needsto either trade twice or trade once and forage twice. The tax man cometh, on average, 20%
438 Evolutionary Computation Volume 8, Number 4

Is Echo a Complex Adaptive System
of the time, or once every five generations.
A similar analysis for agents with genome g53929, i.e., agents with 6 c’s, shows that theaverage agent replicates every 1632 generations and that, on average, an agent replicatesevery 20.4 generations. Once replicated, both parent and child are left with 3 units of thetraded resource in their genomes. In a trade with an average agent from the population,the deficient agents can expect to receive 2.5 c’s. The analogous binomial analysis showsthat agents in this population can also expect to trade 37% of the time. They can expect toforage a c every four generations. The probability of getting hit with a metabolic tax is still20%. Though the calculations for figuring out the exact probability of an agent survivingself replication are difficult (involving several different scenarios), it is clear that it is nomore difficult to survive self replication in this population of agents with genome g53929then it is for agents from a population with genomes 50708. In fact, it seems more likelythat an agent will survive self replication in a population of agents with genome g53929.
Some analysis remains to be done to explain the transition from, for example, a pop-ulation of agents with genome g50708 to a population of agents with genome g53929. Itwould seem that, initially, an agent with genome g53929 would be at a disadvantage ina population of agents with genome g50708. An agent with genome g53929 would stillexpect to replicate approximately every 1600 generations, but it would be more difficultfor an agent with g53929 to build its reserves back up, since in a population of agents withg50708, it can only expect to receive 1.5 units of the traded resource in a trade. An agentwith g53929 needs to get its reserve of c’s up to 6 units whereas an agent with g50708 onlyneeds five units.
Finally, note that the frequency of the traded resource in the genome is completelycorrelated to population levels throughout all the runs presented in this paper (cf. populationlevels with frequency of the traded resource for the dominant genome). Genomes with 4units of the traded resource support average populations of 45-50 agents. Genomes with 5units of the traded resources support populations of 60-65 agents. 6 units supports 75-80agents, 7 units supports 80-85 agents, 8 units supports about 85-90 agents, and 9 unitssupports about 95 agents.
5.3 Summary
The mechanism we have uncovered in this run applies with equal generality to all the otherEcho runs. As the amount of the traded resource increases in the genome, agents with thatgenome don’t replicate as often, so they tend to live longer. Since they live longer, theycan acquire more of the limiting (traded) resource. Finally, if an agent does replicate, it isat least as likely if not more likely to get its reserves back up to the requisite level beforegetting wiped out prematurely by the metabolic tax. In the end, Echo’s robust evolutionarydynamics have a relatively simple if surprising explanation.
6 Echo is Not a Complex Adaptive System
Does Echo exemplify the features in Holland’s theory of complex adaptive systems? Tosome extent Echo does possess the mechanisms of tags, internal models, and building blocks,for they were put into the model by design. Echo agents are bestowed with external tagsthat facilitate selective interactions. They are also bestowed with a genetic structure thatserves as a tacit model of their environment. The fact that they interact through fighting,trading, and mating entails that they navigate and decompose their environment with those
Evolutionary Computation Volume 8, Number 4 439

R. Smith and M. Bedau
three building blocks. But none of this is very interesting, for two reasons: First, thesemechanisms were installed by fiat rather than emerging through the evolutionary process;second, we found no evidence that Echo agents built up complex adaptive structures throughthose capacities.
What about the remaining four properties that Holland thinks define complex adaptivesystems: non-linear behavior, aggregation, resource flows, and diversity? Echo certainlydoes exhibit non-linear behavior, but this is not surprising since non-linearity is ubiquitous inmodels of complex adaptive system. And resources obviously flow through Echo, althoughwe’ve seen that this flow is typically quite simple, consisting of everyone trading the sameresource or of the population being decimated through combat.
There is no evidence of the emergence of a diversity of hierarchically organized adaptiveaggregates. The only evident aggregations were simple trading ecologies and transitorycombat ecologies. Although the number of distinct genotypes grew with the mutationrate, this heterogeneity never created any significant diversity in behavior; it was genotypicdiversity without phenotypic diversity. All the populations evolved into simple tradingecologies. Even calling them “trading” ecologies is misleading since the interactions merelyequalized the distribution of a single resource. This lack of diverse adaptive aggregatesis a vital dissonance with Holland’s theory of CAS. Holland hoped Echo would generatesomething like the caterpillar, ant, fly ecology described in Section 3.4, but this dream nevermaterialized.
We have augmented the present work by seeing what happens when we vary a numberof key parameters, including the interaction fraction (number of interactions per time step),the maintenance probability (rate at which agents’ resources are taxed), and the number ofsites in the world. Although we have done detailed microanalysis of only a fraction of theseruns, we never saw any macro-level evidence for more interesting evolutionary dynamicsthan those described and explained here. (This is somewhat at odds with other publishedresults (Forrest and Jones, 1994; Hraber et al., 1997)). The macro-level dynamics vary inintensity but they show no qualitatively different dynamics. This makes us confident thatthe behaviors explained here typify what we can expect to see Echo generate. We concludethat Echo does not exemplify Holland’s theory of CAS.
This is not a drawback of Echo alone. Our conclusion about Echo parallels the absenceof unbounded evolutionary creativity noted in many other agent-based evolutionary models(Bedau et al., 1997, 1998). As far as we know, no present model actually has the features bywhich Holland characterizes complex adaptive systems.
7 The Next Step
If we are right that Echo is not a complex adaptive system, this should not be viewed as aset-back in the study of complex adaptive systems but as progress — progress made possibleonly because Echo was actually implemented and studied empirically. Specifically, we havelearned that we need another iteration of the hypothesis-test-revise methodology.
A few trivial revisions of the current implementation of Echo might make a differencein its behavior. Specifically, it would be interesting to see what happens when agents canforage for resources freed up through metabolic taxes and death, and when reproductionis blocked until both parent and child can survive the metabolic tax. It would also beinteresting to allow mating to coexist with combat and trading. But it’s far from clear
440 Evolutionary Computation Volume 8, Number 4

Is Echo a Complex Adaptive System
whether these changes would make diverse aggregations emerge in Echo. Perhaps Echo’sdynamics would be more likely to generate diverse aggregations if the creation of newgenomes caused the creation of new kinds of resources, but it is unclear how to implementthis idea in a sufficiently general way.
Our work here is an attempt to apply Holland’s hypothesize-test-revise methodologysimultaneously to Holland’s Echo model and to his general theory of complex adaptivesystems. We have treated Holland’s theory of CAS as a working hypothesis in the back-ground; in the foreground is the hypothesis that Echo is such a complex adaptive system.Empirical study of a working model is a constructive way to tell whether a given modelactually captures a given theory. An important virtue of Echo is precisely that it is such amodel. The problem is Echo fails to capture key features in Holland’s theory.
Echo’s failure to exemplify Holland’s theory of complex adaptive systems does notrepudiate the theory, of course, but it does underscore that we don’t fully grasp the theory.There are a number of significant unanswered questions about it. For example, it is notclear that the seven properties and mechanisms in the theory have an equal footing, northat they are independent, nor that they are all necessary. We ourselves are inclined tothink that what explains and unifies Holland’s seven features is the property of robust,open-ended emergence of hierarchical, adaptive structures. Furthermore, this propertymay well explain an eighth characteristic property of complex adaptive systems: the abilityof emergent interacting components to create and flexibly maintain their own boundariesand their capacities for interacting with other components. But these suggestions of oursat present are really just so many words. Concretely embodying them in some successormodel to Echo is the only way to make them precise and subject them to rigorous scrutiny.
Acknowledgments
Thanks to Carlo Maley, Norman Packard, Andreas Rechtsteiner, Emile Snyder, and theanonymous reviewers, for their direct and indirect contributions to this work. Thanks alsoto the Santa Fe Institute for support and hospitality while some of this work was completed.
A Parameters
All the Echo runs reported here were generated with exactly the same set of Echo modelparameters except that the mutation probability was varied. The full set of parameters isgiven here. Wild cards (*) indicate that particular parameters are to be chosen at random.
Agent Parameters
Name simple.agent Defense Tag *Init Rsrv 10 10 10 10 Mating Tag *Trad Rsrc * Comb Cond *Uptk Msk * * * * Trade Cond *Interac Tag * Mate Cond *Offense Tag *
Evolutionary Computation Volume 8, Number 4 441

R. Smith and M. Bedau
World Parameters Site Parameters
Name simple.world Name simple.siteTrad Frac 0.5 Mutate Prob [various]Interact Frac 0.5 InsrtDel Prob 0.02Self Repl Frac 0.5 CrsOv Prob 0.0Self Repl Thresh 2.0 RandDth Prob 0.0Maint Prob 0.2 Prod Func 20 20 20 20Neighborhood NONE InitRes Lev 20 20 20 20Rows 1 Maxima 1000 1000 1000 1000Columns 1 Maintenance 1 1 1 1# of Rsrcs 4 Agents simple.agent 100Comb Matr 1 1 1 1 0Comb Matr 1 1 1 1 0Comb Matr 1 1 1 1 0Comb Matr 1 1 1 1 0Comb Matr -1 -1 -1 -1 0Sites simple.site
References
Bedau, M. A. (1995). Three illustrations of artificial life’s working hypothesis. In Banzhaf, W. andEeckman, F., editors, Evolution and Biocomputation—Computational Models of Evolution. Springer-Verlag, Berlin, Germany.
Bedau, M. A., Snyder, E., Brown, C. T., and Packard, N. (1997). A comparison of evolutionaryactivity in artificial evolving systems and in the biosphere. In Husbands, P. and Harvey, I.,editors, Proceedings of the Fourth European Conference on Artificial Life, pages 125–134, MIT Press,Cambridge, Massachusetts.
Bedau, M. A., Snyder, E., and Packard, N. H. (1998). A classification of long-term evolutionarydynamics. In Adami, C., Belew, R., Kitano, H., and Taylor, C., editors, Artificial Life VI. MITPress, Cambridge, Massachusetts.
Forrest, S. and Jones, T. (1994). Modeling complex adaptive systems with echo. In Stonier, R. J.and Yu, X. H., editors, Complex Systems: Mechanisms of Adaptation. IOS Press, Amsterdam, TheNetherlands.
Holland, J. H. (1992). Adaptation in Natural and Artificial Systems: An Introductory Analysis withApplications to Biology, Control, and Artificial Intelligence. Second Edition. MIT Press, Cambridge,Massachusetts.
Holland, J. H. (1995). Hidden Order: How Adaptation Builds Complexity. Helix Books, Reading, Mas-sachusetts.
Holldobler, B. and Wilson, E. O. (1990). The Ants. Belknap Press of Harvard University Press,Cambridge, Massachusetts.
Hraber, P. T., Jones, T., and Forrest, S. (1997). The ecology of echo. Artificial Life, 3:165–190.
Jones, T. and Forrest, S. (1993). An introduction to sfi echo. Technical Report 93-12-074, Santa FeInstitute, Santa Fe New Mexico.
Packard, N. (1989). Intrinsic adaptation in a simple model for evolution. In Langton, C., editor,Artificial Life. Addison-Wesley, Reading, Massachusetts.
442 Evolutionary Computation Volume 8, Number 4