is russia sick with the dutch disease? - cepii - accueil · russia exhibited some symptoms of the...
TRANSCRIPT
No 2009 – 20 September
DO
CU
ME
NT
DE
TR
AV
AIL
Is Russia sick with the Dutch disease? _____________
Victoria Dobrynskaya & Edouard Turkisch

CEPII, WP No 2009-20 Is Russia sick with the Dutch disease?
2
TABLE OF CONTENTS
Non-technical summary ........................................................................................................... 3
Abstract .................................................................................................................................... 4
Résumé non technique ............................................................................................................. 6
Résumé court ............................................................................................................................ 7
Introduction .............................................................................................................................. 9
1. The reasons for exchange-rate targeting and the risk of a Dutch disease ..................... 12
2. Russian imports and exports and the international competitiveness ............................ 20
3. The Russian context ...................................................................................................... 25
Conclusion .............................................................................................................................. 26
References .............................................................................................................................. 28
List of working papers released by CEPII ............................................................................. 29
CEPII, WP No 2009-20 Is Russia sick with the Dutch disease?
3
IS RUSSIA SICK WITH THE DUTCH DISEASE?
NON-TECHNICAL SUMMARY
From 1999 until the 2008 financial crisis, the improvement of the economic situation in Russia was impressing. GDP growth averaged 7% per year in real terms, consumption increased and the unemployment rate steadily fell. This economic record was driven by rising resource prices that led to windfall gains of export revenues. There is, however, the fear that the Russian economy may become too dependent on the energy sector and not sufficiently diversified. This perceived risk influenced the monetary policy, which aimed at preventing the nominal appreciation of the rouble by accumulating foreign exchange reserves.
Many countries endowed with natural resources suffer from the Dutch disease. On the one hand, the increased profitability in the resource sector due to higher resource prices attracts labour and investments out of the manufacturing sector. Hence, the sectors linked to natural resources, as well as the services sector, for which the demand increases in response to higher income, become more attractive. On the other hand, the propagation of increases wage across all sectors as well as the increased demand for the domestic currency and the resulting appreciation of it make the manufactured goods more expensive and, hence, less competitive in the home and world markets. Both effects contribute to a de-industrialization process that makes the economy extremely dependent on the resource sector and may reduce the growth potential.
We study the economic performance of Russia between 1999 and 2007. Using Rosstat and CHELEM databases, we analyse the trends in production, wages and employment by sectors, as well as the trends in Russian exports and imports of manufactured products, and we put these data in perspective within the Russian context, which presents specificities that make the interpretation more difficult.
We find that Russia displayed some symptoms of the Dutch disease, in particular, the appreciation of the rouble in real terms from 1997 to 2007, the decrease in employment in manufacturing, and the rise in services sector. However, manufacturing production also increased, which contradicts the theory of the Dutch disease. Furthermore, the symptoms present in Russia could also have been driven by other factors. For instance, the appreciation of the rouble in real terms came partly from the Balassa-Samuelson effect, the quick growth of the services sector was partly due to the fact that it was not very developed during the Soviet times, and the outflow of employees from the manufacturing did not result in the inflow to the resource sector, but rather to the services sector.
The strong growth in industrial production despite the presence of some symptoms of the Dutch disease can be explained by different factors. First, a natural catching-up process after
CEPII, WP No 2009-20 Is Russia sick with the Dutch disease?
4
the de-industrialisation in the 1990s can explain partly the very high productivity gains in the industries, and hence, that the production of the manufacturing industries increased despite a significant decrease in employment. Second, Russian products did not particularly suffer from a loss of competitiveness. Despite the real appreciation of the rouble, the share of Russian manufactured exports in world trade has increased from 2001 to 2007. In particular, new market opportunities were developed in the European Union where Russian products remained competitive, and in other CIS countries, which did not have the sufficient industrial capacity to fit their internal demand and which were historically linked to Russia. We also observe that the Chinese demand for some Russian products increased. On the domestic market, the booming internal demand, supported by rising terms of trade and increasing export revenues, contributed to support domestic production. The rise in imports of manufactured goods in Russia mainly comes from sectors that either were not present in Russia before or suffered from the competition with the growing Chinese production. Third, whereas investments in “strategic sectors” (in particular in the energy sector and in the bank/insurance area) were subject to restrictions, investments in most manufacturing industries were largely encouraged, and the investment environment in these sectors improved significantly. Hence, thanks to high skills and relatively low costs of production in the Russian labour market, many investments flowed to manufactured industries in Russia.
From 1999 to 2007, these factors outweighed the negative effects of the real appreciation of the rouble. However, even if one leaves aside the consequences of the international economic slowdown in 2008, there is still the risk that the situation may change in the longer term because of increasing international competition.
In terms of monetary policy, since high inflation is a growing concern and since the rouble was appreciating in real terms despite the policy of prevention of nominal appreciation, the Russian Central Bank is going to switch from exchange-rate targeting to inflation targeting in the medium run, allowing the exchange rate to float more freely. The change in monetary policy targets is going slowly though as the Russian monetary policy is confronted to different interacting effects, accompanied by a lot of uncertainties and difficulties in evaluating the situation in the longer term.
ABSTRACT
Despite impressive economic growth between 1999 and 2007, there is a fear that Russia may suffer the Dutch disease, which predicts that a country with large natural resource rents may experience a de-industrialisation and a lower long term economic growth. We study whether there are symptoms of the Dutch disease in Russia. Using Rosstat and CHELEM databases, we analyse the trends in production, wages and employment in the Russian manufacturing industries, and we study the behaviour of Russian imports and exports. We find that, while Russia exhibited some symptoms of the Dutch disease, e.g. a real appreciation of the rouble, a rise in real wages, a decrease in employment in manufacturing industries and the development of the services sector, manufacturing production nonetheless increased, contradicting the

CEPII, WP No 2009-20 Is Russia sick with the Dutch disease?
5
theory of the Dutch disease. These trends can be explained by the gains in productivity and the recovery after the disorganisation in the 1990s, by new market opportunities for Russian products in the European Union and in CIS countries, by a growing Chinese demand for some products and by a booming internal market. Finally, investments in many manufacturing industries were largely encouraged, whereas those in the energy sector were strongly regulated, which contributed to economic diversification.
JEL classification: E23, E58, F43, P24.
Keywords : Russia, Dutch disease, competitiveness, monetary policy.
CEPII, WP No 2009-20 Is Russia sick with the Dutch disease?
6
LA RUSSIE SOUFFRE-T-ELLE DU SYNDROME HOLLANDAIS ?
RÉSUMÉ NON TECHNIQUE
De 1999 à la crise financière de 2008, la Russie a connu un redressement économique impressionnant, avec une croissance moyenne du PIB réel de 7% par an et une baisse continue du chômage. Ce redressement a été favorisé par la hausse des revenus liés aux exportations d’hydrocarbures. Cependant, on peut craindre que l’économie russe ne devienne trop dépendante du secteur énergétique et non suffisamment diversifiée. Cette crainte a influencé la politique monétaire, qui a cherché à modérer l’appréciation nominale du rouble en accumulant des réserves en devises.
De nombreux pays disposant de ressources naturelles abondantes souffrent du syndrome hollandais. D’une part, au sein de l’économie nationale, les perspectives de forte rentabilité dans le secteur des ressources naturelles rendent les secteurs manufacturiers moins attrayants pour la main-d’œuvre et les investissements relativement aux secteurs liés aux ressources naturelles et aux services, dont la demande progresse. D’autre part, la propagation de la hausse des salaires à l’ensemble de l’économie, ainsi que l’appréciation de la monnaie (résultant de fortes entrées de devises) rendent les industries nationales moins compétitives. Ces facteurs conduisent à une progressive désindustrialisation qui accuse la dépendance de l’économie à l’égard des ressources naturelles et peut conduire à une croissance de long terme plus faible.
Nous étudions ici le cas de la Russie, de 1999 à 2007. Nous analysons l’évolution de la production, des salaires et de l’emploi par secteurs d’activité, ainsi que les évolutions des exportations et importations russes de produits manufacturés. Nous replaçons ces évolutions dans la perspective des singularités du contexte russe: désorganisation des années 1990s, transition économique, changements de partenaires commerciaux, implication de l’Etat dans l’économie.
Nous trouvons que la Russie présente bien quelques-uns des symptômes du syndrome hollandais : le rouble s’est apprécié en termes réels de façon nette entre 1999 et 2007, l’emploi dans le secteur manufacturier a significativement baissé et les services se sont fortement développés. Il n’en demeure pas moins que la production manufacturière a fortement progressé et que l’économie russe ne semble pas avoir souffert d’un défaut de compétitivité. De plus, les symptômes qui semblent révéler un syndrome hollandais peuvent, en réalité, provenir d’autres facteurs. L’appréciation réelle du rouble vient en partie de l’effet Balassa-Samuelson. De même, le développement rapide des services peut s’expliquer par le fait qu’ils étaient peu développés du temps de l’Union soviétique. L’emploi sortant des industries manufacturières ne s’est pas déplacé vers le secteur énergétique, mais plutôt vers les services.

CEPII, WP No 2009-20 Is Russia sick with the Dutch disease?
7
La forte croissance de la production industrielle malgré la présence de certains symptômes du syndrome hollandais peut s’expliquer par plusieurs facteurs. Tout d’abord, un rattrapage naturel après la désindustrialisation des années 1990 peut expliquer en partie les forts gains de productivité, et donc que la production dans les industries manufacturières ont augmenté malgré la baisse significative de l’emploi. Ensuite, les produits russes n’ont globalement pas souffert d’une perte de compétitivité. Malgré l’appréciation du rouble, la part des exportations russes de produits manufacturés sur le marché mondial a augmenté. En particulier, de nouveaux marchés se sont développés en Union européenne (où les produits russes restent compétitifs), dans les autres pays de la CEI (qui n’ont pas la capacité de production pour satisfaire leur demande interne et qui sont historiquement liés à la Russie) ; la demande chinoise pour certains produits russes s’est également développée. Sur le marché national, l’explosion de la demande interne, soutenue par l’amélioration des termes de l’échange et la hausse des revenus des exportations, a contribué à soutenir la production. L’augmentation des importations vient surtout de secteurs qui n’étaient pas présents en Russie auparavant, ou qui ont souffert de la concurrence chinoise. Finalement, les investissements dans la plupart des secteurs manufacturiers ont été largement encouragés et les conditions d’investissement dans ces secteurs se sont améliorées. Ainsi, beaucoup d’investissements ont pu être réalisés dans les industries manufacturières pour tirer parti d’une main-d’œuvre qualifiée et de coûts de production relativement faibles. Entre 1999 et 2007, ces facteurs positifs ont contrebalancé les effets de l’appréciation réelle du rouble.
Cependant, étant donné que l’inflation est considérée comme de plus en plus problématique et que le rouble s’est apprécié en termes réels malgré la politique de prévention de l’appréciation nominale, la Banque centrale russe réfléchit à passer, à moyen terme, d’une politique de ciblage du taux de change à une politique de ciblage de l’inflation. Les changements sont lents, car la politique monétaire russe est confrontée à beaucoup d’incertitudes quant aux évolutions de long terme.
RÉSUMÉ COURT
En dépit d’une croissance économique impressionnante entre 1999 et 2007, on peut craindre que l’économie russe ne souffre du syndrome hollandais qui prédit aux économies disposant de rentes liées aux ressources naturelles une désindustrialisation et une croissance de long terme plus faible que les économies sans ressources naturelles. Nous cherchons à identifier les symptômes d’un syndrome hollandais en Russie. A partir des bases de données de Rosstat et de la base CHELEM du CEPII, nous analysons l’évolution de la production, des salaires et de l’emploi dans les différents secteurs d’activité ainsi que l’évolution des exportations et importations de produits manufacturés. Nous trouvons que la Russie manifeste certains symptômes du syndrome hollandais : appréciation réelle du rouble, hausse des salaires réels, baisse de l’emploi dans le secteur manufacturier, développement accéléré des services. Cependant, la production manufacturière a également progressé, ce qui contredit la théorie du syndrome hollandais. Cette progression s’explique en particulier par les gains de productivité et le rattrapage après la désorganisation des années 1990, par des nouveaux débouchés pour

CEPII, WP No 2009-20 Is Russia sick with the Dutch disease?
8
les produits russes dans l’Union européenne et dans les autres pays de la CEI, par la hausse de la demande chinoise pour certains produits et par le très fort développement du marché intérieur. De plus, les investissements ont été largement encouragés dans l’industrie manufacturière.
Classification JEL : E23, E58, F43, P24. Mots clefs : Russie, syndrome hollandais, compétitivité, politique monétaire.

CEPII, WP No 2009-20 Is Russia sick with the Dutch disease?
9
IS RUSSIA SICK OF THE DUTCH DISEASE?
Victoria Dobrynskaya1 and Edouard Turkisch2 3
INTRODUCTION
The economic record of Russia can appear surprising in many aspects. After the 1990s, marked by disorganization of the economy and the crisis of 1998, the macroeconomic stabilization and the improvement of the economic situation have been impressive. From 1999 until the financial crisis of 2008, GDP growth averaged 7% per year in real terms, while consumption was also increasing, and the unemployment rate was steadily falling (Figure 1). Despite a slowdown of the economy related to the international crisis, GDP is expected to grow again from 2010. 4
Figure 1: Rates of GDP growth and unemployment
0
2
4
6
8
10
12
14
1999 2000 2001 2002 2003 2004 2005 2006 2007
(%)
Real GDP growth rate Unemployment rate
Source: Rosstat.
1 Center for Advanced Studies of Higher School of Economics, Moscow, and London School of Economics,
[email protected] 2 University Paris-Ouest – Nanterre la Défense (Paris X) and French Treasury, [email protected]
3 This research was started while Victoria Dobrynskaya was a visiting researcher at CEPII. We are indebted to Agnès
Bénassy-Quéré and Michel Fouquin for their useful comments and suggestions. 4 Sources: IMF and OECD forecasts.

CEPII, WP No 2009-20 Is Russia sick with the Dutch disease?
10
One of the factors that contributed to such an improvement is the situation in the world market for natural resources. After a plunge in 1997-1998, the crude oil price showed a significant upward trend with the resulting increase from 10 to 100 US dollars per barrel between 1999 and 2007. Since then, the price has been highly volatile, but it still remains significantly higher than at the beginning of the 2000s.
For Russia, this generated a windfall rise in export revenues and a huge inflow of ‘petrodollars’. This created an upward pressure on the domestic currency and, therefore, over the last years the main goal of the Russian monetary policy was to prevent the nominal appreciation of the rouble. Vdovichenko and Voronina (2004) found empirically that after 1999, the major efforts of the Bank of Russia were aimed at affecting the exchange rate smoothness and level, rather than the inflation rate. 5 Moreover, as claimed by Dobrynskaya (2008), monetary policy in Russia was asymmetric, with appreciations smoothed while depreciations were accommodated. The Central Bank of Russia itself admitted officially in its policy guidelines that over the recent years it “constrained rouble appreciation in order to help maintain the competitiveness of Russian goods on international and domestic markets” and that “the policies of the Bank of Russia and the Ministry of Finance (the administrator of the stabilization fund) throughout the period 2000-2005 kept the rouble’s value 8.5% cheaper than its equilibrium value”.6
In order to prevent the appreciation of the rouble against a basket of currencies7, the Central Bank of Russia accumulated foreign currency reserves. The resulting growth in the money supply, although partially absorbed by the stabilization fund, contributed to high inflation in Russia. Moreover, as the US dollar was depreciating against the euro, to maintain the basket, the rouble depreciated against the euro in nominal terms. This contributed to imported inflation, as the Euro area is a major exporter to Russia. In recent years, such policy led to a large real appreciation of the rouble instead of nominal appreciation. This is illustrated in Figure 2, which presents the dynamics of the real and the nominal effective and bilateral exchange rate indices of the rouble until 2006 (normalized to 1 in January 1999).
5 The Bank of Russia relied mainly on monetary targeting. Vdovichenko and Voronina (2004) claim that this is a
consequence of underdevelopment and low efficiency of the Russian financial sector and banking system. 6 Central Bank of Russia, 2007. Many papers confirm the undervaluation of the rouble, which resulted from the policy
of the Central Bank of Russia. 7 The current composition of the basket is the following: 45% in US dollar, 45% in euro and 10% in pound
sterling.

CEPII, WP No 2009-20 Is Russia sick with the Dutch disease?
11
Figure 2: Exchange rate indices of the rouble
0,00
0,50
1,00
1,50
2,00
2,50
1999M1 2000M1 2001M1 2002M1 2003M1 2004M1 2005M1 2006M1 2007M1
neer reer USD/RUR EUR/RUR
Note: neer (nominal effective exchange rate) and reer (real effective exchange rate) are calculated as trade-weighted exchange rates. Source: International Financial Statistics.
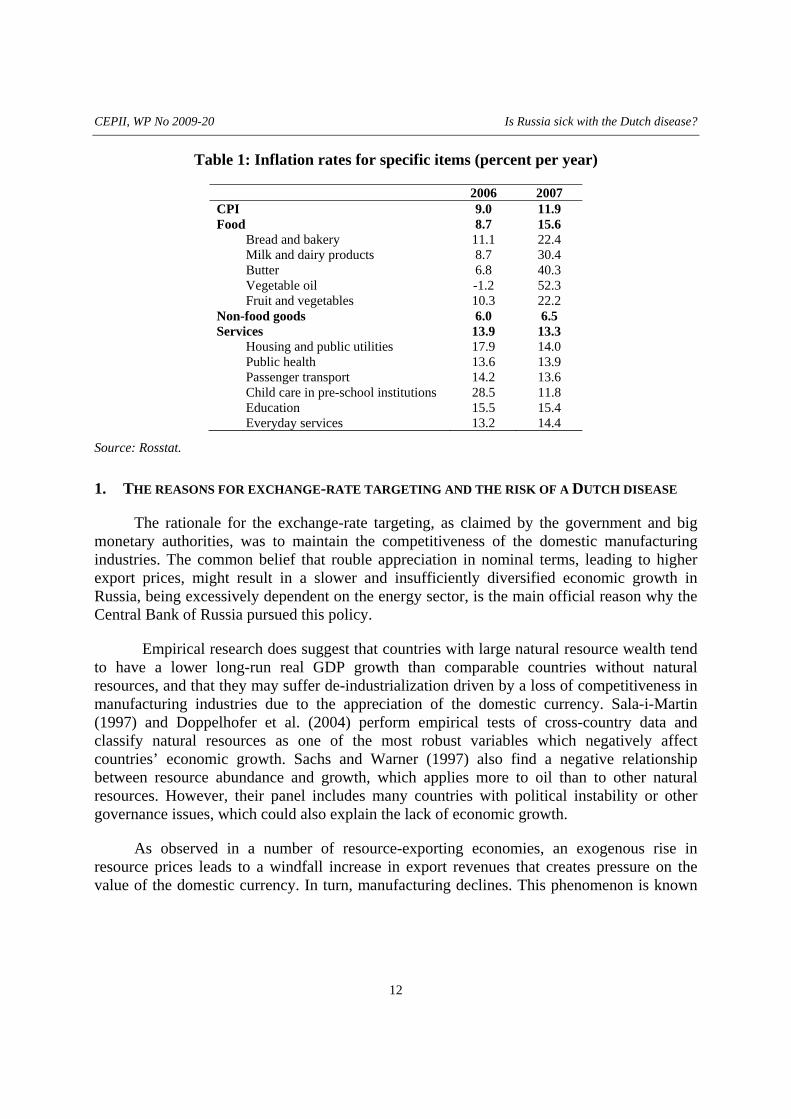
While the inflation target was set at 6.5-8% for 20078, the actual CPI inflation was 11.9%. It reached around 13.5% in 2008 and was expected to stay above 11% in 2009 despite the economic slowdown9. Moreover, if we look at the inflation level of particular food and service categories (Table 1), we can understand why there is so much debate about the recent monetary policy strategy.
8 The Central Bank sets the targets for inflation, but these targets are rarely met since the primary goal is the exchange
rate targeting. 9 Source: forecasts done by the Ministry of Finances of the Russian Federation as of December 2008.
CEPII, WP No 2009-20 Is Russia sick with the Dutch disease?
12
Table 1: Inflation rates for specific items (percent per year)
2006 2007 CPI 9.0 11.9 Food 8.7 15.6
Bread and bakery 11.1 22.4 Milk and dairy products 8.7 30.4 Butter 6.8 40.3 Vegetable oil -1.2 52.3 Fruit and vegetables 10.3 22.2
Non-food goods 6.0 6.5 Services 13.9 13.3
Housing and public utilities 17.9 14.0 Public health 13.6 13.9 Passenger transport 14.2 13.6 Child care in pre-school institutions 28.5 11.8 Education 15.5 15.4 Everyday services 13.2 14.4
Source: Rosstat.
1. THE REASONS FOR EXCHANGE-RATE TARGETING AND THE RISK OF A DUTCH DISEASE
The rationale for the exchange-rate targeting, as claimed by the government and big monetary authorities, was to maintain the competitiveness of the domestic manufacturing industries. The common belief that rouble appreciation in nominal terms, leading to higher export prices, might result in a slower and insufficiently diversified economic growth in Russia, being excessively dependent on the energy sector, is the main official reason why the Central Bank of Russia pursued this policy.
Empirical research does suggest that countries with large natural resource wealth tend to have a lower long-run real GDP growth than comparable countries without natural resources, and that they may suffer de-industrialization driven by a loss of competitiveness in manufacturing industries due to the appreciation of the domestic currency. Sala-i-Martin (1997) and Doppelhofer et al. (2004) perform empirical tests of cross-country data and classify natural resources as one of the most robust variables which negatively affect countries’ economic growth. Sachs and Warner (1997) also find a negative relationship between resource abundance and growth, which applies more to oil than to other natural resources. However, their panel includes many countries with political instability or other governance issues, which could also explain the lack of economic growth.
As observed in a number of resource-exporting economies, an exogenous rise in resource prices leads to a windfall increase in export revenues that creates pressure on the value of the domestic currency. In turn, manufacturing declines. This phenomenon is known

CEPII, WP No 2009-20 Is Russia sick with the Dutch disease?
13
as the Dutch disease (Box 1). 10 The fear that Russia may suffer the Dutch disease and the uncertainty concerning the possible impact of the rouble appreciation on production and employment in the domestic manufacturing sector are the main reasons for the significant foreign exchange interventions by the Russian Central Bank.
Box 1: The Dutch disease
According to the Rutherford dictionary of Economics, the Dutch disease may be described as “the harmful consequences for a national economy of discovering natural resources, especially the decline in traditional industries brought about by the rapid growth and prosperity of a new industry. The successful new industry has high exports, creating a foreign exchange surplus and raising the country’s exchange rate with the consequence that other industries of the economy become internationally uncompetitive” (Rutherford, 1992).
The following symptoms characterize the Dutch disease:
1. A rapid appreciation of the domestic currency, which results from increasing export revenues and, therefore, demand for the currency.
2. A rise in real wages in the economy. Increased profitability of the resource sector due to a rise in the resource prices pushes wages in this sector up. If labour is sufficiently mobile between sectors, the movement of labour towards the resource sector creates an upward pressure on wages in other sectors to restore the equilibrium.
3. A rise in the service sector. Windfall export revenues increase national income, which stimulates the demand for services.
4. A slow-down in industrial production. The increased productivity in the resource sector attracts labour and investments out of the manufacturing sector, since the natural resource sector provides higher rents and returns on investment. Also the rising services sector drains factors of production out of the non-resource tradable sector. All this results in higher costs of production (e.g. wages). Additionally, the domestic currency appreciation makes the manufactured goods more expensive and, hence, less competitive in the home and world markets. Both effects contribute to lower profitability and slower (or even negative) growth rate in the manufacturing sector. The resulting de-industrialization process (the shift of production towards the resource sector) makes the economy extremely dependent on the resource sector, which can reduce the growth potential.
This process can be seen as a “normal” economic specialization and as a natural economy’s adaptation. However, its overall effect on economic growth and employment can be negative. Moreover, in the longer term, a lack of economic diversification may lead to vulnerability and volatility of the economic activity and high dependency on world resource prices. Finally, natural resources are not infinite.
10
Ploeg and Poelhekke (2008) have another interpretation of the decrease in long-run growth in countries with large natural resources. They indicate that rather than the natural resource price level or trend, it is its volatility which could harm the long-run growth, because growth depends negatively on volatility of unanticipated output growth. Indeed, they find that the possible positive effects of resources on growth may often be swamped by the indirect negative effect through volatility. This issue is also relevant for Russia, given the high volatility of oil prices, which has even increased recently.

CEPII, WP No 2009-20 Is Russia sick with the Dutch disease?
14
Several papers have tried to determine whether Russia is sick with the Dutch disease. Although they find some symptoms of it, the disease cannot be confirmed (e.g. Oomes and Kalcheva, 2007). For countries in transition or which have faced recent structural changes, it could be even more difficult to analyse the symptoms of the Dutch disease. For instance, while the real appreciation of the rouble (Symptom 1 in Box 1) is obvious from the data and is somehow linked to the rising oil revenues (as it is confirmed empirically by Sosunov and Zamulin, 2006), there are other factors which might have contributed to such appreciation. In particular, the appreciation may be partially due to the rising domestic productivity relatively to trading partners (the Balassa-Samuelson effect). 11 Indeed, productivity gains have been large in Russia, in particular in the manufacturing sector. For instance, labour productivity in the manufacturing sector more than doubled between 1999 and 2007 in Russia (+114%), whereas labour productivity in the total economy increased by 15.4% in the United States and by 6.1% in the Euro area over the same period. 12
Furthermore, the hypothesis that rouble appreciation has affected the industrial production negatively yet needs to be confirmed. Indeed, in spite of the appreciation of the rouble in nominal terms, which is far less significant than in real terms though, the production in Russian manufacturing industries continued to grow significantly until mid-2008. Therefore, one should analyze whether the symptoms 2, 3, and 4 of the Dutch disease (Box 1) are present in Russia and also whether rouble appreciation is likely to harm the Russian economy in the future.
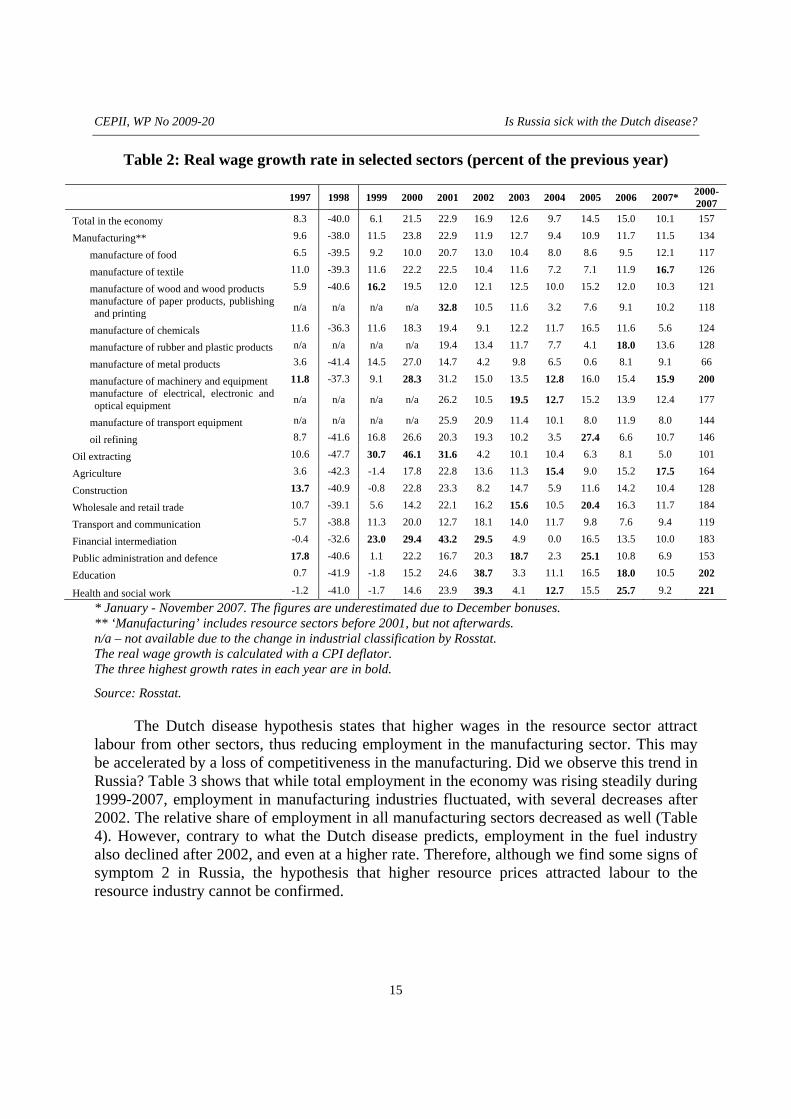
Symptom 2: A rise in real wages in the economy
Table 2 presents average yearly growth rates of real CPI-adjusted wages in different sectors of the Russian economy. The last column presents the overall growth rates during 2000-2007. We see that after a dramatic fall by 40% in the crisis year 1998 due to the unexpected inflation hike, real wages grew at a significant rate, averaging 14% per year between 1999 and 2007, compared to the 7% average growth rate of real GDP. When oil prices started rising in 1999-2000 the highest wage growth was unsurprisingly observed in the oil extracting industry. The finance industry was the second leader at that time. Then wages in other sectors started to adjust. As a result, the highest total growth rates during 2000-2007 were observed in the manufacture of machinery and equipment, agriculture, trade, financial intermediation, education, health and social work sectors, catching-up with the finance and oil sectors.
11
For example, Gurvich and Sokolov (2008) estimated that approximately two thirds of the real appreciation of the rouble against euro is due to the Balassa-Samuelson effect. 12
Sources: OECD, authors’ calculation.
CEPII, WP No 2009-20 Is Russia sick with the Dutch disease?
15
Table 2: Real wage growth rate in selected sectors (percent of the previous year)
1997 1998 1999 2000 2001 2002 2003 2004 2005 2006 2007* 2000-2007
Total in the economy 8.3 -40.0 6.1 21.5 22.9 16.9 12.6 9.7 14.5 15.0 10.1 157
Manufacturing** 9.6 -38.0 11.5 23.8 22.9 11.9 12.7 9.4 10.9 11.7 11.5 134
manufacture of food 6.5 -39.5 9.2 10.0 20.7 13.0 10.4 8.0 8.6 9.5 12.1 117
manufacture of textile 11.0 -39.3 11.6 22.2 22.5 10.4 11.6 7.2 7.1 11.9 16.7 126
manufacture of wood and wood products 5.9 -40.6 16.2 19.5 12.0 12.1 12.5 10.0 15.2 12.0 10.3 121 manufacture of paper products, publishing and printing n/a n/a n/a n/a 32.8 10.5 11.6 3.2 7.6 9.1 10.2 118
manufacture of chemicals 11.6 -36.3 11.6 18.3 19.4 9.1 12.2 11.7 16.5 11.6 5.6 124
manufacture of rubber and plastic products n/a n/a n/a n/a 19.4 13.4 11.7 7.7 4.1 18.0 13.6 128
manufacture of metal products 3.6 -41.4 14.5 27.0 14.7 4.2 9.8 6.5 0.6 8.1 9.1 66
manufacture of machinery and equipment 11.8 -37.3 9.1 28.3 31.2 15.0 13.5 12.8 16.0 15.4 15.9 200 manufacture of electrical, electronic and optical equipment n/a n/a n/a n/a 26.2 10.5 19.5 12.7 15.2 13.9 12.4 177
manufacture of transport equipment n/a n/a n/a n/a 25.9 20.9 11.4 10.1 8.0 11.9 8.0 144
oil refining 8.7 -41.6 16.8 26.6 20.3 19.3 10.2 3.5 27.4 6.6 10.7 146
Oil extracting 10.6 -47.7 30.7 46.1 31.6 4.2 10.1 10.4 6.3 8.1 5.0 101
Agriculture 3.6 -42.3 -1.4 17.8 22.8 13.6 11.3 15.4 9.0 15.2 17.5 164
Construction 13.7 -40.9 -0.8 22.8 23.3 8.2 14.7 5.9 11.6 14.2 10.4 128
Wholesale and retail trade 10.7 -39.1 5.6 14.2 22.1 16.2 15.6 10.5 20.4 16.3 11.7 184
Transport and communication 5.7 -38.8 11.3 20.0 12.7 18.1 14.0 11.7 9.8 7.6 9.4 119
Financial intermediation -0.4 -32.6 23.0 29.4 43.2 29.5 4.9 0.0 16.5 13.5 10.0 183
Public administration and defence 17.8 -40.6 1.1 22.2 16.7 20.3 18.7 2.3 25.1 10.8 6.9 153
Education 0.7 -41.9 -1.8 15.2 24.6 38.7 3.3 11.1 16.5 18.0 10.5 202
Health and social work -1.2 -41.0 -1.7 14.6 23.9 39.3 4.1 12.7 15.5 25.7 9.2 221
* January - November 2007. The figures are underestimated due to December bonuses. ** ‘Manufacturing’ includes resource sectors before 2001, but not afterwards. n/a – not available due to the change in industrial classification by Rosstat. The real wage growth is calculated with a CPI deflator. The three highest growth rates in each year are in bold.
Source: Rosstat.
The Dutch disease hypothesis states that higher wages in the resource sector attract labour from other sectors, thus reducing employment in the manufacturing sector. This may be accelerated by a loss of competitiveness in the manufacturing. Did we observe this trend in Russia? Table 3 shows that while total employment in the economy was rising steadily during 1999-2007, employment in manufacturing industries fluctuated, with several decreases after 2002. The relative share of employment in all manufacturing sectors decreased as well (Table 4). However, contrary to what the Dutch disease predicts, employment in the fuel industry also declined after 2002, and even at a higher rate. Therefore, although we find some signs of symptom 2 in Russia, the hypothesis that higher resource prices attracted labour to the resource industry cannot be confirmed.

CEPII, WP No 2009-20 Is Russia sick with the Dutch disease?
16
Table 3: Growth rate of employment by sector (percent of the previous year)
1999 2000 2001 2002 2003 2004 2005 2006 2007Total in the economy 0,2 0,6 0,6 1,0 -0,2 0.4 0.8 0.6 0.8 Manufacturing* 1,0 1,7 1,0 -1,1 -2,7 -1.5 -1.1 -1.3 0.2 Mining and quarrying n/a n/a n/a n/a n/a n/a -2.0 -0.8 -0.5 Oil extraction -9.7 2.3 30.0 -4.6 -3.0 -8.7 n/a n/a n/a Oil refining -5.8 0.0 -1.8 -6.3 -2.9 1.0 n/a n/a n/a Coal -8.7 -4.9 -1.1 -5.3 -7.5 -6.4 n/a n/a n/a Electricity, gas and water supply n/a n/a n/a n/a n/a n/a 0.7 0.6 -1.1 Energy 4.5 3.8 3.2 -1.5 -3.8 -2.8 n/a n/a n/a Gas 9.1 3.3 6.4 6.1 2.9 4.2 n/a n/a n/a Agriculture -2,6 -1,5 -5,2 -3,2 -4,5 -5.8 -4.3 -3.3 -5.4 Construction -0,2 -1,6 0,3 -0,7 0,5 1.2 4.4 3.2 3.8 Wholesale and retail trade 0,1 1,1 6,1 8,4 2,7 2.5 3.2 2.1 4.1 Transport and communication 1,4 1,9 0,1 0,1 0,8 0.0 0.1 1.1 0.2 Financial intermediation 1,1 -0,3 6,1 3,7 6,6 5.1 6.5 11.7 9 Public administration and defence 2,9 2,3 -1,5 3,0 0,5 3.1 2.6 1.3 1.3 Education 0,3 -1,1 -0,2 0,5 0,7 2.0 0.9 -0.5 -0.3 Health and social work 0,9 0,2 0,6 1,3 0,9 2.3 0.6 0.6 0.3
* ‘Manufacturing’ includes resource sectors before 2005, but not afterwards. n/a – not available due to the change in industrial classification by Rosstat.
Source: Rosstat.
Table 4: Distribution of employment across sectors (percent of the total)
1998 2001 2004 2007
Total in the economy 100 100 100 100 of which
Manufacturing
22.2
22.7
22.1
21.1 Including: Mining and quarrying n/a n/a 1.6 1.5 Electricity, gas and water supply n/a n/a 2.9 2.8 Agriculture 13.7 12.3 11.2 10.0 Construction 8.0 7.8 7.1 7.8 Wholesale and retail trade 14.6 15.4 16.3 17.4 Transport and communication 7.6 7.8 8.0 8.0 Financial intermediation 1.1 1.2 1.3 1.6 Public administration and defence 4.4 4.5 5.2 5.2 Education 9.3 9.0 9.2 8.9 Health and social work 7.0 7.0 6.8 6.8 Other sectors 12.1 12.3 12.8 13.2
n/a – not available due to the change in industrial classification by Rosstat. Source: Rosstat.

CEPII, WP No 2009-20 Is Russia sick with the Dutch disease?
17
Symptom 3: A rise in the services sector
The observed contraction of the manufacturing employment despite the increased total employment in the economy can be explained by the fact that workers moved to services sector, with the finance, trade and construction sectors in the first place (Tables 3 and 4), which offered relatively higher wages during that time. Although this is in line with the Dutch disease, there are several other potential explanations for such trend. First, there was a focus on industries and not on services during the Soviet times. Therefore, the services sector was relatively underdeveloped and has expanded significantly since mid-90s. Second, the technological renovation and advancement in the manufacturing sector might have led to reduced demand for labour in this sector. Third, it has become prestigious to work in the services sector, especially in finance. Therefore, although we can observe symptom 3 of the Dutch disease, the expansion in the services sector did not only result from the rising export revenues and social welfare.
One can also mention that employment in public administration and defence largely increased after 1995, especially in 1995 and 1996, despite the relatively low level of pay compared to the private sector. This was due in particular to the expansion of the government at regional levels, where the level of wages in the civil services was not so unfavourable compared to the private sector. Some studies (for instance World Bank, 2003, 2006) argue that regional governments hired staff partly in order to fight unemployment (in particular during the economic disorganisation in the 1990s), but also mainly because they considered having not enough staff. These studies show indeed that the level of employment in public administration and defence remains relatively low in Russia compared to OECD countries. Nevertheless, as total employment in the economy increased and as the increase in employment in public administration occurred mostly before 1998, the latter cannot be easily related to the Dutch disease.
Symptom 4: A slow-down in industrial production
From 1999 and until the financial crisis of 2008 and the possible effects of the world economic slowdown, manufacturing output was growing in spite of the outflow of labour from the manufacturing sector. This sector even outperformed services and oil extracting sectors, as indicated in Figure 3.

CEPII, WP No 2009-20 Is Russia sick with the Dutch disease?
18
Figure 3: Production growth rates in different sectors
-15%
-10%
-5%
0%
5%
10%
15%
1998 1999 2000 2001 2002 2003 2004 2005 2006 2007
Manufacturing* Oil extracting Agriculture Services
* ‘Manufacturing’ includes resource sectors before 2001, but not afterwards. Source: Rosstat.
Table 5 shows production growth rates by industry, where the growth rates of the three leading industries each year are marked in bold. We see that the oil extracting industry was among the leaders only once and the services sector only twice from 1999 to 2007, while the fastest growth was constantly observed in some manufacturing industries, in particular in manufacturing of rubber and plastic, machinery and all types of equipment. Also, the average yearly growth rate in overall manufacturing during 1999-2007 was higher than that of oil extracting, agriculture and services (7.4%, 4.9%, 3.8% and 6.1% respectively). While in the early 2000’s, there was a slowdown in the growth rate of the industrial production in Russia, the trend reversed between 2003 and 2008, with the acceleration in growth of the manufacturing production. However, at the same time, growth in the extraction industry decreased further, contradicting the theory of the Dutch disease. We can conclude that although there was an outflow of labour from the manufacturing and resource sectors towards services, there was a significant expansion in the manufacturing production with no sign of absolute or relative de-industrialization. Hence, we do not find sufficient evidence of symptom 4 of the Dutch disease.

CEPII, WP No 2009-20 Is Russia sick with the Dutch disease?
19
Table 5: Real production growth rate in selected sectors (percent of the previous year)
1998 1999 2000 2001 2002 2003 2004 2005 2006 2007 1999-
2007*
Manufacturing -5 11 12 2 1.2 10.3 10.5 5.8 4.4 9.3 7.4 manufacture of food 0.8 4 14 8.1 7.1 7 4.4 4.4 5.4 6.1 6.7 manufacture of textile -10 12 21 7.7 -2.4 1.2 -4 -1.7 7.2 -0.3 4.5 manufacture of wood and wood products 0.4 18 13 -2.4 4.1 9.7 8.6 4.4 0.4 6.2 6.9 manufacture of paper products, publishing and printing n/a n/a n/a 9.6 4 7.8 5.1 1.2 6.4 9 6.2 manufacture of chemicals -7 24 15 0.3 0.1 5.4 6.6 2.5 1.9 6.1 6.9 manufacture of rubber and plastic products n/a n/a n/a 1.5 0.2 5.4 13.5 5.5 11.7 23 8.7 manufacture of metal products -8 17 16 4.6 5.2 7.2 3.9 5.7 8.8 2 7.8 manufacture of machinery and equipment -7 17 20 6.5 -8.7 19.1 21.1 0 3.3 19.3 10.8 manufacture of electrical, electronic and optical equipment n/a n/a n/a 8.4 -7.7 43.3 34.5 20.7 -5.5 12.8 15.2 manufacture of transport equipment n/a n/a n/a -26.4 -1 14 11.6 6.1 3.3 15.9 3.4 oil refining -7 2 2 2.8 4.5 2.2 2.4 5.5 6 2.7 3.3
Oil extracting -1 0.5 6 6.1 7.3 10.3 7.7 1.8 2.5 1.9 4.9 Agriculture -13.2 4.1 7.7 7.5 1.5 1.3 3.1 2 3.6 3.3 3.8
Services -1 7 5 1.6 3.7 6.6 8.4 7.5 7.9 7.1 6.1 * the average yearly growth rate during 1999-2007. n/a – not available due to the change in industrial classification by Rosstat in 2000. ‘Manufacturing’ includes resource sectors before 2001, but not afterwards. Source: Rosstat.
In sum, from 1999 to 2007, positive factors, such as productivity catch-up, outweighed the possible effects of the Dutch disease. However, the question remains whether industrial growth could have been less pronounced had the Central Bank of Russia not limited the nominal appreciation of the rouble. The issue whether there is a potential threat of de-industrialization if the exchange rate allowed to float freely is also important for the future of Russia. This question is not easy to answer, as trading off nominal appreciation for inflation can produce similar effects on the international competitiveness.13 To shed some light on this issue we now look at the behaviour of Russian exports and imports.
13
No matter whether the nominal exchange rate of the rouble appreciates or the domestic price of Russian products goes up due to inflation, the export price will rise as NERPP ⋅=* , where P* is the export price in foreign currency and P is the domestic price in roubles. Therefore, it is the real exchange rate that affects the competitiveness of Russian products, and not the nominal exchange rate. Hence, it is possible that the policy of restricting the nominal appreciation of the rouble would not, in fact, have “saved” the competitiveness of domestic industries.
CEPII, WP No 2009-20 Is Russia sick with the Dutch disease?
20
2. RUSSIAN IMPORTS AND EXPORTS AND THE INTERNATIONAL COMPETITIVENESS
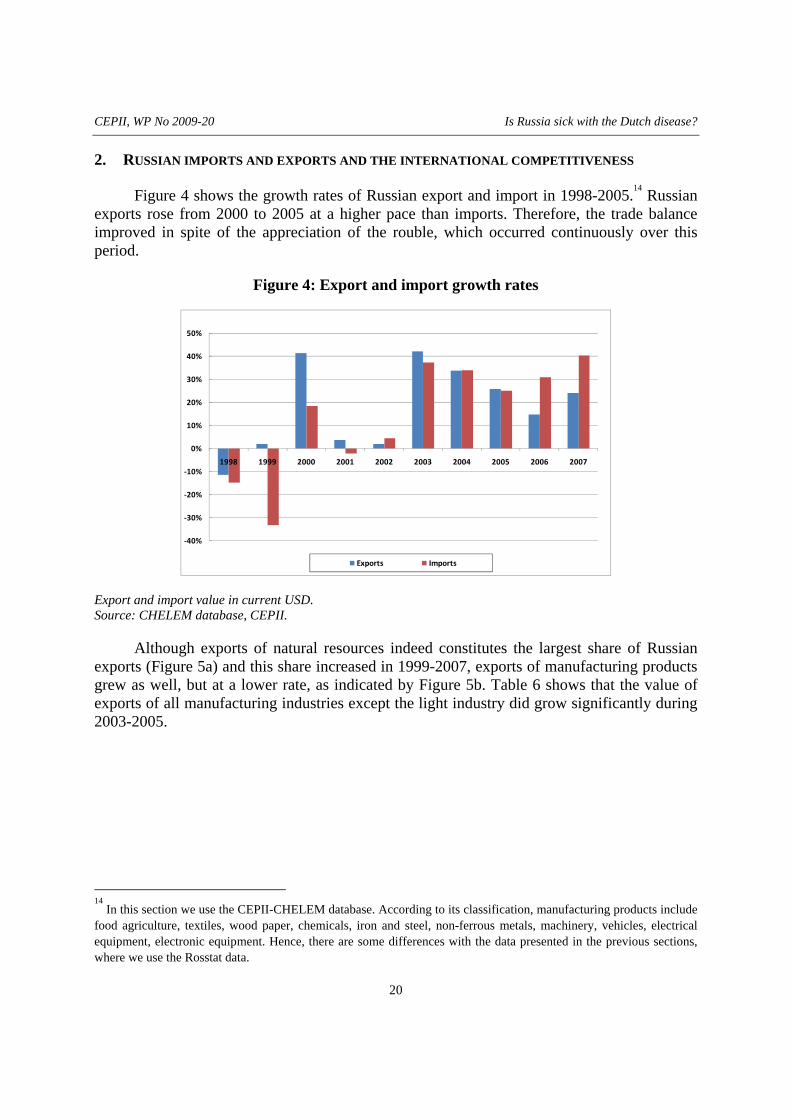
Figure 4 shows the growth rates of Russian export and import in 1998-2005.14 Russian exports rose from 2000 to 2005 at a higher pace than imports. Therefore, the trade balance improved in spite of the appreciation of the rouble, which occurred continuously over this period.
Figure 4: Export and import growth rates
‐40%
‐30%
‐20%
‐10%
0%
10%
20%
30%
40%
50%
1998 1999 2000 2001 2002 2003 2004 2005 2006 2007
Exports Imports
Export and import value in current USD. Source: CHELEM database, CEPII.
Although exports of natural resources indeed constitutes the largest share of Russian exports (Figure 5a) and this share increased in 1999-2007, exports of manufacturing products grew as well, but at a lower rate, as indicated by Figure 5b. Table 6 shows that the value of exports of all manufacturing industries except the light industry did grow significantly during 2003-2005.
14
In this section we use the CEPII-CHELEM database. According to its classification, manufacturing products include food agriculture, textiles, wood paper, chemicals, iron and steel, non-ferrous metals, machinery, vehicles, electrical equipment, electronic equipment. Hence, there are some differences with the data presented in the previous sections, where we use the Rosstat data.

CEPII, WP No 2009-20 Is Russia sick with the Dutch disease?
21
Figure 5: The shares and the growth rates of Russian exports of resources and manufacturing products
a. Breakdown of exports b. Growth rates of exports of resources and manufacturing products
0%
10%
20%
30%
40%
50%
60%
70%
80%
90%
100%
1995 1996 1997 1998 1999 2000 2001 2002 2003 2004 2005 2006 2007
share of manufacturing in all exports
share of resources and electricity in all exports
‐30%
‐20%
‐10%
0%
10%
20%
30%
40%
50%
60%
70%
1998 1999 2000 2001 2002 2003 2004 2005 2006 2007
resources and electricity manufacturing
Export value in current USD. Source: CHELEM database, CEPII.
Table 6: Export growth in manufacturing industries (percent of the previous year)
1998 1999 2000 2001 2002 2003 2004 2005 Food agriculture -5 2 12 6 19 11 14 20 Textiles -4 -5 31 7 8 23 -2 -31 Wood paper -8 4 34 -1 -2 12 21 9 Chemicals -8 2 19 0 1 25 30 17 Iron and steel -12 -13 24 -13 11 38 75 17 Non-ferrous metals -4 6 47 -24 -24 18 36 5 Machinery 18 -10 11 36 -8 22 -6 4 Vehicles -8 -18 19 7 26 12 30 20 Electrical equipment -11 -17 21 24 7 15 32 1 Electronic equipment -16 4 2 13 -13 22 25 -5
Export value in current USD. Source: CHELEM database, CEPII.
However, as world trade also increased over this period, it is necessary to analyse further whether Russian exports grew in line with the world trade or suffered a loss of competitiveness. As shown below, whereas Russian products remained competitive on international markets, the situation appears more mixed on the domestic market, where some categories of foreign manufacturing products were increasingly demanded.
CEPII, WP No 2009-20 Is Russia sick with the Dutch disease?
22
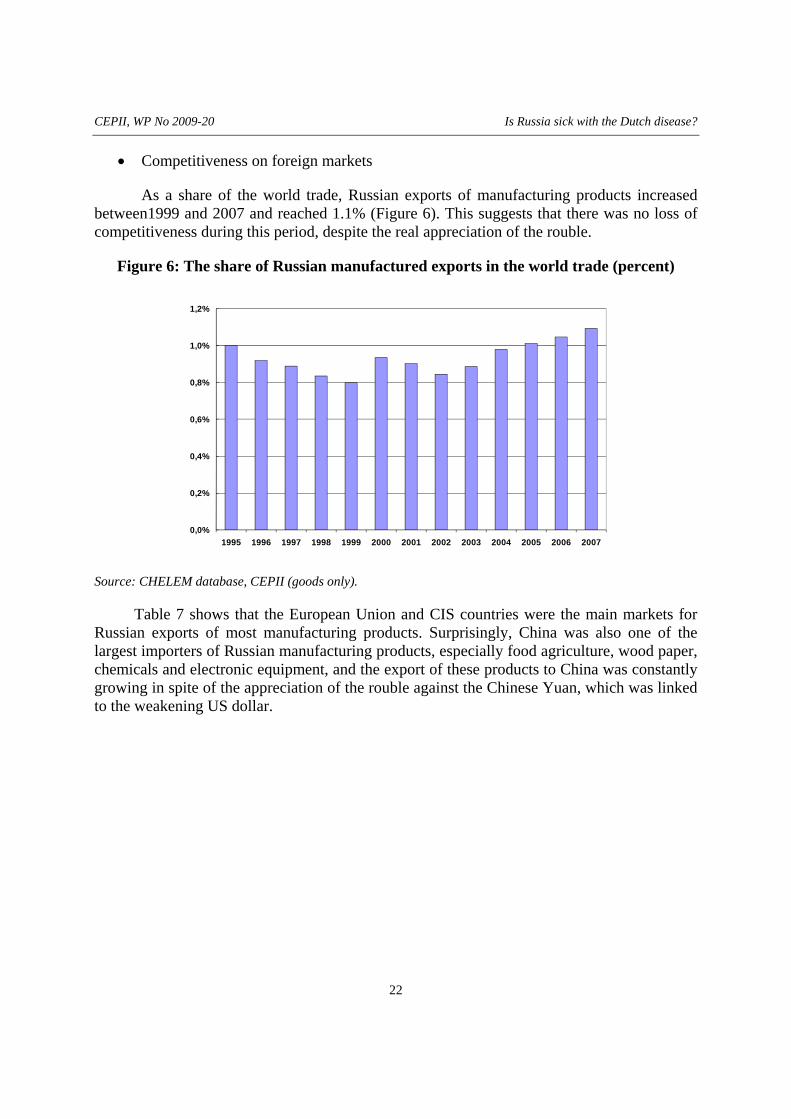
• Competitiveness on foreign markets
As a share of the world trade, Russian exports of manufacturing products increased between1999 and 2007 and reached 1.1% (Figure 6). This suggests that there was no loss of competitiveness during this period, despite the real appreciation of the rouble.
Figure 6: The share of Russian manufactured exports in the world trade (percent)
0,0%
0,2%
0,4%
0,6%
0,8%
1,0%
1,2%
1995 1996 1997 1998 1999 2000 2001 2002 2003 2004 2005 2006 2007
Source: CHELEM database, CEPII (goods only).
Table 7 shows that the European Union and CIS countries were the main markets for Russian exports of most manufacturing products. Surprisingly, China was also one of the largest importers of Russian manufacturing products, especially food agriculture, wood paper, chemicals and electronic equipment, and the export of these products to China was constantly growing in spite of the appreciation of the rouble against the Chinese Yuan, which was linked to the weakening US dollar.
CEPII, WP No 2009-20 Is Russia sick with the Dutch disease?
23
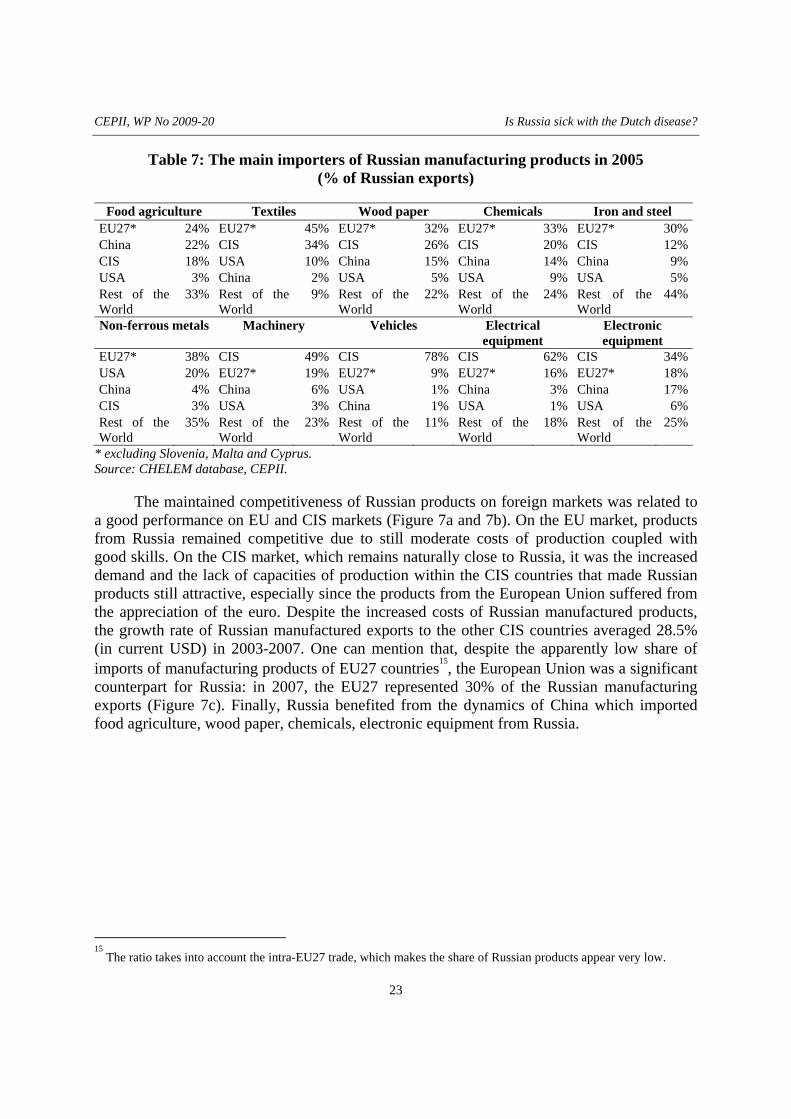
Table 7: The main importers of Russian manufacturing products in 2005 (% of Russian exports)
Food agriculture Textiles Wood paper Chemicals Iron and steel EU27* 24% EU27* 45% EU27* 32% EU27* 33% EU27* 30%China 22% CIS 34% CIS 26% CIS 20% CIS 12%CIS 18% USA 10% China 15% China 14% China 9%USA 3% China 2% USA 5% USA 9% USA 5%Rest of the World
33% Rest of the World
9% Rest of the World
22% Rest of the World
24% Rest of the World
44%
Non-ferrous metals Machinery Vehicles Electrical equipment
Electronic equipment
EU27* 38% CIS 49% CIS 78% CIS 62% CIS 34%USA 20% EU27* 19% EU27* 9% EU27* 16% EU27* 18%China 4% China 6% USA 1% China 3% China 17%CIS 3% USA 3% China 1% USA 1% USA 6%Rest of the World
35% Rest of the World
23% Rest of the World
11% Rest of the World
18% Rest of the World
25%
* excluding Slovenia, Malta and Cyprus. Source: CHELEM database, CEPII.
The maintained competitiveness of Russian products on foreign markets was related to a good performance on EU and CIS markets (Figure 7a and 7b). On the EU market, products from Russia remained competitive due to still moderate costs of production coupled with good skills. On the CIS market, which remains naturally close to Russia, it was the increased demand and the lack of capacities of production within the CIS countries that made Russian products still attractive, especially since the products from the European Union suffered from the appreciation of the euro. Despite the increased costs of Russian manufactured products, the growth rate of Russian manufactured exports to the other CIS countries averaged 28.5% (in current USD) in 2003-2007. One can mention that, despite the apparently low share of imports of manufacturing products of EU27 countries15, the European Union was a significant counterpart for Russia: in 2007, the EU27 represented 30% of the Russian manufacturing exports (Figure 7c). Finally, Russia benefited from the dynamics of China which imported food agriculture, wood paper, chemicals, electronic equipment from Russia.
15
The ratio takes into account the intra-EU27 trade, which makes the share of Russian products appear very low.

CEPII, WP No 2009-20 Is Russia sick with the Dutch disease?
24
Figure 7: The share of the Russian Federation in the manufactured imports of the EU 27 and CIS countries (percent)
a. The share of the Russian Federation in manufactured exports of the EU27*
b. The share of the Russian Federation in manufactured imports of CIS
0,0%
5,0%
10,0%
15,0%
20,0%
25,0%
30,0%
35,0%
1995 1996 1997 1998 1999 2000 2001 2002 2003 2004 2005 2006 2007
Source: CHELEM database, CEPII.
Figure 7.c: Share of the EU2, the CIS and China in the exports of Russian manufacturing products
0%
10%
20%
30%
40%
50%
60%
70%
1998 1999 2000 2001 2002 2003 2004 2005 2006 2007
share of EU27 share of CIS share of China
Source: CHELEM database, CEPII.
0 , 0 %
0 , 1 %
0 , 2 %
0,3%
0 , 4 %
1995 1996 1997 1998 1999 2000 2001 2002 2003 2004 2005 2006 2007
- .

CEPII, WP No 2009-20 Is Russia sick with the Dutch disease?
25
• Competitiveness on the domestic market
Internal demand in Russia boomed in 2000-2007, which supported both domestic production and imports. The share of manufacturing products in total imports in Russia increased from 70% in 2000 to 93% in 2005. Although not a proof of a loss of competitiveness, this suggests that foreign products were increasingly demanded in Russia. The main exporter to Russia was, however, the relatively expensive Euro area, whose share increased from 43% in 2000 to 46% in 2005. Imports from the Euro area dominated in all product categories except iron, steel and non-ferrous metals, which come primarily from the CIS countries (Table 8). It should be noted that China played a growing role (its share increased from 4% in 2000 to 9% in 2006), especially in the sectors of textile and electrical and electronic equipment, which created pressure on the competitiveness of Russian products in these sectors despite the strong internal demand. In brief, the rise in imported manufactures in Russia mainly comes from sectors that either were not present in Russia or suffered from Chinese competition.
Table 8: The main exporters of manufacturing products to Russia in 2005 (% of Russian imports)
Food agriculture Textiles Wood paper Chemicals Iron and steel EU27* 35% EU27* 46% EU27* 76% EU27* 69% CIS 68%CIS 20% China 36% CIS 8% CIS 7% EU27* 22%USA 6% CIS 4% China 8% China 5% China 2%China 4% USA 1% USA 2% USA 2% USA 0%Rest of the World 37%
Rest of the World 13%
Rest of the World 6%
Rest of the World 16%
Rest of the World 7%
Non-ferrous metals Machinery Vehicles Electrical equipment
Electronic equipment
CIS 48% EU27* 69% EU27* 44% EU27* 67% EU27* 72%EU27* 28% CIS 8% CIS 12% China 13% China 12%China 3% USA 6% USA 3% CIS 10% USA 2%USA 1% China 4% China 1% USA 1% CIS 1%Rest of the World 20%
Rest of the World 14%
Rest of the World 40%
Rest of the World 9%
Rest of the World 13%
* excluding Malta and Cyprus. Source: CHELEM database, CEPII.
3. THE RUSSIAN CONTEXT
In sum, until the international financial crisis of 2008, the two main economic factors which supported the strong development of Russian industries were a booming internal demand, supported by the rising terms of trade and increasing export revenues, and a good performance of Russian products on foreign markets such as the Euro area and the CIS countries despite the increasing price of Russian products. Furthermore, although the disorganization of the Russian economy in the 1990s and the crisis of 1998 led to a de-industrialisation, Russia managed to revive quickly. The re-organization led to a “natural” re-
CEPII, WP No 2009-20 Is Russia sick with the Dutch disease?
26
increase in the level of the industrial production. These factors appear to have had a higher impact on the economic development than the pressure on competitiveness created by the rising terms of trade. This led to the apparent paradox that in spite of the real appreciation of the rouble in 1999-2007, industrial production in Russia expanded, contradicting the Dutch disease hypothesis.
The institutional context and the political environment may have also played a role in these economic trends. The involvement of the government increased in some “strategic sectors”, in particular in the energy and bank/insurance sectors, and foreign investments in these “strategic sectors” were subject to restrictions. This contributed to a slower growth in the energy sector. This situation was amplified by the fact that the scope of the “strategic sectors”, as well as the rules for foreign investments into them, were not considered to be clearly defined, which led to uncertainties for foreign investors. 16 Also, in the energy sector, the recent policy of some large Russian public enterprises was to make acquisitions outside Russia, rather than to develop the extraction of natural resources within Russia (OECD, 2006). These factors can partly explain the slowdown in the growth of the energy extraction in the recent years, despite expected profitability.
Investments in most of the manufacturing industries, on the contrary, were not subject to such restrictions. The investment environment in these sectors improved significantly, as well as the perception of it among foreign investors. Thanks to high skills in the Russian labour market, as well as the relatively moderate costs of production, Russian manufacturing industries became more attractive for investors.
CONCLUSION
The fear that the Russian economy may become too dependent on the energy sector and not sufficiently diversified has influenced monetary policy over the last ten years. This policy was aimed at preventing the nominal appreciation of the rouble in order to maintain industrial competitiveness.
In this paper, using Rosstat and CHELEM databases, we study whether Russia suffered the Dutch disease in 1999-2007. We do find some symptoms of it in Russia: there was a strong real appreciation of the rouble, real wages increased, employment decreased in manufacturing industries and rose in services sector. However, there was no sign of a de-industrialisation, what contradicts the theory of the Dutch disease. Indeed, industrial production increased significantly. Furthermore, the symptoms present in Russia can be the consequences of other factors than the existence of natural resources. The appreciation of the rouble in real terms came partly from the Balassa-Samuelson effect. The quick development of the services was partly due to the fact that services were not put forward during the Soviet
16
In 2008, a Federal law (N°57 FZ - 29.05.2008) entered into force, which aimed at clarifying the scope of strategic sectors and the rules for foreign investments into them.
CEPII, WP No 2009-20 Is Russia sick with the Dutch disease?
27
Union times. The outflow of labour from the manufacturing industries resulted in inflow of labour in services sector rather than in the energy sector.
The strong growth of industrial production despite the presence of some symptoms of the Dutch disease can be explained by different factors. First, a natural catching-up process after the de-industrialisation in the 1990s can explain partly the very high productivity gains in industries, and hence, that the production of the manufacturing industries increased despite a significant decrease in employment. Second, despite the real appreciation of the rouble, Russian products gained market shares in world trade, thanks to new market opportunities in the European Union and in the other CIS countries, and to the growing Chinese demand for some specific Russian products. On the domestic market, the booming internal demand also contributed to support domestic production. Third, whereas foreign investments in “strategic sectors”, in particular, in energy and bank/insurance sectors, were subject to restrictions, investments in most manufacturing industries were largely encouraged. Hence, thanks to high skills and relatively low costs of production, manufacturing industries attracted a lot of investments (including foreign investments) and developed quickly.
From 1999 to 2007, these positive factors were sufficient to support growth in manufacturing industries, mitigating the effects of the real appreciation of the rouble. However, the international economic slowdown in 2008 led to a contraction in the industrial production. In the longer term, the situation may be less favourable, depending on the weights of the different factors and the international competition both on the domestic and foreign markets.
Regarding monetary policy, since high inflation is a growing concern, the Russian Central Bank admitted in its policy guidelines for 2008 that, although in the nearest future monetary policy would be aimed at exchange rate targeting as before, it was going to switch to inflation targeting in the medium run, making the exchange rate floating more freely. 17 The change in monetary-policy targets is going slowly though, as Russian monetary policy is confronted to different interacting effects, accompanied by a lot of uncertainties and difficulties in evaluating the situation in the longer term.
17
“In 2008, the Bank of Russia will continue to pursue the monetary policy while maintaining the managed floating exchange rate regime. Its exchange rate policy will aim to mitigate abrupt fluctuations in the exchange rate that are not caused by fundamental economic factors and take into account the necessity of curbing inflation and keeping domestic producer prices competitive. In the medium term, the Bank of Russia will switch to a more flexible exchange rate setting to facilitate the fulfillment of the monetary policy quantitative targets to maintain price stability by controlling the price of money in the economy mainly by using interest rate policy instruments of the monetary authorities”. Central Bank of Russia (2007), Guidelines for the Single State Monetary Policy in 2008, Central Bank of Russia, Moscow.

CEPII, WP No 2009-20 Is Russia sick with the Dutch disease?
28
REFERENCES
CBR (2007), Guidelines for the Single State Monetary Policy in 2008, Central Bank of Russia, Moscow, http://www.cbr.ru/eng/today/publications_reports/on_2008e.pdf
Dobrynskaya, V. (2008), “The monetary and exchange rate policy of the Central Bank of Russia under asymmetrical price rigidity”, Journal of Innovation Economics, issue “The Economic Performance of Russia”, #1, pp. 29-62.
Doppelhofer, G., R. Miller and X. Sala-i-Martin (2004), “Determinants of Long-Term Growth: a Bayesian Averaging of Classical Estimates (BACE) Approach”, American Economic Review, 94(4), 813-835.
Gurvich E. and Sokolov V. (2008), “Estimation of the contribution of the Balassa-Samuelson effect to rouble real exchange rate dynamics”, in Russian, presented at IX International conference "Economic Modernization and Globalization", Moscow.
International Monetary Fund, 2003. Russian Federation: Selected issues. Country report No. 03/146. IMF, Washington, DC.
OECD (2006) Economic Survey of the Russian Federation.
Oomes, N. and K. Kalcheva (2007), “Diagnosing Dutch Disease: Does Russia Have the Symptoms?”, IMF Working Paper #07/102, April.
Ploeg, Frederick van der, Poelhekke, Steven (2008), “Volatility harms growth – New perspectives on the natural Resource Curse”, mimeo.
Sala-i-Martin, X. (1997), “I Just Run Two Million Regressions”, American Economic Review, Papers and Proceedings, May
Sachs, J. and A. Warner (1997), “Natural Resource Abundance and Economic Growth”, NBER Working Paper 5398, Cambridge, MA.
Sosunov K. and O. Zamulin (2006), “Can oil prices explain the real appreciation of the Russian rouble in 1998-2005?” CEFIR/NES Working Paper #83.
Vdovichenko, Anna, Voronina, Victoria (2004), “Monetary policy rules and their application in Russia”, EERC Working paper series No 04/09. Moscow.
World Bank (2003), “International Public Administration Reform Implications for the Russian Federation”.
World Bank, (2006), “Institutional Reform in Russia: Moving From Design to Implementation in a Multi-Level Governance Context”, Report Number: 35576-RU.

CEPII, WP No 2009-20 Is Russia sick with the Dutch disease?
29
LIST OF WORKING PAPERS RELEASED BY CEPII
An exhaustive list is available on the website: \\www.cepii.fr. To receive an alert, please contact Sylvie Hurion ([email protected]).
No Title Authors
2009-19 Économies d’agglomération à l’exportation et difficulté d’accès aux marchés
P. Koenig, F. Mayneris & S. Poncet
2009-18 Local Export Spillovers in France P. Koenig, F. Mayneris & S. Poncet
2009-17 Currency Misalignments and Growth: a New Look Using Nonlinear Panel Data Methods
Sophie Béreau, Antonia Lopez
Villavicencio & Valérie Mignon
2009-16 Trade Impact of European Measures on GMOs Condemned by the WTO Panel
A. C. Disdier & L. Fontagné
2009-15 Economic Crisis and Global Supply Chains
A. Bénassy-Quéré, Y. Decreux, L. Fontagné& D. Khoudour-Casteras
2009-14 Quality Sorting and Trade: Firm-level Evidence for French Wine
M. Crozet, K. Head& T. Mayer
2009-13 New Evidence on the Effectiveness of Europe’s Fiscal Restrictions
M. Poplawski Ribeiro
2009-12 Remittances, Capital Flows and Financial Development during the Mass Migration Period, 1870-1913
R. Esteves& D. Khoudour-Castéras
2009-11 Evolution of EU and its Member States’ Competitiveness in International Trade
L. Curran & S. Zignago
2009-10 Exchange-Rate Misalignments in Duopoly: The Case of Airbus and Boeing
A. Bénassy-Quéré,L. Fontagné & H. Raff
2009-09 Market Positioning of Varieties in World Trade: Is Latin America Losing out on Asia?
N. Mulder, R. Paillacar& S. Zignago
2009-08 The Dollar in the Turmoil A Bénassy-Quéré,S. Béreau & V. Mignon
2009-07 Term of Trade Shocks in a Monetary Union: An Application to West-Africa
L. Batté,A. Bénassy-Quéré,
B. Carton & G. Dufrénot
CEPII, WP No 2009-20 Is Russia sick with the Dutch disease?
30
No Title Authors
2009-06 Macroeconomic Consequences of Global Endogenous Migration: A General Equilibrium Analysis
V. Borgy, X. Chojnicki, G. Le Garrec
& C. Schwellnus
2009-05 Équivalence entre taxation et permis d’émission échangeables
P. Villa
2009-04 The Trade-Growth Nexus in the Developing Countries: a Quantile Regression Approach
G. Dufrénot, V. Mignon & C. Tsangarides
2009-03 Price Convergence in the European Union: within Firms or Composition of Firms?
I. Méjean& C. Schwellnus
2009-02 Productivité du travail : les divergences entre pays développés sont-elles durables ?
C. Bosquet & M. Fouquin
2009-01 From Various Degrees of Trade to Various Degrees of Financial Integration: What Do Interest Rates Have to Say
A. Bachellerie,J. Héricourt & V. Mignon
2008-32 Do Terms of Trade Drive Real Exchange Rates? Comparing Oil and Commodity Currencies
V. Coudert, C. Couharde& V. Mignon
2008-31 Vietnam’s Accession to the WTO: Ex-Post Evaluation in a Dynamic Perspective
H. Boumellassa& H. Valin
2008-30 Structural Gravity Equations with Intensive and Extensive Margins
M. Crozet & P. Koenig
2008-29 Trade Prices and the Euro J. Martin & I. Méjean
2008-28 Commerce international et transports : tendances du passé et prospective 2020
C. Gouel, N. Kousnetzoff& H. Salman
2008-27 The Erosion of Colonial Trade Linkages after Independence
T. Mayer, K. Head& J. Ries
2008-26 Plus grandes, plus fortes, plus loin… Performances relatives des firmes exportatrices françaises
M. Crozet, I. Méjean& S. Zignago
2008-25 A General Equilibrium Evaluation of the Sustainability of the New Pension Reforms in Italy
R. Magnani
2008-24 The Location of Japanese MNC Affiliates: Agglomeration, Spillovers and Firm Heterogeneity
T. Inui, T. Matsuura& S. Poncet
2008-23 Non Linear Adjustment of the Real Exchange Rate Towards its Equilibrium Values
S. Béreau,A. Lopez Villavicencio
& V. Mignon
2008-22 Demographic Uncertainty in Europe – Implications on Macro Economic Trends and Pension Reforms – An Investigation with the INGENUE2 Model
M. Aglietta & V. Borgy

CEPII, WP No 2009-20 Is Russia sick with the Dutch disease?
31
No Title Authors
2008-21 The Euro Effects on the Firm and Product-Level Trade Margins: Evidence from France
A. Berthou & L. Fontagné
2008-20 The Impact of Economic Geography on Wages: Disentangling the Channels of Influence
L. Hering & S. Poncet
2008-19 Do Corporate Taxes Reduce Productivity and Investment at the Firm Level? Cross-Country Evidence from the Amadeus Dataset
J. Arnold& C. Schwellnus
2008-18 Choosing Sensitive Agricultural Products in Trade Negotiations
S. Jean, D. Laborde& W. Martin
2008-17 Government Consumption Volatility and Country Size D. Furceri& M. Poplawski Ribeiro
2008-16 Inherited or Earned? Performance of Foreign Banks in Central and Eastern Europe
O. Havrylchyk& E. Jurzyk
2008-15 The Effect of Foreign Bank Entry on the Cost of Credit in Transition Economies. Which Borrowers Benefit most?
H. Degryse,O. Havrylchyk, E. Jurzyk
& S. Kozak
2008-14 Contagion in the Credit Default Swap Market: the Case of the GM and Ford Crisis in 2005.
V. Coudert & M. Gex
2008-13 Exporting to Insecure Markets: A Firm-Level Analysis M. Crozet, P. Koenig& V. Rebeyrol
2008-12 Social Competition and Firms' Location Choices V. Delbecque, I. Méjean& L. Patureau
2008-11 Border Effects of Brazilian States M. Daumal & S. Zignago
2008-10 International Trade Price Indices G. Gaulier, J. Martin,I. Méjean & S. Zignago
2008-09 Base de données CHELEM – Commerce international du CEPII
A. de Saint Vaulry
2008-08 The Brain Drain between Knowledge Based Economies: the European Human Capital Outflows to the US
A. Tritah
2008-07 Currency Misalignments and Exchange Rate Regimes in Emerging and Developing Countries
V. Coudert& C. Couharde
2008-06 The Euro and the Intensive and Extensive Margins of Trade: Evidence from French Firm Level Data
A. Berthou & L. Fontagné
2008-05 On the Influence of Oil Prices on Economic Activity and other Macroeconomic and Financial Variables
F. Lescaroux& V. Mignon
2008-04 An Impact Study of the EU-ACP Economic Partnership Agreements (EPAs) in the Six ACP Regions
L. Fontagné, D. Laborde& C. Mitaritonna
CEPII, WP No 2009-20 Is Russia sick with the Dutch disease?
32
No Title Authors
2008-03 The Brave New World of Cross-Regionalism A. Tovias
2008-02 Equilibrium Exchange Rates: a Guidebook for the Euro-Dollar Rate
A. Bénassy-Quéré, S. Béreau & V. Mignon
2008-01 How Robust are Estimated Equilibrium Exchange Rates? A Panel BEER Approach
A. Bénassy-Quéré, S. Béreau & V. Mignon

CEPII, WP No 2009-20 Is Russia sick with the Dutch disease?
33
Organisme public d’étude et de recherche en économie internationale, le CEPII est placé auprès du Centre d’Analyse Stratégique. Son programme de travail est fixé par un conseil composé de responsables de l’administration et de personnalités issues des entreprises, des organisations syndicales et de l’Université.
Les documents de travail du CEPII mettent à disposition du public professionnel des travaux effectués au CEPII, dans leur phase d’élaboration et de discussion avant publication définitive. Les documents de travail sont publiés sous la responsabilité de la direction du CEPII et n’engagent ni le conseil du Centre, ni le Centre d’Analyse Stratégique. Les opinions qui y sont exprimées sont celles des auteurs.
Les documents de travail du CEPII sont disponibles sur le site : http//www.cepii.fr.
CEPII 9, RUE GEORGES PITARD, 75740 PARIS CEDEX 15
SYLVIE HURION – PUBLICATIONS TÉL : 01 53 68 55 14 - FAX : 01 53 68 55 04
ISSN : 1293-2574