is the canadian housing market overvalued? a post …equilibrium throughout canada. however, house...
TRANSCRIPT
Is the Canadian Housing Market Overvalued? A Post-Crisis Assessment
Evridiki Tsounta
WP/09/235
© 2009 International Monetary Fund WP/09/235 IMF Working Paper Western Hemisphere
Is the Canadian Housing Market Overvalued? A Post-crisis Assessment1
Prepared by Evridiki Tsounta
Authorized for distribution by Charles Kramer
October 2009
Abstract
This Working Paper should not be reported as representing the views of the IMF. The views expressed in this Working Paper are those of the author and do not necessarily represent those of the IMF or IMF policy. Working Papers describe research in progress by the author and are published to elicit comments and to further debate.
Canadian house prices have increased significantly between 2003 and early 2008, with a marked downward trend since mid-2008, especially in the resource-rich western provinces. This paper estimates the evolution of equilibrium real home prices during this period in key provinces and finds that, following recent declines, home prices are now generally close to equilibrium throughout Canada. However, house prices in Alberta and British Columbia remain around 8 percent overvalued at the end of the sample (second quarter of 2009). Despite the limitations of econometric estimates of house-price dynamics, the measured small degree of overvaluation suggests that the Canadian housing market is essentially at equilibrium. JEL Classification Numbers: R21, R31 Keywords: House prices Author’s E-Mail Address: [email protected] 1 The author gratefully acknowledges the comments and suggestions of Charles Kramer, Marcello Estevão, Nicoletta Batini, Rupa Duttagupta, Umar Faruqui, Mark Zelmer, seminar participants at a joint Finance Canada/Bank of Canada seminar in Ottawa in March 2009, and excellent research assistance by Natalia Barrera. Special thanks to Gustavo Durango, Aaron Goertzen and Patrice Ollivaud for providing housing data, as well as to Eneshi Kapijimpanga, Rochelle Gittens, Joanna Meza-Cuadra and Hildi Wickerdeady on valuable production assistance. All errors are mine.
2
Contents Page I. Introduction ..................................................................................................................3 II. Recent Housing Market Developments........................................................................4
A. The Run-up in House Prices and Construction .....................................................4
B. Reversal in House Prices.......................................................................................5 III. Macrofinancial Linkages from the Housing Market ....................................................6 IV. Existing Literature ........................................................................................................8 V. Econometric Model and Results.................................................................................10 VI. Conclusions ................................................................................................................12 References............................................................................................................................13 Figures 1. Canada. Cummulative Increase in Resale House Prices ............................................15 2. G-7. Price-to-income and price-to-rent ratios, 1970-2009 .........................................16 3. Select Eastern Canadian Provinces: House Price Over/Undervaluation,
1993Q1-2009Q2.....................................................................................................17 4. Select Western Canadian Provinces: House Price Over/Udnervaluation,
1993Q1-2009Q2.....................................................................................................18 Tables 1. Real Prices of New Houses and Land, 1995-2009Q2 ................................................19 2. Determinants of House Prices in Select Canadian Provinces ...................................20
3
I. INTRODUCTION
Canadian house prices have increased significantly between 2003 and early 2008, with a marked downward trend since mid-2008. House prices rose by around 60 percent in nominal terms (45 percent in real terms) from 2003 to their end-2007 peak, before falling by around 10 percent (both in real and nominal terms) by early 2009. The decline is particularly acute in the resource-rich western provinces, which have experienced the fastest price increases during the commodity boom years, although modest declines are occuring elsewhere.
This paper looks closely at fundamental determinants of house price developments in five large Canadian provinces (Alberta, British Columbia, Ontario, Quebec, and Saskatchewan) to come to an assessment about possible deviations from equilibrium prices.2 An econometric model is used to compute the equilibrium price, as determined by demand (derived on the basis of factors such as disposable income and demographic developments) and supply (derived from factors influencing the available housing stock). Typically, the specification of these models is a long-run (cointegration) relationship between house prices and their determinants, which is then embedded in an error-correction mechanism. We examine current valuations against economic fundamentals using quarterly regional data—such as disposable income, demographic developments which also account for inter-provincial and international migration trends, and mortgage credit for the period 1993Q1-2009Q2.
Results reveal that at the peak of the housing boom, house prices were significantly overvalued in the west. However, following the recent steep decline in prices, the overvaluation has decreased significantly; we find that house prices in Alberta and British Columbia remain slightly overvalued as of end-2009Q2 (at around 8 percent according to the model estimation), while at the peak of the housing boom, their overvaluation was estimated at double-digit levels. In contrast, house prices in the eastern provinces of Ontario and Quebec, and the western province of Saskatchewan are now close to equilibrium, even though the latter has also experienced significant overvaluation during the housing boom. Interestingly, the large run-up in house prices in the west in the 2000s, mostly reflects a catch-up from stubbornly undervalued levels following the housing collapse in the early 1990s.
Analyzing house-price valuations is important for various reasons:
o Households’ behavior. With the house representing the largest single asset for most households, changes in its valuation would have important consequences on households’ balance sheets and thus spending behavior.
2 The IMF’s World Economic Outlook (2004, 2008, 2009) has examined house-price valuation at the national level, in a cross-country framework.
4
h more
o Financial soundness. Mortgages and other real-estate related assets also represent an important component of financial institutions’ balance sheet (almost half of chartered banks’ loans), implying that housing market developments could have important implications for the health of the financial system, including profitability and soundness.
o Policy Implications. House prices also affect the consumer price index, and thus inflationary trends and expectations. As a result, understanding housing price dynamics has important implications for monetary policy in its role to preserve price, and financial stability. Last but not least, revenues from real estate transactions (including construction-related income and excise taxes) have an important impact on a country’s fiscal position.
The paper is structured as follows. The next section analyzes recent housing market developments in Canada. Section III indicates the significance of analyzing such developments from a macroeconomic and financial sector perspective. Section IV briefly reviews the related literature. Section V describes the econometric model and the results. Section VI concludes this paper.
II. RECENT HOUSING MARKET DEVELOPMENTS
A. The Run up in House Prices and Construction
Similar to most OECD countries, Canadian house prices (in both real and nominal terms) have risen sharply between 2003 and late 2007/early 2008. In particular,
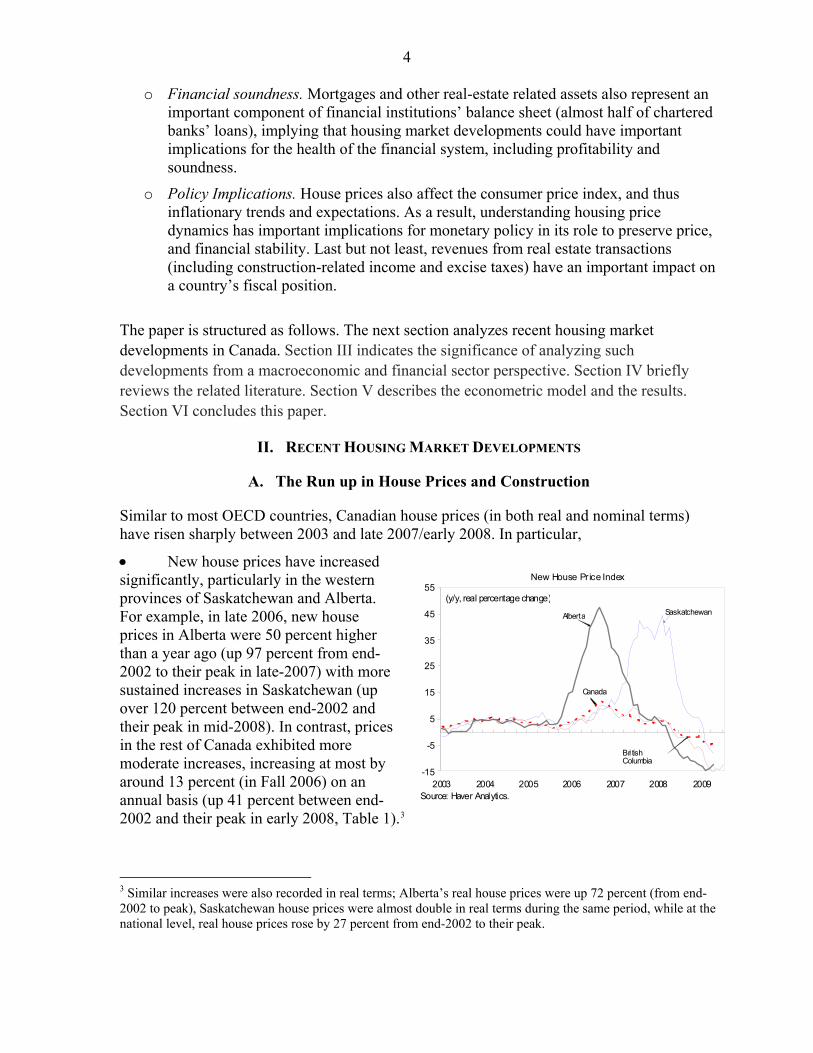
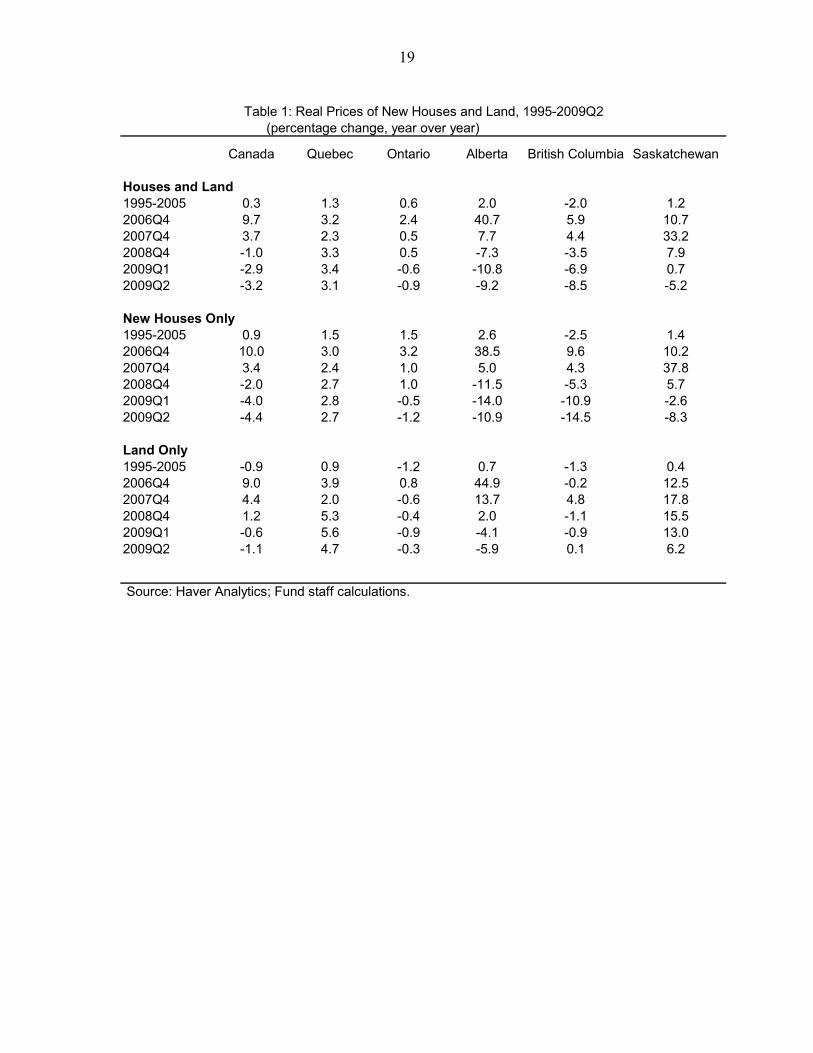
New house prices have increased significantly, particularly in the western provinces of Saskatchewan and Alberta. For example, in late 2006, new house prices in Alberta were 50 percent higher than a year ago (up 97 percent from end-2002 to their peak in late-2007) witsustained increases in Saskatchewan (up over 120 percent between end-2002 and their peak in mid-2008). In contrast, prices in the rest of Canada exhibited more moderate increases, increasing at most by around 13 percent (in Fall 2006) on an annual basis (up 41 percent between end-2002 and their peak in early 2008, Table 1).3
-15
-5
5
15
25
35
45
55
2003 2004 2005 2006 2007 2008 2009
New House Price Index
Source: Haver Analytics.
Canada
SaskatchewanAlberta
Bri tish Columbia
(y/y, real percentage change)
3 Similar increases were also recorded in real terms; Alberta’s real house prices were up 72 percent (from end-2002 to peak), Saskatchewan house prices were almost double in real terms during the same period, while at the national level, real house prices rose by 27 percent from end-2002 to their peak.
5
t
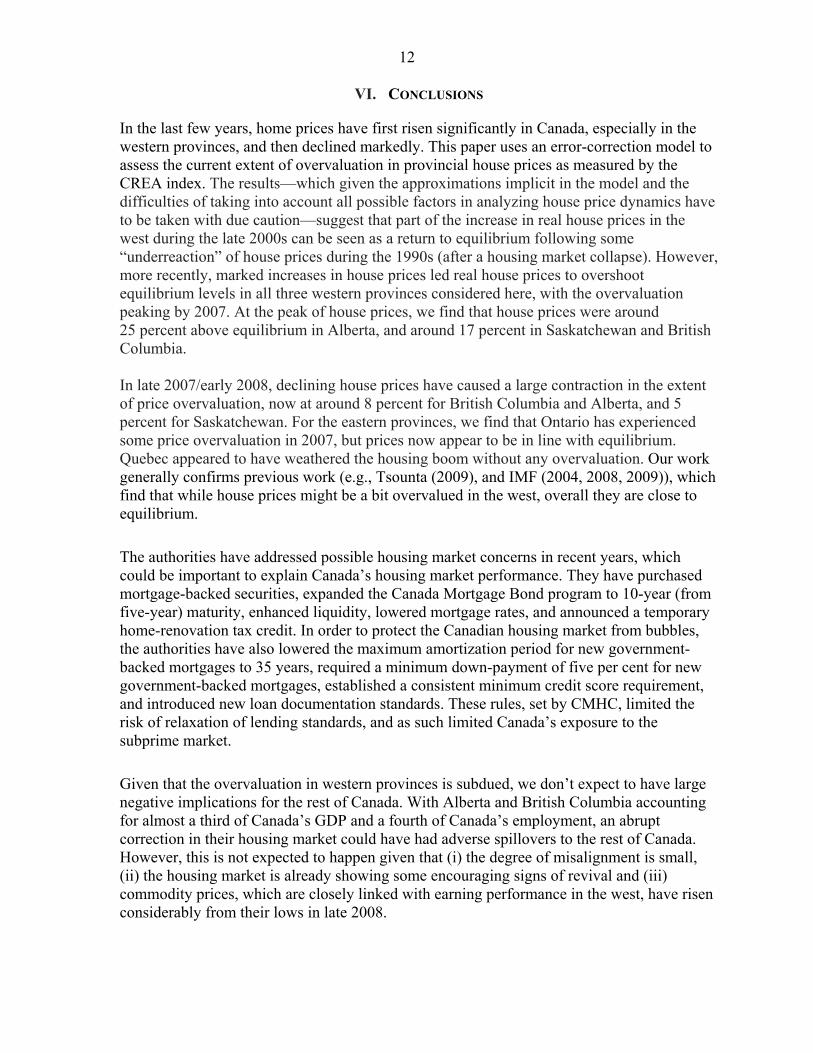
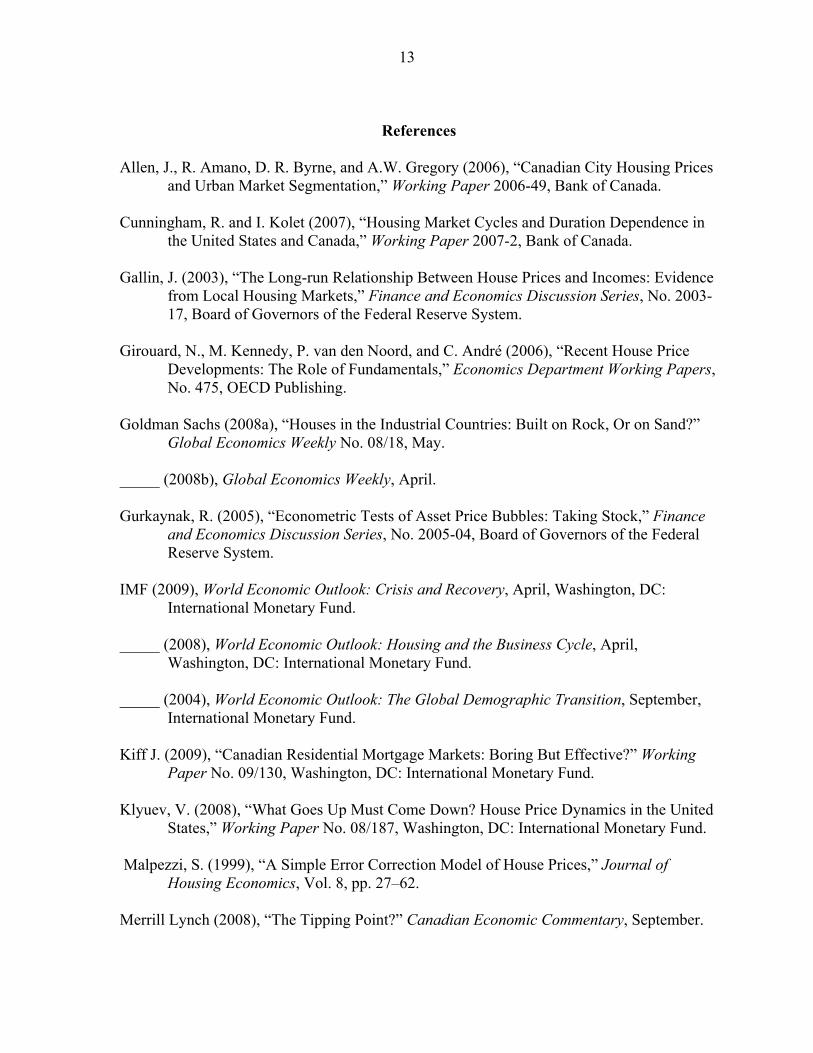
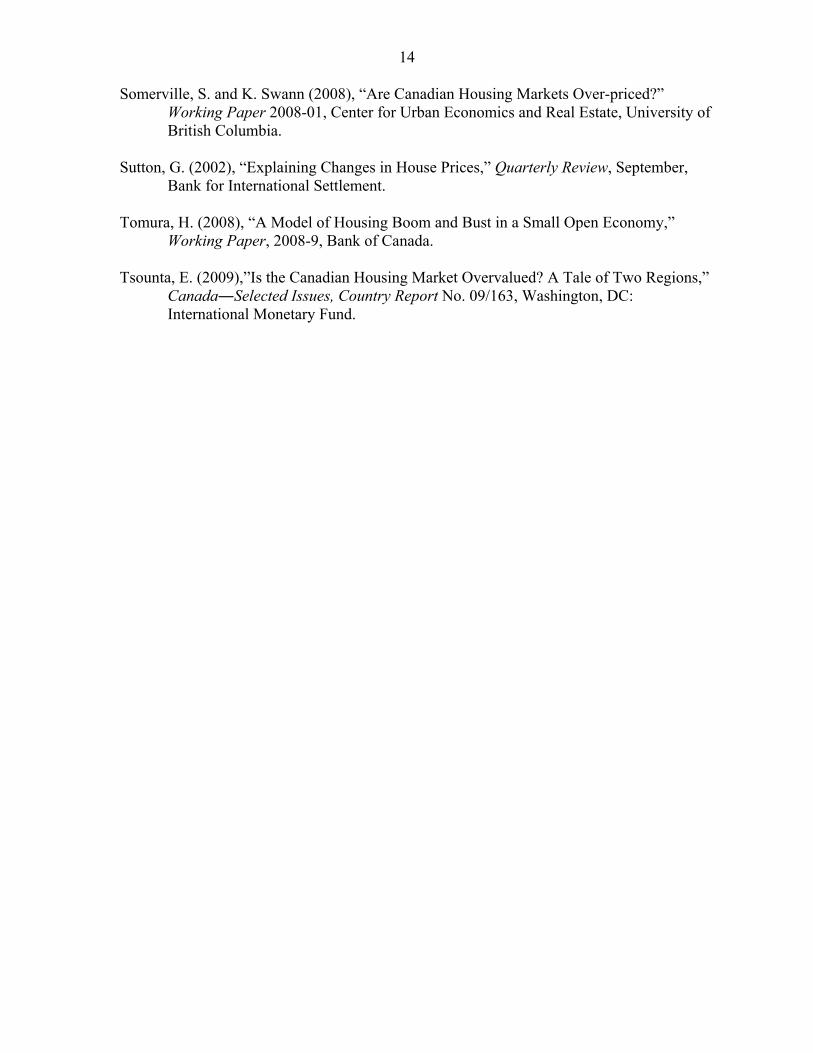
Existing home prices have also risen significantly, again the largest increases experienced in the west. Using quality-adjusting Teranet National Bank house price index which records house prices in Canada’s six metropolitan areas of Ottawa, Toronto, Calgary, Vancouver, Montreal, and Halifax, house prices have doubled in the west over 5 years, while similar (and even large increases) have been recorded using the much more broad-based Canadian Real Estate Association's Multiple Listing Service (CREA’s MLS) database on existing house prices (Figure 1).
End-2002 to Peak Peak DateCanada 60 Jul-04Calgary, AL 105 Jul-03Halifax, NS 48 Sep-04Montreal, QU 62 Aug-04Ottawa, ON 36 Sep-04Toronto, ON 36 Jul-04Vancouver, BC 99 May-04
Source: Teranet-National Bank, and author's calculations.
Cummulative Nominal Increases in House Prices, End-2002 to Peak(Percentage change)
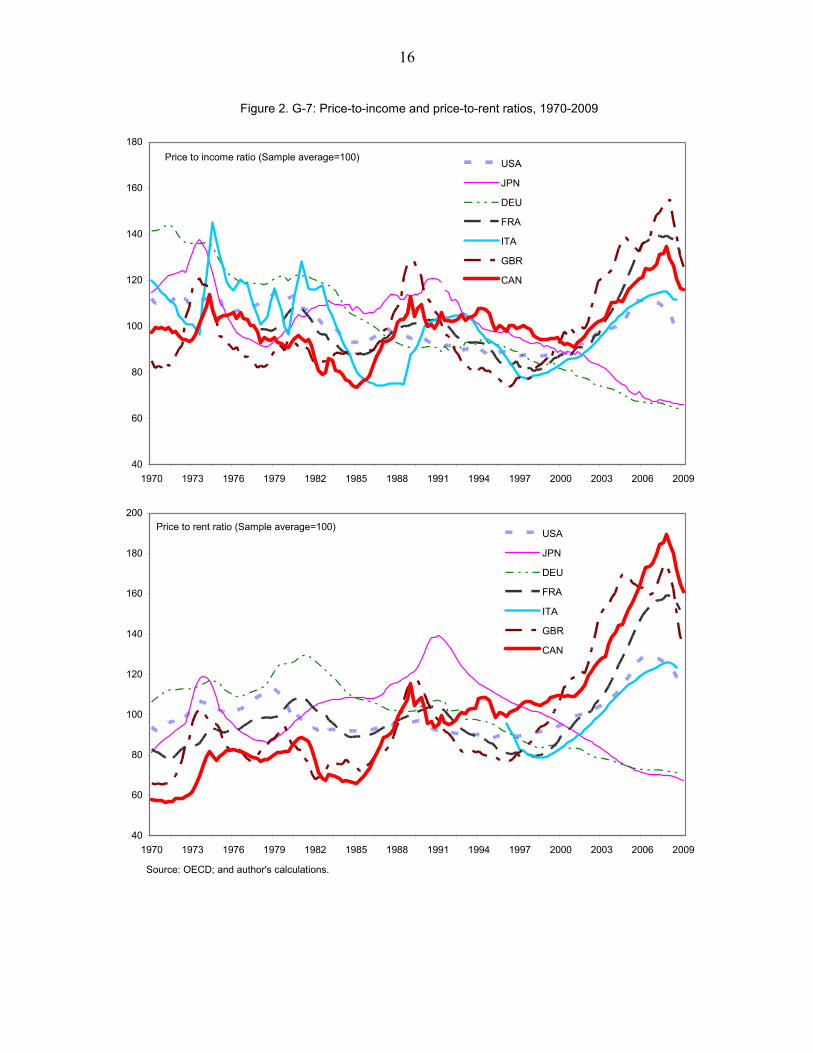
Traditional valuation measures, ratios of both house price-to-income and house price-to-rent, have also risen sharply during the boom years, compared to their long-term average, to historical highs. Relative to their 30-year average, house prices in terms of income have risen significantly in Canada, and despite the recent declines, continue to remain high (around 15 percent above the historical average). In contrast, the corresponding U.S. measure is now very close to the historical average, despite being around 11 percent above the long-term average during the boom years in the mid-2000s. In terms of rent, Canadian house prices also continue to be above their historical average by around 60 percent—twice the U.S. comparator (Figure 2).
100
120
140
160
180
200
220
240
260
280
1996 1997 1998 1999 2000 2001 2002 2003 2004 2005 2006 2007 2008 2009
Building Permits
Housing Starts
Building Permits and Housing Starts
(Annual rate; in thousands)
Source: Haver Analytics.
The housing price boom also coincided with surging construction activity. In September 2007, housing starts reached a level not seen since 1978 while building permits hit a record-high in November 2005 (data go back to 1960). In regional terms, the west experienced remarkable increases in housing starts and building permits; for example housing starts increased by over 60 percent between 2003 and mid-2007.
B. Reversal in House Prices
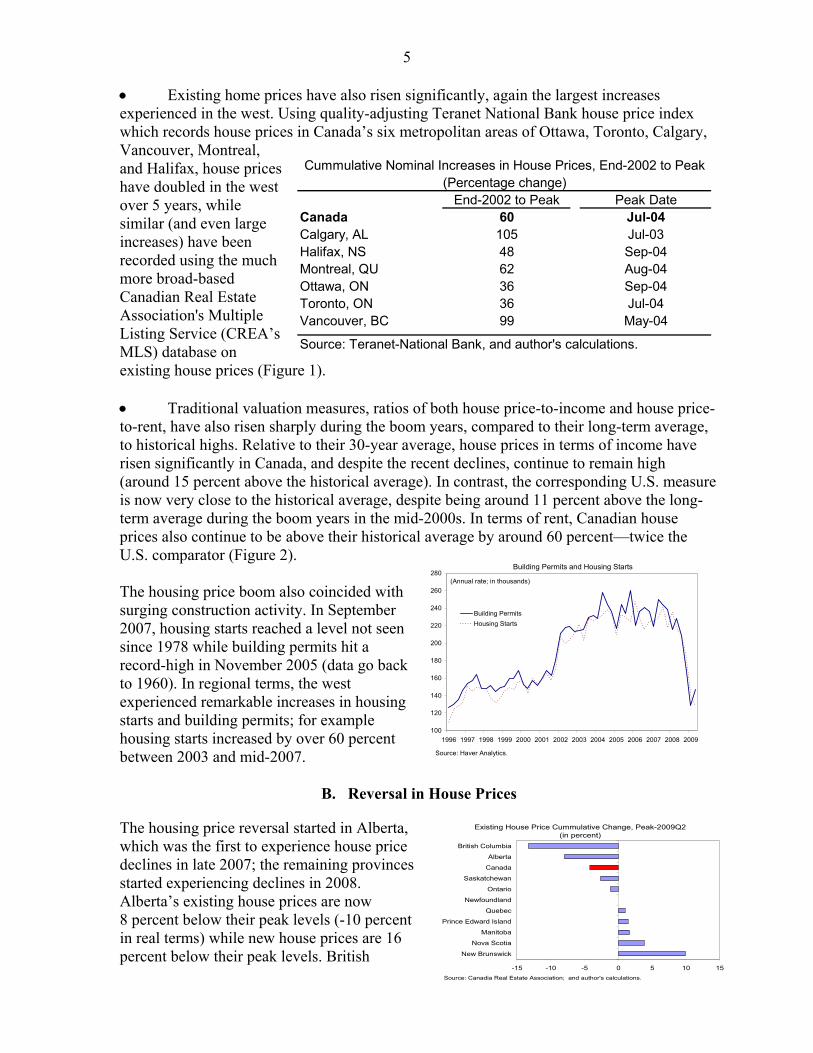
The housing price reversal started in Alberta, which was the first to experience house price declines in late 2007; the remaining provinces started experiencing declines in 2008. Alberta’s existing house prices are now 8 percent below their peak levels (-10 percenin real terms) while new house prices are 16 percent below their peak levels. British
-15 -10 -5 0 5 10 15
New Brunswick
Nova Scotia
Manitoba
Prince Edward Island
Quebec
Newfoundland
Ontario
Saskatchewan
Canada
Alberta
British Columbia
Existing House Price Cummulative Change, Peak-2009Q2 (in percent)
Source: Canadia Real Estate Association; and author's calculations.
6
07/08 peak price level.
Columbia and Saskatchewan have also experienced large declines in house prices—respectively, down 13 percent from its peak for existing homes (down over 15 percent for new houses) and down 2.7 percent for existing houses (almost 9 percent down for new houses). A much smaller decline has taken place in the manufacturing hub of Ontario—house prices are down just one percent from their peak. In contrast, Quebec prices have been essentially flat during the housing downturn in the rest of the country, and given recent houseprice increases, they are now at above their 20 Activity indicators, such as housing sales and starts have fallen considerably throughout Canada—now at levels not seen since the end-1990s. For example, Ontario’s housing starts at around 39,000 per year are the lowest since 1996, while Alberta’s starts are just one-third their peak level. Similarly, housing sales at end-2008 were 35 percent lower than their peak levels in Canada as a whole, with sales about half their peak levels in Alberta and British Columbia, and about a third lower than their peak levels in Ontario and Saskatchewan. In a welcome development, house sales have risen significantly in the first half of 2009; up almost 70 percent since end-2008 in British Columbia and around 30 percent up in Alberta and Ontario.
Peak Year From peak to end-2008 Change in 2009-Q2(q/q)Canada 2007-Q2 -35 32Alberta 2007-Q1 -48 44British Columbia 2007-Q3 -56 59Ontario 2007-Q2 -33 32Quebec 2008-Q2 -20 19Saskatchewan 2007-Q2 -33 16 Source: Canadian Real Estate Association
Cummulative Change in Existing Home Sales, in percent
III. MACROFINANCIAL LINKAGES FROM THE HOUSING MARKET
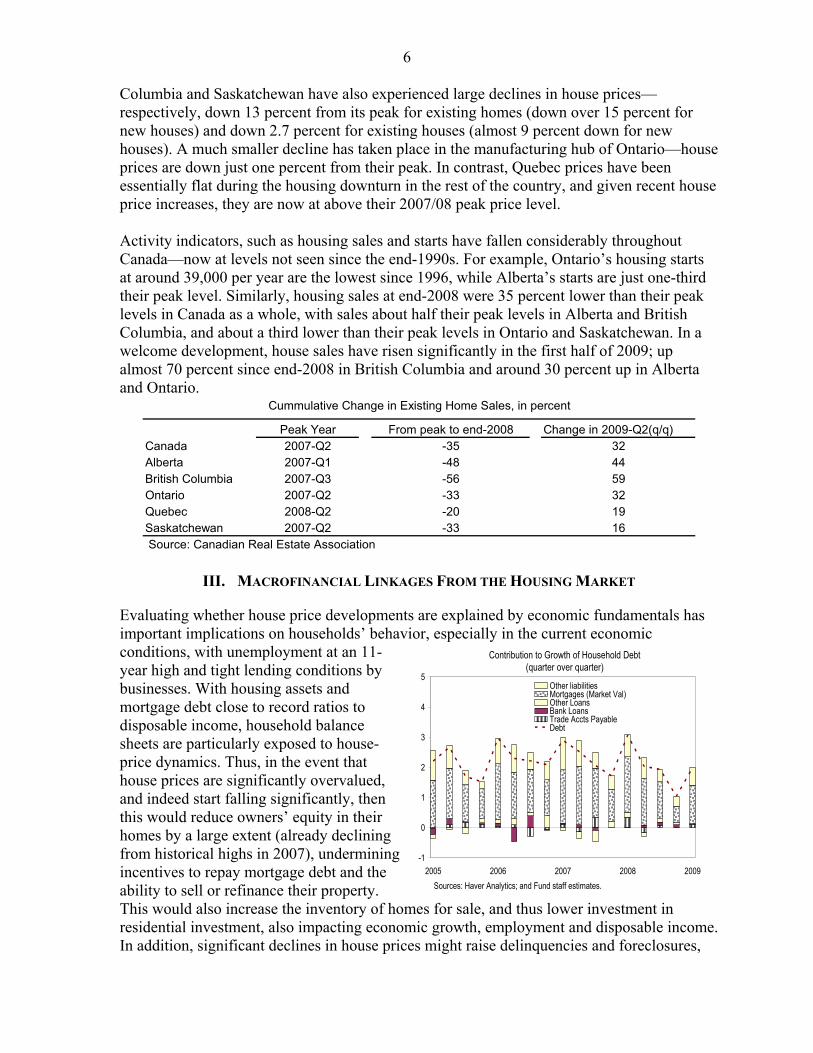
Evaluating whether house price developments are explained by economic fundamentals has important implications on households’ behavior, especially in the current economic conditions, with unemployment at an 11-year high and tight lending conditions by businesses. With housing assets and mortgage debt close to record ratios to disposable income, household balance sheets are particularly exposed to house-price dynamics. Thus, in the event that house prices are significantly overvalued, and indeed start falling significantly, then this would reduce owners’ equity in their homes by a large extent (already declining from historical highs in 2007), undermining incentives to repay mortgage debt and the ability to sell or refinance their property. This would also increase the inventory of homes for sale, and thus lower investment in residential investment, also impacting economic growth, employment and disposable income. In addition, significant declines in house prices might raise delinquencies and foreclosures,
-1
0
1
2
3
4
5
2005 2006 2007 2008 2009
Other liabilitiesMortgages (Market Val)Other LoansBank Loans Trade Accts PayableDebt
Contribution to Growth of Household Debt(quarter over quarter)
Sources: Haver Analytics; and Fund staff estimates.
7 further deteriorating the situation; though this has not been a problem so far in Canada.4 Persistently falling house prices (for example, due to overvaluation) could be taking a life of their own, as expectations for further price declines, falling employment, and credit constraints could choke sales (as buyers wait for lower prices or are unable to borrow given job losses and the credit crunch) and squeeze further highly indebted households. The results could be amplified if deflationary expectations set in, which could also impact households’ outlook for future disposable income increases.
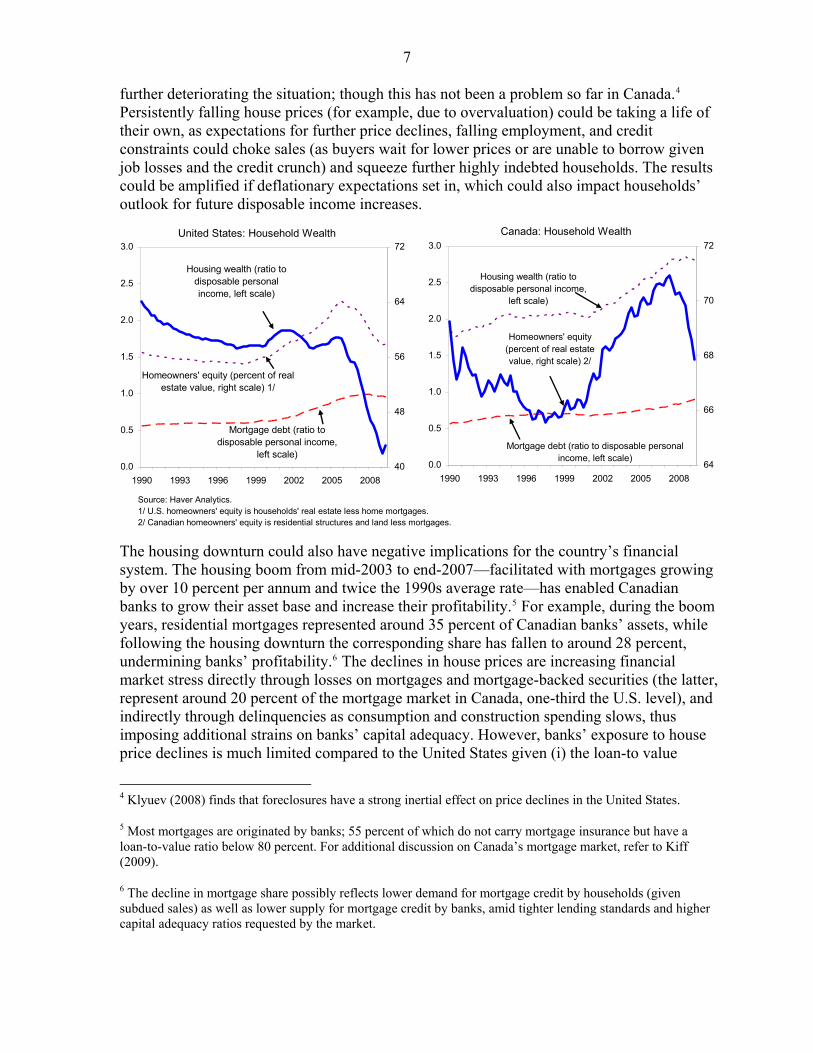
Source: Haver Analytics.1/ U.S. homeowners' equity is households' real estate less home mortgages.2/ Canadian homeowners' equity is residential structures and land less mortgages.
0.0
0.5
1.0
1.5
2.0
2.5
3.0
1990 1993 1996 1999 2002 2005 2008
40
48
56
64
72
Homeowners' equity (percent of real estate value, right scale) 1/
Housing wealth (ratio to disposable personal income, left scale)
Mortgage debt (ratio to disposable personal income,
left scale)
United States: Household Wealth
0.0
0.5
1.0
1.5
2.0
2.5
3.0
1990 1993 1996 1999 2002 2005 2008
64
66
68
70
72
Homeowners' equity (percent of real estate value, right scale) 2/
Housing wealth (ratio to disposable personal income,
left scale)
Mortgage debt (ratio to disposable personal income, left scale)
Canada: Household Wealth
The housing downturn could also have negative implications for the country’s financial system. The housing boom from mid-2003 to end-2007—facilitated with mortgages growing by over 10 percent per annum and twice the 1990s average rate—has enabled Canadian banks to grow their asset base and increase their profitability.5 For example, during the boom years, residential mortgages represented around 35 percent of Canadian banks’ assets, while following the housing downturn the corresponding share has fallen to around 28 percent, undermining banks’ profitability.6 The declines in house prices are increasing financial market stress directly through losses on mortgages and mortgage-backed securities (the latter, represent around 20 percent of the mortgage market in Canada, one-third the U.S. level), and indirectly through delinquencies as consumption and construction spending slows, thus imposing additional strains on banks’ capital adequacy. However, banks’ exposure to house price declines is much limited compared to the United States given (i) the loan-to value
4 Klyuev (2008) finds that foreclosures have a strong inertial effect on price declines in the United States.
5 Most mortgages are originated by banks; 55 percent of which do not carry mortgage insurance but have a loan-to-value ratio below 80 percent. For additional discussion on Canada’s mortgage market, refer to Kiff (2009).
6 The decline in mortgage share possibly reflects lower demand for mortgage credit by households (given subdued sales) as well as lower supply for mortgage credit by banks, amid tighter lending standards and higher capital adequacy ratios requested by the market.
8
requirement of 80 percent for uninsured mortgages; and (ii) the fact that Canadian lenders have full recourse to borrowers which makes escaping loan obligations harder for borrowers. The increasing financial market stress from declining house prices could feed back into lower house prices via macro-financial linkages. If banks’ losses from declining house prices are large, they might decide to tighten lending standards, thus hurting credit provision, imposing additional downward pressure on spending, incomes, wealth and house prices. Housing price declines could also have important implications for inflation. Lower new house prices could dampen inflation through two direct channels. The owner-accommodation category in the CPI basket includes two components that are directly influenced by changes in new house prices (Merrill Lynch, 2008). First, the “house-replacement” component (4 percent weight in core CIPX), which can be considered as measuring depreciation of owner-occupied home, directly incorporates the house price index for new houses with a small lag. Second, the “mortgage-interest-cost” component (included in the CPI basket with a weight of about 5 percent), which is affected by the amount of mortgage debt on which consumers are paying interest, varies with the value of new house prices.7 Evaluating whether house prices are overvalued (and thus subject to price declines) could have important economic and financial implications. This assessment is particularly important since it would not only affect the housing market outlook, but also the economy’s growth outlook and the prospects for the financial sector.
IV. EXISTING LITERATURE
The related literature reviewed here is confined to recent research on housing market developments, especially in Canada. Sutton (2002) uses a VAR model for a group of industrial countries and finds that Canada’s housing market was not overvalued for the period 1995Q1-2002Q2. OECD (2006) compares the user cost to actual price of housing and finds that Canadian house prices were 13 percent overvalued in 2004. The IMF (2004, 2008, 2009) analyzes house price valuations across a large group of industrial countries and finds that developments in the Canadian housing market are essentially explained by economic fundamentals (such as per capita disposable income, short-term interest rates, credit and working-age population growth, and stock market developments). A cross-country commentary by Goldman Sachs (2008a) claims that the increase in real house prices in Canada, Norway and Australia, and the related deterioration in house purchase affordability needs to be evaluated against the backdrop of a large favorable terms-of-trade shock from commodity exports. Tomura (2008) also explores the link between housing price developments and terms-of-trade shocks using a theoretical dynamic stochastic general equilibrium framework. He finds that for a small open economy a terms-of-trade improvement could cause a housing boom-bust cycle if the duration of the improvement is uncertain. The extent of the housing boom and bust is larger if there is better access to international financial markets or if the loan-to-value ratio increases.
7 In contrast, the owner’s equivalent rent concept in the U.S. CPI does not provide a direct role for house prices.
9
Looking at regional developments across Canada, Somerville and Swann (2008) using single-family detached house prices, rent, and cost data for various metropolitan areas in the second quarter of 2008 find that prices are in balance with rent only in Toronto; in Halifax, Montreal, Ottawa, Regina and Winnipeg prices are around 20-25 percent overvalued, in Calgary and Vancouver they are seven and eleven percent overvalued, respectively, while in Edmonton they are 8 percent undervalued. On the other hand, Merrill Lynch (2008) finds that on the national basis, Canadian house prices were around 9 percent overvalued in mid-2008, with housing markets in Regina and Saskatoon overvalued by close to 50 percent. Vancouver and Victoria were found to be around 35 percent overvalued, while Calgary, Edmonton, Sudbury and Montreal were more than 10 percent overvalued. Tsounta (2009), using a cointegration analysis, also finds some overvaluation in the west in mid-2008, though the degree of overvaluation was significantly smaller than Merrill Lynch’s finding. Allen et al. (2006), on the other hand, examining the long-run relationship between city house prices in Canada from 1981 to 2005, find that they are only weakly correlated in the long run, and that there is a disconnect between house prices and interest rates. They find that city-specific variables (such as union wage levels and building permits) tend to be positively related to prices. Several studies explore the duration of housing cycles in Canada. Cunningham and Kolet (2007) find that U.S. and Canadian housing cycles are strongly correlated, averaging five years of expansions and four years of contraction. Goldman Sachs (2008b) compares and contrasts housing cycles in various OECD counties, and finds that the December 1989–September 1998 housing market slowdown in Canada was the fourth-longest of 24 busts among OECD countries.8 At 35 quarters, the Canadian housing cycle was behind Japan’s 67-quarter bust during the 1990s, Germany’s post-unification slump of 52-quarters and Switzerland’s 45 quarter downturn during the 1990s. In terms of price declines, Canada’s 1990s slump was the second smallest at 16 percent decline in real prices (after Germany’s 15 percent decline during the 1980s). There is considerable uncertainty about the right technique to model equilibrium house prices. Papers that cite limitations in identifying the determinants of house prices include Allen et al. (2006), Klyuev (2008), and IMF (2004). The results from evaluating house price developments econometrically are also subject to a number of valid criticisms. For instance, Gallin (2003), Gurkaynak (2005), Kluyev (2008), and Girouard et al. (2006) discuss several drawbacks from using an econometric approach to estimate the existence of a housing bubble, including the possibility that the estimated relationship be unstable or that the “house price gap” might reflect variables omitted from the model (e.g., macroeconomic volatility, inward migration) instead of being a measure of overvaluation. In contrast, Malpezzi (1999), which includes a review of past literature on error correction models, outlines the merits of using such a model in analyzing house prices.
8 The study examines instances in OECD countries where real house prices have fallen by more than 15 percent since 1970.
10
V. ECONOMETRIC MODEL AND RESULTS
The price measure used is the existing home price from the Canadian Real Estate Association's Multiple Listing Service (MLS) database, and is deflated by each province’s CPI for the period 1993Q1-2009Q2.9 We examine current valuations against economic fundamentals using quarterly regional data—such as disposable income, demographic developments, and mortgage credit (see WEO (2004) and Malpezzi (1999) on specifications of house price valuation). The analysis is based on an error-correction model, which combines the long-run, cointegrating relationship among the variables in levels and the short-run relationships among the first differences of the variables, separately for each of the five provinces considered, namely Alberta, British Columbia, Quebec, Ontario, and Saskatchewan.
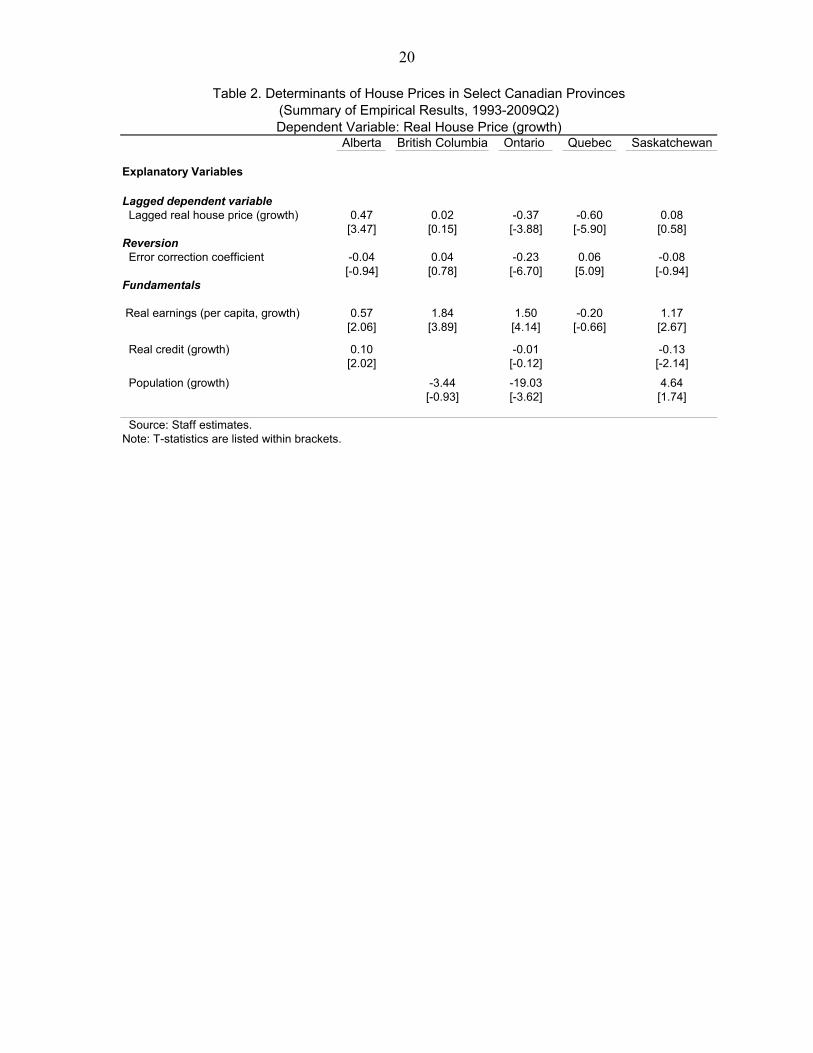
According to the Augmented Dickey-Fuller test, the logs of real home prices, real per capita earnings, real credit and population are all integrated of order one. When testing for the existence of a cointegrating relationship for all variables considered, we find that for some provinces, a single cointegrating relationship only exists for a more parsimonious specification. Specifically, Johansen’s trace test and maximum eigenvalue test indicate the existence of one cointegrating equation between these variables at the 1 percent level for Ontario and Saskatchewan.10 Statistical tests also indicate the existence of a cointegrating relationship, again at the 1 percent significance level, between the logs of real home prices, the log of real per capita earnings and real credit for Alberta, while for Quebec there is a cointegrating relationship between home prices and earnings. The cointegrating relationship in British Columbia includes home prices, earnings and population, and is again significant at the 1 percent level. The error-correction model postulates that the growth rate of real houses is explained by a combination of the following factors (depending on the province considered) (Table 2):
o Past growth rates of real house prices. For most provinces, we find that the current growth rate is positively correlated with the past growth rate.
o Reversion to fundamentals implied by the long-run equation. We find that for most provinces (with the exception of Quebec and British Columbia, which is not statistically significant), the growth rate of house prices shows long-run reversion to the equilibrium prices derived from the model, implying that prices would tend to fall when they are out of line with fundamentals.
9 While private banks and other forecasters have recently developed new indices on house prices (e.g., adjusting for quality), CREA’s sales weighted index remains the most widely used, including by Canada’s Mortgage and Housing Corporation (CMHC) and Finance Canada, as a major economic indicator given its larger sample size (all provinces, more years, all sales by realtors). This measure exhibits the largest volatility, including large upswings, does not take into account compositional effects, and in that respect it should represent an upper limit in terms of any overvaluation.
10 These pre-test results are available upon request.
11
e
, but
o Economic fundamentals. For all provinces (except Quebec which is statistically insignificant), we find that the growth rate of house prices is positively affected by (per capita) real income growth, which increases households’ purchasing power and borrowing capacity. The growth rate of house prices is positively affected by mortgage credit growth (higher rates indicate that households are less credit rationed) in the case of Alberta. Population growth (as a proxy for the growth rate of households) positively affects house prices only in Saskatchewan.
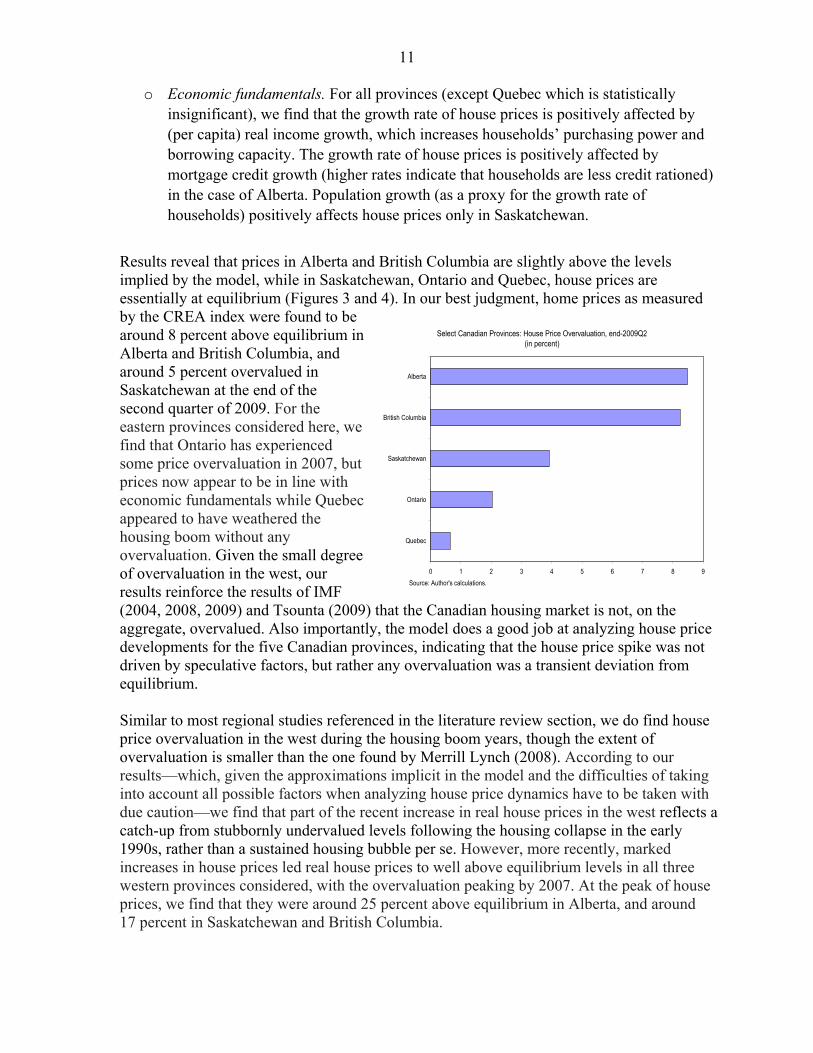
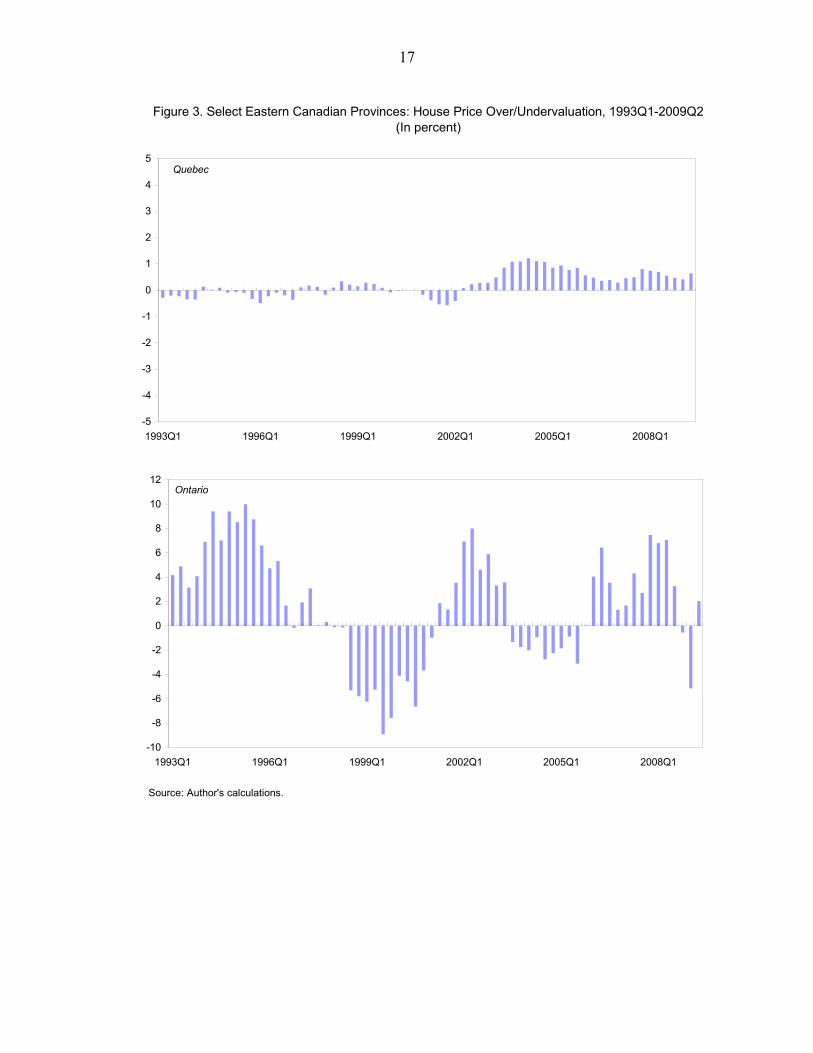
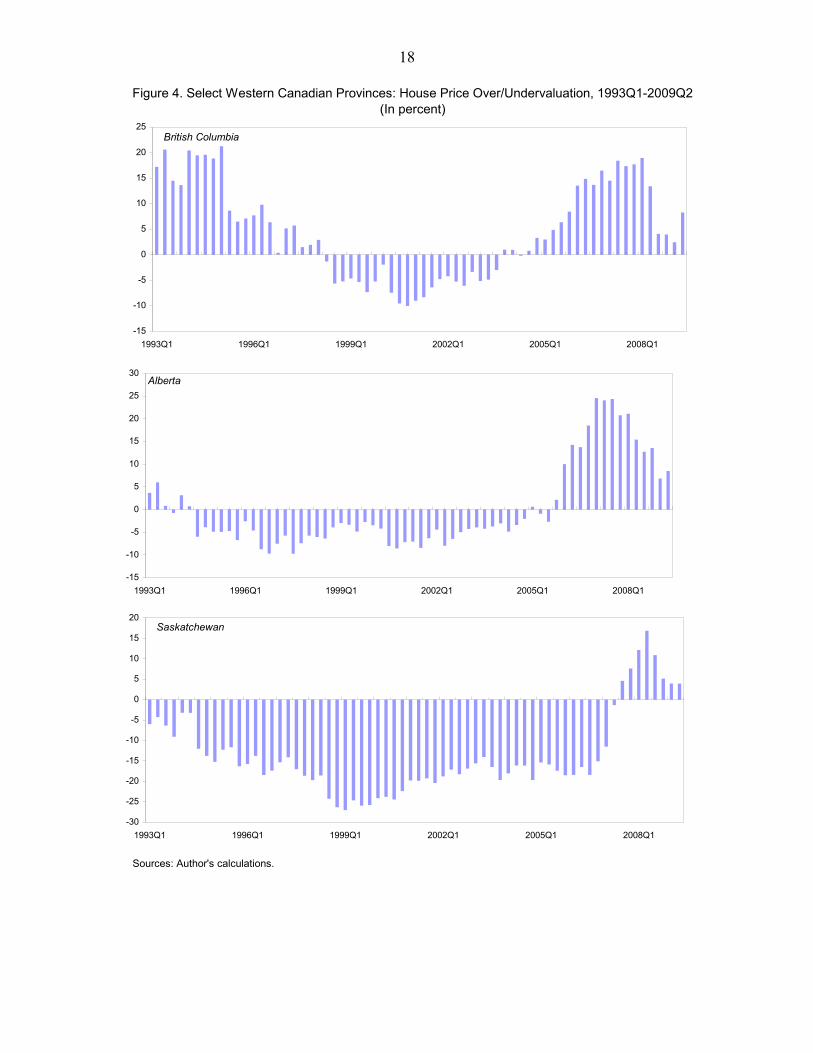
Results reveal that prices in Alberta and British Columbia are slightly above the levels implied by the model, while in Saskatchewan, Ontario and Quebec, house prices are essentially at equilibrium (Figures 3 and 4). In our best judgment, home prices as measured by the CREA index were found to be around 8 percent above equilibrium in Alberta and British Columbia, and around 5 percent overvalued in Saskatchewan at the end of the second quarter of 2009. For the eastern provinces considered here, wfind that Ontario has experienced some price overvaluation in 2007prices now appear to be in line with economic fundamentals while Quebec appeared to have weathered the housing boom without any overvaluation. Given the small degree of overvaluation in the west, our results reinforce the results of IMF (2004, 2008, 2009) and Tsounta (2009) that the Canadian housing market is not, on the aggregate, overvalued. Also importantly, the model does a good job at analyzing house price developments for the five Canadian provinces, indicating that the house price spike was not driven by speculative factors, but rather any overvaluation was a transient deviation from equilibrium.
0 1 2 3 4 5 6 7 8 9
Quebec
Ontario
Saskatchewan
British Columbia
Alberta
Source: Author's calculations.
Select Canadian Provinces: House Price Overvaluation, end-2009Q2(in percent)
Similar to most regional studies referenced in the literature review section, we do find house price overvaluation in the west during the housing boom years, though the extent of overvaluation is smaller than the one found by Merrill Lynch (2008). According to our results—which, given the approximations implicit in the model and the difficulties of taking into account all possible factors when analyzing house price dynamics have to be taken with due caution—we find that part of the recent increase in real house prices in the west reflects a catch-up from stubbornly undervalued levels following the housing collapse in the early 1990s, rather than a sustained housing bubble per se. However, more recently, marked increases in house prices led real house prices to well above equilibrium levels in all three western provinces considered, with the overvaluation peaking by 2007. At the peak of house prices, we find that they were around 25 percent above equilibrium in Alberta, and around 17 percent in Saskatchewan and British Columbia.
12
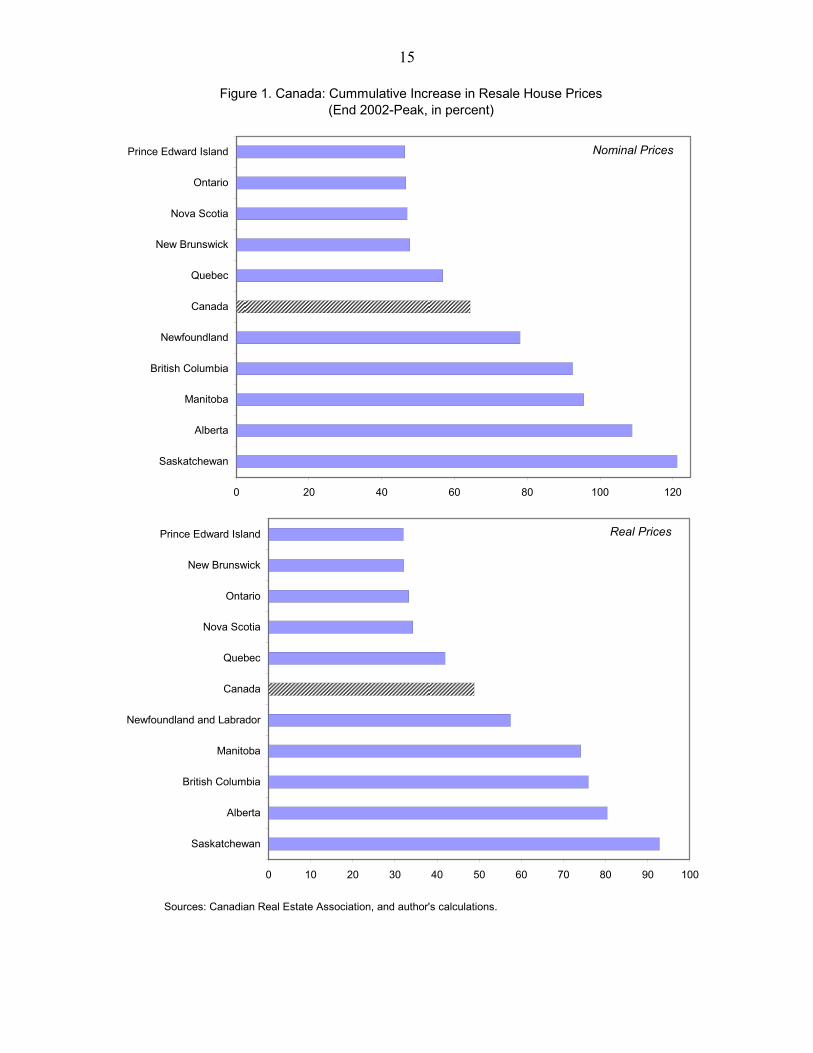
VI. CONCLUSIONS
In the last few years, home prices have first risen significantly in Canada, especially in the western provinces, and then declined markedly. This paper uses an error-correction model to assess the current extent of overvaluation in provincial house prices as measured by the CREA index. The results—which given the approximations implicit in the model and the difficulties of taking into account all possible factors in analyzing house price dynamics have to be taken with due caution—suggest that part of the increase in real house prices in the west during the late 2000s can be seen as a return to equilibrium following some “underreaction” of house prices during the 1990s (after a housing market collapse). However, more recently, marked increases in house prices led real house prices to overshoot equilibrium levels in all three western provinces considered here, with the overvaluation peaking by 2007. At the peak of house prices, we find that house prices were around 25 percent above equilibrium in Alberta, and around 17 percent in Saskatchewan and British Columbia. In late 2007/early 2008, declining house prices have caused a large contraction in the extent of price overvaluation, now at around 8 percent for British Columbia and Alberta, and 5 percent for Saskatchewan. For the eastern provinces, we find that Ontario has experienced some price overvaluation in 2007, but prices now appear to be in line with equilibrium. Quebec appeared to have weathered the housing boom without any overvaluation. Our work generally confirms previous work (e.g., Tsounta (2009), and IMF (2004, 2008, 2009)), which find that while house prices might be a bit overvalued in the west, overall they are close to equilibrium.
The authorities have addressed possible housing market concerns in recent years, which could be important to explain Canada’s housing market performance. They have purchased mortgage-backed securities, expanded the Canada Mortgage Bond program to 10-year (from five-year) maturity, enhanced liquidity, lowered mortgage rates, and announced a temporary home-renovation tax credit. In order to protect the Canadian housing market from bubbles, the authorities have also lowered the maximum amortization period for new government-backed mortgages to 35 years, required a minimum down-payment of five per cent for new government-backed mortgages, established a consistent minimum credit score requirement, and introduced new loan documentation standards. These rules, set by CMHC, limited the risk of relaxation of lending standards, and as such limited Canada’s exposure to the subprime market.
Given that the overvaluation in western provinces is subdued, we don’t expect to have large negative implications for the rest of Canada. With Alberta and British Columbia accounting for almost a third of Canada’s GDP and a fourth of Canada’s employment, an abrupt correction in their housing market could have had adverse spillovers to the rest of Canada. However, this is not expected to happen given that (i) the degree of misalignment is small, (ii) the housing market is already showing some encouraging signs of revival and (iii) commodity prices, which are closely linked with earning performance in the west, have risen considerably from their lows in late 2008.
13
References
Allen, J., R. Amano, D. R. Byrne, and A.W. Gregory (2006), “Canadian City Housing Prices and Urban Market Segmentation,” Working Paper 2006-49, Bank of Canada.
Cunningham, R. and I. Kolet (2007), “Housing Market Cycles and Duration Dependence in the United States and Canada,” Working Paper 2007-2, Bank of Canada.
Gallin, J. (2003), “The Long-run Relationship Between House Prices and Incomes: Evidence
from Local Housing Markets,” Finance and Economics Discussion Series, No. 2003-17, Board of Governors of the Federal Reserve System.
Girouard, N., M. Kennedy, P. van den Noord, and C. André (2006), “Recent House Price
Developments: The Role of Fundamentals,” Economics Department Working Papers, No. 475, OECD Publishing.
Goldman Sachs (2008a), “Houses in the Industrial Countries: Built on Rock, Or on Sand?”
Global Economics Weekly No. 08/18, May. _____ (2008b), Global Economics Weekly, April. Gurkaynak, R. (2005), “Econometric Tests of Asset Price Bubbles: Taking Stock,” Finance
and Economics Discussion Series, No. 2005-04, Board of Governors of the Federal Reserve System.
IMF (2009), World Economic Outlook: Crisis and Recovery, April, Washington, DC:
International Monetary Fund. _____ (2008), World Economic Outlook: Housing and the Business Cycle, April,
Washington, DC: International Monetary Fund. _____ (2004), World Economic Outlook: The Global Demographic Transition, September,
International Monetary Fund. Kiff J. (2009), “Canadian Residential Mortgage Markets: Boring But Effective?” Working
Paper No. 09/130, Washington, DC: International Monetary Fund. Klyuev, V. (2008), “What Goes Up Must Come Down? House Price Dynamics in the United
States,” Working Paper No. 08/187, Washington, DC: International Monetary Fund. Malpezzi, S. (1999), “A Simple Error Correction Model of House Prices,” Journal of
Housing Economics, Vol. 8, pp. 27–62. Merrill Lynch (2008), “The Tipping Point?” Canadian Economic Commentary, September.
14 Somerville, S. and K. Swann (2008), “Are Canadian Housing Markets Over-priced?”
Working Paper 2008-01, Center for Urban Economics and Real Estate, University of British Columbia.
Sutton, G. (2002), “Explaining Changes in House Prices,” Quarterly Review, September,
Bank for International Settlement. Tomura, H. (2008), “A Model of Housing Boom and Bust in a Small Open Economy,”
Working Paper, 2008-9, Bank of Canada.
Tsounta, E. (2009),”Is the Canadian Housing Market Overvalued? A Tale of Two Regions,” Canada―Selected Issues, Country Report No. 09/163, Washington, DC: International Monetary Fund.
15
Figure 1. Canada: Cummulative Increase in Resale House Prices(End 2002-Peak, in percent)
Sources: Canadian Real Estate Association, and author's calculations.
0 20 40 60 80 100 120
Saskatchewan
Alberta
Manitoba
British Columbia
Newfoundland
Canada
Quebec
New Brunswick
Nova Scotia
Ontario
Prince Edward Island
0 10 20 30 40 50 60 70 80 90 100
Saskatchewan
Alberta
British Columbia
Manitoba
Newfoundland and Labrador
Canada
Quebec
Nova Scotia
Ontario
New Brunswick
Prince Edward Island
Nominal Prices
Real Prices
16
Figure 2. G-7: Price-to-income and price-to-rent ratios, 1970-2009
Source: OECD; and author's calculations.
40
60
80
100
120
140
160
180
1970 1973 1976 1979 1982 1985 1988 1991 1994 1997 2000 2003 2006 2009
USA
JPN
DEU
FRA
ITA
GBR
CAN
Price to income ratio (Sample average=100)
40
60
80
100
120
140
160
180
200
1970 1973 1976 1979 1982 1985 1988 1991 1994 1997 2000 2003 2006 2009
USA
JPN
DEU
FRA
ITA
GBR
CAN
Price to rent ratio (Sample average=100)
17
Figure 3. Select Eastern Canadian Provinces: House Price Over/Undervaluation, 1993Q1-2009Q2
(In percent)
Source: Author's calculations.
-5
-4
-3
-2
-1
0
1
2
3
4
5
1993Q1 1996Q1 1999Q1 2002Q1 2005Q1 2008Q1
Quebec
-10
-8
-6
-4
-2
0
2
4
6
8
10
12
1993Q1 1996Q1 1999Q1 2002Q1 2005Q1 2008Q1
Ontario
18
Figure 4. Select Western Canadian Provinces: House Price Over/Undervaluation, 1993Q1-2009Q2(In percent)
Sources: Author's calculations.
-30
-25
-20
-15
-10
-5
0
5
10
15
20
1993Q1 1996Q1 1999Q1 2002Q1 2005Q1 2008Q1
Saskatchewan
-15
-10
-5
0
5
10
15
20
25
30
1993Q1 1996Q1 1999Q1 2002Q1 2005Q1 2008Q1
Alberta
-15
-10
-5
0
5
10
15
20
25
1993Q1 1996Q1 1999Q1 2002Q1 2005Q1 2008Q1
British Columbia
19
Canada Quebec Ontario Alberta British Columbia Saskatchewan
Houses and Land1995-2005 0.3 1.3 0.6 2.0 -2.0 1.22006Q4 9.7 3.2 2.4 40.7 5.9 10.72007Q4 3.7 2.3 0.5 7.7 4.4 33.22008Q4 -1.0 3.3 0.5 -7.3 -3.5 7.92009Q1 -2.9 3.4 -0.6 -10.8 -6.9 0.72009Q2 -3.2 3.1 -0.9 -9.2 -8.5 -5.2
New Houses Only1995-2005 0.9 1.5 1.5 2.6 -2.5 1.42006Q4 10.0 3.0 3.2 38.5 9.6 10.22007Q4 3.4 2.4 1.0 5.0 4.3 37.82008Q4 -2.0 2.7 1.0 -11.5 -5.3 5.72009Q1 -4.0 2.8 -0.5 -14.0 -10.9 -2.62009Q2 -4.4 2.7 -1.2 -10.9 -14.5 -8.3
Land Only1995-2005 -0.9 0.9 -1.2 0.7 -1.3 0.42006Q4 9.0 3.9 0.8 44.9 -0.2 12.52007Q4 4.4 2.0 -0.6 13.7 4.8 17.82008Q4 1.2 5.3 -0.4 2.0 -1.1 15.52009Q1 -0.6 5.6 -0.9 -4.1 -0.9 13.02009Q2 -1.1 4.7 -0.3 -5.9 0.1 6.2
Source: Haver Analytics; Fund staff calculations.
(percentage change, year over year)Table 1: Real Prices of New Houses and Land, 1995-2009Q2
20
Alberta British Columbia Ontario Quebec Saskatchewan
Explanatory Variables
Lagged dependent variable Lagged real house price (growth) 0.47 0.02 -0.37 -0.60 0.08
[3.47] [0.15] [-3.88] [-5.90] [0.58]Reversion Error correction coefficient -0.04 0.04 -0.23 0.06 -0.08
[-0.94] [0.78] [-6.70] [5.09] [-0.94]Fundamentals
Real earnings (per capita, growth) 0.57 1.84 1.50 -0.20 1.17[2.06] [3.89] [4.14] [-0.66] [2.67]
Real credit (growth) 0.10 -0.01 -0.13[2.02] [-0.12] [-2.14]
Population (growth) -3.44 -19.03 4.64[-0.93] [-3.62] [1.74]
Source: Staff estimates. Note: T-statistics are listed within brackets.
Dependent Variable: Real House Price (growth)
Table 2. Determinants of House Prices in Select Canadian Provinces(Summary of Empirical Results, 1993-2009Q2)