overvalued equity and financing decisions
TRANSCRIPT
[15:47 30/10/2012 OEP-hhs112.tex] Page: 3645 3645–3683
Overvalued Equity and Financing Decisions
Ming DongSchulich School of Business, York University
David HirshleiferMerage School of Business, University of California
Siew Hong TeohMerage School of Business, University of California
We test whether and how equity overvaluation affects corporate financing decisions usingan ex ante misvaluation measure that filters firm scale and growth prospects from marketprice. We find that equity issuance and total financing increase with equity overvaluation,but only among overvalued stocks, and that equity issuance is more sensitive than debtissuance to misvaluation. Consistent with managers catering to maintain overvaluationand with investment-scale economy effects, the sensitivity of equity issuance and totalfinancing to misvaluation is stronger among firms with potential growth opportunities (lowbook-to-market, high R&D, or small size) and high share turnover. (JEL G14, G32, M41)
The inefficient markets approach to corporate finance predicts that a firm willraise more capital when it can obtain a higher price relative to fundamentalvalue for the securities that it issues, and a relatively low price for the securitiesthat it repurchases. By issuing more, the firm generates a profit for its existingshareholders, which, ceteris paribus, increases the long-term stock price.Furthermore, overoptimistic market valuations of investment opportunitiescan encourage firms to take actions to confirm such expectations (Polk andSapienza 2009). To do so, firms may need to raise external capital. Thus,several inefficient markets theories imply that firms will raise more capitalin response to overvaluation (Stein 1996; Baker, Stein, and Wurgler 2003;Gilchrist, Himmelberg, and Huberman 2005; see also the survey of Baker,Ruback, and Wurgler 2007).
Because equity is more sensitive than debt to firm value, misvaluation effectsshould be stronger for equity than for debt issuance. Greater net issuance of
We thank Ling Cen, Marie Dutordoir, Alois Geyer, Chuan Yang Hwang, Danling Jiang, Sonya Seongyeon Lim,Angie Low, Zheng Sun, Chris Veld, the editor (Matt Spiegel), and an anonymous referee; seminar participants atINSEAD, McMaster University, Nanyang Tech University, University of Glasgow, University of Iowa, Universityof Notre Dame, University of Roma, USC, University of Vienna, and Washington University for very helpfulcomments; Lin Sun and Feng Zhan for excellent research assistance; and the Social Sciences and HumanitiesResearch Council of Canada for financial support. Send correspondence to Ming Dong, Schulich School ofBusiness, York University, Toronto, Ontario M3J 1P3, Canada; telephone: (416) 736-2100 ext. 77945. E-mail:[email protected].
© The Author 2012. Published by Oxford University Press on behalf of The Society for Financial Studies.All rights reserved. For Permissions, please e-mail: [email protected]:10.1093/rfs/hhs112 Advance Access publication October 28, 2012
at University of C
alifornia, Irvine on July 5, 2013http://rfs.oxfordjournals.org/
Dow
nloaded from
[15:47 30/10/2012 OEP-hhs112.tex] Page: 3646 3645–3683
The Review of Financial Studies / v 25 n 12 2012
overvalued equity allows the firm to maximize the profit it extracts from newsecurityholders. This is desirable both for existing shareholders, and for amanager who wishes to increase long-term stock price. Thus, the inefficientmarkets approach suggests that net equity issuance will be more positivelysensitive than net debt issuance to overvaluation.
Jensen (2004, 2005) argues that the effects of misvaluation on managerialbehavior are especially strong among firms whose equity is substantiallyovervalued. As he discusses, the managers of firms with overvalued equityface especially intense pressure to prepare to undertake ambitious programsof investment that cater to optimistic market expectations about the firm’sprospects. Furthermore, overvalued firms should be eager to raise inexpensivecapital, including equity.
A further reason why variations in misvaluation should have a stronger effecton issuance and investment among overvalued firms derives from project-scaleeconomies. If some investment projects have a minimum efficient scale, thenovervalued firms will tend to find it more attractive than undervalued firms toraise capital for purposes of investment. If undervalued firms relatively oftenreject the relevant project, on average a marginal increase in valuation willhave relatively little effect. In contrast, among firms whose high overvaluationencourages them to adopt the relevant project, an increase in overvaluationencourages a greater scale of issuance and investment.
We test here whether and why overvaluation causes firms to raise more netcapital, especially equity. To evaluate hypotheses for why overvaluation affectsfinancing decision, we test how the sensitivity of issuance to misvaluation variesacross valuation, size, turnover, book-to-market, R&D, and insider tradingsubsamples.
Our approach to testing for misvaluation effects upon net issuance is toapply a single overall measure of misvaluation. By definition, mispricing affectsmarket price; the challenge is to identify a good fundamental benchmark forcomparison, so that the deviation between price and fundamental is a relativelypure measure of misvaluation. For this purpose we use a forward-lookingbenchmark measure of fundamental value. Doing so filters the contaminatingeffects of prospects for future investment opportunities from market price.This is crucial, as superior investment opportunities is a distinct cause ofnew financing. In this respect our misvaluation measure greatly reduces theconfounding of growth prospects and misvaluation effects that is present inpast studies that relate either past returns or current market valuations to newissues.
Specifically, we apply the residual income model of Ohlson (1995) toobtain a measure of fundamental value, sometimes called “intrinsic value”(V ); we measure misvaluation by V/P , the deviation of market price from thisvalue. V/P is a strong predictor of future abnormal returns (Frankel and Lee1998; Lee, Myers, and Swaminathan 1999), and has been applied to study thedeterminants of repurchases (D’Mello and Shroff 2000), and takeover-related
3646
at University of C
alifornia, Irvine on July 5, 2013http://rfs.oxfordjournals.org/
Dow
nloaded from
[15:47 30/10/2012 OEP-hhs112.tex] Page: 3647 3645–3683
Overvalued Equity and Financing Decisions
behaviors (Dong et al. 2006). Intrinsic value reflects not only current bookvalue, but also a discounted value of analyst forecasts of future earnings. Wediscuss the justification for V/P as a misvaluation proxy in Section 3.
In contrast, possible misvaluation measures such as Tobin’s q or equitymarket-to-book rely on a backward-looking value measure, book value, for theirfundamental benchmarks. Such valuation ratios therefore reflect informationabout the ability of the firm to generate high returns on its book assets. Indeed,many studies have viewed Tobin’s q or related variables as proxies for firmcharacteristics other than misvaluation, such as earnings growth prospects,investment opportunities, or managerial effectiveness. So, using q or market-to-book, it is not possible to distinguish misvaluation from other rational effects.1
Furthermore, Tobin’s q is a measure of total firm valuation; to measure the firm’saccess to cheap equity capital, we need a measure of equity misvaluation.
To test for misvaluation effects, we perform both quintile sorting by V/P
or B/P ratios, and regressions that include further controls for other possibledeterminants of security issuance, including growth opportunities (proxied by q
or equity book-to-market),2 cash flow, return on assets, leverage, and firm age.We find that greater (more positive) mispricing is associated with greater netequity issuance and total (debt plus equity) issuance. This evidence is consistentwith the hypothesis that overvaluation induces firms to raise cheap capital,especially equity.
To test whether overvalued equity intensifies misvaluation effects, aspredicted by the aforementioned catering and misvaluation/scale economiesarguments, we sort firms based upon V/P ratios, and examine the sensitivityof net issuance to valuation within different misvaluation quintiles. Consistentwith the hypothesis, we find that it is only among overvalued stocks that equitymisvaluation positively affects new issues.
If insider stock selling intensifies when insiders know their firm’s equity isovervalued (Jenter 2005), we expect insider net selling to be associated withequity overvaluation. It follows from the arguments above that the sensitivity ofequity issuance to V/P should be greater when insider net selling is high. Therequirement of nonmissing insider trading data severely reduces sample size,but even in this subsample we find that the marginal effect of V/P on equityissuance is significantly greater among firms with high net insider selling.
To probe further into why misvaluation affects financing decisions, wetest how other conditioning variables affect the sensitivity of net issuance tomisvaluation. The hypotheses are developed in more depth in Section 2. Inaddition to sorting by the mispricing proxies themselves (V/P and insider
1 To the extent that our filter is imperfect, variation in our purified measure is not fully purged of firm growthprospects. If this problem were severe, we would expect V/P to have a high absolute correlation with q. In oursample, the correlation with q is not especially strong (–0.27). Nevertheless, as a precaution, we additionallycontrol for growth prospects as proxied by book-to-market in our tests.
2 Tobin’s q and equity book-to-market should be correlated with misvaluation as well as growth. Controlling forthese variables therefore provides conservative tests for misvaluation effects.
3647
at University of C
alifornia, Irvine on July 5, 2013http://rfs.oxfordjournals.org/
Dow
nloaded from
[15:47 30/10/2012 OEP-hhs112.tex] Page: 3648 3645–3683
The Review of Financial Studies / v 25 n 12 2012
selling, as just discussed), we sort firms into subsamples according to firm size,share turnover, B/P , and R&D.
For a manager to cater to investor overvaluation of growth opportunities,the firm plausibly must seem to have such opportunities. Furthermore, scaleeconomies in new projects will only matter for firms that have potentiallyattractive new projects. So, both arguments imply a greater sensitivity ofissuance to misvaluation among firms that derive greater potential value fromgrowth opportunities. We test this by comparing the sensitivity of issuanceto V/P across subsamples selected by R&D, firm size, and book-to-market.Consistent with these hypotheses, we find that firms that are in lower quintiles ofsize and book-to-market, and higher quintiles of R&D, have higher sensitivitiesof equity issuance and total financing to misvaluation.3
Even a manager who is focused on long-term value will issue more equitywhen it is overvalued, as doing so generates a profit for the firm (Stein 1996).However, to the extent that the manager values a higher stock price per se,there is a further incentive to issue if this enables investments that cater tooptimistic investor perceptions. Because a short-term horizon makes equityfinancing of overvalued projects more attractive, the sensitivity of new issuesto misvaluation should be higher when managers are more heavily focusedon short-run stock prices. Following Polk and Sapienza (2009), who test forcatering in investment choices, we use turnover as a proxy for short-termfocus on the part of shareholders. We find that the sensitivity of new issuesto misvaluation is higher among high-turnover firms. This is consistent withthe hypothesis that managerial catering to investor overvaluation is one of thereasons for the misvaluation/issuance relationship.
Owing to opposing forces of misvaluation on debt issuance, on theoreticalgrounds debt issuance could either increase or decrease with misvaluation. Onthe one hand, overvaluation encourages the issuance of risky debt, owing tothe benefit of selling an overvalued security, and for the sake of undertakingprojects that cater to investor optimism. On the other hand, for a given amountof financing, greater overvaluation causes substitution from debt to equityissuance. We find an overall insignificant relation between debt issuance andovervaluation, though debt issuance decreases with overvaluation before 1990.
Several kinds of evidence from previous research are potentially consistentwith the predictions of the inefficient markets approach to financing decisions.Evidence that new issue firms have high market-to-book ratios and earnlow post-event returns has sometimes been interpreted as a consequence of
3 A subtle caveat, discussed in Subsection 5.2, is that there is greater scope for the market to misvalue, eitherpositively or negatively, growth opportunities than tangible assets in place. But within subsamples that are moreprone to misvaluation, we expect V/P to be a better proxy for misvaluation, strengthening the sensitivity ofissuance to V/P . This possibility is most likely to be important for the firm size categorization, owing to lowertransparency and ease of arbitrage in small firms. To the extent that this caveat applies, evidence of high issuancesensitivity among small firms provides further corroboration of the basic hypothesis that misvaluation affectsissuance, rather than further evidence about why this relationship exists.
3648
at University of C
alifornia, Irvine on July 5, 2013http://rfs.oxfordjournals.org/
Dow
nloaded from
[15:47 30/10/2012 OEP-hhs112.tex] Page: 3649 3645–3683
Overvalued Equity and Financing Decisions
market timing by firms to exploit mispricing. However, valuation ratios suchas market-to-book are heavily influenced by firm risk and growth rates, notjust misvaluation, and hence do not isolate the effects of market inefficiency.Furthermore, extensive controversy remains about whether apparent long-runpost-issue abnormal return performance is a consequence of mispricing or ofrational risk premia.
More broadly, existing evidence suggestive of misvaluation effects onfinancing is indirect, subject to severe measurement error, and/or subject tomultiple interpretations. In Section 1, we discuss more fully why existingevidence does not conclusively resolve whether market inefficiency affectsfinancing decisions, and why our approach provides clearer evidence that thisis the case. In addition, our tests provide new insights about the mechanism bywhich market inefficiency affects financing decisions.
1. Existing Empirical Approaches to Misvaluation and Financing
We explain here why evidence from existing studies is not conclusive aboutwhether inefficient misvaluation affects new financing, and how our approachprovides distinct and in some ways more direct insight about how and whyovervalued equity affects financing decisions.
The fact that new issues occur after stock price runups (Eckbo and Masulis1995) is potentially consistent with an effect of misvaluation on financingbehavior. However, Korajczyk, Lucas, and McDonald (1991) and Bayless andChaplinsky (1996) show that a rational setting with asymmetric informationalso generates such a pattern, and provide evidence consistent with informationasymmetry effects. Furthermore, under the rational q theory of investment(Brainard and Tobin 1968; Tobin 1969), a stock price runup or a high stockprice relative to book value indicates an improvement in growth opportunities,which encourages the firm to invest more, and perhaps to raise more capital asfinancing.
The second type of evidence is the new issues puzzle—the returnunderperformance after new securities issues, with more severe underperfor-mance after equity issuances than after debt issuances (equity, Ritter 1991;Loughran and Ritter 1995; debt, Spiess and Affleck-Graves 1995); and itscounterpart, overperformance after repurchases (Lakonishok and Vermaelen1990; Ikenberry, Lakonishok, and Vermaelen 1995; Peyer and Vermaelen2009). This evidence has stimulated debate about the methodology of long-run abnormal return tests and the choice of risk factor benchmarks (e.g., Fama1998; Loughran and Ritter 2000; Lyandres, Sun, and Zhang 2008). In contrast,evidence that the firm-level debt versus equity composition of net financingdoes not predict future returns has been interpreted as opposing the hypothesisthat issuance choices are designed to exploit mispricing (Butler et al. 2011).
A reason why the benchmark and methodological issues are so salient isthat long-run returns contain large amounts of noise associated with ex post
3649
at University of C
alifornia, Irvine on July 5, 2013http://rfs.oxfordjournals.org/
Dow
nloaded from
[15:47 30/10/2012 OEP-hhs112.tex] Page: 3650 3645–3683
The Review of Financial Studies / v 25 n 12 2012
fundamental news that arrives about stocks over time. Our ex ante measures ofmisvaluation, though imperfect, avoid this very large source of noise.
Furthermore, for the purposes of testing the causal effect of misvaluation onnew issues, conditioning on new issues themselves has the drawback that firmstake actions at the time of new issue to induce misvaluation. For example, firmsengage in upward earnings management at the time of new issues, and greaterearnings management at the time of issue is associated with more negativepostissue returns (e.g., Teoh, Welch, and Wong 1998a, 1998b; Teoh, Wong,and Rao 1998). By examining preexisting misvaluation prior to the immediatenew issue period, our tests focus more sharply on how misvaluation affectsfinancing decisions (“market timing”), rather than the reverse causality fromplanned financing choice to the firm’s decision to incite overvaluation.
The third kind of evidence is that proxies for overvaluation are associatedwith greater capital expenditures and R&D (Gilchrist, Himmelberg, andHuberman 2005; Polk and Sapienza 2009; see also Titman, Wei, and Xie2004), and that the effects of stock market valuations (efficient or otherwise) oninvestment are greater for more financially constrained (“equity-dependent”)firms (Baker, Stein, and Wurgler 2003). However, this evidence is onlyindirectly related to the hypothesis that greater overvaluation increases equityissuance.
The fourth kind of evidence is that firms with higher measured overvaluationtend to use equity rather than debt as a means of payment in takeovers (e.g.,Dong et al. 2006). Although suggestive, this does not show whether equityissuance is related to misvaluation in a general sample of firms. In fact, ourfindings here of misvaluation effects on issuance are strongest among smallfirms, even though small firms are takeover bidders much less frequently thanlarge firms.
The fifth kind of evidence is that the aggregate equity share in new issuesis a negative predictor of subsequent market returns (Baker and Wurgler 2000;Henderson, Jegadeesh, and Weisbach 2006). This is consistent with the ideathat when the stock market as a whole is overvalued, the constituent overvaluedfirms substitute from debt to equity issuance. However, this evidence does notspeak to whether greater misvaluation is a predictor of greater equity issuance inthe cross-section of firms, and whether misvaluation is associated with greatertotal (debt plus equity) issuance.
The sixth kind of evidence is that, in responses to survey questions, CFOsreport that stock market valuations are an important consideration in their firms’decision to issue common stock (Graham and Harvey 2001). However, this isevidence about managerial perceptions, not actual misvaluation and issuance.If managers are overoptimistic about their firms, they may wrongly perceivetheir firm to be undervalued. Furthermore, practitioners seldom distinguishcarefully between the “misvaluation” that arises under efficient markets underasymmetric information (Myers and Majluf 1984), and misvaluation that arisesfrom market inefficiency in processing public information. In either scenario,
3650
at University of C
alifornia, Irvine on July 5, 2013http://rfs.oxfordjournals.org/
Dow
nloaded from
[15:47 30/10/2012 OEP-hhs112.tex] Page: 3651 3645–3683
Overvalued Equity and Financing Decisions
market valuations affect financing decisions, but our purpose here is specificallyto test how market inefficiency affects financing decisions.
Finally, a seventh type of evidence is based upon the association of valuationratios with equity issuance or repurchase. Previous studies find that the market-to-book ratio is positively associated with the probability that a firm conductsa seasoned equity offering (Baker and Wurgler 2002; DeAngelo, DeAngelo,and Stulz 2010; Dong et al. 2012). However, market-to-book reflects growthopportunities (among other things) as well as misvaluation, so this does notestablish whether market inefficiency affects equity issuance.4
2. Hypotheses
The inefficient markets approach to corporate finance predicts that firms willdesign financing strategies to exploit investor and market errors (e.g., Stein1996; Ljungqvist, Nanda, and Singh 2006; the survey of Baker, Ruback, andWurgler 2007). Theoretical arguments imply that firms will issue more whentheir equity is more overvalued to exploit incoming investors, and perhapsalso to maintain overly optimistic investor perceptions about investmentopportunities (Polk and Sapienza 2009; Jensen 2005).5 This leads to the firstbasic hypothesis:
Hypothesis 1. Equity issuance and total issuance increase with the degree ofovervaluation.
As the price of equity is more sensitive than the price of debt to firmmisvaluation, we predict the effect of misvaluation to be stronger for equitythan for debt.
Hypothesis 2. The sensitivity of equity issuance to misvaluation is greater(more positive) than the sensitivity of debt issuance to misvaluation.
According to Jensen (2004, 2005), pressures to raise capital and to overinvestare especially strong among overvalued firms. This conclusion is reinforcedby an argument based upon scale economies in investment. When a firm isundervalued, a project with minimum efficient scale may not be funded at all,
4 DeAngelo, DeAngelo, and Stulz (2010) and Dong et al. (2012) also use ex post market-adjusted returns as analternative proxy for misvaluation; such tests were discussed earlier. D’Mello and Shroff (2000) find that firmsthat are undervalued based upon a version of the V/P measure tend to engage in repurchase tender offers. Acrucial difference, however, is that their measure uses ex post information, ex post realized earnings. So, theirpaper is more akin to studies that document ex post abnormal returns after financing decisions than to our study,which is based upon an ex ante measure of misvaluation.
5 A disadvantage of equity issuance for a manager who cares about the short-run stock price is the more negativemarket reaction to new equity issues than to new debt issues. However, this disadvantage is present regardlessof whether or not the firm is overvalued.
3651
at University of C
alifornia, Irvine on July 5, 2013http://rfs.oxfordjournals.org/
Dow
nloaded from
[15:47 30/10/2012 OEP-hhs112.tex] Page: 3652 3645–3683
The Review of Financial Studies / v 25 n 12 2012
so that a decrease in undervaluation has little effect on issuance and investment.In contrast, for an overvalued firm that is funding such a project, greaterovervaluation can encourage an increase in project scale, thereby encouragingissuance. Thus, to evaluate these theories about why overvaluation affectsissuance, we test whether the sensitivity of equity issuance to overvaluationis higher among overvalued firms.
Hypothesis 3. The sensitivities of equity issuance and total issuance tomisvaluation are stronger among overvalued firms than among undervaluedfirms.
We further hypothesize that the effect of misvaluation on issuance will bestronger among firms with high intangibles or growth opportunities. For agencyreasons, overvalued growth firms may be especially prone to raising equitycapital to finance investments that investors are overoptimistic about (Jensen2005). Furthermore, project-scale economies should be more relevant to firmswith strong potential growth opportunities (firms with low book-to-market,high R&D, or small size). We therefore have:
Hypothesis 4. The sensitivities of total issuance and equity issuance tomisvaluation are stronger among growth firms (with low book-to-marketratios).
Hypothesis 5. The sensitivities of total issuance and equity issuance tomisvaluation are stronger among firms with a higher intensity of intangibleassets.
Hypothesis 6. The sensitivity of equity issuance and total issuance tomisvaluation is greater among small than among large firms.
To test Hypotheses 4–6 about the effects of intangibility and growth on issuance,we examine how the sensitivity of issuance to misvaluation varies between setsof firms that have different prior book-to-market ratios, R&D intensity, or sizeas measured by book asset value. (Polk and Sapienza 2009 also use R&D as aproxy for intangibility, and use R&D as a conditioning variable in testing therelation of misvaluation to capital expenditures.)
Catering to inefficient overpricing should be stronger when a firm is pressuredto have a more short-term focus (Jensen 2005; Polk and Sapienza 2009).Therefore, we predict that the sensitivity of equity issuance and total issuance tomisvaluation increases with turnover, a proxy for short-term investor pressure.Polk and Sapienza (2009) find that the sensitivity of capital expenditures
3652
at University of C
alifornia, Irvine on July 5, 2013http://rfs.oxfordjournals.org/
Dow
nloaded from
[15:47 30/10/2012 OEP-hhs112.tex] Page: 3653 3645–3683
Overvalued Equity and Financing Decisions
to discretionary accruals (a proxy for misvaluation) is positively related toturnover. This suggests, but does not directly establish, that short-term pressureincreases the sensitivity of issuance to misvaluation. We therefore have our finalhypothesis.
Hypothesis 7. The sensitivity of equity issuance and total issuance tomisvaluation is greater among firms in which shareholders have short timehorizons.
Theory is inconclusive about how overvaluation affects debt issuance. Onthe one hand, overvaluation encourages the issuance of risky debt as anovervalued security, to expropriate new buyers, and for the sake of undertakinginvestment that caters to investor optimism. On the other hand, because theequity price is more sensitive than the price of debt to firm overvaluation,greater overvaluation should cause substitution away from debt toward equityissuance.6 So, predictions for debt corresponding to the later hypotheses aboutthe effects of conditioning variables are inconclusive as well.
3. Data and Methodology
Our sample includes U.S. firms listed on NYSE, AMEX, or NASDAQ that arecovered by CRSP and Compustat and are subject to the following restrictions.We require firms to have the earnings forecast data from I/B/E/S, in addition topossessing the necessary accounting items, for the calculation of the residualincome model value to price (V/P ) ratio. Consequently, our sample starts from1976, when I/B/E/S reporting begins. We further require each valid firm-yearobservation to have nonmissing equity and debt issuance data from Compustat.Finally, we exclude financial firms (firms with one-digit SIC of 6) and utilityfirms (two-digit SIC of 49). Our final sample has a total of 58,178 firm-yearobservations between 1976 and 2009.
We examine the relation between firm security issuance levels (equity, debt,and total issuance) and the (mis)valuation level of firm’s stock (measured byB/P and V/P , described below). We measure firms’ issuances during eachfiscal year, and we measure firms’ valuation levels at the beginning of eachfiscal year, using the previous month’s valuation ratio. For example, for a firmwith a December fiscal year-end, we relate the valuation measure calculatedat the end of December 2003 to the issuances during the fiscal year ending inDecember 2004.
To align firms with different fiscal year-ends in calendar time, we use Juneas the cutoff and allow for a four-month gap from the fiscal year-end for the
6 The substitution effect need not always dominate. For example, if a firm is underleveraged owing to financingfrictions, an increase in overvaluation increases the relative benefit of issuing equity, but the absolute increasein the benefit to issuing risky debt may still trigger debt rather than equity issuance.
3653
at University of C
alifornia, Irvine on July 5, 2013http://rfs.oxfordjournals.org/
Dow
nloaded from
[15:47 30/10/2012 OEP-hhs112.tex] Page: 3654 3645–3683
The Review of Financial Studies / v 25 n 12 2012
accounting data to be publicly available. So, for calendar year t , we include firmswith fiscal year-ends that occur from March of year t −1 through February ofyear t . In portfolio sorting tests, we sort firms into valuation quintiles each year,calculate security issuances across quintiles, and aggregate over time. In theregression tests, we include several control variables described below.
3.1 Issuance and other control variablesWe measure firms’net equity and debt issuances using accounting data from theCompustat annual files. Following Baker and Wurgler (2002), equity issuance(EI) is measured as the change in book equity minus the change in retainedearnings [� book equity (Compustat item CEQ) + � deferred taxes (itemTXDB) − � retained earnings (item RE)] scaled by lagged assets, and debtissuance (DI) is the change in assets minus the change in book equity [� totalassets (itemAT) − � book equity (item CEQ) −� deferred taxes (item TXDB)]scaled by lagged assets.7 The payment of a dividend out of retained earningsdoes not affect these measures, because the reduction in book equity is offset bythe reduction in retained earnings. Total equity and debt issuance TI is definedas EI +DI . All variables, include the ones described below, are winsorized atthe 1st and 99th percentiles to mitigate the influence of outliers. We require thatthe issuance variables EI and DI and valuation measures B/P and V/P to benonmissing, but do not delete a firm-year observation simply because a certaincontrol variable is missing. Table 1, Panel A, reports summary statistics of theissuance variables.
In the multivariate tests, we control for other issuance determinants,including cash flow [item IB + item DP + RD] scaled by lagged assets [missingRD (item XRD) is set to zero], and Tobin’s q, defined as the market value ofequity plus assets minus the book value of equity [item CEQ + item TXDB]all over assets (see, e.g., Kaplan and Zingales 1997). In addition, we includeleverage (LEV ) defined as (item DLTT + item DLC)/(item DLTT + item DLC+ item SEQ) and (to control for profitability and perhaps firm risk) return onassets (ROA), defined as earnings before depreciation (item OIBDP) plus R&Dexpenses (missing RD is set to zero) scaled by total assets. Because maturefirms are less likely to issue new equity (DeAngelo, DeAngelo, and Stulz 2010),we control for firm age (AGE), defined as the number of years between thebeginning of fiscal year and the delisting date, truncated at 50 (results are notsensitive to this truncation). Finally, to further control for firm risk, we includethe loadings of the Fama-French three factors, estimated using monthly returnsover the previous five years or at least two years due to missing observations.Except for cash flow, which is measured over the fiscal year, all control variablesare measured at the start of the fiscal year. Table 1, Panel B, presents summarystatistics for these control variables.
7 Our primary results do not change if equity issuance is not net of repurchase and is restricted to be positive,where repurchase is the amount of funds used to repurchase common and preferred equity (item PRSTKC).
3654
at University of C
alifornia, Irvine on July 5, 2013http://rfs.oxfordjournals.org/
Dow
nloaded from
[15:47 30/10/2012 OEP-hhs112.tex] Page: 3655 3645–3683
Overvalued Equity and Financing Decisions
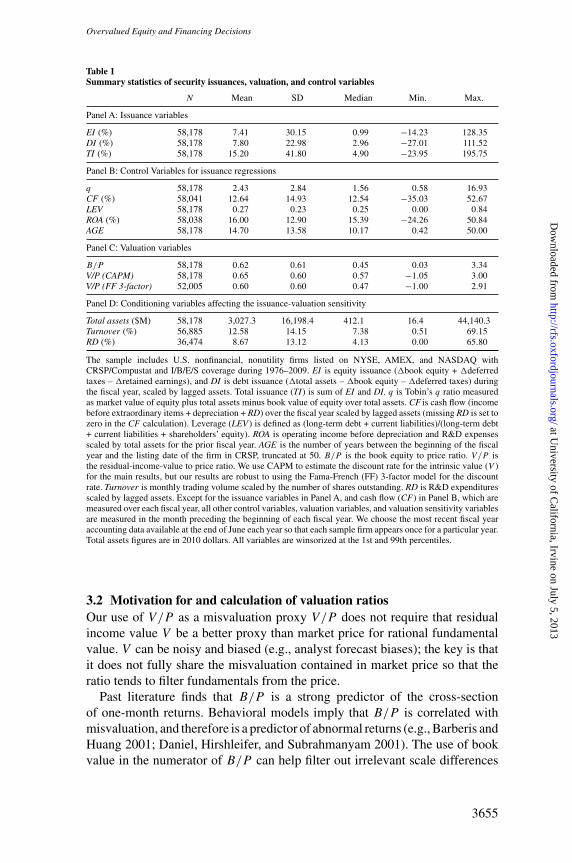
Table 1Summary statistics of security issuances, valuation, and control variables
N Mean SD Median Min. Max.
Panel A: Issuance variables
EI (%) 58,178 7.41 30.15 0.99 −14.23 128.35DI (%) 58,178 7.80 22.98 2.96 −27.01 111.52TI (%) 58,178 15.20 41.80 4.90 −23.95 195.75
Panel B: Control Variables for issuance regressions
q 58,178 2.43 2.84 1.56 0.58 16.93CF (%) 58,041 12.64 14.93 12.54 −35.03 52.67LEV 58,178 0.27 0.23 0.25 0.00 0.84ROA (%) 58,038 16.00 12.90 15.39 −24.26 50.84AGE 58,178 14.70 13.58 10.17 0.42 50.00
Panel C: Valuation variables
B/P 58,178 0.62 0.61 0.45 0.03 3.34V/P (CAPM) 58,178 0.65 0.60 0.57 −1.05 3.00V/P (FF 3-factor) 52,005 0.60 0.60 0.47 −1.00 2.91
Panel D: Conditioning variables affecting the issuance-valuation sensitivity
Total assets ($M) 58,178 3,027.3 16,198.4 412.1 16.4 44,140.3Turnover (%) 56,885 12.58 14.15 7.38 0.51 69.15RD (%) 36,474 8.67 13.12 4.13 0.00 65.80
The sample includes U.S. nonfinancial, nonutility firms listed on NYSE, AMEX, and NASDAQ withCRSP/Compustat and I/B/E/S coverage during 1976–2009. EI is equity issuance (�book equity + �deferredtaxes – �retained earnings), and DI is debt issuance (�total assets – �book equity – �deferred taxes) duringthe fiscal year, scaled by lagged assets. Total issuance (TI) is sum of EI and DI. q is Tobin’s q ratio measuredas market value of equity plus total assets minus book value of equity over total assets. CF is cash flow (incomebefore extraordinary items + depreciation + RD) over the fiscal year scaled by lagged assets (missing RD is set tozero in the CF calculation). Leverage (LEV ) is defined as (long-term debt + current liabilities)/(long-term debt+ current liabilities + shareholders’ equity). ROA is operating income before depreciation and R&D expensesscaled by total assets for the prior fiscal year. AGE is the number of years between the beginning of the fiscalyear and the listing date of the firm in CRSP, truncated at 50. B/P is the book equity to price ratio. V/P isthe residual-income-value to price ratio. We use CAPM to estimate the discount rate for the intrinsic value (V )for the main results, but our results are robust to using the Fama-French (FF) 3-factor model for the discountrate. Turnover is monthly trading volume scaled by the number of shares outstanding. RD is R&D expendituresscaled by lagged assets. Except for the issuance variables in Panel A, and cash flow (CF) in Panel B, which aremeasured over each fiscal year, all other control variables, valuation variables, and valuation sensitivity variablesare measured in the month preceding the beginning of each fiscal year. We choose the most recent fiscal yearaccounting data available at the end of June each year so that each sample firm appears once for a particular year.Total assets figures are in 2010 dollars. All variables are winsorized at the 1st and 99th percentiles.
3.2 Motivation for and calculation of valuation ratiosOur use of V/P as a misvaluation proxy V/P does not require that residualincome value V be a better proxy than market price for rational fundamentalvalue. V can be noisy and biased (e.g., analyst forecast biases); the key is thatit does not fully share the misvaluation contained in market price so that theratio tends to filter fundamentals from the price.
Past literature finds that B/P is a strong predictor of the cross-sectionof one-month returns. Behavioral models imply that B/P is correlated withmisvaluation, and therefore is a predictor of abnormal returns (e.g., Barberis andHuang 2001; Daniel, Hirshleifer, and Subrahmanyam 2001). The use of bookvalue in the numerator of B/P can help filter out irrelevant scale differences
3655
at University of C
alifornia, Irvine on July 5, 2013http://rfs.oxfordjournals.org/
Dow
nloaded from
[15:47 30/10/2012 OEP-hhs112.tex] Page: 3656 3645–3683
The Review of Financial Studies / v 25 n 12 2012
to provide a more accurate proxy for mispricing (Daniel, Hirshleifer, andSubrahmanyam 2001).
However, B/P is also potentially correlated with firm characteristics otherthan misvaluation, such as risk, growth opportunities, managerial discipline(often proxied by q measures that are highly correlated with B/P ), or thedegree of information asymmetry. Furthermore, a source of noise in B/P asa misvaluation proxy is that book value is influenced by firm and industrydifferences in accounting methods.
By using a better proxy for fundamental value in the numerator, V/P goesfurther than B/P in filtering out sources of variation other than misvaluation.For example, managerial skill and high-quality corporate governance shouldreduce B/P by raising the denominator relative to the numerator, whereas toa first approximation these should not affect V/P .
We calculate B/P as a ratio of equity rather than total asset values, as it isequity rather than total misvaluation that should matter for corporate investmentdecisions; a similar point applies for V/P . This would be the case, for example,for a firm that issues overvalued stock rather than bonds to finance an investmentproject. Also, as in Dong et al. (2006), our focus is on market inefficiency, sowe measure market misvaluation relative to publicly available information. Wetherefore calculate our misvaluation proxies solely using ex ante information(current price, book value, and analyst forecasts).
Several findings suggest that V/P is a proxy for mispricing. Lee, Myers,and Swaminathan (1999) find that aggregate residual income values predictone-month-ahead returns on the Dow 30 stocks better than does aggregateB/P . Frankel and Lee (1998) find that V is a better predictor than bookvalue of the cross-section of contemporaneous stock prices, and that V/P
is a predictor of the one-year-ahead cross-section of returns. Ali, Hwang,and Trombley (2003) report that the abnormal returns associated with highV/P are partially concentrated around subsequent earnings announcements,and that V/P predicts future returns significantly even after controlling forcharacteristics such as beta, size, book-to-market, and residual risk. In oursample, in Fama-MacBeth regressions of returns on V/P , B/P , size, andone-year past return, V/P is a stronger predictor than B/P of future returns.
Residual income value has at least two important advantages over bookvalue as a fundamental measure. First, it is invariant to accounting treatments(to the extent that the “clean surplus” accounting identity obtains; see Ohlson1995). Second, it supplements the backward-looking information contained inbook value with the forward-looking information contained in analyst earningsforecasts.
In our sample, the correlation of B/P with V/P is fairly low, 0.16, soV/P potentially offers useful independent information about misvaluation.This is to be expected, as much of the variation in book/market arisesfrom other sources such as differences in growth prospects or in managerialdiscipline.
3656
at University of C
alifornia, Irvine on July 5, 2013http://rfs.oxfordjournals.org/
Dow
nloaded from
[15:47 30/10/2012 OEP-hhs112.tex] Page: 3657 3645–3683
Overvalued Equity and Financing Decisions
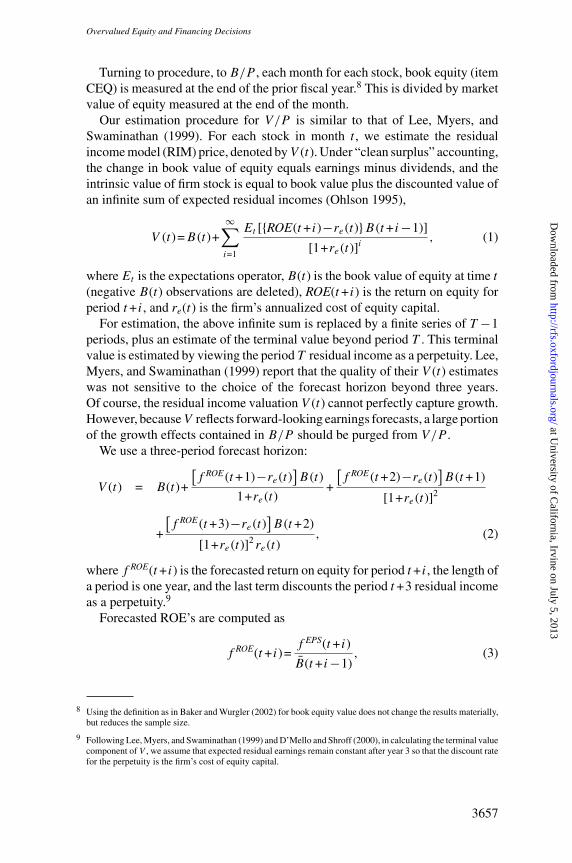
Turning to procedure, to B/P , each month for each stock, book equity (itemCEQ) is measured at the end of the prior fiscal year.8 This is divided by marketvalue of equity measured at the end of the month.
Our estimation procedure for V/P is similar to that of Lee, Myers, andSwaminathan (1999). For each stock in month t , we estimate the residualincome model (RIM) price, denoted by V (t). Under “clean surplus” accounting,the change in book value of equity equals earnings minus dividends, and theintrinsic value of firm stock is equal to book value plus the discounted value ofan infinite sum of expected residual incomes (Ohlson 1995),
V (t)=B (t)+∞∑
i=1
Et [{ROE(t + i)−re (t)}B (t + i−1)]
[1+re (t)]i, (1)
where Et is the expectations operator, B(t) is the book value of equity at time t
(negative B(t) observations are deleted), ROE(t + i) is the return on equity forperiod t + i, and re(t) is the firm’s annualized cost of equity capital.
For estimation, the above infinite sum is replaced by a finite series of T −1periods, plus an estimate of the terminal value beyond period T . This terminalvalue is estimated by viewing the period T residual income as a perpetuity. Lee,Myers, and Swaminathan (1999) report that the quality of their V (t) estimateswas not sensitive to the choice of the forecast horizon beyond three years.Of course, the residual income valuation V (t) cannot perfectly capture growth.However, because V reflects forward-looking earnings forecasts, a large portionof the growth effects contained in B/P should be purged from V/P .
We use a three-period forecast horizon:
V (t) = B(t)+
[f ROE (t +1)−re (t)
]B (t)
1+re (t)+
[f ROE (t +2)−re (t)
]B (t +1)
[1+re (t)]2
+
[f ROE (t +3)−re (t)
]B (t +2)
[1+re (t)]2 re (t), (2)
where f ROE(t + i) is the forecasted return on equity for period t + i, the length ofa period is one year, and the last term discounts the period t +3 residual incomeas a perpetuity.9
Forecasted ROE’s are computed as
f ROE(t + i)=f EPS(t + i)
B̄(t + i−1), (3)
8 Using the definition as in Baker and Wurgler (2002) for book equity value does not change the results materially,but reduces the sample size.
9 Following Lee, Myers, and Swaminathan (1999) and D’Mello and Shroff (2000), in calculating the terminal valuecomponent of V , we assume that expected residual earnings remain constant after year 3 so that the discount ratefor the perpetuity is the firm’s cost of equity capital.
3657
at University of C
alifornia, Irvine on July 5, 2013http://rfs.oxfordjournals.org/
Dow
nloaded from
[15:47 30/10/2012 OEP-hhs112.tex] Page: 3658 3645–3683
The Review of Financial Studies / v 25 n 12 2012
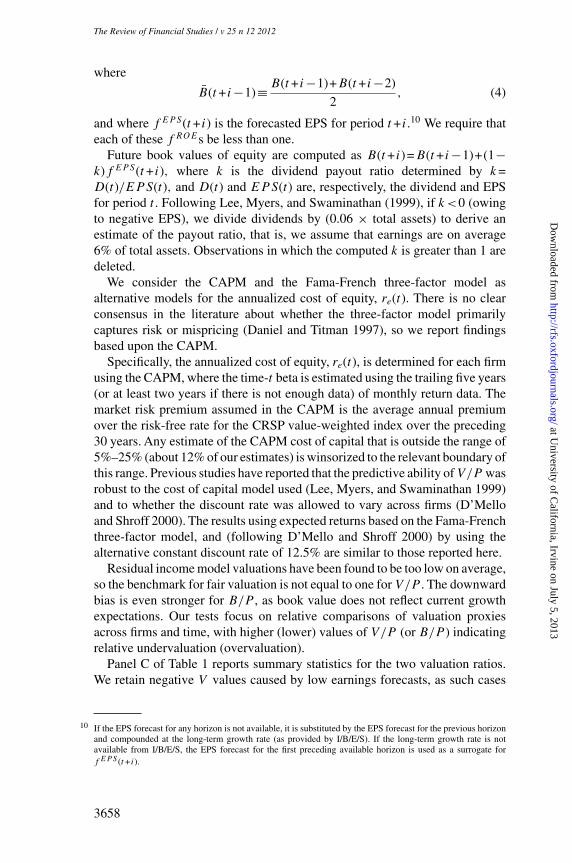
where
B̄(t + i−1)≡ B(t + i−1)+B(t + i−2)
2, (4)
and where f EPS(t + i) is the forecasted EPS for period t + i.10 We require thateach of these f ROEs be less than one.
Future book values of equity are computed as B(t + i)=B(t + i−1)+(1−k)f EPS(t + i), where k is the dividend payout ratio determined by k =D(t)/EPS(t), and D(t) and EPS(t) are, respectively, the dividend and EPSfor period t . Following Lee, Myers, and Swaminathan (1999), if k<0 (owingto negative EPS), we divide dividends by (0.06 × total assets) to derive anestimate of the payout ratio, that is, we assume that earnings are on average6% of total assets. Observations in which the computed k is greater than 1 aredeleted.
We consider the CAPM and the Fama-French three-factor model asalternative models for the annualized cost of equity, re(t). There is no clearconsensus in the literature about whether the three-factor model primarilycaptures risk or mispricing (Daniel and Titman 1997), so we report findingsbased upon the CAPM.
Specifically, the annualized cost of equity, re(t), is determined for each firmusing the CAPM, where the time-t beta is estimated using the trailing five years(or at least two years if there is not enough data) of monthly return data. Themarket risk premium assumed in the CAPM is the average annual premiumover the risk-free rate for the CRSP value-weighted index over the preceding30 years. Any estimate of the CAPM cost of capital that is outside the range of5%–25% (about 12% of our estimates) is winsorized to the relevant boundary ofthis range. Previous studies have reported that the predictive ability of V/P wasrobust to the cost of capital model used (Lee, Myers, and Swaminathan 1999)and to whether the discount rate was allowed to vary across firms (D’Melloand Shroff 2000). The results using expected returns based on the Fama-Frenchthree-factor model, and (following D’Mello and Shroff 2000) by using thealternative constant discount rate of 12.5% are similar to those reported here.
Residual income model valuations have been found to be too low on average,so the benchmark for fair valuation is not equal to one for V/P . The downwardbias is even stronger for B/P , as book value does not reflect current growthexpectations. Our tests focus on relative comparisons of valuation proxiesacross firms and time, with higher (lower) values of V/P (or B/P ) indicatingrelative undervaluation (overvaluation).
Panel C of Table 1 reports summary statistics for the two valuation ratios.We retain negative V values caused by low earnings forecasts, as such cases
10 If the EPS forecast for any horizon is not available, it is substituted by the EPS forecast for the previous horizonand compounded at the long-term growth rate (as provided by I/B/E/S). If the long-term growth rate is notavailable from I/B/E/S, the EPS forecast for the first preceding available horizon is used as a surrogate forf EPS (t + i).
3658
at University of C
alifornia, Irvine on July 5, 2013http://rfs.oxfordjournals.org/
Dow
nloaded from
[15:47 30/10/2012 OEP-hhs112.tex] Page: 3659 3645–3683
Overvalued Equity and Financing Decisions
should also be informative about overvaluation. We use V/P as a measureof undervaluation (rather than P/V as a measure of overvaluation), becausenegative values of P/V should indicate over- rather than undervaluation. Forconsistency we similarly use B/P rather than P/B. Removing negative V/P
observations (about 6% of the sample) tends to reduce statistical significancewithout materially altering the main results.
In addition to examining the relation between security issuance and stockmarket misvaluation in the full sample, we perform tests conditioned uponpotential determinants of the sensitivity of equity issues to misvaluation, asmotivated by the hypotheses in Section 2. In addition to conditioning on V/P
and B/P themselves, we condition on the firm’s R&D intensity, measuredby the firm’s previous-fiscal-year R&D expenditures scaled by lagged assets;firm size (total assets); share turnover (monthly trading volume as a fraction ofnumber of shares outstanding); and net insider selling, which is available to asmall subset of the sample.
Panel D ofTable 1 reports summary statistics for these conditioning variables.Total assets is not highly correlated with either turnover or R&D (lower than0.07 correlation), but turnover and R&D have a correlation of 0.22.
3.3 Time patterns in issuances and valuations
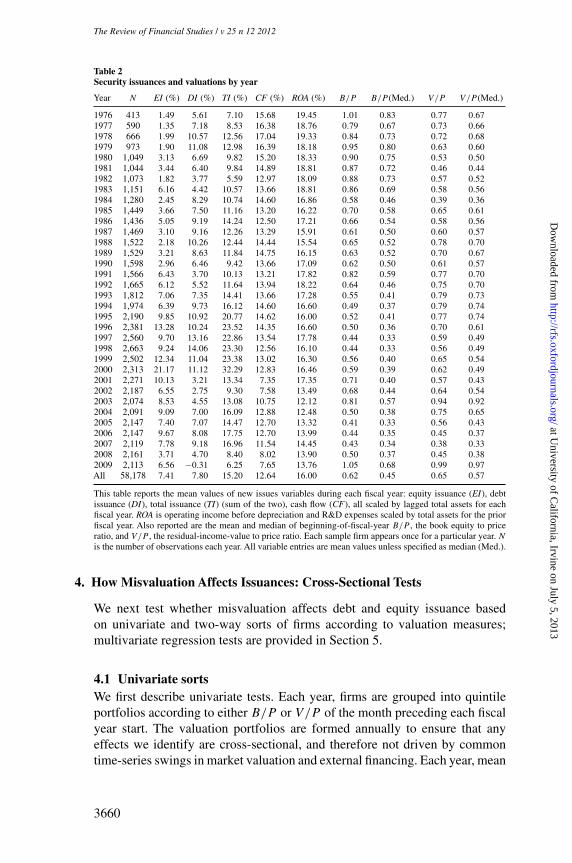
Table 2 reports yearly descriptive statistics for the sample during 1976–2009.Prior to 1990, debt issuance exceeds equity issuance in every year but 1983.Equity issuances overtake debt issuances in the 1990s, and during most of theyears 2000–2009, equity issuances exceed debt issuances.
Before 1986, total issuance (combined net issuance of equity and debt, TI) isless than internally generated funds (CF ). Afterward, external financing tendsto be a larger portion of firms’ total financing. Each year after 1992, except for2009, external financing exceeds internal cash flows, with a peak in the late1990s and early 2000s.
Residual earnings adds value to stocks on average, as reflected in the V/P
mean (median) of 0.65 (0.57) exceeding the B/P mean (median) of 0.62 (0.45).There is a strong time trend in valuation; mean and median V/P are lower thanmean and median B/P in each year before 1985. However, after 1991, both themean and median V/P are higher than B/P each year, except for 2001–2002,on the heels of the collapse of the NASDAQ boom, and the last three years ofthe sample period, which are affected by the global financial crisis.
It is intriguing that stock valuation was low in the early part of the sampleperiod, when equity issuance is low compared to debt issuance. In the latter halfof the sample (excepting the years following the collapse of the technology andreal estate booms), valuations are high and equity issuance generally exceedsdebt issuance.Although not the focus of this paper, these patterns are potentiallyconsistent with aggregate market timing, wherein firms favor equity issuancewhen they are overvalued.
3659
at University of C
alifornia, Irvine on July 5, 2013http://rfs.oxfordjournals.org/
Dow
nloaded from
[15:47 30/10/2012 OEP-hhs112.tex] Page: 3660 3645–3683
The Review of Financial Studies / v 25 n 12 2012
Table 2Security issuances and valuations by year
Year N EI (%) DI (%) TI (%) CF (%) ROA (%) B/P B/P (Med.) V/P V/P (Med.)
1976 413 1.49 5.61 7.10 15.68 19.45 1.01 0.83 0.77 0.671977 590 1.35 7.18 8.53 16.38 18.76 0.79 0.67 0.73 0.661978 666 1.99 10.57 12.56 17.04 19.33 0.84 0.73 0.72 0.681979 973 1.90 11.08 12.98 16.39 18.18 0.95 0.80 0.63 0.601980 1,049 3.13 6.69 9.82 15.20 18.33 0.90 0.75 0.53 0.501981 1,044 3.44 6.40 9.84 14.89 18.81 0.87 0.72 0.46 0.441982 1,073 1.82 3.77 5.59 12.97 18.09 0.88 0.73 0.57 0.521983 1,151 6.16 4.42 10.57 13.66 18.81 0.86 0.69 0.58 0.561984 1,280 2.45 8.29 10.74 14.60 16.86 0.58 0.46 0.39 0.361985 1,449 3.66 7.50 11.16 13.20 16.22 0.70 0.58 0.65 0.611986 1,436 5.05 9.19 14.24 12.50 17.21 0.66 0.54 0.58 0.561987 1,469 3.10 9.16 12.26 13.29 15.91 0.61 0.50 0.60 0.571988 1,522 2.18 10.26 12.44 14.44 15.54 0.65 0.52 0.78 0.701989 1,529 3.21 8.63 11.84 14.75 16.15 0.63 0.52 0.70 0.671990 1,598 2.96 6.46 9.42 13.66 17.09 0.62 0.50 0.61 0.571991 1,566 6.43 3.70 10.13 13.21 17.82 0.82 0.59 0.77 0.701992 1,665 6.12 5.52 11.64 13.94 18.22 0.64 0.46 0.75 0.701993 1,812 7.06 7.35 14.41 13.66 17.28 0.55 0.41 0.79 0.731994 1,974 6.39 9.73 16.12 14.60 16.60 0.49 0.37 0.79 0.741995 2,190 9.85 10.92 20.77 14.62 16.00 0.52 0.41 0.77 0.741996 2,381 13.28 10.24 23.52 14.35 16.60 0.50 0.36 0.70 0.611997 2,560 9.70 13.16 22.86 13.54 17.78 0.44 0.33 0.59 0.491998 2,663 9.24 14.06 23.30 12.56 16.10 0.44 0.33 0.56 0.491999 2,502 12.34 11.04 23.38 13.02 16.30 0.56 0.40 0.65 0.542000 2,313 21.17 11.12 32.29 12.83 16.46 0.59 0.39 0.62 0.492001 2,271 10.13 3.21 13.34 7.35 17.35 0.71 0.40 0.57 0.432002 2,187 6.55 2.75 9.30 7.58 13.49 0.68 0.44 0.64 0.542003 2,074 8.53 4.55 13.08 10.75 12.12 0.81 0.57 0.94 0.922004 2,091 9.09 7.00 16.09 12.88 12.48 0.50 0.38 0.75 0.652005 2,147 7.40 7.07 14.47 12.70 13.32 0.41 0.33 0.56 0.432006 2,147 9.67 8.08 17.75 12.70 13.99 0.44 0.35 0.45 0.372007 2,119 7.78 9.18 16.96 11.54 14.45 0.43 0.34 0.38 0.332008 2,161 3.71 4.70 8.40 8.02 13.90 0.50 0.37 0.45 0.382009 2,113 6.56 −0.31 6.25 7.65 13.76 1.05 0.68 0.99 0.97All 58,178 7.41 7.80 15.20 12.64 16.00 0.62 0.45 0.65 0.57
This table reports the mean values of new issues variables during each fiscal year: equity issuance (EI), debtissuance (DI), total issuance (TI) (sum of the two), cash flow (CF), all scaled by lagged total assets for eachfiscal year. ROA is operating income before depreciation and R&D expenses scaled by total assets for the priorfiscal year. Also reported are the mean and median of beginning-of-fiscal-year B/P , the book equity to priceratio, and V/P , the residual-income-value to price ratio. Each sample firm appears once for a particular year. N
is the number of observations each year. All variable entries are mean values unless specified as median (Med.).
4. How Misvaluation Affects Issuances: Cross-Sectional Tests
We next test whether misvaluation affects debt and equity issuance basedon univariate and two-way sorts of firms according to valuation measures;multivariate regression tests are provided in Section 5.
4.1 Univariate sortsWe first describe univariate tests. Each year, firms are grouped into quintileportfolios according to either B/P or V/P of the month preceding each fiscalyear start. The valuation portfolios are formed annually to ensure that anyeffects we identify are cross-sectional, and therefore not driven by commontime-series swings in market valuation and external financing. Each year, mean
3660
at University of C
alifornia, Irvine on July 5, 2013http://rfs.oxfordjournals.org/
Dow
nloaded from
[15:47 30/10/2012 OEP-hhs112.tex] Page: 3661 3645–3683
Overvalued Equity and Financing Decisions
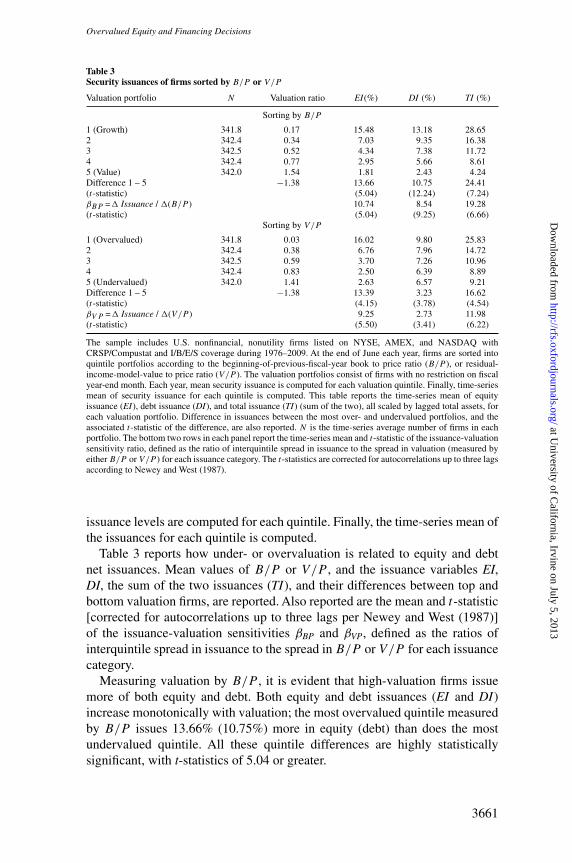
Table 3Security issuances of firms sorted by B/P or V/P
Valuation portfolio N Valuation ratio EI(%) DI (%) TI (%)
Sorting by B/P
1 (Growth) 341.8 0.17 15.48 13.18 28.652 342.4 0.34 7.03 9.35 16.383 342.5 0.52 4.34 7.38 11.724 342.4 0.77 2.95 5.66 8.615 (Value) 342.0 1.54 1.81 2.43 4.24Difference 1 – 5 −1.38 13.66 10.75 24.41(t-statistic) (5.04) (12.24) (7.24)βBP =� Issuance / �(B/P ) 10.74 8.54 19.28(t-statistic) (5.04) (9.25) (6.66)
Sorting by V/P
1 (Overvalued) 341.8 0.03 16.02 9.80 25.832 342.4 0.38 6.76 7.96 14.723 342.5 0.59 3.70 7.26 10.964 342.4 0.83 2.50 6.39 8.895 (Undervalued) 342.0 1.41 2.63 6.57 9.21Difference 1 – 5 −1.38 13.39 3.23 16.62(t-statistic) (4.15) (3.78) (4.54)βV P =� Issuance / �(V/P ) 9.25 2.73 11.98(t-statistic) (5.50) (3.41) (6.22)
The sample includes U.S. nonfinancial, nonutility firms listed on NYSE, AMEX, and NASDAQ withCRSP/Compustat and I/B/E/S coverage during 1976–2009. At the end of June each year, firms are sorted intoquintile portfolios according to the beginning-of-previous-fiscal-year book to price ratio (B/P ), or residual-income-model-value to price ratio (V/P ). The valuation portfolios consist of firms with no restriction on fiscalyear-end month. Each year, mean security issuance is computed for each valuation quintile. Finally, time-seriesmean of security issuance for each quintile is computed. This table reports the time-series mean of equityissuance (EI), debt issuance (DI), and total issuance (TI) (sum of the two), all scaled by lagged total assets, foreach valuation portfolio. Difference in issuances between the most over- and undervalued portfolios, and theassociated t-statistic of the difference, are also reported. N is the time-series average number of firms in eachportfolio. The bottom two rows in each panel report the time-series mean and t-statistic of the issuance-valuationsensitivity ratio, defined as the ratio of interquintile spread in issuance to the spread in valuation (measured byeither B/P or V/P ) for each issuance category. The t-statistics are corrected for autocorrelations up to three lagsaccording to Newey and West (1987).
issuance levels are computed for each quintile. Finally, the time-series mean ofthe issuances for each quintile is computed.
Table 3 reports how under- or overvaluation is related to equity and debtnet issuances. Mean values of B/P or V/P , and the issuance variables EI,DI, the sum of the two issuances (TI), and their differences between top andbottom valuation firms, are reported. Also reported are the mean and t-statistic[corrected for autocorrelations up to three lags per Newey and West (1987)]of the issuance-valuation sensitivities βBP and βVP, defined as the ratios ofinterquintile spread in issuance to the spread in B/P or V/P for each issuancecategory.
Measuring valuation by B/P , it is evident that high-valuation firms issuemore of both equity and debt. Both equity and debt issuances (EI and DI)increase monotonically with valuation; the most overvalued quintile measuredby B/P issues 13.66% (10.75%) more in equity (debt) than does the mostundervalued quintile. All these quintile differences are highly statisticallysignificant, with t-statistics of 5.04 or greater.
3661
at University of C
alifornia, Irvine on July 5, 2013http://rfs.oxfordjournals.org/
Dow
nloaded from
[15:47 30/10/2012 OEP-hhs112.tex] Page: 3662 3645–3683
The Review of Financial Studies / v 25 n 12 2012
The B/P evidence could reflect the effects of either misvaluation or profitgrowth prospects. Therefore, to test for misvaluation effects, we rely more onthe purified misvaluation measure, V/P .
Consistent with Hypothesis 1, using the V/P measure, overvalued firmsissue more equity than do undervalued firms; the interquintile difference in EIis 13.39% (t =4.15). Furthermore, consistent with Hypothesis 3, the effect isstrongest in high overvaluation quintiles. For example, a move from the mostovervalued V/P quintile (quintile 1) to quintile 2 is associated with a drasticdrop in the level of EI, from 16.02% to 6.76%; this compares with a muchnarrower gap in EI between the bottom two valuation quintiles (–0.13%, thenegative difference indicating a slight nonmonotonicity).
Overvalued firms also issue more debt as well; the interquintile differencein DI, although much weaker than when B/P is used as valuation measure, isstill significant (3.23%,t =3.78). Consistent with Hypothesis 2, the sensitivityof equity issuance to misvaluation is much greater than the sensitivity of debtissuance (13.39%>3.23%).
It follows that overvalued firms have much greater total issuance thando undervalued firms. TI for the most overvalued quintile firms is 25.83%,much higher than that of the most undervalued firms (9.21%), consistent withHypothesis 1.
The conclusions based on issuance-valuation sensitivity ratios are similar.For example, measuring valuation by V/P , the issuance-valuation sensitivityratio (βV P ) is 9.25 for EI, and 2.73 for DI, both statistically significant.
Overall, the evidence from the one-way sorts is consistent with the hypothesisthat firms respond to higher inefficient valuation by issuing more equityand raising more funds in total. Furthermore, the evidence that this effectis concentrated among overvalued firms is consistent with the explanationsuggested by Jensen (2004, 2005) that overvalued firms cater to the market’sovervaluation of the firm’s investment opportunities, and to the alternativehypothesis that overvaluation allows firms to exploit scale economies ininvestment.
4.2 Two-way sorts
In V/P , intrinsic value V purges expectations about earnings growth frommarket price imperfectly, because analyst forecasts are noisy proxies for marketexpectations, and because we possess forecasts only for a few years forward.Because book value is not forward-looking, as compared with V/P , B/P
is relatively heavily weighted toward information about growth prospects ascompared with misvaluation [see, e.g., the model of Daniel, Hirshleifer, andSubrahmanyam (2001)]. Therefore, as a more stringent test for misvaluationeffects, we test the relation between V/P and issuance after controlling forB/P . This test is stringent in the sense that B/P also contains informationabout misvaluation.
3662
at University of C
alifornia, Irvine on July 5, 2013http://rfs.oxfordjournals.org/
Dow
nloaded from
[15:47 30/10/2012 OEP-hhs112.tex] Page: 3663 3645–3683
Overvalued Equity and Financing Decisions
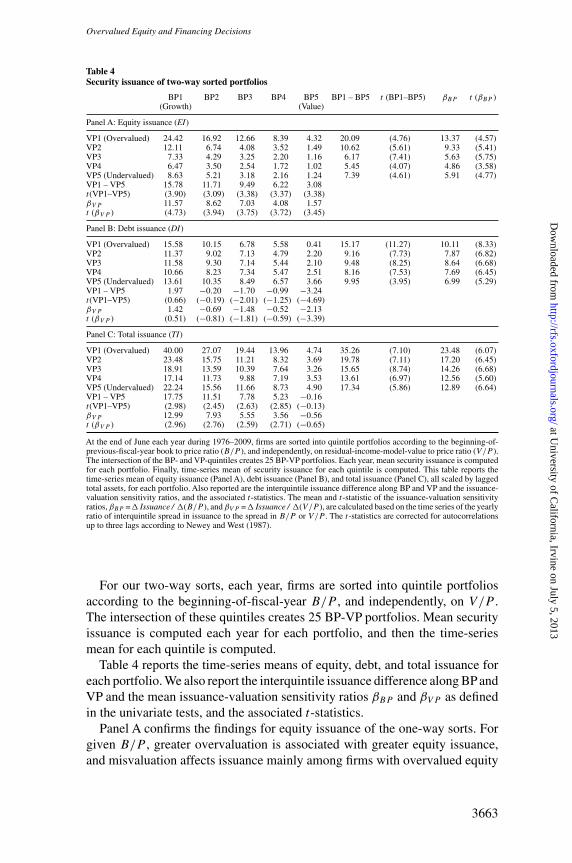
Table 4Security issuance of two-way sorted portfolios
BP1(Growth)
BP2 BP3 BP4 BP5(Value)
BP1 – BP5 t (BP1–BP5) βBP t (βBP )
Panel A: Equity issuance (EI)
VP1 (Overvalued) 24.42 16.92 12.66 8.39 4.32 20.09 (4.76) 13.37 (4.57)VP2 12.11 6.74 4.08 3.52 1.49 10.62 (5.61) 9.33 (5.41)VP3 7.33 4.29 3.25 2.20 1.16 6.17 (7.41) 5.63 (5.75)VP4 6.47 3.50 2.54 1.72 1.02 5.45 (4.07) 4.86 (3.58)VP5 (Undervalued) 8.63 5.21 3.18 2.16 1.24 7.39 (4.61) 5.91 (4.77)VP1 – VP5 15.78 11.71 9.49 6.22 3.08t(VP1–VP5) (3.90) (3.09) (3.38) (3.37) (3.38)βV P 11.57 8.62 7.03 4.08 1.57t (βV P ) (4.73) (3.94) (3.75) (3.72) (3.45)
Panel B: Debt issuance (DI)
VP1 (Overvalued) 15.58 10.15 6.78 5.58 0.41 15.17 (11.27) 10.11 (8.33)VP2 11.37 9.02 7.13 4.79 2.20 9.16 (7.73) 7.87 (6.82)VP3 11.58 9.30 7.14 5.44 2.10 9.48 (8.25) 8.64 (6.68)VP4 10.66 8.23 7.34 5.47 2.51 8.16 (7.53) 7.69 (6.45)VP5 (Undervalued) 13.61 10.35 8.49 6.57 3.66 9.95 (3.95) 6.99 (5.29)VP1 – VP5 1.97 −0.20 −1.70 −0.99 −3.24t(VP1–VP5) (0.66) (−0.19) (−2.01) (−1.25) (−4.69)βV P 1.42 −0.69 −1.48 −0.52 −2.13t (βV P ) (0.51) (−0.81) (−1.81) (−0.59) (−3.39)
Panel C: Total issuance (TI)
VP1 (Overvalued) 40.00 27.07 19.44 13.96 4.74 35.26 (7.10) 23.48 (6.07)VP2 23.48 15.75 11.21 8.32 3.69 19.78 (7.11) 17.20 (6.45)VP3 18.91 13.59 10.39 7.64 3.26 15.65 (8.74) 14.26 (6.68)VP4 17.14 11.73 9.88 7.19 3.53 13.61 (6.97) 12.56 (5.60)VP5 (Undervalued) 22.24 15.56 11.66 8.73 4.90 17.34 (5.86) 12.89 (6.64)VP1 – VP5 17.75 11.51 7.78 5.23 −0.16t(VP1–VP5) (2.98) (2.45) (2.63) (2.85) (−0.13)βV P 12.99 7.93 5.55 3.56 −0.56t (βV P ) (2.96) (2.76) (2.59) (2.71) (−0.65)
At the end of June each year during 1976–2009, firms are sorted into quintile portfolios according to the beginning-of-previous-fiscal-year book to price ratio (B/P ), and independently, on residual-income-model-value to price ratio (V/P ).The intersection of the BP- and VP-quintiles creates 25 BP-VP portfolios. Each year, mean security issuance is computedfor each portfolio. Finally, time-series mean of security issuance for each quintile is computed. This table reports thetime-series mean of equity issuance (Panel A), debt issuance (Panel B), and total issuance (Panel C), all scaled by laggedtotal assets, for each portfolio. Also reported are the interquintile issuance difference along BP and VP and the issuance-valuation sensitivity ratios, and the associated t-statistics. The mean and t-statistic of the issuance-valuation sensitivityratios, βBP =� Issuance / �(B/P ), and βV P =� Issuance / �(V/P ), are calculated based on the time series of the yearlyratio of interquintile spread in issuance to the spread in B/P or V/P . The t-statistics are corrected for autocorrelationsup to three lags according to Newey and West (1987).
For our two-way sorts, each year, firms are sorted into quintile portfoliosaccording to the beginning-of-fiscal-year B/P , and independently, on V/P .The intersection of these quintiles creates 25 BP-VP portfolios. Mean securityissuance is computed each year for each portfolio, and then the time-seriesmean for each quintile is computed.
Table 4 reports the time-series means of equity, debt, and total issuance foreach portfolio. We also report the interquintile issuance difference along BP andVP and the mean issuance-valuation sensitivity ratios βBP and βVP as definedin the univariate tests, and the associated t-statistics.
Panel A confirms the findings for equity issuance of the one-way sorts. Forgiven B/P , greater overvaluation is associated with greater equity issuance,and misvaluation affects issuance mainly among firms with overvalued equity
3663
at University of C
alifornia, Irvine on July 5, 2013http://rfs.oxfordjournals.org/
Dow
nloaded from
[15:47 30/10/2012 OEP-hhs112.tex] Page: 3664 3645–3683
The Review of Financial Studies / v 25 n 12 2012
as measured by V/P . Furthermore, consistent with Hypothesis 4, the effect ofmisvaluation on equity issuance is strongest among growth firms.
In contrast, Panel B shows that controlling for B/P affects the results fordebt issuance. In the two-way sorts, overvalued firms tend to issue less debt,especially among value firms (high B/P ), in contrast to the univariate result.Specifically, among value firms, it is undervalued firms that tend to issue moredebt. Because the two-way sorts are more controlled, we place greater faith inthe findings here.
Among growth firms in columns BP1 and BP2, the relation between DI andV/P is U-shaped—among growth firms, both the most under- and overvaluedfirms tend to issue more debt than the medium-valued firms. This may reflectthe opposing effects described in the hypothesis section—a greater absolutebenefit to issuing risky debt when the firm is more overvalued but a lowerbenefit relative to issuing equity.11
Finally, Panel C shows that the results for total issuance are consistent withthe univariate results. For example, TI is strongly increasing with overvaluationamong growth firms (BP1 and BP2). This reflects the fact that the effect ofmisvaluation on EI in the two-way sorts is much stronger than the (morecomplex) pattern for DI.
5. Regression Tests
Both to test the robustness of the basic finding that misvaluation affectsissuance, and to test hypotheses for why this is the case, we perform multivariateanalysis with additional controls. To control more fully for growth, risk, andother possible interfering effects, in addition to B/P , we control for Tobin’s q,cash flow scaled by lagged assets, ROA, leverage, firm age, the Fama-Frenchthree-factor loadings, and two-digit SIC major industry indicators as definedby Moskowitz and Grinblatt (1999).
Table 5 reports the results of panel regressions with EI, DI, and TI asdependent variables, where t-statistics are based on standard errors clusteredby both year and firm per Petersen (2009), as in DeAngelo, DeAngelo, andStulz (2010). For each dependent variable, we report the results of threespecifications for the independent variables: (1) B/P and controls, (2) V/P
and controls, and (3) B/P , V/P , and controls (dropping q because q and B/P
capture similar information). This lets us evaluate whetherV/P has incrementalexplanatory power as a misvaluation measure after controlling for B/P . Thisprovides a fairly stringent test for misvaluation, as distinct from the earningsgrowth fundamentals that are correlated with book/market, because B/P can
11 Intuitively, for firms with poor growth prospects, the incentive for issuing risky debt is not strong, so we observeDI decreases with the valuation level. For high-growth firms, the incentive for issuing risky debt is strongenough—perhaps owing to catering incentives of managers to maintain irrational equity prices—to induce aU-shaped relation between DI and overvaluation.
3664
at University of C
alifornia, Irvine on July 5, 2013http://rfs.oxfordjournals.org/
Dow
nloaded from
[15:47 30/10/2012 OEP-hhs112.tex] Page: 3665 3645–3683
Overvalued Equity and Financing Decisions
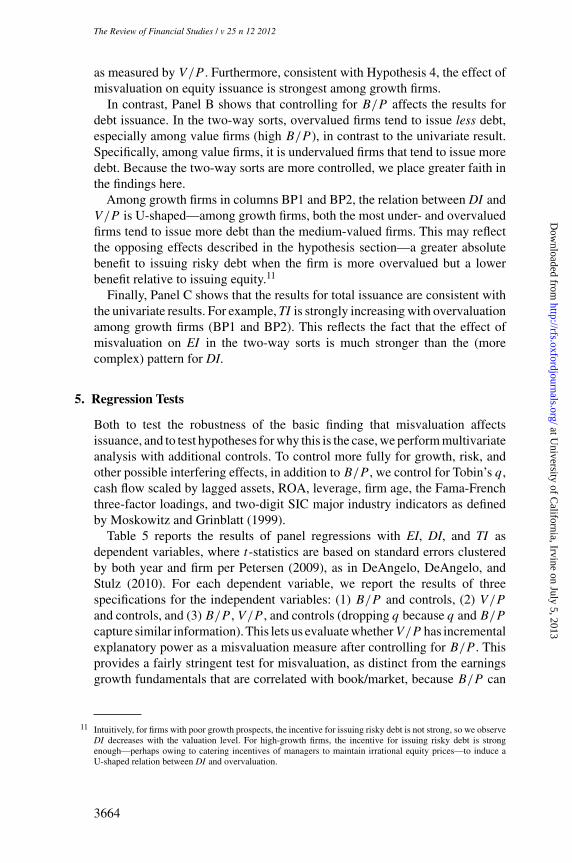
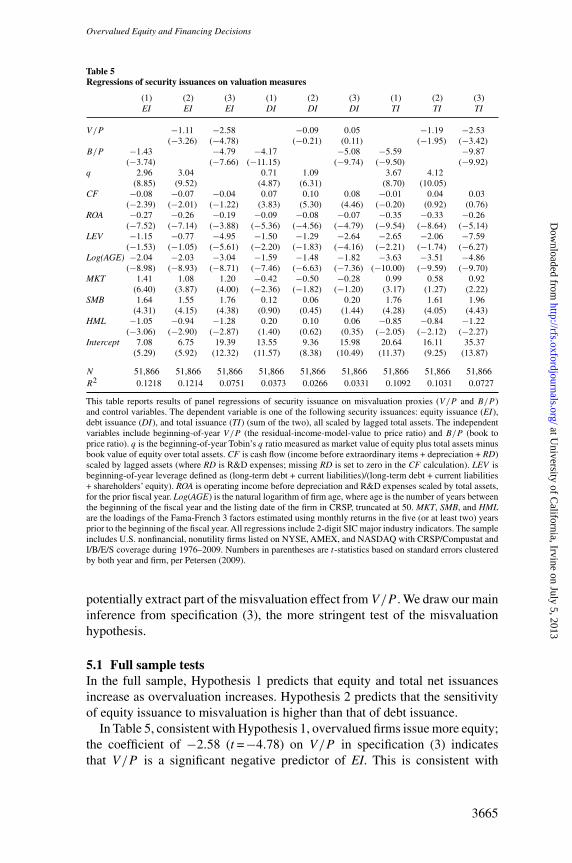
Table 5Regressions of security issuances on valuation measures
(1) (2) (3) (1) (2) (3) (1) (2) (3)EI EI EI DI DI DI TI TI TI
V/P −1.11 −2.58 −0.09 0.05 −1.19 −2.53(−3.26) (−4.78) (−0.21) (0.11) (−1.95) (−3.42)
B/P −1.43 −4.79 −4.17 −5.08 −5.59 −9.87(−3.74) (−7.66) (−11.15) (−9.74) (−9.50) (−9.92)
q 2.96 3.04 0.71 1.09 3.67 4.12(8.85) (9.52) (4.87) (6.31) (8.70) (10.05)
CF −0.08 −0.07 −0.04 0.07 0.10 0.08 −0.01 0.04 0.03(−2.39) (−2.01) (−1.22) (3.83) (5.30) (4.46) (−0.20) (0.92) (0.76)
ROA −0.27 −0.26 −0.19 −0.09 −0.08 −0.07 −0.35 −0.33 −0.26(−7.52) (−7.14) (−3.88) (−5.36) (−4.56) (−4.79) (−9.54) (−8.64) (−5.14)
LEV −1.15 −0.77 −4.95 −1.50 −1.29 −2.64 −2.65 −2.06 −7.59(−1.53) (−1.05) (−5.61) (−2.20) (−1.83) (−4.16) (−2.21) (−1.74) (−6.27)
Log(AGE) −2.04 −2.03 −3.04 −1.59 −1.48 −1.82 −3.63 −3.51 −4.86(−8.98) (−8.93) (−8.71) (−7.46) (−6.63) (−7.36) (−10.00) (−9.59) (−9.70)
MKT 1.41 1.08 1.20 −0.42 −0.50 −0.28 0.99 0.58 0.92(6.40) (3.87) (4.00) (−2.36) (−1.82) (−1.20) (3.17) (1.27) (2.22)
SMB 1.64 1.55 1.76 0.12 0.06 0.20 1.76 1.61 1.96(4.31) (4.15) (4.38) (0.90) (0.45) (1.44) (4.28) (4.05) (4.43)
HML −1.05 −0.94 −1.28 0.20 0.10 0.06 −0.85 −0.84 −1.22(−3.06) (−2.90) (−2.87) (1.40) (0.62) (0.35) (−2.05) (−2.12) (−2.27)
Intercept 7.08 6.75 19.39 13.55 9.36 15.98 20.64 16.11 35.37(5.29) (5.92) (12.32) (11.57) (8.38) (10.49) (11.37) (9.25) (13.87)
N 51,866 51,866 51,866 51,866 51,866 51,866 51,866 51,866 51,866R2 0.1218 0.1214 0.0751 0.0373 0.0266 0.0331 0.1092 0.1031 0.0727
This table reports results of panel regressions of security issuance on misvaluation proxies (V/P and B/P )and control variables. The dependent variable is one of the following security issuances: equity issuance (EI),debt issuance (DI), and total issuance (TI) (sum of the two), all scaled by lagged total assets. The independentvariables include beginning-of-year V/P (the residual-income-model-value to price ratio) and B/P (book toprice ratio). q is the beginning-of-year Tobin’s q ratio measured as market value of equity plus total assets minusbook value of equity over total assets. CF is cash flow (income before extraordinary items + depreciation + RD)scaled by lagged assets (where RD is R&D expenses; missing RD is set to zero in the CF calculation). LEV isbeginning-of-year leverage defined as (long-term debt + current liabilities)/(long-term debt + current liabilities+ shareholders’ equity). ROA is operating income before depreciation and R&D expenses scaled by total assets,for the prior fiscal year. Log(AGE) is the natural logarithm of firm age, where age is the number of years betweenthe beginning of the fiscal year and the listing date of the firm in CRSP, truncated at 50. MKT, SMB, and HMLare the loadings of the Fama-French 3 factors estimated using monthly returns in the five (or at least two) yearsprior to the beginning of the fiscal year. All regressions include 2-digit SIC major industry indicators. The sampleincludes U.S. nonfinancial, nonutility firms listed on NYSE, AMEX, and NASDAQ with CRSP/Compustat andI/B/E/S coverage during 1976–2009. Numbers in parentheses are t-statistics based on standard errors clusteredby both year and firm, per Petersen (2009).
potentially extract part of the misvaluation effect from V/P . We draw our maininference from specification (3), the more stringent test of the misvaluationhypothesis.
5.1 Full sample testsIn the full sample, Hypothesis 1 predicts that equity and total net issuancesincrease as overvaluation increases. Hypothesis 2 predicts that the sensitivityof equity issuance to misvaluation is higher than that of debt issuance.
In Table 5, consistent with Hypothesis 1, overvalued firms issue more equity;the coefficient of −2.58 (t =−4.78) on V/P in specification (3) indicatesthat V/P is a significant negative predictor of EI. This is consistent with
3665
at University of C
alifornia, Irvine on July 5, 2013http://rfs.oxfordjournals.org/
Dow
nloaded from
[15:47 30/10/2012 OEP-hhs112.tex] Page: 3666 3645–3683
The Review of Financial Studies / v 25 n 12 2012
the conclusion of the one-way and two-way portfolio tests. Furthermore, theinclusion of both B/P and V/P tends to increase the significance of bothvariables. The coefficient on V/P in specification (3) is stronger than inspecifications (1) or (2), indicating that growth effects do not explain the abilityof misvaluation as measured by V/P to predict equity issuance.
In the DI regressions, the coefficient onV/P is insignificant and close to zero,indicating that overvaluation has no clear effect on the propensity to issue debt.This is consistent with Hypothesis 2, which predicts that debt issuance is not aspositively sensitive to overvaluation as equity issuance. The lack of a relationbetween DI and overvaluation suggests a relatively strong substitution fromdebt issuance to equity issuance as overvaluation increases or undervaluationdecreases.
Although not crucial for the main hypotheses of this paper, it is interestingto contrast the finding that greater overvaluation is not associated with greaterdebt issuance with the evidence of Spiess andAffleck-Graves (1999) about post-debt-issuance returns. Based on the finding that debt issuers earn lower stockreturns in the years subsequent to issuance, they conclude that debt issuers areovervalued. Also, although we do not perform equity share tests, our findingsare in the spirit of aggregate-level evidence that a high equity share in new issues(a variable that is motivated by the substitution by overvalued firms from debtto equity) is followed by low aggregate stock returns (Baker and Wurgler 2000;Henderson, Jegadeesh, and Weisbach 2006) more than firm-level tests that donot find such effects (Butler et al. 2011). Of course, a large body of literaturedebates the validity of alternative benchmarks and return calculation methodsfor long-run return studies (e.g., Fama 1998; Loughran and Ritter 2000). Moreimportantly, our tests answer a different causal question than ex post returntests.12
Also consistent with Hypothesis 1, TI (the sum of EI and DI) is significantlypositively related to overvaluation as measured by V/P . The V/P coefficientin the TI specification (3) is −2.53 (t =−3.42).
To gauge the economic importance of the issuance-valuation relation, weexamine the effect of a one-standard-deviation shift in V/P on equity anddebt issuances, and we compare these to the effects of a comparable shift inB/P (which measures the effect of growth prospects). The standard deviationsof V/P and B/P from Table 1 are 0.60 and 0.61, respectively. Accordingto the EI regression specification (3), a one-standard-deviation shift in V/P
therefore implies a 1.55% (2.58×0.60) change in EI, which is about 21% ofthe average EI. This compares with a 2.92% (4.79×0.61) change in EI by aone-standard-deviation shift in B/P , implying that the effect of misvaluation
12 As discussed in Section 2, conditioning on preexisting misvaluation rather than on the issuance event focuseson the causal effects of misvaluation rather than the possible reverse causality wherein firms that are planning toissue take actions to increase misvaluation. Our evidence that this distinction affects inferences about whethermisvaluation causes debt issuance highlights that this distinction must be kept in mind for equity issuance aswell.
3666
at University of C
alifornia, Irvine on July 5, 2013http://rfs.oxfordjournals.org/
Dow
nloaded from
[15:47 30/10/2012 OEP-hhs112.tex] Page: 3667 3645–3683
Overvalued Equity and Financing Decisions
on equity issuances is about 53% of the effect of growth opportunities.Asimilarcalculation shows that the effect of misvaluation on EI is 2.6 times the effectof cash flow on EI.
A comparison between the EI and DI regressions of Table 5 suggests thatB/P has a greater effect on debt than on equity issuance, as evident in Model1, which does not include V/P . The misvaluation theory does not make aprediction about which effect will be stronger, because even the basic predictionabout the effect of misvaluation on debt issuance is ambiguous. Traditionalfinancing theories also have different predictions about the relative strength ofthese effects. For example, the pecking order theory predicts that firms in needof capital should prefer debt to equity financing, so if low B/P firms needfinancing for their high growth opportunities, this should mainly come fromdebt issuance. The debt overhang theory predicts that low B/P growth firmsshould refrain from issuing debt to avoid bypassing valuable future investmentopportunities. The finding that higher B/P has a more negative effect on debtthan on equity financing tends to be most supportive of the pecking order theory.
5.2 Why does misvaluation affect issuance? Characteristics-basedsubsample tests
We now examine misvaluation sensitivities of financing within subsamplessorted by firm characteristics to test different possible reasons why misvaluationaffects equity and debt issuances. The conditioning variables we hypothesize toaffect the sensitivity of issuance to misvaluation are the level of misvaluationitself, B/P , R&D, size, share turnover, and net insider selling.
We report the subsample results in Tables 6–8. For each subsample, we reportthe V/P coefficient in Model 3 of Table 5, which provides the effect of V/P onissuances after controlling for the effects of growth and other potential effectsof cash flow, leverage, and firm-specific risk.
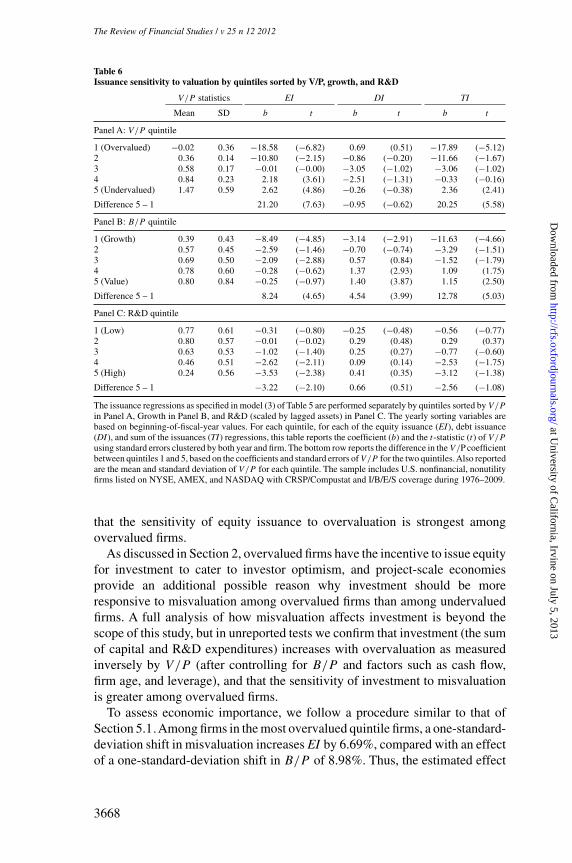
5.2.1 Valuation-subsample regressions. Panel A of Table 6 describes howthe sensitivity of financing activity to misvaluation as measured by V/P variesacross misvaluation quintiles. Within each quintile, we regress EI (or DI or TI)on V/P , B/P , and the other controls.
Consistent with Hypothesis 3, the effect of overvaluation on EI is limited tothe top two misvaluation quintiles. In fact, among the two bottom valuationquintiles V/P has a significantly positive, rather than negative, effect onEI, though the magnitude is much smaller.13 The interquintile difference inV/P coefficients between the top and bottom valuation quintiles is large andstatistically significant (21.20, t =7.63). This is consistent with the prediction
13 Subperiod analysis (unreported) shows that this effect is primarily present in the 2000s. One possible interpretationof this result is that some distressed firms are forced to raise new equity financing even when their stock isundervalued.
3667
at University of C
alifornia, Irvine on July 5, 2013http://rfs.oxfordjournals.org/
Dow
nloaded from
[15:47 30/10/2012 OEP-hhs112.tex] Page: 3668 3645–3683
The Review of Financial Studies / v 25 n 12 2012
Table 6Issuance sensitivity to valuation by quintiles sorted by V/P, growth, and R&D
V/P statistics EI DI TI
Mean SD b t b t b t
Panel A: V/P quintile
1 (Overvalued) −0.02 0.36 −18.58 (−6.82) 0.69 (0.51) −17.89 (−5.12)2 0.36 0.14 −10.80 (−2.15) −0.86 (−0.20) −11.66 (−1.67)3 0.58 0.17 −0.01 (−0.00) −3.05 (−1.02) −3.06 (−1.02)4 0.84 0.23 2.18 (3.61) −2.51 (−1.31) −0.33 (−0.16)5 (Undervalued) 1.47 0.59 2.62 (4.86) −0.26 (−0.38) 2.36 (2.41)
Difference 5 – 1 21.20 (7.63) −0.95 (−0.62) 20.25 (5.58)
Panel B: B/P quintile
1 (Growth) 0.39 0.43 −8.49 (−4.85) −3.14 (−2.91) −11.63 (−4.66)2 0.57 0.45 −2.59 (−1.46) −0.70 (−0.74) −3.29 (−1.51)3 0.69 0.50 −2.09 (−2.88) 0.57 (0.84) −1.52 (−1.79)4 0.78 0.60 −0.28 (−0.62) 1.37 (2.93) 1.09 (1.75)5 (Value) 0.80 0.84 −0.25 (−0.97) 1.40 (3.87) 1.15 (2.50)
Difference 5 – 1 8.24 (4.65) 4.54 (3.99) 12.78 (5.03)
Panel C: R&D quintile
1 (Low) 0.77 0.61 −0.31 (−0.80) −0.25 (−0.48) −0.56 (−0.77)2 0.80 0.57 −0.01 (−0.02) 0.29 (0.48) 0.29 (0.37)3 0.63 0.53 −1.02 (−1.40) 0.25 (0.27) −0.77 (−0.60)4 0.46 0.51 −2.62 (−2.11) 0.09 (0.14) −2.53 (−1.75)5 (High) 0.24 0.56 −3.53 (−2.38) 0.41 (0.35) −3.12 (−1.38)
Difference 5 – 1 −3.22 (−2.10) 0.66 (0.51) −2.56 (−1.08)
The issuance regressions as specified in model (3) of Table 5 are performed separately by quintiles sorted by V/P
in Panel A, Growth in Panel B, and R&D (scaled by lagged assets) in Panel C. The yearly sorting variables arebased on beginning-of-fiscal-year values. For each quintile, for each of the equity issuance (EI), debt issuance(DI), and sum of the issuances (TI) regressions, this table reports the coefficient (b) and the t-statistic (t) of V/P
using standard errors clustered by both year and firm. The bottom row reports the difference in the V/P coefficientbetween quintiles 1 and 5, based on the coefficients and standard errors of V/P for the two quintiles.Also reportedare the mean and standard deviation of V/P for each quintile. The sample includes U.S. nonfinancial, nonutilityfirms listed on NYSE, AMEX, and NASDAQ with CRSP/Compustat and I/B/E/S coverage during 1976–2009.
that the sensitivity of equity issuance to overvaluation is strongest amongovervalued firms.
As discussed in Section 2, overvalued firms have the incentive to issue equityfor investment to cater to investor optimism, and project-scale economiesprovide an additional possible reason why investment should be moreresponsive to misvaluation among overvalued firms than among undervaluedfirms. A full analysis of how misvaluation affects investment is beyond thescope of this study, but in unreported tests we confirm that investment (the sumof capital and R&D expenditures) increases with overvaluation as measuredinversely by V/P (after controlling for B/P and factors such as cash flow,firm age, and leverage), and that the sensitivity of investment to misvaluationis greater among overvalued firms.
To assess economic importance, we follow a procedure similar to that ofSection 5.1.Among firms in the most overvalued quintile firms, a one-standard-deviation shift in misvaluation increases EI by 6.69%, compared with an effectof a one-standard-deviation shift in B/P of 8.98%. Thus, the estimated effect
3668
at University of C
alifornia, Irvine on July 5, 2013http://rfs.oxfordjournals.org/
Dow
nloaded from
[15:47 30/10/2012 OEP-hhs112.tex] Page: 3669 3645–3683
Overvalued Equity and Financing Decisions
of misvaluation on equity issuance is substantial, and is greater than that ofcash flow.
For DI, there is no significant effect of misvaluation within each valuationquintile, even for the most undervalued quintile. There is also no clear trendin the V/P effect across the valuation quintiles. Finally, consistent withHypothesis 3, the V/P coefficient indicates that the effect of misvaluation ontotal issuance is strongest among the top overvaluation quintiles (statisticallysignificant, t =−5.12, only for the top quintile).
5.2.2 B/P -quintile regressions. Panel B of Table 6 reports the effect ofmisvaluation on issuance for the B/P quintiles. Consistent with Hypothesis 4,growth firms with low B/P show a much stronger misvaluation effect on EI(−8.49;t =−4.85) than do value firms (insignificant V/P effect).
The V/P effect on DI is also negative for growth firms (−3.14;t =−2.91).However, it is positive for value firms (high B/P ratios), with a coefficientof 1.40, t =3.87. As discussed in Section 2, the effect of misvaluation ondebt issuance is potentially ambiguous because greater firm overvaluationdirectly encourages the issuance of overvalued risky debt, but also encourages asubstitution away from debt toward equity issuance. This raises the question ofwhy the first effect would dominate among growth firms, resulting in a negativecoefficient on V/P , and the second effect would dominate among value firms,resulting in a positive coefficient on V/P .
A possible catering explanation is that among overvalued growth firms, theincentive to maintain overvalued equity prices causes the issuance of risky debtas a supplement to equity issuance. Jensen (2004, 2005) argues that the pressureon managers to take actions such as raising capital to finance investmentprojects is stronger among overvalued firms, especially among growth firms forwhich investor optimism is high. Overvalued growth firms may be exploitingboth means (debt and equity) of financing ambitious projects to cater investoroptimism.
It follows from the EI and DI results above that overvaluation positivelyaffects the TI among growth firms and negatively among value firms. Thisresults in a significantly negative coefficient on V/P among growth firms(t =−4.66) and a significantly positive coefficient among value firms (t =2.50). The positive coefficient among value firms indicates that among valuefirms a reduction in undervaluation is associated with lower total issuance.This opposes the spirit of Hypothesis 1, but the economic magnitude of thecoefficient (1.15) is modest.
The interquintile difference in the V/P effect on TI is substantial and highlysignificant (12.78;t =5.03). The more negative relation between undervaluationas proxied by V/P and total issuance (i.e., the more positive relationbetween overvaluation and issuance) among growth firms is consistent withHypothesis 4.
3669
at University of C
alifornia, Irvine on July 5, 2013http://rfs.oxfordjournals.org/
Dow
nloaded from
[15:47 30/10/2012 OEP-hhs112.tex] Page: 3670 3645–3683
The Review of Financial Studies / v 25 n 12 2012
A subtle caveat to Hypotheses 4–6 is that a different line of reasoningbased upon the quality of the V/P proxy for misvaluation leads to the sameconclusion. Firms with high intangibles or growth opportunities are harderto value, and therefore are more subject to misvaluation effects. Small firmsshare these features, and in addition have low transparency and high costs ofarbitrage, owing to their illiquidity.
Because V/P is a noisy measure of misvaluation, within subsamples thatcontain greater variation in true misvaluation, a greater fraction of the variationin V/P should be the result of variation in actual misvaluation rather thanmeasurement error. For example, in a subsample in which true misvaluation isclose to zero for all firms, almost all of the variation in V/P would be noise.So, any conditioning variable that induces greater conditional dispersion intrue misvaluation should strengthen the sensitivity of issuance to measuredmisvaluation.
This possibility is most important for firm size conditioning firms(Hypothesis 6), owing to the high costs of arbitraging mispricing of small firms.To the extent that this caveat applies, evidence of higher issuance sensitivityamong the small firm subsample provides further corroboration of the basichypothesis that misvaluation affects issuance, rather than further evidence aboutwhy this relationship exists.
5.2.3 R&D-quintile regressions. According to Hypothesis 5, firms whoseassets are less tangible and therefore harder for the market to value will havegreater sensitivity of issuance to misvaluation. Section 5.2.2 provides onekind of evidence consistent with this hypothesis, that the sensitivity of equityissuance and total issuance to V/P is greater among growth firms (firms withlow B/P ). However, B/P has multiple interpretations, so it is useful to testthis hypothesis using a different measure of intangibility. We therefore examinehow the sensitivity of issuance to misvaluation varies across sets of firms withdifferent levels of R&D.
Panel C of Table 6 reports the sensitivity of issuances to misvaluation foreach R&D quintile. Consistent with Hypothesis 4, high-R&D firms have a muchhigher sensitivity of EI to V/P than do low-R&D firms. The V/P effect on EIis concentrated in the top three R&D quintiles, and is statistically significantonly in the top two. The difference in coefficients between the top and bottomquintiles is statistically significant (t =−2.10).
5.2.4 Size-quintile regressions. According to Hypothesis 6, the sensitivityof equity issuance and total financing to misvaluation will be greater amongsmall firms, again because such firms tend to derive greater potential valuefrom growth. Panel A of Table 7 reports the effect of V/P on issuance withinquintiles sorted by total assets. Consistent with Hypothesis 6, the V/P effecton EI is much stronger among small firms than among large firms. TheV/P effect on EI is −3.67 (t =−4.05) among the smallest-firm quintile is
3670
at University of C
alifornia, Irvine on July 5, 2013http://rfs.oxfordjournals.org/
Dow
nloaded from
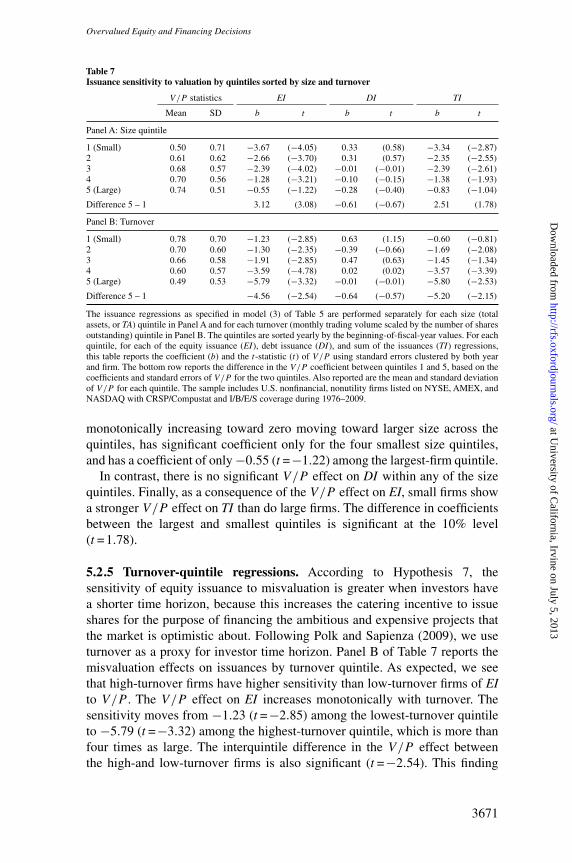
[15:47 30/10/2012 OEP-hhs112.tex] Page: 3671 3645–3683
Overvalued Equity and Financing Decisions
Table 7Issuance sensitivity to valuation by quintiles sorted by size and turnover
V/P statistics EI DI TI
Mean SD b t b t b t
Panel A: Size quintile
1 (Small) 0.50 0.71 −3.67 (−4.05) 0.33 (0.58) −3.34 (−2.87)2 0.61 0.62 −2.66 (−3.70) 0.31 (0.57) −2.35 (−2.55)3 0.68 0.57 −2.39 (−4.02) −0.01 (−0.01) −2.39 (−2.61)4 0.70 0.56 −1.28 (−3.21) −0.10 (−0.15) −1.38 (−1.93)5 (Large) 0.74 0.51 −0.55 (−1.22) −0.28 (−0.40) −0.83 (−1.04)
Difference 5 – 1 3.12 (3.08) −0.61 (−0.67) 2.51 (1.78)
Panel B: Turnover
1 (Small) 0.78 0.70 −1.23 (−2.85) 0.63 (1.15) −0.60 (−0.81)2 0.70 0.60 −1.30 (−2.35) −0.39 (−0.66) −1.69 (−2.08)3 0.66 0.58 −1.91 (−2.85) 0.47 (0.63) −1.45 (−1.34)4 0.60 0.57 −3.59 (−4.78) 0.02 (0.02) −3.57 (−3.39)5 (Large) 0.49 0.53 −5.79 (−3.32) −0.01 (−0.01) −5.80 (−2.53)
Difference 5 – 1 −4.56 (−2.54) −0.64 (−0.57) −5.20 (−2.15)
The issuance regressions as specified in model (3) of Table 5 are performed separately for each size (totalassets, or TA) quintile in Panel A and for each turnover (monthly trading volume scaled by the number of sharesoutstanding) quintile in Panel B. The quintiles are sorted yearly by the beginning-of-fiscal-year values. For eachquintile, for each of the equity issuance (EI), debt issuance (DI), and sum of the issuances (TI) regressions,this table reports the coefficient (b) and the t-statistic (t) of V/P using standard errors clustered by both yearand firm. The bottom row reports the difference in the V/P coefficient between quintiles 1 and 5, based on thecoefficients and standard errors of V/P for the two quintiles. Also reported are the mean and standard deviationof V/P for each quintile. The sample includes U.S. nonfinancial, nonutility firms listed on NYSE, AMEX, andNASDAQ with CRSP/Compustat and I/B/E/S coverage during 1976–2009.
monotonically increasing toward zero moving toward larger size across thequintiles, has significant coefficient only for the four smallest size quintiles,and has a coefficient of only −0.55 (t =−1.22) among the largest-firm quintile.
In contrast, there is no significant V/P effect on DI within any of the sizequintiles. Finally, as a consequence of the V/P effect on EI, small firms showa stronger V/P effect on TI than do large firms. The difference in coefficientsbetween the largest and smallest quintiles is significant at the 10% level(t =1.78).
5.2.5 Turnover-quintile regressions. According to Hypothesis 7, thesensitivity of equity issuance to misvaluation is greater when investors havea shorter time horizon, because this increases the catering incentive to issueshares for the purpose of financing the ambitious and expensive projects thatthe market is optimistic about. Following Polk and Sapienza (2009), we useturnover as a proxy for investor time horizon. Panel B of Table 7 reports themisvaluation effects on issuances by turnover quintile. As expected, we seethat high-turnover firms have higher sensitivity than low-turnover firms of EIto V/P . The V/P effect on EI increases monotonically with turnover. Thesensitivity moves from −1.23 (t =−2.85) among the lowest-turnover quintileto −5.79 (t =−3.32) among the highest-turnover quintile, which is more thanfour times as large. The interquintile difference in the V/P effect betweenthe high-and low-turnover firms is also significant (t =−2.54). This finding
3671
at University of C
alifornia, Irvine on July 5, 2013http://rfs.oxfordjournals.org/
Dow
nloaded from
[15:47 30/10/2012 OEP-hhs112.tex] Page: 3672 3645–3683
The Review of Financial Studies / v 25 n 12 2012
suggests that equity issuance is complementary with the investment cateringidentified by Polk and Sapienza (2009).
There is no indication of a trend across turnover quintiles in the ability ofV/P to predict debt issuance. A trend in the V/P effect on TI is present acrossturnover quintiles, paralleling the effect of turnover on the sensitivity of EI tomisvaluation. The effects for TI are similar to those for EI in magnitude andsignificance.
5.2.6 Insider selling subsample regressions. Previous literature (e.g., Jenter2005) finds that insiders are more likely to sell (buy) their firm’s shares whenthey perceive their stock as overvalued (undervalued). If net insider selling isan indicator of equity overvaluation, by Hypothesis 3, the sensitivity of equityand total issuances to V/P will be greater when insider net selling is high. So,as a further test of Hypothesis 3, we condition on net insider selling. In contrastwith the tests that condition on V/P itself, this tests whether the sensitivity ofissuance to misvaluation is greater among firms that are recognized by managersto be overvalued.
Our measure of net insider selling, NSELL, is the number of insiderselling transactions deflated by the total number of insider buying and sellingtransactions in the fiscal year preceding the issuance measurement. Insidertrading data are obtained from Wharton Research Data Service (WRDS) for1986–2009, and for the years 1976–1985 from the National Archives andRecords Administration.14 We define insiders as the top four executives (CEO,CFO, Chairman of Board, and President). Only 6.4% of our sample observationshave nonmissing insider trading data, so we form NSELL terciles rather thanquintiles.
Table 8 reports the relation of V/P to issuance by NSELL tercile. Evenin this severely reduced subsample, we still observe that high net insiderselling firms have a higher sensitivity of equity issuance to V/P , with anintertercile difference in the V/P coefficient between the high and low NSELL
terciles of 4.23 (t =−1.94). Likewise, high NSELL firms also appear to have ahigher sensitivity of total issuance than low NSELL firms, with an interterciledifference in the V/P effect of −5.22. This effect is also economicallysubstantial, but the difference is statistically insignificant owing to the smallsample size. However, we will see in Section 5.4 that the intertercile differencein the V/P effect on TI is statistically significant in an integrated regressionspecification. These findings give further support for Hypothesis 3.
5.3 Time-variation in misvaluation effectsIn Section 3.3, we saw that stock valuation was low in the early part of thesample period, a time in which equity issuances were low compared to debt
14 These are records of insider trades on Forms 3 and 4 filed with the U.S. Securities and Exchange Commission. Weexclude the following from the insider trading data: low-quality insider trading data marked by WRDS, insidertransactions of less than 100 shares, employee benefit plan transactions, and derivative transactions.
3672
at University of C
alifornia, Irvine on July 5, 2013http://rfs.oxfordjournals.org/
Dow
nloaded from
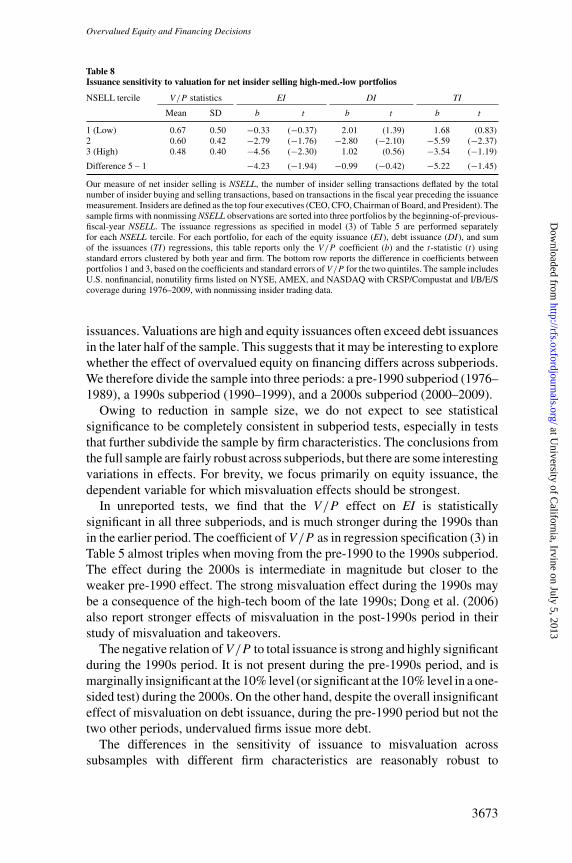
[15:47 30/10/2012 OEP-hhs112.tex] Page: 3673 3645–3683
Overvalued Equity and Financing Decisions
Table 8Issuance sensitivity to valuation for net insider selling high-med.-low portfolios
NSELL tercile V/P statistics EI DI TI
Mean SD b t b t b t
1 (Low) 0.67 0.50 −0.33 (−0.37) 2.01 (1.39) 1.68 (0.83)2 0.60 0.42 −2.79 (−1.76) −2.80 (−2.10) −5.59 (−2.37)3 (High) 0.48 0.40 −4.56 (−2.30) 1.02 (0.56) −3.54 (−1.19)
Difference 5 – 1 −4.23 (−1.94) −0.99 (−0.42) −5.22 (−1.45)
Our measure of net insider selling is NSELL, the number of insider selling transactions deflated by the totalnumber of insider buying and selling transactions, based on transactions in the fiscal year preceding the issuancemeasurement. Insiders are defined as the top four executives (CEO, CFO, Chairman of Board, and President). Thesample firms with nonmissing NSELL observations are sorted into three portfolios by the beginning-of-previous-fiscal-year NSELL. The issuance regressions as specified in model (3) of Table 5 are performed separatelyfor each NSELL tercile. For each portfolio, for each of the equity issuance (EI), debt issuance (DI), and sumof the issuances (TI) regressions, this table reports only the V/P coefficient (b) and the t-statistic (t) usingstandard errors clustered by both year and firm. The bottom row reports the difference in coefficients betweenportfolios 1 and 3, based on the coefficients and standard errors of V/P for the two quintiles. The sample includesU.S. nonfinancial, nonutility firms listed on NYSE, AMEX, and NASDAQ with CRSP/Compustat and I/B/E/Scoverage during 1976–2009, with nonmissing insider trading data.
issuances. Valuations are high and equity issuances often exceed debt issuancesin the later half of the sample. This suggests that it may be interesting to explorewhether the effect of overvalued equity on financing differs across subperiods.We therefore divide the sample into three periods: a pre-1990 subperiod (1976–1989), a 1990s subperiod (1990–1999), and a 2000s subperiod (2000–2009).
Owing to reduction in sample size, we do not expect to see statisticalsignificance to be completely consistent in subperiod tests, especially in teststhat further subdivide the sample by firm characteristics. The conclusions fromthe full sample are fairly robust across subperiods, but there are some interestingvariations in effects. For brevity, we focus primarily on equity issuance, thedependent variable for which misvaluation effects should be strongest.
In unreported tests, we find that the V/P effect on EI is statisticallysignificant in all three subperiods, and is much stronger during the 1990s thanin the earlier period. The coefficient of V/P as in regression specification (3) inTable 5 almost triples when moving from the pre-1990 to the 1990s subperiod.The effect during the 2000s is intermediate in magnitude but closer to theweaker pre-1990 effect. The strong misvaluation effect during the 1990s maybe a consequence of the high-tech boom of the late 1990s; Dong et al. (2006)also report stronger effects of misvaluation in the post-1990s period in theirstudy of misvaluation and takeovers.
The negative relation of V/P to total issuance is strong and highly significantduring the 1990s period. It is not present during the pre-1990s period, and ismarginally insignificant at the 10% level (or significant at the 10% level in a one-sided test) during the 2000s. On the other hand, despite the overall insignificanteffect of misvaluation on debt issuance, during the pre-1990 period but not thetwo other periods, undervalued firms issue more debt.
The differences in the sensitivity of issuance to misvaluation acrosssubsamples with different firm characteristics are reasonably robust to
3673
at University of C
alifornia, Irvine on July 5, 2013http://rfs.oxfordjournals.org/
Dow
nloaded from
[15:47 30/10/2012 OEP-hhs112.tex] Page: 3674 3645–3683
The Review of Financial Studies / v 25 n 12 2012
subperiod. The conclusion that the sensitivity of EI to misvaluation is greatestamong overvalued firms is robust and highly significant in all three subperiods.It is especially pronounced in the 1990s period—the V/P effect among the topvaluation quintile during the 1990s period is almost double that of the pre-1990or the 2000s subperiods. The finding that small firms have greater sensitivityof EI to misvaluation is present in the 2000s period and is especially intense inthe 1990s period, but is not significant in the pre-1990 period.
The greater sensitivity of EI to overvaluation among growth firms exists inthe 1990s and 2000s periods, but not the pre-1990 period. It is much morepronounced in the 1990s period—the growth-value interquintile difference inV/P effect on EI during the 1990s is almost triple that of the 2000s. The findingthat the sensitivity of EI to misvaluation is greatest among high R&D firms isstrong in the pre-1990 period and the 1990s but is not present in the 2000s.
Finally, the full-sample finding that high turnover firms have highersensitivity of EI to V/P applies strongly during the 1990s, with 10%significance in the 2000s, and does not apply during the 1980s. This suggeststhat catering effects grew stronger in the 1990s.
5.4 Regression interaction testsTo test the predictions in Hypotheses 3–7 more fully, we use an integratedregression approach rather than running separate subsample regressions as inTables 6–8. We define an indicator variable I (X) for each conditioning variableX, where X is one of the conditioning variables examined in Tables 6–8 (V/P ,B/P , RD, T A, T urnover , or NSELL). I (X) is equal to 0.5 if X is in X-quintile 5 and is equal to −0.5 if X is in quintile 1. We augment the baselineregression model (i.e., Model 3 of Table 5) with interaction variables of I (X)with each of the baseline independent variables along with the intercept.15
Therefore, the coefficient on the interaction of any variable with I (X) reflectsthe difference in the effect of this variable between X-quintiles 5 and 1.16
Table 9 reports only the interaction coefficient on V/P *I (X) and theassociated t-statistic. These statistics reflect the difference in the effect ofV/P on issuance between X-quintiles 5 and 1. The integrated regressions assummarized in Table 9 largely confirm the subsample regression results foundin Tables 6–8. All the V/P *I (X) coefficients in the EI and TI regressions havethe same signs as the coefficient differentials in the subsample regressions,and all are statistically significant at the 5% level or lower. These conclusionsobtain even when the conditioning variables are R&D, size, and NSELL, for
15 Tables 6–8 only report V/P coefficients across the X-quintiles, but in these regressions the effects of otherindependent variables such as B/P also differ across the quintiles. We therefore include the interaction betweenI (X) and each of the baseline independent variables in the regression.
16 Again, the sample is split into NSELL terciles rather than quintiles because of the severely reduced sample sizewhen the sample is limited to observations with nonmissing NSELL. Therefore, V/P *I (NSELL) reflects thedifference in the effect of V/P on EI between NSELL terciles 3 and 1.
3674
at University of C
alifornia, Irvine on July 5, 2013http://rfs.oxfordjournals.org/
Dow
nloaded from
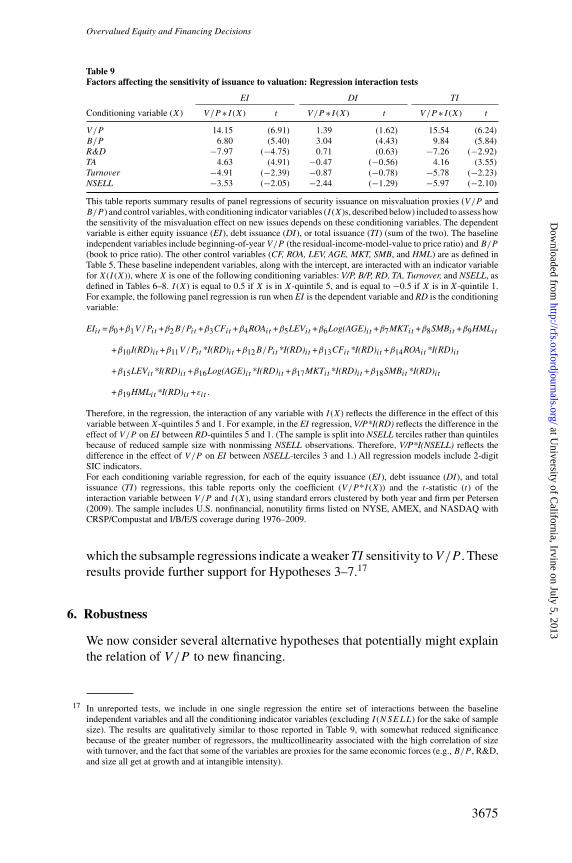
[15:47 30/10/2012 OEP-hhs112.tex] Page: 3675 3645–3683
Overvalued Equity and Financing Decisions
Table 9Factors affecting the sensitivity of issuance to valuation: Regression interaction tests
EI DI TI
Conditioning variable (X) V/P ∗I (X) t V /P ∗I (X) t V /P ∗I (X) t
V /P 14.15 (6.91) 1.39 (1.62) 15.54 (6.24)B/P 6.80 (5.40) 3.04 (4.43) 9.84 (5.84)R&D −7.97 (−4.75) 0.71 (0.63) −7.26 (−2.92)TA 4.63 (4.91) −0.47 (−0.56) 4.16 (3.55)Turnover −4.91 (−2.39) −0.87 (−0.78) −5.78 (−2.23)NSELL −3.53 (−2.05) −2.44 (−1.29) −5.97 (−2.10)
This table reports summary results of panel regressions of security issuance on misvaluation proxies (V/P andB/P ) and control variables, with conditioning indicator variables (I (X)s, described below) included to assess howthe sensitivity of the misvaluation effect on new issues depends on these conditioning variables. The dependentvariable is either equity issuance (EI), debt issuance (DI), or total issuance (TI) (sum of the two). The baselineindependent variables include beginning-of-year V/P (the residual-income-model-value to price ratio) and B/P
(book to price ratio). The other control variables (CF, ROA, LEV, AGE, MKT, SMB, and HML) are as defined inTable 5. These baseline independent variables, along with the intercept, are interacted with an indicator variablefor X(I (X)), where X is one of the following conditioning variables: V/P, B/P, RD, TA, Turnover, and NSELL, asdefined in Tables 6–8. I (X) is equal to 0.5 if X is in X-quintile 5, and is equal to −0.5 if X is in X-quintile 1.For example, the following panel regression is run when EI is the dependent variable and RD is the conditioningvariable:
EIit =β0 +β1V/Pit +β2B/Pit +β3CFit +β4ROAit +β5LEVit +β6Log(AGE)it +β7MKTit +β8SMBit +β9HMLit
+β10I(RD)it +β11V/Pit *I(RD)it +β12B/Pit *I(RD)it +β13CFit *I(RD)it +β14ROAit *I(RD)it
+β15LEVit *I(RD)it +β16Log(AGE)it *I(RD)it +β17MKTit *I(RD)it +β18SMBit *I(RD)it
+β19HMLit *I(RD)it +εit .
Therefore, in the regression, the interaction of any variable with I (X) reflects the difference in the effect of thisvariable between X-quintiles 5 and 1. For example, in the EI regression, V/P*I(RD) reflects the difference in theeffect of V/P on EI between RD-quintiles 5 and 1. (The sample is split into NSELL terciles rather than quintilesbecause of reduced sample size with nonmissing NSELL observations. Therefore, V/P*I(NSELL) reflects thedifference in the effect of V/P on EI between NSELL-terciles 3 and 1.) All regression models include 2-digitSIC indicators.For each conditioning variable regression, for each of the equity issuance (EI), debt issuance (DI), and totalissuance (TI) regressions, this table reports only the coefficient (V/P *I (X)) and the t-statistic (t) of theinteraction variable between V/P and I (X), using standard errors clustered by both year and firm per Petersen(2009). The sample includes U.S. nonfinancial, nonutility firms listed on NYSE, AMEX, and NASDAQ withCRSP/Compustat and I/B/E/S coverage during 1976–2009.
which the subsample regressions indicate a weaker TI sensitivity to V/P . Theseresults provide further support for Hypotheses 3–7.17
6. Robustness
We now consider several alternative hypotheses that potentially might explainthe relation of V/P to new financing.
17 In unreported tests, we include in one single regression the entire set of interactions between the baselineindependent variables and all the conditioning indicator variables (excluding I (NSELL) for the sake of samplesize). The results are qualitatively similar to those reported in Table 9, with somewhat reduced significancebecause of the greater number of regressors, the multicollinearity associated with the high correlation of sizewith turnover, and the fact that some of the variables are proxies for the same economic forces (e.g., B/P , R&D,and size all get at growth and at intangible intensity).
3675
at University of C
alifornia, Irvine on July 5, 2013http://rfs.oxfordjournals.org/
Dow
nloaded from
[15:47 30/10/2012 OEP-hhs112.tex] Page: 3676 3645–3683
The Review of Financial Studies / v 25 n 12 2012
6.1 Earnings forecast management in advance of issuancePrevious research documents that firms manage earnings upward in advanceof equity issues (Teoh, Welch, and Wong 1998a, 1998b) and that such earningsmanagement is associated with higher analyst forecasts (Teoh and Wong 2002).This raises the possibility that such higher forecasts increase V/P via thenumerator.
It is not obvious whether this biases our tests, because the higher analystforecasts that raise V may also be associated with higher market valuationsP . Indeed, the abovementioned studies provide postevent return evidencesuggesting that earnings management does increase market valuations priorto new issues. Furthermore, Teoh and Wong (2002) find that this effect isfacilitated by the upward earnings management on analyst forecasts.
If this bias is present, it would operate against the effects we find. If earningsmanagement causes an increase in V/P prior to new issues, and if this effectis strong for larger issues, that would induce a positive association between thetwo variables, which would oppose the misvaluation hypothesis that overvaluedfirms issue more equity. Our finding is a negative relation between the twovariables. So, to the extent that this bias is important, the true effect is evenstronger than what we have estimated.
6.2 Time-varying adverse selection, disagreement, and analyst forecastbiases
We first consider several possible channels through which V/P might beproxying for something other than misvaluation, with a focus on how analystsmake forecasts. Lucas and McDonald (1990) extend the theory of Myers andMajluf (1984) to a dynamic setting to derive implications about how adverseselection effects vary over time. Choe, Masulis, and Nanda (1993) considerhow time-varying adverse selection affects aggregate equity issues. The time-varying adverse selection hypothesis is also tested in Dittmar and Thakor(2007). Variation in information asymmetry may affect the accuracy or biasof the analyst forecasts used in the calculation of V/P , which in some fashionmight induce correlations between V/P and issuance.
Furthermore, Dittmar and Thakor (2007) present and test a model thatpredicts that firms are more likely to issue equity when prices are high, so thatinvestors are in agreement with managers’ investment decisions and are likelyto respond positively to additional investment. If prices are low, indicatingmore disagreement between investors and managers, then managers are moreinclined to issue debt. This raises the possibility that disagreement (regardlessof whether it derives from information asymmetry) might induce correlationsbetween V/P and issuance.
Our earlier tests already address any tendency for time-varying adverseselection or disagreement to affect the time series of V/P and issuance, aswe find strong cross-firm misvaluation effects on issuance (Tables 3 and 4). Toaddress cross-sectional effects of adverse selection or disagreement, we include
3676
at University of C
alifornia, Irvine on July 5, 2013http://rfs.oxfordjournals.org/
Dow
nloaded from
[15:47 30/10/2012 OEP-hhs112.tex] Page: 3677 3645–3683
Overvalued Equity and Financing Decisions
proxies for information asymmetry and disagreement in the issuance regression.In unreported tests, we consider three proxies for information asymmetry ordisagreement and possible forecast bias: number of analysts following the firm,analyst forecast error (mean forecasted earnings minus actual earnings) scaledby actual earnings, and dispersion in analyst one-year unadjusted earningsforecast deflated by book value per share. When we include these additionalvariables, the results are similar to those of our baseline regression (Model 3of Table 5).
Finally, Richardson, Teoh, and Wysocki (2004) show that analyst forecasts,which are upward biased at long time horizons, switch to being downwardbiased close to the earnings announcement, and that this “walk-down” tobeatable forecasts is stronger for high market-to-book and larger firms. If thewalk-down drives our findings about the relation of issuance to V/P , thenthe sensitivity of issuance to V/P should be especially strong among growthfirms and large firms, for which the walk-down is strongest. We do find thatthe sensitivity of equity issuance to V/P is stronger among growth firms.However, we also find that the effect of firm size is in the opposite direction ofthat implied by the proposed bias: The sensitivity of equity issuance to V/P isstrongest among small firms. So, it is unlikely that analyst walk-down explainsour findings.
6.3 Macroeconomic influences on financing decisionsAs shown in Table 2, issuances and valuation ratios vary substantially over time.Choe, Masulis, and Nanda (1993) document the relation of business cycles toissuing decisions. These effects may be driven by shifts in growth opportunities,but our empirical approach was designed to filter out and control for growtheffects. However, as discussed in Choe, Masulis, and Nanda (1993), there areother possible reasons for the time variation in issuance and valuation ratios.
One possibility is that as macroeconomic conditions fluctuate, they affectthe level of new issues, and that these shifts are correlated over time withthe misvaluation proxy V/P . This possibility would not, however, explain theresults of our purely cross-sectional tests (Tables 3 and 4).
A different possibility is that macroeconomic conditions differentially affectissuance of different firms in the cross-section, and also affect the cross-sectionof measurement error in the misvaluation proxy V/P . To address this, weadd macrovariables as controls in the issuance regressions. Our proxies formacroeconomic conditions are the value-weighted market index return overthe prior one-year period (RET 1Y ), and the real GDP growth rate over theprior year (GDPG).
Table 10 reports the augmented regressions with one of the macroeconomicvariables and its interaction with V/P included as independent variables (weinclude Model 1, the baseline regression, for ease of comparison). None ofthe baseline regression coefficients are affected much by the inclusion ofthese macrovariables. There is an indication that firms tend to issue more debt
3677
at University of C
alifornia, Irvine on July 5, 2013http://rfs.oxfordjournals.org/
Dow
nloaded from
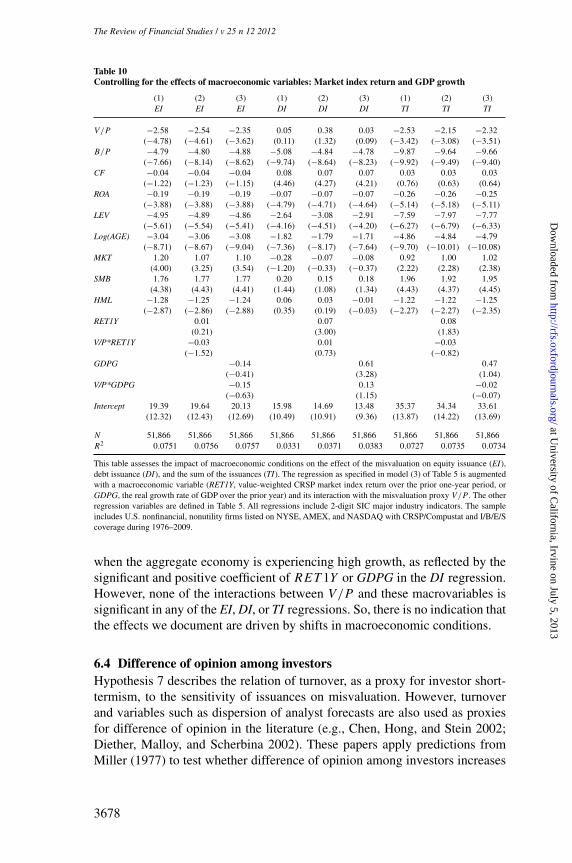
[15:47 30/10/2012 OEP-hhs112.tex] Page: 3678 3645–3683
The Review of Financial Studies / v 25 n 12 2012
Table 10Controlling for the effects of macroeconomic variables: Market index return and GDP growth
(1) (2) (3) (1) (2) (3) (1) (2) (3)EI EI EI DI DI DI TI TI TI
V/P −2.58 −2.54 −2.35 0.05 0.38 0.03 −2.53 −2.15 −2.32(−4.78) (−4.61) (−3.62) (0.11) (1.32) (0.09) (−3.42) (−3.08) (−3.51)
B/P −4.79 −4.80 −4.88 −5.08 −4.84 −4.78 −9.87 −9.64 −9.66(−7.66) (−8.14) (−8.62) (−9.74) (−8.64) (−8.23) (−9.92) (−9.49) (−9.40)
CF −0.04 −0.04 −0.04 0.08 0.07 0.07 0.03 0.03 0.03(−1.22) (−1.23) (−1.15) (4.46) (4.27) (4.21) (0.76) (0.63) (0.64)
ROA −0.19 −0.19 −0.19 −0.07 −0.07 −0.07 −0.26 −0.26 −0.25(−3.88) (−3.88) (−3.88) (−4.79) (−4.71) (−4.64) (−5.14) (−5.18) (−5.11)
LEV −4.95 −4.89 −4.86 −2.64 −3.08 −2.91 −7.59 −7.97 −7.77(−5.61) (−5.54) (−5.41) (−4.16) (−4.51) (−4.20) (−6.27) (−6.79) (−6.33)
Log(AGE) −3.04 −3.06 −3.08 −1.82 −1.79 −1.71 −4.86 −4.84 −4.79(−8.71) (−8.67) (−9.04) (−7.36) (−8.17) (−7.64) (−9.70) (−10.01) (−10.08)
MKT 1.20 1.07 1.10 −0.28 −0.07 −0.08 0.92 1.00 1.02(4.00) (3.25) (3.54) (−1.20) (−0.33) (−0.37) (2.22) (2.28) (2.38)
SMB 1.76 1.77 1.77 0.20 0.15 0.18 1.96 1.92 1.95(4.38) (4.43) (4.41) (1.44) (1.08) (1.34) (4.43) (4.37) (4.45)
HML −1.28 −1.25 −1.24 0.06 0.03 −0.01 −1.22 −1.22 −1.25(−2.87) (−2.86) (−2.88) (0.35) (0.19) (−0.03) (−2.27) (−2.27) (−2.35)
RET1Y 0.01 0.07 0.08(0.21) (3.00) (1.83)
V/P*RET1Y −0.03 0.01 −0.03(−1.52) (0.73) (−0.82)
GDPG −0.14 0.61 0.47(−0.41) (3.28) (1.04)
V/P*GDPG −0.15 0.13 −0.02(−0.63) (1.15) (−0.07)
Intercept 19.39 19.64 20.13 15.98 14.69 13.48 35.37 34.34 33.61(12.32) (12.43) (12.69) (10.49) (10.91) (9.36) (13.87) (14.22) (13.69)
N 51,866 51,866 51,866 51,866 51,866 51,866 51,866 51,866 51,866R2 0.0751 0.0756 0.0757 0.0331 0.0371 0.0383 0.0727 0.0735 0.0734
This table assesses the impact of macroeconomic conditions on the effect of the misvaluation on equity issuance (EI),debt issuance (DI), and the sum of the issuances (TI). The regression as specified in model (3) of Table 5 is augmentedwith a macroeconomic variable (RET1Y, value-weighted CRSP market index return over the prior one-year period, orGDPG, the real growth rate of GDP over the prior year) and its interaction with the misvaluation proxy V/P . The otherregression variables are defined in Table 5. All regressions include 2-digit SIC major industry indicators. The sampleincludes U.S. nonfinancial, nonutility firms listed on NYSE, AMEX, and NASDAQ with CRSP/Compustat and I/B/E/Scoverage during 1976–2009.
when the aggregate economy is experiencing high growth, as reflected by thesignificant and positive coefficient of RET 1Y or GDPG in the DI regression.However, none of the interactions between V/P and these macrovariables issignificant in any of the EI, DI, or TI regressions. So, there is no indication thatthe effects we document are driven by shifts in macroeconomic conditions.
6.4 Difference of opinion among investorsHypothesis 7 describes the relation of turnover, as a proxy for investor short-termism, to the sensitivity of issuances on misvaluation. However, turnoverand variables such as dispersion of analyst forecasts are also used as proxiesfor difference of opinion in the literature (e.g., Chen, Hong, and Stein 2002;Diether, Malloy, and Scherbina 2002). These papers apply predictions fromMiller (1977) to test whether difference of opinion among investors increases
3678
at University of C
alifornia, Irvine on July 5, 2013http://rfs.oxfordjournals.org/
Dow
nloaded from
[15:47 30/10/2012 OEP-hhs112.tex] Page: 3679 3645–3683
Overvalued Equity and Financing Decisions
market valuations. This raises the question of whether our tests of Hypothesis 7may actually be picking up the effects of investor disagreement on valuation,as reflected in V/P .
To distinguish these interpretations, in unreported tests, we regress turnoveron V/P to construct a residual turnover measure that is orthogonal to V/P .We then use residual turnover as the conditioning variable in lieu of turnoverin the subsample regression test of Table 7, Panel B, as well as in the integratedregression approach as in Table 9. We find that sensitivities of equity issuanceand total issuance to overvaluation as proxied by V/P is much higher infirms with high residual turnover. This is consistent with the interpretationthat turnover is capturing the effects of investor short-termism rather thaninvestor-disagreement-induced overvaluation.
6.5 Risk
Despite the design of V to purify P in V/P , and our inclusion of controlsfor growth opportunities and risk, V/P could be capturing risk effects. Ceterisparibus, when the risk of a firm declines, its price increases, which reducesV/P . Furthermore, ceteris paribus, we expect the firm to invest more, whichcould be associated with equity issuance.
Some findings in past literature cast doubts upon this risk pathway ofcausality. Suppose that the conventional risk controls we use in this study failto adequately capture risk. The study of Autore, Bray, and Peterson (2009)examines post-issue returns conditioning on firms’ stated plans for use ofissue proceeds and finds that “…issuers stating recapitalization or generalcorporate purposes experience abnormally poor performance in the subsequentthree years, but issuers stating investment display little or no subsequentunderperformance.” In contrast, under the risk pathway, the firms that areinvesting the proceeds should have low risk and hence low subsequent returnperformance relative to conventional benchmarks.
Furthermore, in the risk account, issuers that have high market-to-book havelow risk and hence should invest more of their issue proceeds. But, Kim andWeisbach (2008) find that high market-to-book firms have a greater tendency toraise capital and not invest it. Furthermore, the insiders of such firms are moreprone to sell, which Kim and Weisbach argue is consistent with their exploitingovervaluation.
Of course, it is impossible for us to completely rule out the possibility thatvariations in V/P reflect variations in risk and that it is risk that is causing equityissuance. However, in unreported tests, we find that when firms are sorted intoquintile subsamples based on previous change in investment (the sum of capitalexpenditures and R&D), or when firms are double-sorted based on the signs ofprevious equity issuance and previous change in investment, V/P continuesto be a strong and highly significant positive predictor of returns within eachof the subsamples. So, controlling for either investment change or use of funds
3679
at University of C
alifornia, Irvine on July 5, 2013http://rfs.oxfordjournals.org/
Dow
nloaded from
[15:47 30/10/2012 OEP-hhs112.tex] Page: 3680 3645–3683
The Review of Financial Studies / v 25 n 12 2012
from issuance (which, in the risk account, are proxies for the shift in risk) doesnot seem to hamper the ability of V/P to predict future returns.
7. Concluding Remarks
An implication of the inefficient markets approach to financing decisions is thatfirms raise more capital, and especially issue more equity, when their shares areovervalued. We test whether equity misvaluation as measured by the ratio ofresidual income valuation to price (V/P ) affects the net amount of equity anddebt issuances. We measure misvaluation by the value/price ratio V/P , insteadof book/price (B/P ), to focus more sharply on the effects of mispricing asopposed to growth opportunities or management quality.
Using the purified measure, V/P , we find strong evidence that greaterovervaluation predicts greater total and equity issuance. Furthermore,consistent with the incentive for overvalued firms to substitute from debt toequity issuance, the sensitivity of equity issuance to overvaluation is greater(more positive) than that of debt issuance.
There are different possible reasons why misvaluation affects financing.Jensen (2004, 2005) provides a catering argument, that the pressure onmanagers to take actions such as raising capital to finance ambitious projectsis especially strong among overvalued firms. Also, owing to project-scaleeconomies, the effect of misvaluation on issuance is likely to be strongest amongovervalued firms. Consistent with these explanations, we find that the sensitivityof total issuance and equity issuance to misvaluation is much stronger amongfirms in the lowest V/P quintiles. Similarly, using insider selling as a proxyfor equity overvaluation, we confirm in the subsample with nonmissing insidertrading data that the marginal effect of V/P on equity issuance is greater amongfirms with high net insider selling. The nonlinear effect of V/P is especiallystrong in the 1990s period that Jensen and others have identified as havingstrong valuation effects on investment. For example, Shleifer (2000) attributedthe boom in high-tech IPOs during this period to irrational overvaluation.
To explore inefficient markets theories of financing decisions in moredepth, we examine how the effects of misvaluation on security issuancesdiffer in subsamples of firms sorted by different conditioning variables.Consistent with the catering and project-scale economy theories, we find thatthe sensitivity of issuance to misvaluation is stronger among firms with highgrowth opportunities, as measured either by low book-to-market ratios or byhigh levels of R&D expenditures; and that small firms have a much highersensitivity of total issuance and equity issuance to misvaluation than do largefirms, especially during the 1990s. Consistent with greater catering by firms intheir investment/financing decisions when investors have short time horizons(Polk and Sapienza 2009), we also find that the sensitivity of equity issuanceand total issuance to misvaluation is greatest among firms with high stockturnover.
3680
at University of C
alifornia, Irvine on July 5, 2013http://rfs.oxfordjournals.org/
Dow
nloaded from
[15:47 30/10/2012 OEP-hhs112.tex] Page: 3681 3645–3683
Overvalued Equity and Financing Decisions
The relationship between equity overvaluation and new issues couldpotentially be influenced by several other forces considered in previousliterature, such as time-varying adverse selection, management-investordisagreement, divergence of investor opinion, and macroeconomic conditions.Robustness checks provide evidence that the effect of misvaluation on issuanceobtains even after controlling for these other possible effects. Overall, theevidence presented here supports the proposition that overvalued equity isimportant for firms’ financing decisions, and is consistent with explanationsbased upon catering, project-scale economies, and investor short-termism.
References
Ali, A., L.-S. Hwang, and M. A. Trombley. 2003. Residual-income-based valuation predicts future stock returns:Evidence on mispricing versus risk explanations. Accounting Review 78:377–96.
Autore, D., D. Bray, and D. Peterson. 2009. Intended use of proceeds and the long-run performance of seasonedequity issuers. Journal of Corporate Finance 15:358–67.
Baker, M., R. S. Ruback, and J. Wurgler. 2007. Behavioral corporate finance: A survey. In Handbook of corporatefinance: Empirical corporate finance, Volume 1, Chap. 4, pp. 145–183. Ed. E. Eckbo.Amsterdam: North Holland.
Baker, M., and J. Wurgler. 2000. The equity share in new issues and aggregate stock returns. Journal of Finance55:2219–57.
———. 2002. Market timing and capital structure. Journal of Finance 57:1–32.
Baker, M., J. Stein, and J. Wurgler. 2003. When does the market matter? Stock prices and the investment ofequity-dependent firms. Quarterly Journal of Economics 118:969–1005.
Barberis, N., and M. Huang. 2001. Mental accounting, loss aversion, and individual stock returns. Journal ofFinance 56:1247–92.
Bayless, M., and S. Chaplinsky. 1996. Is there a window of opportunity for seasoned equity issuance? Journalof Finance 51:253–78.
Brainard, W., and J. Tobin. 1968. Pitfalls in financial model building. American Economic Review: Papers andProceedings 58:99–122.
Butler, A. W., J. Cornaggia, G. Grullon, and J. P. Weston. 2011. Corporate financing decisions, managerial markettiming, and real investment. Journal of Financial Economics 101:666–83.
Chen, J., H. Hong, and J. C. Stein. 2002. Breadth of ownership and stock returns. Journal of Financial Economics66:171–205.
Choe, H., R. W. Masulis, and V. Nanda. 1993. Common stock offerings across the business cycle: Theory andevidence. Journal of Empirical Finance 1:3–31.
Daniel, K. D., D. Hirshleifer, and A. Subrahmanyam. 2001. Overconfidence, arbitrage, and equilibrium assetpricing. Journal of Finance 56:921–65.
Daniel, K. D., and S. Titman. 1997. Evidence on the characteristics of cross-sectional variation in common stockreturns. Journal of Finance 52:1–33.
DeAngelo, H., L. DeAngelo, and R. M. Stulz. 2010. Seasoned equity offerings, market timing, and the corporatelifecycle. Journal of Financial Economics 95:275–95.
Diether, K. B., C. J. Malloy, andA. Scherbina. 2002. Differences of opinion and the cross-section of stock returns.Journal of Finance 57:2113–41.
Dittmar, A. K., and A. Thakor. 2007. Why do firms issue equity? Journal of Finance 62:1–54.
3681
at University of C
alifornia, Irvine on July 5, 2013http://rfs.oxfordjournals.org/
Dow
nloaded from
[15:47 30/10/2012 OEP-hhs112.tex] Page: 3682 3645–3683
The Review of Financial Studies / v 25 n 12 2012
D’Mello, R., and P. K. Shroff. 2000. Equity undervaluation and decisions related to repurchase tender offers: Anempirical investigation. Journal of Finance 55:2399–424.
Dong, M., D. Hirshleifer, S. Richardson, and S. H. Teoh. 2006. Does investor misvaluation drive the takeovermarket? Journal of Finance 61:725–62.
Dong, M., I. Loncarski, J. ter Horst, and C. Veld. 2012. What drives security issuance decisions: Market timing,pecking order, or both? Financial Management 41:637–63.
Eckbo, B. E., and R. W. Masulis. 1995. Seasoned equity offerings:Asurvey. In Handbooks in operations researchand management science and management science, Volume 9, Chapter 31, pp. 1017–72. Eds. R. A. Jarrow, V.Maksimovic, and W. T. Ziemba. Amsterdam: North Holland.
Fama, E. F. 1998. Market efficiency, long-term returns, and behavioral finance. Journal of Financial Economics49:283–306.
Frankel, R., and C. Lee. 1998. Accounting valuation, market expectation, and the book-to-market effect. Journalof Accounting and Economics 25:283–321.
Gilchrist, S., C. Himmelberg, and G. Huberman. 2005. Do stock price bubbles influence corporate investment?Journal of Monetary Economics 52:805–27.
Graham, J. R., and C. R. Harvey. 2001. The theory and practice of corporate finance: Evidence from the field.Journal of Financial Economics 60:187–243.
Henderson, B. J., N. Jegadeesh, and M. S. Weisbach. 2006. World markets for raising new capital. Journal ofFinancial Economics 82:63–101.
Ikenberry, D., J. Lakonishok, and T. Vermaelen. 1995. Market underreaction to open market share repurchases.Journal of Financial Economics 39:181–208.
Jensen, M. C. 2004. Agency costs of overvalued equity. Working Paper, Harvard Business School.
———. 2005. Agency costs of overvalued equity. Financial Management 34:5–19.
Jenter, D. 2005. Market timing and managerial portfolio decision. Journal of Finance 60:1903–49.
Kaplan, S. N., and L. Zingales. 1997. Do investment–cash-flow sensitivities provide useful measures of financingconstraints? Quarterly Journal of Economics 113:169–215.
Kim, W., and M. S. Weisbach. 2008. Motivations for public equity offers: An international perspective. Journalof Financial Economics 87:281–307.
Korajczyk, R. A., D. J. Lucas, and R. L. McDonald. 1991. The effect of information releases on the pricing andtiming of equity issues. Review of Financial Studies 4:685–708.
Lakonishok, J., and T. Vermaelen. 1990. Anomalous price behavior around repurchase tender offers. Journal ofFinance 45:455–77.
Lee, C. M., J. Myers, and B. Swaminathan. 1999. What is the intrinsic value of the Dow? Journal of Finance54:1693–741.
Ljungqvist, A., V. Nanda, and R. Singh. 2006. Hot markets, investor sentiment, and IPO pricing. Journal ofBusiness 79:1667–702.
Loughran, T., and J. Ritter. 1995. The new issues puzzle. Journal of Finance 50:23–52.
———. 2000. Uniformly least powerful tests of market efficiency. Journal of Financial Economics 55:361–89.
Lucas, D. J., and R. L. McDonald. 1990. Equity issues and stock price dynamics. Journal of Finance 45:1019–43.
Lyandres, E., L. Sun, and L. Zhang. 2008. The new issues puzzle: Testing the investment-based explanation.Review of Financial Studies 21:2825–55.
Miller, E. M. 1977. Risk, uncertainty, and divergence of opinion. Journal of Finance 32:1151–68.
3682
at University of C
alifornia, Irvine on July 5, 2013http://rfs.oxfordjournals.org/
Dow
nloaded from
[15:47 30/10/2012 OEP-hhs112.tex] Page: 3683 3645–3683
Overvalued Equity and Financing Decisions
Moskowitz, T. J., and M. Grinblatt. 1999. Do industries explain momentum? Journal of Finance 54:1249–90.
Myers, S. C., and N. S. Majluf. 1984. Corporate financing and investment decisions when firms have informationthat investors do not have. Journal of Financial Economics 13:187–221.
Newey, W. K., and K. D. West. 1987. A simple, positive semi-definite, heteroskedasticity and autocorrelationconsistent covariance matrix. Econometrica 55:703–8.
Ohlson, J. 1995. Earnings, book values, and dividends in equity valuation. Contemporary Accounting Research11:661–87.
Petersen, M. A. 2009. Estimating standard errors in finance panel data sets: Comparing approaches. Review ofFinancial Studies 22:435–80.
Peyer, U., and T. Vermaelen. 2009. The nature and persistence of buyback anomalies. Review of Financial Studies22:1693–745.
Polk, C., and P. Sapienza. 2009. The stock market and corporate investment: A test of catering theory. Review ofFinancial Studies 22:187–217.
Richardson, S., S. H. Teoh, and P. D. Wysocki. 2004. The walk-down to beatable analyst forecasts: The role ofequity issuance and insider trading incentives. Contemporary Accounting Research 21:885–924.
Ritter, J. R. 1991. The long-run performance of initial public offerings. Journal of Finance 46:3–27.
Shleifer, A. 2000. Are markets efficient? No, arbitrage is inherently risky. Wall Street Journal 236:A10.
Spiess, D. K., and J. Affleck-Graves. 1995. Underperformance in long-run stock returns following seasonedequity offerings. Journal of Financial Economics 38:243–68.
———. 1999. The long-run performance of stock returns following debt offers. Journal of Financial Economics54:45–73.
Stein, J. 1996. Rational capital budgeting in an irrational world. Journal of Business 69:429–55.
Teoh, S. H., I. Welch, and T. J. Wong. 1998a. Earnings management and the long-term market performance ofinitial public offerings. Journal of Finance 53:1935–74.
———. 1998b. Earnings management and the underperformance of seasoned equity offerings. Journal ofFinancial Economics 50:63–99.
Teoh, S. H., and T. Wong. 2002. Why do new issues and high accrual firms underperform? The role of analysts’credulity. Review of Financial Studies 15:869–900.
Teoh, S. H., T. J. Wong, and G. Rao. 1998. Are accruals during an initial public offering opportunistic? Reviewof Accounting Studies 3:175–208.
Titman, S., J. K. Wei, and F. Xie. 2004. Capital investment and stock returns. Journal of Financial and QuantitativeAnalysis 39:677–701.
Tobin, J. 1969. A general equilibrium approach to monetary theory. Journal of Money, Credit, and Banking1:15–29.
3683
at University of C
alifornia, Irvine on July 5, 2013http://rfs.oxfordjournals.org/
Dow
nloaded from