is the european semester effective and useful? -...
TRANSCRIPT

Konstantinos
Efstathiou (konstantinos.
is an Affiliate Fellow at
Bruegel.
Guntram Wolff (guntram
Director of Bruegel
Executive summary
We study whether and to what extent EU countries implement recommendations
on macroeconomic imbalances given by the EU in the so-called European Semester. We
assess how recommendations have evolved since 2013, based on a new database. We also
study how EU recommendations on addressing macroeconomic imbalances compare to
recommendations given by the International Monetary Fund.
Overall implementation of recommendations by EU countries has worsened in the
last few years, in particular when it comes to recommendations addressed to countries
with excessive macroeconomic imbalances. The policy content of the recommendations is
broadly aligned with economic priorities emphasised by their corresponding legal bases,
but to our surprise a sizable share of recommendations, such as on childcare, are also
labelled as relevant for resolving macroeconomic imbalances. Moreover, for countries
with macroeconomic imbalances, the IMF tends to emphasise financial imbalances more
frequently than the EU. We also note that the EU makes significant political choices about
which imbalances are judged to be excessive and which are judged not excessive.
Low implementation is likely a result of the fundamental dilemma facing the EU. National
policies have major cross-border implications making coordination important, but countries
take sovereign decisions mostly based on national considerations. We therefore argue that
recommendations given in the context of macroeconomic imbalances should be focused on
key issues of macroeconomic and cross-border relevance. Moreover, we note a significant
gap between analyses as described in the recitals of recommendations and the actual
recommendations, and would urge greater consistency. Finally, the European Semester
exercise is very difficult to digest and communication of key analyses and recommendations
could be significantly improved to make them more accessible to national policymakers.
Policy Contribution Issue n˚09 | June 2018 Is the European Semester
effective and useful?
Konstantinos Efstathiou and Guntram B. Wolff
2 Policy Contribution | Issue n˚09 | June 2018
IntroductionSince 2010, the European Semester has been the framework for the coordination of eco-
nomic policies across the European Union. Through the semester, EU countries discuss
their economic reform and budget plans and the European Commission monitors progress
at specific times throughout the year. The European Semester aims to ensure sound public
finances, prevent and correct excessive macroeconomic imbalances, foster structural reforms
and boost jobs, growth and investment. To meet these objectives, every year the European
Commission prepares recommendations for each member state on the basis of detailed
country-specific analyses. The Council of the EU subsequently modifies – if necessary – and
adopts the Commission proposals for these country-specific recommendations (CSRs). Na-
tional governments are then supposed to implement them. The process has become the key
EU mechanism for steering and guiding member states’ fiscal, macroeconomic and structural
policymaking.
The European Semester incorporates three separate processes that work in parallel:
• Fiscal surveillance based on the Stability and Growth Pact (SGP), which the EU tried to
strengthen significantly with a number of new regulations that came into force in 2011
and 2013.
• The so-called Macroeconomic Imbalances Procedure (MIP): The starting point for MIP
was the realisation that large macroeconomic imbalances built-up in the euro area in the
pre-crisis years and the EU lacked instruments to even monitor such imbalances1. The
unwinding of such imbalances was placing a huge strain on the euro area, and the EU
therefore put in place the MIP regulation in 2011 ((EU) 1176/2011) to correct imbalances2.
• Coordination of EU countries’ economic and employment policies, as foreseen in the
Treaty on the Functioning of the EU (TFEU) based on the integrated guidelines, a loose
form of policy coordination3.
This Policy Contribution evaluates member-state implementation of the country-specific
recommendations (CSRs) focussing on macroeconomic imbalances. We find that overall,
implementation has been modest but has worsened in recent years. In particular, implementa-
tion among countries with excessive imbalances has fallen significantly. Implementation rates
vary substantially for different countries and policy areas. Finally, the multi-annual assessment
shows that the implementation records of some countries improve when looking at a longer
period, but implementation is overall still weak.
We also assess the policy content of CSRs. Recommendations made under the MIP regu-
lation are often irrelevant for macro-financial imbalances and rather relate to the loose policy
coordination framework. Moreover, a comparison between the CSRs addressed to countries
with macroeconomic imbalances and relevant recommendations given by the International
Monetary Fund shows that, while in general the content, number, length, scope and level of
detail of recommendations in the two surveillance frameworks are quite similar, CSRs flag prob-
lems in the financial sector much less often than the IMF. The EU recommendations therefore
appear less pertinent to addressing macroeconomic imbalances than those of the IMF.
1 In particular: high current-account balances, large external debts, large corporate or household debt, excessive credit growth and wage/price developments that significantly diverged from the euro-area average.
2 In cases of non-compliance, the procedure allows – as a last resort – the imposition of sanctions on the non-compliant member state, similarly to the SGP procedure.
3 Coordination is founded on the broad economic policy guidelines and employment guidelines – which together form the so-called Integrated Guidelines – adopted every year by the Council. However, since 2010, the Integrated Guidelines have been revised only once, in 2015. The Integrated Guidelines reflect the Europe 2020 strategy for smart, sustainable and in-clusive growth and do not have any sanctions attached for non-compliance. They are thus the loosest form of coordination of national policies.

3 Policy Contribution | Issue n˚09 | June 2018
Box 1: A new dataset to analyse implementation of CSRs
To analyse trends in implementation of CSRs, we constructed a dataset of implementation
scores from the European Commission’s assessments of the implementation of recommen-
dations. There is good reason to believe these assessments are accurate. In a European Court
of Auditors survey of the members of the Economic Policy Committee – a group of national
officials that supports the work of ECOFIN4 – 89.5 percent of respondents described the Com-
mission’s assessment of implementation as completely or generally accurate (European Court
of Auditors, 2018).
We used the only publicly available sources of the Commission’s assessments – the Country
Reports5, which are published eight months after initial recommendations are given6. In these
reports, the Commission evaluates implementation at the aggregate CSR-level but also, starting
with the 2013 recommendations, at the disaggregated or subpart-level. Breaking CSRs up into
more specific components offers some clear advantages: evaluating implementation of recom-
mendations at this more granular level becomes easier, more accurate and more informative. To
illustrate, CSR 3 given to Spain in 2017 reads: “Ensure adequate and sustained investment in re-
search and innovation and strengthen its governance across government levels. Ensure a thorough
and timely implementation of the law on market unity for existing and forthcoming legislation”.
Arguably, though bundled together in the text, this CSR consists of two distinct subparts as it
recommends two totally different policy measures.
To the best of our knowledge, we are the first to systematically analyse implementation of
CSRs at the subpart level outside the European Commission (EC 2016, Bricongne and Turrini
2017)7. Our dataset, therefore, covers the period from 2013 to 2017 and contains the Commis-
sion’s implementation score for each subpart, which can be one of the following: ‘no progress’,
‘limited progress’, ‘some progress’, ‘substantial progress’ and ‘fully addressed’ (see the online
Annex 1). We transformed these scores into numerical variables of 0 for ‘no progress’, 25 for
‘limited progress’, 50 for ‘some progress’, 75 for ‘substantial progress’ and 100 for ‘fully addressed’,
in order to compare average implementation between aggregates.
As a result, the average implementation scores we compute should be interpreted careful-
ly: a mean implementation score of 100 (the maximum) indicates that all subparts addressed
have been fully implemented, whereas a score of 0 (minimum) means that there has been no
progress on any subpart. However, a score of 50 does not necessarily mean that half of recom-
mendations have been fully implemented and half have not. Rather, it indicates that there has
been ‘some progress’ with the recommendations on average.
Furthermore, we assign to each CSR subpart the policy areas that describe its content. As
in the internal database of the Commission, we chose up to three policy areas for each sub-
part from a set of 32 areas in total (see the online Annex 2), so relative frequencies of policy
areas sum up to more than 100 percent8. The dataset also contains for each subpart the corre-
sponding legal basis on which the recommendation is made. This is derived from the recitals
of the CSR text, which specify whether the CSR is relevant for the MIP.
4 See https://europa.eu/epc/home_en.5 For the 2013 CSRs, the information is taken from the Commission Staff Working Documents titled ‘Assessment of the
national reform programme and convergence /stability programme’. 6 Since 2015, these reports – published every February – have contained assessments of compliance with the previous year’s
CSRs. These assessments thus capture progress achieved within roughly eight months following the Council of the EU’s approval of the recommendations. Commission services continue to update their assessments regularly. The European Commission also carries out an assessment each spring (May) and a multi-annual assessment of the CSRs, ie not just in the year after the recommendations are made, but in all subsequent years. However, neither these subsequent assessments nor the database maintained for that purpose are made public.
7 As a rule, CSRs are broken down into subparts in our dataset as in the Country Reports, but in some cases the breakdown into subparts in the Country Reports does not clearly map to the CSR text.
8 A correspondence between subparts and policy areas is part of the Commission database but is not made public through the Country Reports. We are confident after a number of discussions that we closely approximate the Commission’s matching.

4 Policy Contribution | Issue n˚09 | June 2018
Finally, SGP-related subparts are not publicly evaluated in the Country Reports, ie starting
with the 2014 European Semester, since the fiscal data is only finalised after the publication
of the reports. We therefore exclude them from the sample whenever we calculate average
implementation scores over time.
Do countries comply with recommendations?From 2013-17, the implementation by EU countries of CSRs worsened (Figure 1). Overall average
implementation ranged between ‘limited progress’ and ‘some progress’, meaning that on average
member states fell short on adopting measures to at least partly address the recommendations or
follow up on the adoption of these measures with implementation. Darvas and Leandro (2015,
2016) found similar results for implementation at the CSR level from 2011-15. Interestingly, the de-
terioration in implementation coincides with the streamlining of the CSRs introduced by the Junck-
er Commission, which reduced their number and length. The implementation record is worse even
after all important caveats are taken into account. In a series of robustness checks, we controlled
for country composition, excluded policy recommendations in certain areas such as energy and
carried out sample checks excluding the SGP-related recommendations9. The main material result
did not change: implementation rates have fallen substantially since 2014.
But do countries with excessive macroeconomic imbalances comply better with recommenda-
tions? One would expect countries with excessive imbalances to implement the recommendations
more rigorously because their imbalances are a particularly relevant concern. And indeed, in 2013-
15, implementation scores were better. However, the decline in implementation since then has
been more substantial among member states facing excessive imbalances (Figure 1).
Over time, the MIP has been followed less by member states. Reasons for this decline in imple-
mentation could include the reduction of market pressure and the changing nature of the policy
challenges10.
Implementation has differed substantially across countries, as shown by average implementa-
tion scores with all recommendations from 2013-17 (Figure 2). The countries with highest imple-
mentation scores were Finland (53), the United Kingdom (51), Slovenia (48), Malta (46) and Spain
(44). Implementation was lowest in Luxembourg (23), Slovakia (29), Hungary (29), Germany (29)
and Bulgaria (30).
9 One issue is the inconsistency of the timing of the assessments (of the 2013 CSRs done in May 2014 vs. following years done in February). However, the drop in compliance occurs between the 2014 and 2015 rounds. A second issue is that the composition of the sample is not fixed over time. Firstly, there are changes in the composition of the subparts that are assessed. To ensure a fair comparison we exclude SGP related subparts for the reasons clarified in Box 1 from the entire sample. In addition, there was a significant reduction in energy, resources and climate change recommendations, which nevertheless has only a negligible effect on the implementation score. Secondly, the country composition of the sample changes, mainly because member states undergoing financial assistance programmes do not receive CSRs to avoid dupli-cation. However, the participation of these member states in later rounds of the European Semester does not explain the deterioration in compliance between 2013 and 2016.
10 Specifically, the countries with excessive imbalances in 2013 and 2014 narrowly avoided loss of market access and the possibility of having to accept a financial assistance programme (eg Spain in 2013, Italy in 2014 and Slovenia in both years). This fresh memory might have added to domestic political pressure to implement much-needed reforms. In con-trast, member states with excessive imbalances in later years, while still grappling with legacy problems that leave them vulnerable to economic shocks, have faced less market pressure and some have even managed successfully to exit financial assistance programmes (eg Cyprus, Portugal).

5 Policy Contribution | Issue n˚09 | June 2018
Figure 1: Average implementation score, by year
Source: Bruegel based on Country Reports. Note: subparts related to fiscal policy in terms of SGP targets are excluded.
Countries’ average implementation records for 2013-17 hide significant variation (online
Annex 3). The trend is towards greater implementation in, for example, Bulgaria and the
Czech Republic, and towards less implementation in, for example, Croatia and Poland.
Implementation in countries including Luxembourg and the Netherlands has fluctuated
significantly. It is beyond the scope of this paper to examine the political economic factors
driving this country action, but factors likely include issues such as the capacity of a country
to put in place reforms, electoral cycles and the business cycle.
Figure 2: Average implementation score, by country (2013-17)
Source: Bruegel based on Country Reports. Note: subparts related to fiscal policy in terms of SGP targets are excluded.
All member states MIP-relevant subparts only Members states with excessive imbalances
48
44
40
36
2013 2014 2015 2016 2017
40
20
50
30
10
0
6 Policy Contribution | Issue n˚09 | June 2018
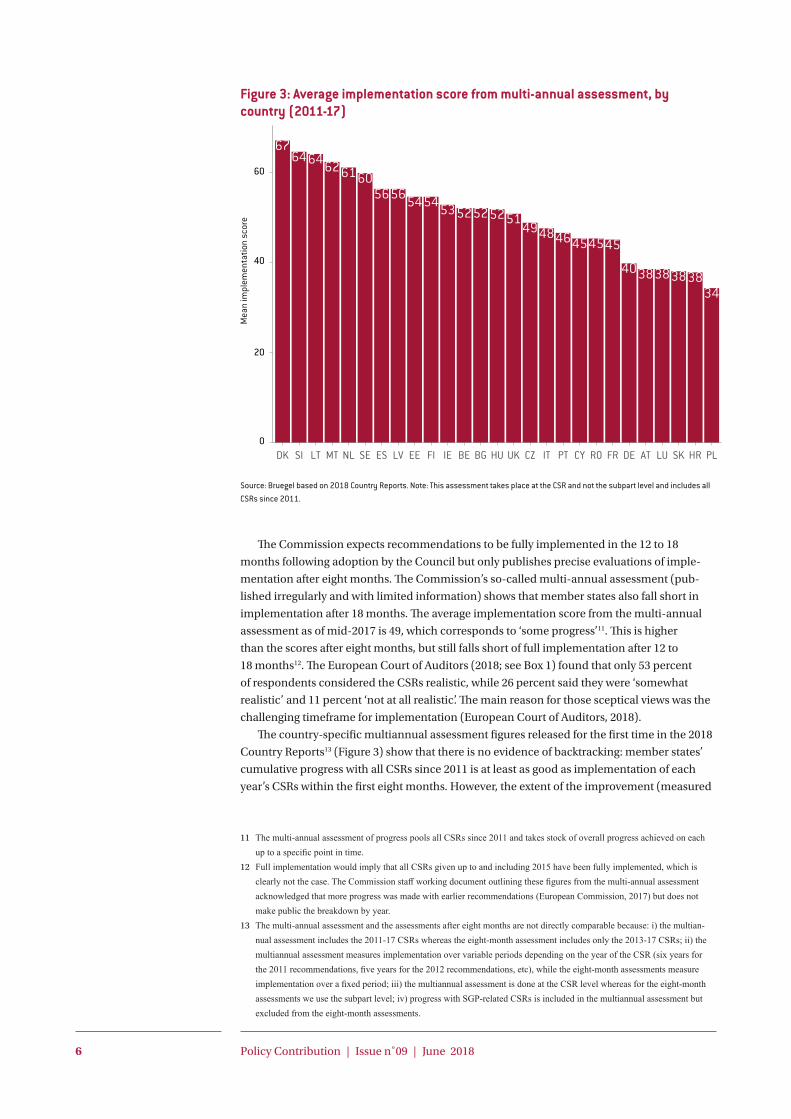
Figure 3: Average implementation score from multi-annual assessment, by country (2011-17)
Source: Bruegel based on 2018 Country Reports. Note: This assessment takes place at the CSR and not the subpart level and includes all CSRs since 2011.
The Commission expects recommendations to be fully implemented in the 12 to 18
months following adoption by the Council but only publishes precise evaluations of imple-
mentation after eight months. The Commission’s so-called multi-annual assessment (pub-
lished irregularly and with limited information) shows that member states also fall short in
implementation after 18 months. The average implementation score from the multi-annual
assessment as of mid-2017 is 49, which corresponds to ‘some progress’11. This is higher
than the scores after eight months, but still falls short of full implementation after 12 to
18 months12. The European Court of Auditors (2018; see Box 1) found that only 53 percent
of respondents considered the CSRs realistic, while 26 percent said they were ‘somewhat
realistic’ and 11 percent ‘not at all realistic’. The main reason for those sceptical views was the
challenging timeframe for implementation (European Court of Auditors, 2018).
The country-specific multiannual assessment figures released for the first time in the 2018
Country Reports13 (Figure 3) show that there is no evidence of backtracking: member states’
cumulative progress with all CSRs since 2011 is at least as good as implementation of each
year’s CSRs within the first eight months. However, the extent of the improvement (measured
11 The multi-annual assessment of progress pools all CSRs since 2011 and takes stock of overall progress achieved on each up to a specific point in time.
12 Full implementation would imply that all CSRs given up to and including 2015 have been fully implemented, which is clearly not the case. The Commission staff working document outlining these figures from the multi-annual assessment acknowledged that more progress was made with earlier recommendations (European Commission, 2017) but does not make public the breakdown by year.
13 The multi-annual assessment and the assessments after eight months are not directly comparable because: i) the multian-nual assessment includes the 2011-17 CSRs whereas the eight-month assessment includes only the 2013-17 CSRs; ii) the multiannual assessment measures implementation over variable periods depending on the year of the CSR (six years for the 2011 recommendations, five years for the 2012 recommendations, etc), while the eight-month assessments measure implementation over a fixed period; iii) the multiannual assessment is done at the CSR level whereas for the eight-month assessments we use the subpart level; iv) progress with SGP-related CSRs is included in the multiannual assessment but excluded from the eight-month assessments.
60
40
20
0

7 Policy Contribution | Issue n˚09 | June 2018
by the distance from the dashed line in Figure 4) varies significantly in different countries.
For example, there appears to have been no progress beyond the eight-month implemen-
tation scores for the UK, Finland and Poland. However, the multiannual assessment shows
much-improved implementation in countries including Denmark, Sweden, the Netherlands,
Lithuania, Hungary and Bulgaria. As a result, the ranking of countries also changes signifi-
cantly. This implies that some of the differences between countries in the eight-month assess-
ments arise from differences in speed of implementation, rather than in willingness or ability
to implement CSRs.
Figure 4: Average implementation scores, multi-annual vs. after eight months, by country
Source: Bruegel based on Country Reports. Note: subparts related to fiscal policy in terms of SGP targets are excluded from the eight-month average implementation scores. The dashed line has a slope of 45⁰ and the two axes indicate the score of the median country in the respective assessment.
Implementation scores after eight months vary for different policy areas (Figure 5). In par-
ticular, implementation scores are on average high for the financial sector (financial services:
54; private indebtedness: 46; access to finance: 45; and the insolvency framework: 42), skills
and life-long learning (43) and fiscal policy and fiscal governance (42). However, recommen-
dations related to taxation, such as on reducing the debt bias (22) or broadening the tax base
(22), competition in services (27) and reforms focused on unemployment benefits (29) and
the long-term sustainability of public finances including pensions (29), are overall poorly
implemented. The average implementation scores by policy area are relatively stable over
time, with the notable exception of fiscal recommendations. Implementation of fiscal govern-
ance recommendations or fiscal recommendations on the structure of government expendi-
ture has deteriorated significantly (Figure 6).

8 Policy Contribution | Issue n˚09 | June 2018
Figure 5: Average implementation score, by policy area (2013-17)
Source: Bruegel based on Country Reports. Note: subparts related to fiscal policy in terms of SGP targets are excluded, so subparts of the fiscal policy and fiscal governance policy area mostly relate to questions of fiscal governance at the national or sub-national level, or the structure of government expenditure.
Figure 6: Average implementation score, subparts with a fiscal policy and fiscal governance component
Source: Bruegel based on Country Reports. Note: subparts related to fiscal policy in terms of SGP targets are excluded, so this mostly relates to questions of fiscal governance at the national or sub-national level, or the structure of government expenditure.
9 Policy Contribution | Issue n˚09 | June 2018
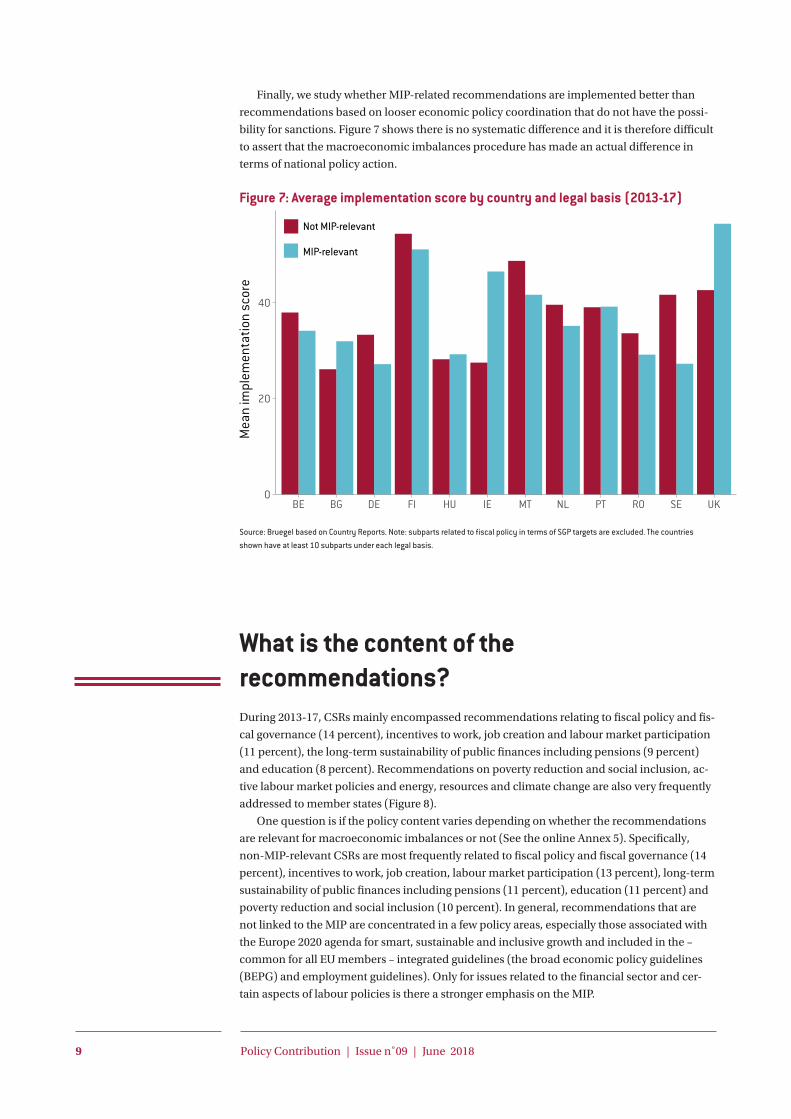
Finally, we study whether MIP-related recommendations are implemented better than
recommendations based on looser economic policy coordination that do not have the possi-
bility for sanctions. Figure 7 shows there is no systematic difference and it is therefore difficult
to assert that the macroeconomic imbalances procedure has made an actual difference in
terms of national policy action.
Figure 7: Average implementation score by country and legal basis (2013-17)
Source: Bruegel based on Country Reports. Note: subparts related to fiscal policy in terms of SGP targets are excluded. The countries shown have at least 10 subparts under each legal basis.
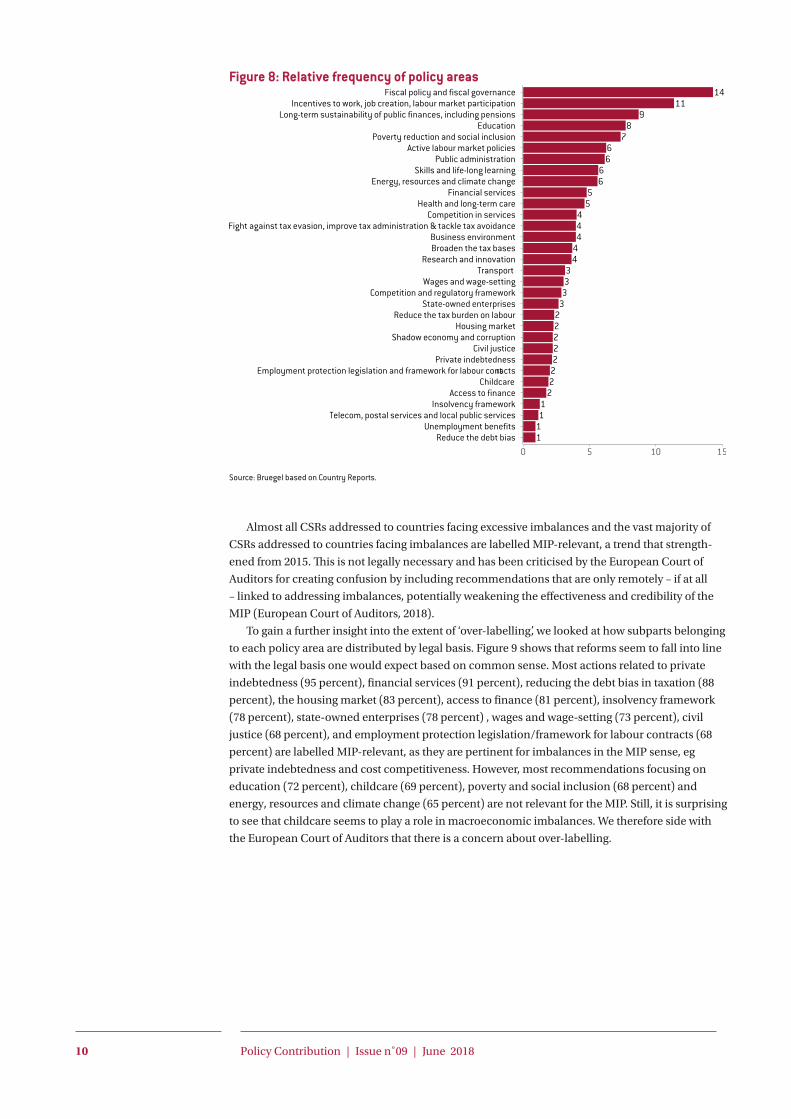
What is the content of the recommendations?During 2013-17, CSRs mainly encompassed recommendations relating to fiscal policy and fis-
cal governance (14 percent), incentives to work, job creation and labour market participation
(11 percent), the long-term sustainability of public finances including pensions (9 percent)
and education (8 percent). Recommendations on poverty reduction and social inclusion, ac-
tive labour market policies and energy, resources and climate change are also very frequently
addressed to member states (Figure 8).
One question is if the policy content varies depending on whether the recommendations
are relevant for macroeconomic imbalances or not (See the online Annex 5). Specifically,
non-MIP-relevant CSRs are most frequently related to fiscal policy and fiscal governance (14
percent), incentives to work, job creation, labour market participation (13 percent), long-term
sustainability of public finances including pensions (11 percent), education (11 percent) and
poverty reduction and social inclusion (10 percent). In general, recommendations that are
not linked to the MIP are concentrated in a few policy areas, especially those associated with
the Europe 2020 agenda for smart, sustainable and inclusive growth and included in the –
common for all EU members – integrated guidelines (the broad economic policy guidelines
(BEPG) and employment guidelines). Only for issues related to the financial sector and cer-
tain aspects of labour policies is there a stronger emphasis on the MIP.
Not MIP-relevant
MIP-relevant
10 Policy Contribution | Issue n˚09 | June 2018
Figure 8: Relative frequency of policy areas
Source: Bruegel based on Country Reports.
Almost all CSRs addressed to countries facing excessive imbalances and the vast majority of
CSRs addressed to countries facing imbalances are labelled MIP-relevant, a trend that strength-
ened from 2015. This is not legally necessary and has been criticised by the European Court of
Auditors for creating confusion by including recommendations that are only remotely – if at all
– linked to addressing imbalances, potentially weakening the effectiveness and credibility of the
MIP (European Court of Auditors, 2018).
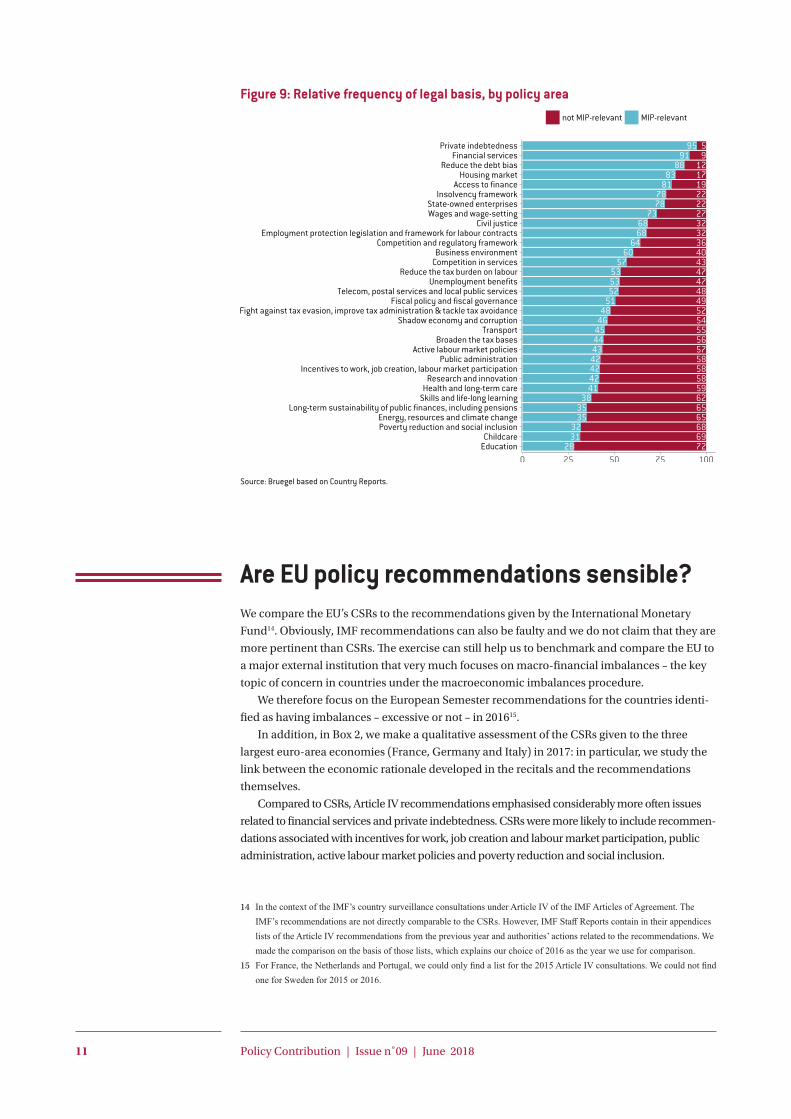
To gain a further insight into the extent of ‘over-labelling’, we looked at how subparts belonging
to each policy area are distributed by legal basis. Figure 9 shows that reforms seem to fall into line
with the legal basis one would expect based on common sense. Most actions related to private
indebtedness (95 percent), financial services (91 percent), reducing the debt bias in taxation (88
percent), the housing market (83 percent), access to finance (81 percent), insolvency framework
(78 percent), state-owned enterprises (78 percent) , wages and wage-setting (73 percent), civil
justice (68 percent), and employment protection legislation/framework for labour contracts (68
percent) are labelled MIP-relevant, as they are pertinent for imbalances in the MIP sense, eg
private indebtedness and cost competitiveness. However, most recommendations focusing on
education (72 percent), childcare (69 percent), poverty and social inclusion (68 percent) and
energy, resources and climate change (65 percent) are not relevant for the MIP. Still, it is surprising
to see that childcare seems to play a role in macroeconomic imbalances. We therefore side with
the European Court of Auditors that there is a concern about over-labelling.
11 Policy Contribution | Issue n˚09 | June 2018
Figure 9: Relative frequency of legal basis, by policy area
Source: Bruegel based on Country Reports.
Are EU policy recommendations sensible?We compare the EU’s CSRs to the recommendations given by the International Monetary
Fund14. Obviously, IMF recommendations can also be faulty and we do not claim that they are
more pertinent than CSRs. The exercise can still help us to benchmark and compare the EU to
a major external institution that very much focuses on macro-financial imbalances – the key
topic of concern in countries under the macroeconomic imbalances procedure.
We therefore focus on the European Semester recommendations for the countries identi-
fied as having imbalances – excessive or not – in 201615.
In addition, in Box 2, we make a qualitative assessment of the CSRs given to the three
largest euro-area economies (France, Germany and Italy) in 2017: in particular, we study the
link between the economic rationale developed in the recitals and the recommendations
themselves.
Compared to CSRs, Article IV recommendations emphasised considerably more often issues
related to financial services and private indebtedness. CSRs were more likely to include recommen-
dations associated with incentives for work, job creation and labour market participation, public
administration, active labour market policies and poverty reduction and social inclusion.
14 In the context of the IMF’s country surveillance consultations under Article IV of the IMF Articles of Agreement. The IMF’s recommendations are not directly comparable to the CSRs. However, IMF Staff Reports contain in their appendices lists of the Article IV recommendations from the previous year and authorities’ actions related to the recommendations. We made the comparison on the basis of those lists, which explains our choice of 2016 as the year we use for comparison.
15 For France, the Netherlands and Portugal, we could only find a list for the 2015 Article IV consultations. We could not find one for Sweden for 2015 or 2016.

12 Policy Contribution | Issue n˚09 | June 2018
Figure 10: Relative frequency of policy areas, by surveillance framework (12 most frequent policy areas)
Source: Bruegel based on European Commission’s Country Reports and IMF’s Staff Reports.
In terms of recommendations by country (see the online Annex 6), we found there was a
fair level of consensus in the recommendations of the two surveillance frameworks, though
this did not amount to replication. In particular, the proportion of IMF recommendations
with an exact or partial match in the respective CSRs ranges from about 38 percent for Finland
to 100 percent for Croatia. On average, about half of the IMF recommendations matched fully
or partially with a CSR subpart16.
Furthermore, the IMF recommendations that do not have a CSR counterpart are for the
most part recommendations related to the financial sector (Figure 10). Differently from the
CSRs, the IMF recommended that all 12 countries surveyed in the sample should take meas-
ures on the supervision of financial intermediaries, macro-prudential policies and reducing
the stock of non-performing loans (NPLs). For instance, the IMF suggested that German
authorities “expand the macro-prudential toolkit to better address potential future excesses
in the housing sector” and “ensure that life insurance companies maintain sufficient capital
buffers to withstand a prolonged period of low interest rates”, two recommendations that are
not included in the CSR package. Similarly, Spain received a number of recommendations
on reducing NPLs, strengthening banks’ capital and funding positions and macro-pruden-
tial policy. Italy received recommendations on resolving failing banks from the IMF but not
under the European Semester in 2016. Examples of non-financial recommendations are those
related to labour market reform in Italy, in particular promoting firm-level bargaining, moni-
toring the take-up of the newly legislated open contract and the use of enhanced flexibility in
allocating labour within firms.
These are all examples of recommendations that if put forward in the CSRs would be
unambiguously related to the MIP and linked to the core issues associated with macro-
16 We acknowledge that there is no clear way to match the recommendations. In general we matched recommendations when they explicitly mentioned the same reform or policy action, in whole or in part. Some of the unmatched recommendations might be at least related, eg boosting participation of women in the labour force (IMF) and improving access to childcare (CSRs).

13 Policy Contribution | Issue n˚09 | June 2018
economic and financial risks. Their absence raises the question of whether the CSRs go far
enough in flagging these risks, particularly in the financial sector, for countries that face
macroeconomic imbalances. In general however, the content, number, length, scope and
level of detail of recommendations in the two surveillance frameworks are quite similar.
Box 2: Qualitative assessment of 2017 CSRs in to France, Germany and Italy
In 2017, France and Italy were considered to be experiencing ‘excessive’ macroeconomic
imbalances while Germany was considered to be experiencing an imbalance only.
This weighting between excessive and non-excessive balances is clearly a political choice
and cannot be justified by the economics of spillovers. The French economic situation
certainly does not create more negative spillovers onto the EU as a whole than the German
economic situation.
All three countries are in the bottom half of countries in terms of CSR implementation
rates: they do not seem to care much about the macroeconomic imbalances procedure rec-
ommendations from Brussels.
One reason for such low implementation rates might be that recommendations are based
on flawed analysis. However, a close reading of the recitals of the Council recommendations
suggests the opposite. The analysis of the economic challenges in all three countries is quite
detailed and corresponds to what many international economists and international organisa-
tions, such as the IMF, would say.
For example, in Italy besides the obvious fiscal challenges, the recitals of the Council deci-
sion discuss in quite some detail issues relating to the effectiveness of the administration, the
justice system, corruption and the labour market.
In France, the excessive imbalances relate to competitiveness and public debt and the
core of the recitals rightly focuses on the need for deficit reductions, the state’s very large
expenditure ratio, the inefficiencies in spending calling for a spending review, the structure of
the tax system and the sharp divide in labour market performance between foreign-born and
EU-born workers.
In Germany, the recitals focus on the high current account surplus and its drivers such
as low private and public investment, overly strong fiscal consolidation, the complex corpo-
ration tax system, relatively weak research and education investment, barriers to digitisation
and the low rate of investment in electricity transmission and distribution networks.
Yet, despite good analysis, recommendations are kept fairly general when it comes to
macroeconomic imbalances (even though they are quite strong and clear on fiscal policies for
these three countries). It is also not always fully clear how the recommendations link to the
recitals. For example, in Germany one recommendation is to “reduce the disincentive to work
for second earners”. This recommendation is certainly politically debatable and it is question-
able why the EU would meddle in this national choice. More worryingly, the link between
this recommendation and Germany’s actual imbalances, in particular the current account
surplus, is difficult to see. The main recommendation also clearly makes a choice in that it
considers fulfilment of the fiscal rule more important than addressing the macroeconomic
imbalance.

14 Policy Contribution | Issue n˚09 | June 2018
ConclusionWe analysed three questions: do EU countries comply with CSRs? What is the content of those
recommendations? Do recommendations make sense?
On the first count, we found that member states do not fully implement CSRs, regardless
of the implementation horizon. More worryingly, implementation has deteriorated in recent
years, especially among countries facing excessive imbalances. Performance varies substan-
tially across countries and policy areas. We found no evidence that CSRs given in the context
of the MIP are implemented faster than CSRs based on the legally less-binding Integrated
Guidelines17.
On the content of CSRs, we found that although MIP recommendations emphasise policy
areas linked to imbalances (such as financial reforms, the competitiveness of labour and the
housing market), the original intent of the MIP is diluted when CSRs relate to, for example,
education or childcare. Such recommendations are hardly relevant for macroeconomic and
financial imbalances and could further erode the importance national policymakers attach to
recommendations from Brussels.
Finally, the economic analysis underpinning CSRs appears sound according to our anal-
ysis of a few countries. However, recommendations are often weaker and less clear than the
underlying analysis. We also note that the EU makes significant political choices that are not
easy to justify based on economic logic. For example, Germany’s imbalances were not con-
sidered excessive while France’s imbalances were in 2017. We also find a significant overlap
with recommendations given by the IMF. Nevertheless, for countries with imbalances, the
emphasis in CSRs on the financial sector is considerably weaker than in equivalent recom-
mendations from the IMF.
In terms of the implications for EU economic governance, our results cast serious doubt
on the effectiveness of the European Semester and suggest that policymakers should recon-
sider it. We consider the low effectiveness to be a result of the fundamental dilemma facing
the euro area in particular. National policies matter hugely for all euro-area countries, justi-
fying mechanisms for policy coordination. But national policies are put in place by national
authorities and parliaments that do not want their sovereignty to be diminished.
This dilemma cannot be resolved in the European Union as it is currently set up. The
best that can be achieved is improving second and third-best solutions. Our main recom-
mendation is to focus MIP CSRs on those items that are really relevant for macroeconomic
imbalances and spillovers to other countries. Recommendations that are only nice to have
should be ditched to reduce the amount of paperwork sent to national policymakers. The
focus of EU surveillance should be on the real risks for the euro area and the EU as a whole
– while the principle of subsidiarity suggests that childcare – while extremely important –
should be decided at national or even regional level. Finally, the European Commission
needs to improve its communication so that the CSRs are clearly visible and understandable
in national debates. The current form of CSRs makes for barely-digestible documents. More
streamlined and understandable communication would be useful.
17 We intend to undertake econometric analysis to identify the political economy and other factors explaining this variation. An analysis by the European Commission (2016, Annex 3) for 2014-15 found a statistically significant positive association between compliance and the category of imbalance.

15 Policy Contribution | Issue n˚09 | June 2018
ReferencesBricongne, J. and A. Turrini (2017) ‘The EU Macroeconomic Imbalance Procedure: Some impact and no
sanctions‘, VoxEU, 22 June
Darvas, Z. and Á. Leandro (2015) ‘The Limitations of Policy Coordination in the Euro Area under the
European Semester’, Policy Contribution 2015/19, Bruegel
Darvas, Z. and Á. Leandro (2016) ‘Implementation of European Semester recommendations worsens
further’, Bruegel Blog, 15 June
European Commission (2017) ‘2017 European Semester: Country-specific recommendations’,
COM(2017) 500 final
European Commission (2016) ‘The Macroeconomic Imbalance Procedure – Rationale, Process,
Application: A Compendium’, Institutional Paper 039
European Court of Auditors (2018) ‘Audit of the Macroeconomic Imbalance Procedure (MIP)’, Special
Report 03/2018
AnnexesThe annexes to this Policy Contribution are available online:
Annex 1: Compliance scores
http://bruegel.org/wp-content/uploads/2018/06/PC-2018-09-online-annexes-1.pdf
Annex 2: Policy areas
http://bruegel.org/wp-content/uploads/2018/06/PC-2018-09-online-annexes-2.pdf
Annex 3: Average compliance scores by country
http://bruegel.org/wp-content/uploads/2018/06/PC-2018-09-online-annexes-3-new.pdf
Annex 4: Average compliance scores by policy area
http://bruegel.org/wp-content/uploads/2018/06/PC-2018-09-online-annexes-4-new.pdf
Annex 5: Relative frequency of policy areas, by legal basis
http://bruegel.org/wp-content/uploads/2018/06/PC-2018-09-online-annexes-5-new.pdf
Annex 6: Article IV recommendations and matching CSRs
http://bruegel.org/wp-content/uploads/2018/06/PC-2018-09-online-annexes-6.pdf