is the outcrop topology of dolerite dikes of the
TRANSCRIPT

Is the outcrop topology of dolerite dikes of thePrecambrian Singhbhum Craton fractal?
Nibir Mandal1, Atin Kumar Mitra1, Santanu Misra1 and Chandan Chakraborty2,∗
1Department of Geological Sciences, Jadavpur University, Kolkata 700 032, India.2Geological Studies Unit, Indian Statistical Institute, 203, B. T. Road, Kolkata 700 108, India.
∗e-mail: [email protected]
In the Precambrian Singhbhum Craton of eastern India, newer dolerite dikes occur profusely withvarying outcrop lengths. We have analysed the nature of their length-size and orientation distri-butions in relation to the theory of fractals. Two orientational sets of dikes (NW–SE and NE–SW)are present. Both the sets show strongly non-power-law size distributions, as reflected in non-linear variations in logarithmic space. We analyzed thousands of data, revealing that polynomialfunctions with a degree of 3 to 4 are the best representatives of the non-linear variations. Orientationanalysis shows that the degree of dispersions from the mean trend tends to decrease with increasingdike length. The length-size distributions were studied by simulating fractures in physical models.Experimental fractures also show a non-power-law distribution, which grossly conforms to thoseof the dolerite dikes. This type of complex size distributions results from the combined effects ofnucleation, propagation and coalescence of fractures.
1. Introduction
In recent times the concept of fractal geometryhas been widely used in the analysis of geologi-cal objects in different scales, from river systemsat map scale to sedimentary pores at micro-scale.The basic tenet of fractals employed in geologi-cal studies is mainly concerned with a power-lawdistribution of the object properties. For example,the number of rivers belonging to a certain ordercan be shown to vary with their wavelength fol-lowing a power-law function (Korvin 1992). Sucha distribution implies that the two parameters willhave a linear variation in log space, where the gra-dient of the linear variation indicates the fractaldimension.
Fractal analysis has been employed to character-ize the nature of fracture or fault populations inmany tectonic belts (Walsh et al 1991; Wattersonet al 1996; Jackson and Sanderson 1992; Turcotte1992; Cowie et al 1993; Clark and Cox 1996;Wojtal 1996; Yielding et al 1996). Several workers
have analyzed displacements on faults using thefractal theory, and demonstrated power-law varia-tions with their length (Marrett and Allemendinger1991; Cowie and Scholz 1992; Walsh and Watterson1992; Villemin et al 1995; Clark and Cox 1996;Knot et al 1996; Gross et al 1997; Poulimenos 2000;Van Dijk et al 2000; Volland and Kruhl 2004).Similar analyses have been employed to estimatevarious geological parameters, e.g., hydraulic con-ductivity in jointed rocks (see Korvin 1992 andreferences therein). Some field and experimentalstudies reveal that fault-size distribution may notexactly follow a power-law function (Cladouhosand Marrett 1996; Nicol et al 1996; Basu 1996;Cello 1997; Klausen 2004), and depending on thefault growth process, the distributions can switchover to an exponential law function (Ackermannet al 2001). Theoretical analyses show that dif-ferent parameters, e.g., finite net slip in case offaults or the opening in case of tensile fractures,are proportional to fracture dimensions. Under-standably, these fracture-associated parameters are
Keywords. Dike; fractal geometry; fracture; Singhbhum Craton; size-distribution; power law; physical model.
J. Earth Syst. Sci. 115, No. 6, December 2006, pp. 643–660© Printed in India. 643
644 Nibir Mandal et al
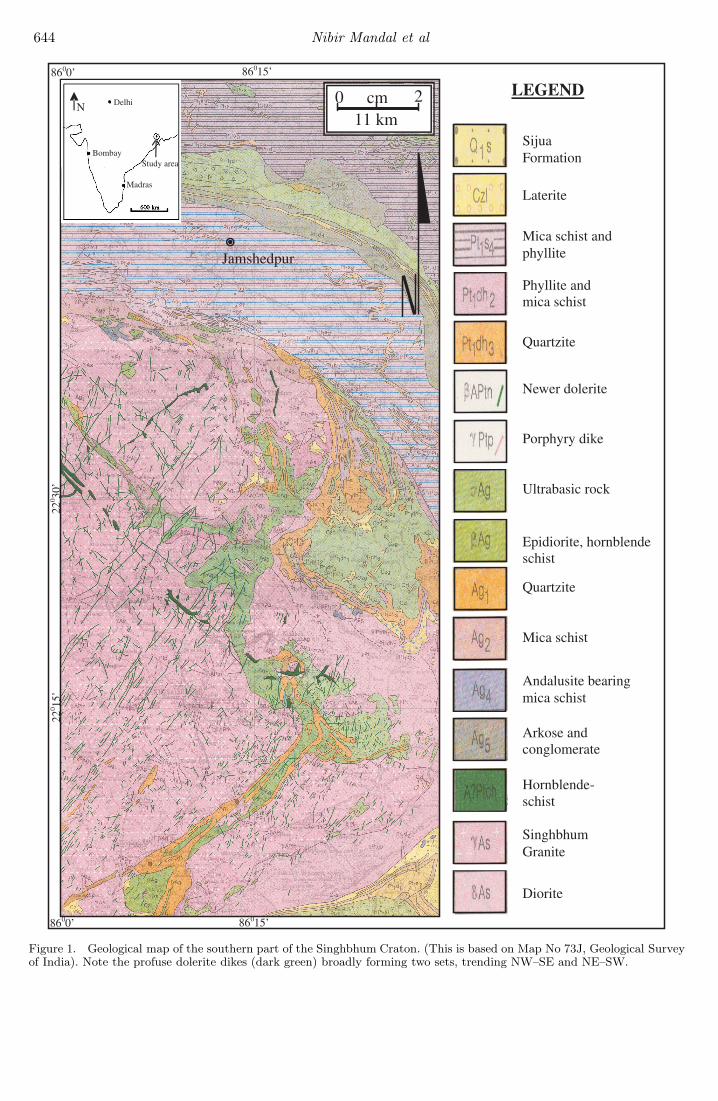
Figure 1. Geological map of the southern part of the Singhbhum Craton. (This is based on Map No 73J, Geological Surveyof India). Note the profuse dolerite dikes (dark green) broadly forming two sets, trending NW–SE and NE–SW.
Outcrop topology of dolerite dikes 645
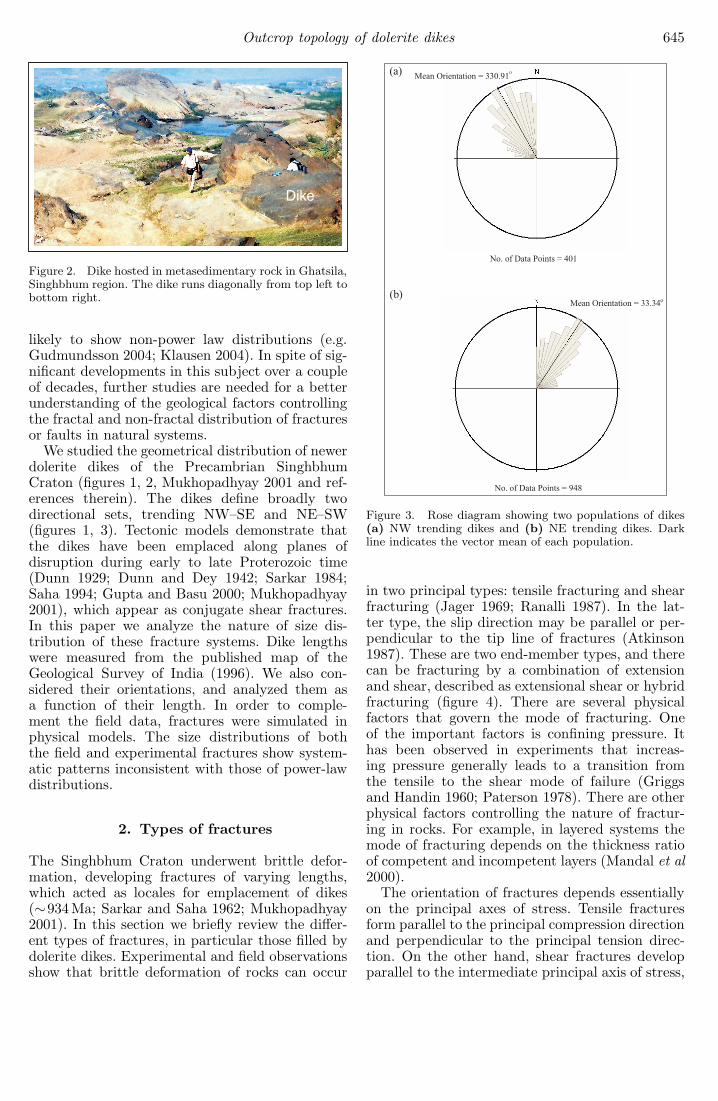
Figure 2. Dike hosted in metasedimentary rock in Ghatsila,Singhbhum region. The dike runs diagonally from top left tobottom right.
likely to show non-power law distributions (e.g.Gudmundsson 2004; Klausen 2004). In spite of sig-nificant developments in this subject over a coupleof decades, further studies are needed for a betterunderstanding of the geological factors controllingthe fractal and non-fractal distribution of fracturesor faults in natural systems.
We studied the geometrical distribution of newerdolerite dikes of the Precambrian SinghbhumCraton (figures 1, 2, Mukhopadhyay 2001 and ref-erences therein). The dikes define broadly twodirectional sets, trending NW–SE and NE–SW(figures 1, 3). Tectonic models demonstrate thatthe dikes have been emplaced along planes ofdisruption during early to late Proterozoic time(Dunn 1929; Dunn and Dey 1942; Sarkar 1984;Saha 1994; Gupta and Basu 2000; Mukhopadhyay2001), which appear as conjugate shear fractures.In this paper we analyze the nature of size dis-tribution of these fracture systems. Dike lengthswere measured from the published map of theGeological Survey of India (1996). We also con-sidered their orientations, and analyzed them asa function of their length. In order to comple-ment the field data, fractures were simulated inphysical models. The size distributions of boththe field and experimental fractures show system-atic patterns inconsistent with those of power-lawdistributions.
2. Types of fractures
The Singhbhum Craton underwent brittle defor-mation, developing fractures of varying lengths,which acted as locales for emplacement of dikes(∼934Ma; Sarkar and Saha 1962; Mukhopadhyay2001). In this section we briefly review the differ-ent types of fractures, in particular those filled bydolerite dikes. Experimental and field observationsshow that brittle deformation of rocks can occur
Figure 3. Rose diagram showing two populations of dikes(a) NW trending dikes and (b) NE trending dikes. Darkline indicates the vector mean of each population.
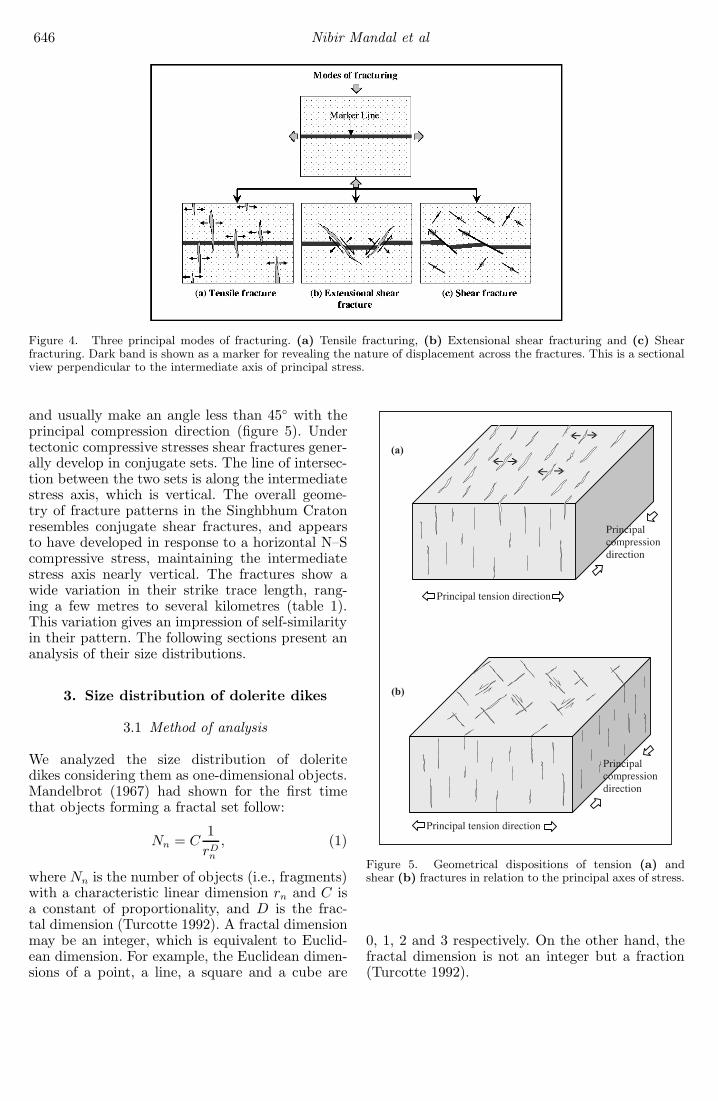
in two principal types: tensile fracturing and shearfracturing (Jager 1969; Ranalli 1987). In the lat-ter type, the slip direction may be parallel or per-pendicular to the tip line of fractures (Atkinson1987). These are two end-member types, and therecan be fracturing by a combination of extensionand shear, described as extensional shear or hybridfracturing (figure 4). There are several physicalfactors that govern the mode of fracturing. Oneof the important factors is confining pressure. Ithas been observed in experiments that increas-ing pressure generally leads to a transition fromthe tensile to the shear mode of failure (Griggsand Handin 1960; Paterson 1978). There are otherphysical factors controlling the nature of fractur-ing in rocks. For example, in layered systems themode of fracturing depends on the thickness ratioof competent and incompetent layers (Mandal et al2000).
The orientation of fractures depends essentiallyon the principal axes of stress. Tensile fracturesform parallel to the principal compression directionand perpendicular to the principal tension direc-tion. On the other hand, shear fractures developparallel to the intermediate principal axis of stress,
646 Nibir Mandal et al
Figure 4. Three principal modes of fracturing. (a) Tensile fracturing, (b) Extensional shear fracturing and (c) Shearfracturing. Dark band is shown as a marker for revealing the nature of displacement across the fractures. This is a sectionalview perpendicular to the intermediate axis of principal stress.
and usually make an angle less than 45◦ with theprincipal compression direction (figure 5). Undertectonic compressive stresses shear fractures gener-ally develop in conjugate sets. The line of intersec-tion between the two sets is along the intermediatestress axis, which is vertical. The overall geome-try of fracture patterns in the Singhbhum Cratonresembles conjugate shear fractures, and appearsto have developed in response to a horizontal N–Scompressive stress, maintaining the intermediatestress axis nearly vertical. The fractures show awide variation in their strike trace length, rang-ing a few metres to several kilometres (table 1).This variation gives an impression of self-similarityin their pattern. The following sections present ananalysis of their size distributions.
3. Size distribution of dolerite dikes
3.1 Method of analysis
We analyzed the size distribution of doleritedikes considering them as one-dimensional objects.Mandelbrot (1967) had shown for the first timethat objects forming a fractal set follow:
Nn = C1rD
n
, (1)
where Nn is the number of objects (i.e., fragments)with a characteristic linear dimension rn and C isa constant of proportionality, and D is the frac-tal dimension (Turcotte 1992). A fractal dimensionmay be an integer, which is equivalent to Euclid-ean dimension. For example, the Euclidean dimen-sions of a point, a line, a square and a cube are
Figure 5. Geometrical dispositions of tension (a) andshear (b) fractures in relation to the principal axes of stress.
0, 1, 2 and 3 respectively. On the other hand, thefractal dimension is not an integer but a fraction(Turcotte 1992).

Outcrop topology of dolerite dikes 647
Table 1. Frequency distribution of newer doleritedikes in Precambrian Singhbhum Craton.
Length of dikes(×250 m) No. of dikes
Frequency distribution of NW trending dikes
>0.5–1.5 92
>1.5–2.5 132
>2.5–3.5 58
>3.5–4.5 30
>4.5–5.5 32
>5.5–6.5 22
>6.5–7.5 7
>7.5–8.5 7
>8.5–9.5 3
>9.5–10.5 5
>10.5–11.5 2
>11.5–12.5 3
>12.5–13.5 1
>13.5–14.5 0
>14.5–15.5 2
>15.5–16.5 1
>16.5–18.5 0
>18.5–19.5 2
>19.5–22.5 0
>22.5–23.5 1
>23.5–28.5 0
>28.5–29 1
Frequency distribution of NE trending dikes
>0.5–1.5 138
>1.5–2.5 354
>2.5–3.5 144
>3.5–4.5 88
>4.5–5.5 57
>5.5–6.5 43
>6.5–7.5 23
>7.5–8.5 14
>8.5–9.5 19
>9.5–10.5 17
>10.5–11.5 9
>11.5–12.5 6
>12.5–13.5 8
>13.5–14.5 3
>14.5–15.5 4
>15.5–16.5 2
>16.5–17.5 2
>17.5–18.5 0
>18.5–19.5 2
>19.5–20.5 1
>20.5–21.5 2
>21.5–22.5 1
>22.5–23.5 0
>23.5–24.5 3
>24.5–25.5 1
>25.5–26.5 0
>26.5–27.5 2
Table 1. (Continued).
Length of dikes(×250 m) No. of dikes
>27.5–32.5 0
>32.5–33.5 1
>33.5–34.5 1
>34.5–35.5 2
>35.5–36.5 1
Equation (1) can also be written in the form:
ln Nn = ln C − D ln rn, (2)
Y = K − DX, (3)
where Y = ln Nn and X = ln rn. Equation (2b)shows that the number of objects and their lengthwill have a linear variation when plotted in theXY space, where X and Y are the log values ofthe parameters under consideration. Data with apower-law variation will thus be characterized bya linear distribution in the log space.
In our case we deal with dike length (X) andthe number of dikes (Y ) of a characteristic lengthas the parameters for our analysis (table 1), andattempt to reveal if their distributions, appar-ently self-similar in look, do obey the rule of frac-tal (equation 1). We used the published map ofGSI (1996) in the scale: 1 cm = 2.5 km (figure 1).It may be noted that the fractures show traceson a section nearly perpendicular to the inter-mediate principal axis of stress and parallel tothe movement direction. This provides us a goodopportunity to deal with actual length of the frac-tures, showing a strike-slip movement. We considerthe dispositions of dikes shown in the geologicalmap of GSI reliable, as they have been tracedout based on ground observations. Secondly, theterrain is mostly granitic, and the ground sur-face is almost flat (Topographic sheet no. 73/J,Survey of India), and the outcrop pattern is notaffected by topography. Dikes in the two popula-tions (NW–SE and NE–SW; figure 3) are mostlysteeply dipping, and therefore the distributionsobserved at the present level of erosion are likely toremain statistically similar with varying sectionallevels.
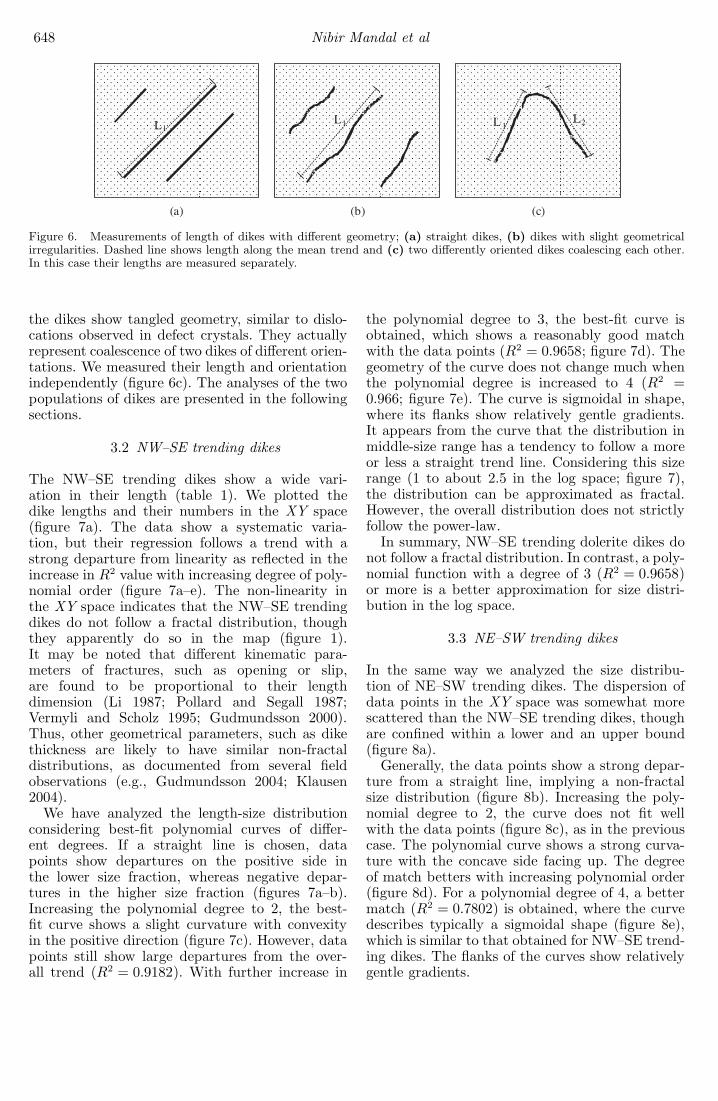
Dike lengths and orientations were determinedfrom their traces on the quadrangle geologicalmap (figure 6). Most of the dikes show reason-ably straight trajectories (figure 6a). To measurethe length of dikes with minute irregularities, astraight line was drawn along the mean trend ofthe dike, and the length of the dike was mea-sured along that straight line (figure 6b). Some of
648 Nibir Mandal et al
Figure 6. Measurements of length of dikes with different geometry; (a) straight dikes, (b) dikes with slight geometricalirregularities. Dashed line shows length along the mean trend and (c) two differently oriented dikes coalescing each other.In this case their lengths are measured separately.
the dikes show tangled geometry, similar to dislo-cations observed in defect crystals. They actuallyrepresent coalescence of two dikes of different orien-tations. We measured their length and orientationindependently (figure 6c). The analyses of the twopopulations of dikes are presented in the followingsections.
3.2 NW–SE trending dikes
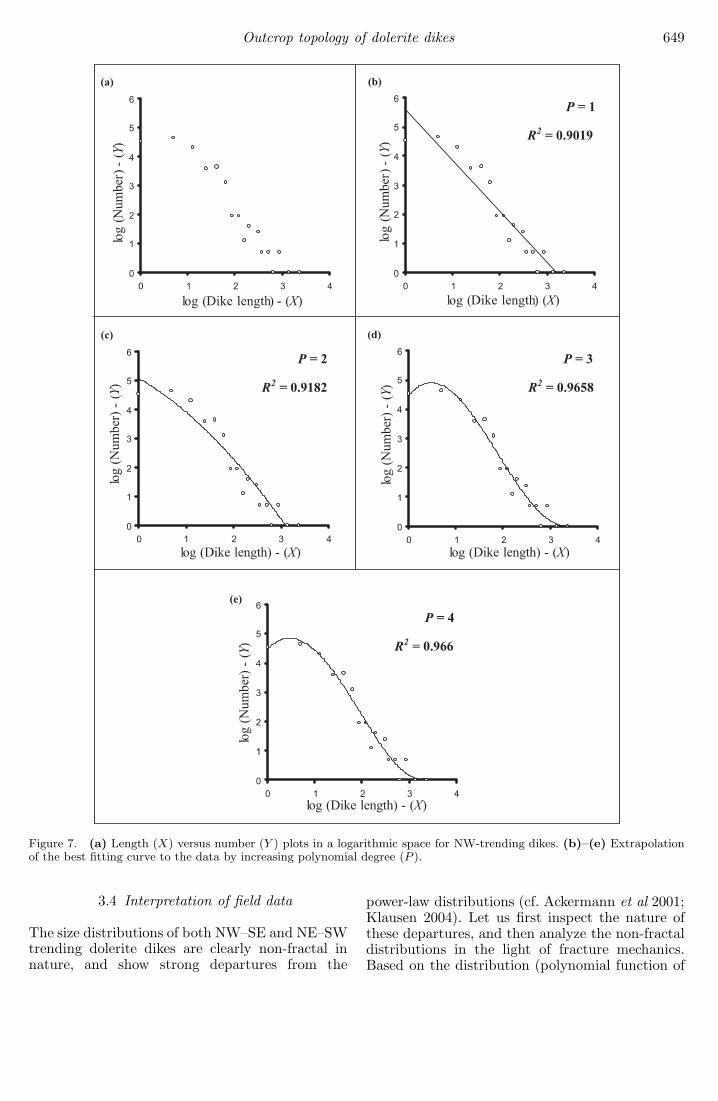
The NW–SE trending dikes show a wide vari-ation in their length (table 1). We plotted thedike lengths and their numbers in the XY space(figure 7a). The data show a systematic varia-tion, but their regression follows a trend with astrong departure from linearity as reflected in theincrease in R2 value with increasing degree of poly-nomial order (figure 7a–e). The non-linearity inthe XY space indicates that the NW–SE trendingdikes do not follow a fractal distribution, thoughthey apparently do so in the map (figure 1).It may be noted that different kinematic para-meters of fractures, such as opening or slip,are found to be proportional to their lengthdimension (Li 1987; Pollard and Segall 1987;Vermyli and Scholz 1995; Gudmundsson 2000).Thus, other geometrical parameters, such as dikethickness are likely to have similar non-fractaldistributions, as documented from several fieldobservations (e.g., Gudmundsson 2004; Klausen2004).
We have analyzed the length-size distributionconsidering best-fit polynomial curves of differ-ent degrees. If a straight line is chosen, datapoints show departures on the positive side inthe lower size fraction, whereas negative depar-tures in the higher size fraction (figures 7a–b).Increasing the polynomial degree to 2, the best-fit curve shows a slight curvature with convexityin the positive direction (figure 7c). However, datapoints still show large departures from the over-all trend (R2 = 0.9182). With further increase in
the polynomial degree to 3, the best-fit curve isobtained, which shows a reasonably good matchwith the data points (R2 = 0.9658; figure 7d). Thegeometry of the curve does not change much whenthe polynomial degree is increased to 4 (R2 =0.966; figure 7e). The curve is sigmoidal in shape,where its flanks show relatively gentle gradients.It appears from the curve that the distribution inmiddle-size range has a tendency to follow a moreor less a straight trend line. Considering this sizerange (1 to about 2.5 in the log space; figure 7),the distribution can be approximated as fractal.However, the overall distribution does not strictlyfollow the power-law.
In summary, NW–SE trending dolerite dikes donot follow a fractal distribution. In contrast, a poly-nomial function with a degree of 3 (R2 = 0.9658)or more is a better approximation for size distri-bution in the log space.
3.3 NE–SW trending dikes
In the same way we analyzed the size distribu-tion of NE–SW trending dikes. The dispersion ofdata points in the XY space was somewhat morescattered than the NW–SE trending dikes, thoughare confined within a lower and an upper bound(figure 8a).
Generally, the data points show a strong depar-ture from a straight line, implying a non-fractalsize distribution (figure 8b). Increasing the poly-nomial degree to 2, the curve does not fit wellwith the data points (figure 8c), as in the previouscase. The polynomial curve shows a strong curva-ture with the concave side facing up. The degreeof match betters with increasing polynomial order(figure 8d). For a polynomial degree of 4, a bettermatch (R2 = 0.7802) is obtained, where the curvedescribes typically a sigmoidal shape (figure 8e),which is similar to that obtained for NW–SE trend-ing dikes. The flanks of the curves show relativelygentle gradients.
Outcrop topology of dolerite dikes 649
Figure 7. (a) Length (X) versus number (Y ) plots in a logarithmic space for NW-trending dikes. (b)–(e) Extrapolationof the best fitting curve to the data by increasing polynomial degree (P ).
3.4 Interpretation of field data
The size distributions of both NW–SE and NE–SWtrending dolerite dikes are clearly non-fractal innature, and show strong departures from the
power-law distributions (cf. Ackermann et al 2001;Klausen 2004). Let us first inspect the nature ofthese departures, and then analyze the non-fractaldistributions in the light of fracture mechanics.Based on the distribution (polynomial function of

650 Nibir Mandal et al
Figure 8. (a) Length (X) versus number (Y ) plots in a logarithmic space for NE-trending dikes. (b)–(e) Extrapolationof the best fitting curve to the data by increasing polynomial degree (P ).
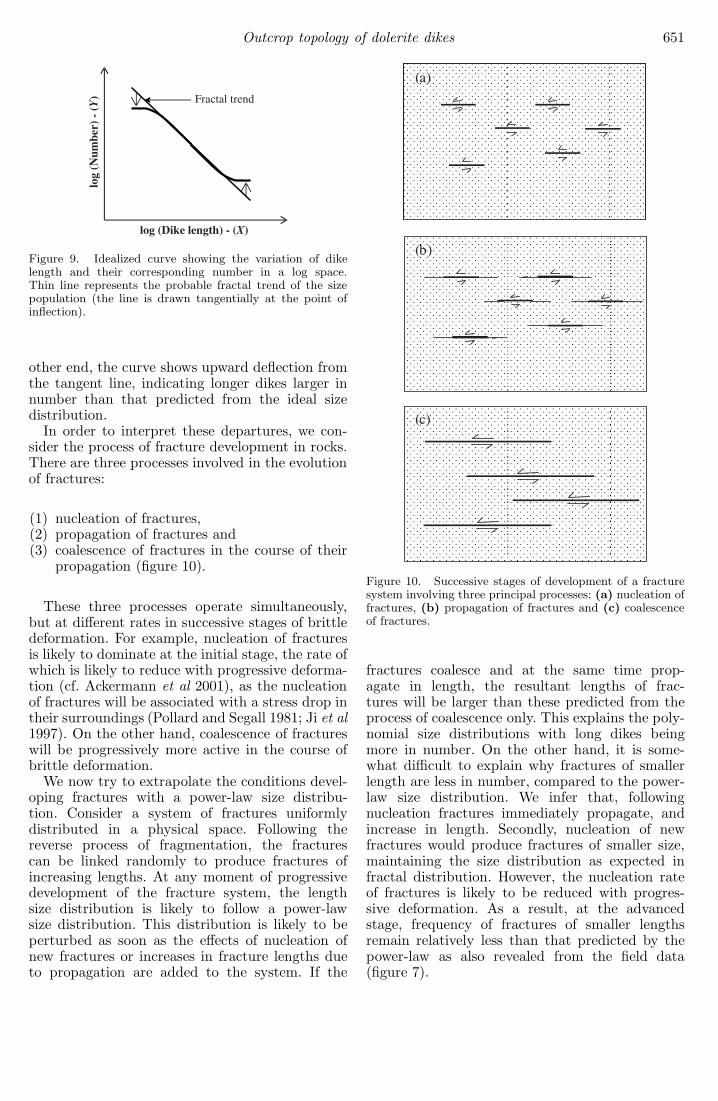
degree 3–4), we consider an ideal curve in theXY space (figure 9), and take a tangent line atthe point of inflection of the polynomial curve.The size-distribution would follow the tangentline if the dikes were ideally fractal in their size
distribution. The polynomial curve is deflecteddownward from the tangent line for the smallersize range. This departure implies that the num-ber of dikes of smaller lengths is less than thatpredicted from the power-law distribution. On the
Outcrop topology of dolerite dikes 651
Figure 9. Idealized curve showing the variation of dikelength and their corresponding number in a log space.Thin line represents the probable fractal trend of the sizepopulation (the line is drawn tangentially at the point ofinflection).
other end, the curve shows upward deflection fromthe tangent line, indicating longer dikes larger innumber than that predicted from the ideal sizedistribution.
In order to interpret these departures, we con-sider the process of fracture development in rocks.There are three processes involved in the evolutionof fractures:
(1) nucleation of fractures,(2) propagation of fractures and(3) coalescence of fractures in the course of their
propagation (figure 10).
These three processes operate simultaneously,but at different rates in successive stages of brittledeformation. For example, nucleation of fracturesis likely to dominate at the initial stage, the rate ofwhich is likely to reduce with progressive deforma-tion (cf. Ackermann et al 2001), as the nucleationof fractures will be associated with a stress drop intheir surroundings (Pollard and Segall 1981; Ji et al1997). On the other hand, coalescence of fractureswill be progressively more active in the course ofbrittle deformation.
We now try to extrapolate the conditions devel-oping fractures with a power-law size distribu-tion. Consider a system of fractures uniformlydistributed in a physical space. Following thereverse process of fragmentation, the fracturescan be linked randomly to produce fractures ofincreasing lengths. At any moment of progressivedevelopment of the fracture system, the lengthsize distribution is likely to follow a power-lawsize distribution. This distribution is likely to beperturbed as soon as the effects of nucleation ofnew fractures or increases in fracture lengths dueto propagation are added to the system. If the
Figure 10. Successive stages of development of a fracturesystem involving three principal processes: (a) nucleation offractures, (b) propagation of fractures and (c) coalescenceof fractures.
fractures coalesce and at the same time prop-agate in length, the resultant lengths of frac-tures will be larger than these predicted from theprocess of coalescence only. This explains the poly-nomial size distributions with long dikes beingmore in number. On the other hand, it is some-what difficult to explain why fractures of smallerlength are less in number, compared to the power-law size distribution. We infer that, followingnucleation fractures immediately propagate, andincrease in length. Secondly, nucleation of newfractures would produce fractures of smaller size,maintaining the size distribution as expected infractal distribution. However, the nucleation rateof fractures is likely to be reduced with progres-sive deformation. As a result, at the advancedstage, frequency of fractures of smaller lengthsremain relatively less than that predicted by thepower-law as also revealed from the field data(figure 7).
652 Nibir Mandal et al
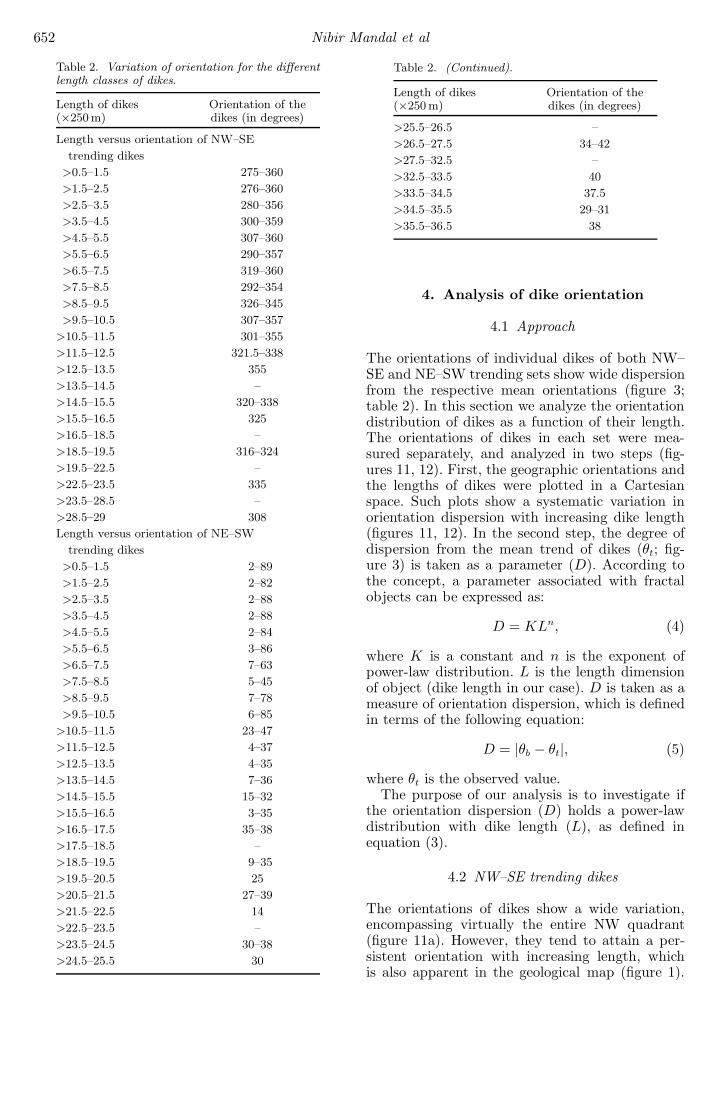
Table 2. Variation of orientation for the differentlength classes of dikes.
Length of dikes Orientation of the(×250 m) dikes (in degrees)
Length versus orientation of NW–SE
trending dikes
>0.5–1.5 275–360
>1.5–2.5 276–360
>2.5–3.5 280–356
>3.5–4.5 300–359
>4.5–5.5 307–360
>5.5–6.5 290–357
>6.5–7.5 319–360
>7.5–8.5 292–354
>8.5–9.5 326–345
>9.5–10.5 307–357
>10.5–11.5 301–355
>11.5–12.5 321.5–338
>12.5–13.5 355
>13.5–14.5 –
>14.5–15.5 320–338
>15.5–16.5 325
>16.5–18.5 –
>18.5–19.5 316–324
>19.5–22.5 –
>22.5–23.5 335
>23.5–28.5 –
>28.5–29 308
Length versus orientation of NE–SW
trending dikes
>0.5–1.5 2–89
>1.5–2.5 2–82
>2.5–3.5 2–88
>3.5–4.5 2–88
>4.5–5.5 2–84
>5.5–6.5 3–86
>6.5–7.5 7–63
>7.5–8.5 5–45
>8.5–9.5 7–78
>9.5–10.5 6–85
>10.5–11.5 23–47
>11.5–12.5 4–37
>12.5–13.5 4–35
>13.5–14.5 7–36
>14.5–15.5 15–32
>15.5–16.5 3–35
>16.5–17.5 35–38
>17.5–18.5 –
>18.5–19.5 9–35
>19.5–20.5 25
>20.5–21.5 27–39
>21.5–22.5 14
>22.5–23.5 –
>23.5–24.5 30–38
>24.5–25.5 30
Table 2. (Continued).
Length of dikes Orientation of the(×250 m) dikes (in degrees)
>25.5–26.5 –
>26.5–27.5 34–42
>27.5–32.5 –
>32.5–33.5 40
>33.5–34.5 37.5
>34.5–35.5 29–31
>35.5–36.5 38
4. Analysis of dike orientation
4.1 Approach
The orientations of individual dikes of both NW–SE and NE–SW trending sets show wide dispersionfrom the respective mean orientations (figure 3;table 2). In this section we analyze the orientationdistribution of dikes as a function of their length.The orientations of dikes in each set were mea-sured separately, and analyzed in two steps (fig-ures 11, 12). First, the geographic orientations andthe lengths of dikes were plotted in a Cartesianspace. Such plots show a systematic variation inorientation dispersion with increasing dike length(figures 11, 12). In the second step, the degree ofdispersion from the mean trend of dikes (θt; fig-ure 3) is taken as a parameter (D). According tothe concept, a parameter associated with fractalobjects can be expressed as:
D = KLn, (4)
where K is a constant and n is the exponent ofpower-law distribution. L is the length dimensionof object (dike length in our case). D is taken as ameasure of orientation dispersion, which is definedin terms of the following equation:
D = |θb − θt|, (5)
where θt is the observed value.The purpose of our analysis is to investigate if
the orientation dispersion (D) holds a power-lawdistribution with dike length (L), as defined inequation (3).
4.2 NW–SE trending dikes
The orientations of dikes show a wide variation,encompassing virtually the entire NW quadrant(figure 11a). However, they tend to attain a per-sistent orientation with increasing length, whichis also apparent in the geological map (figure 1).

Outcrop topology of dolerite dikes 653
Figure 11. (a) Plot showing the variation in the orientation of NW trending dikes as a function of their length, (b) representtheir dispersions from the mean trend as function of dike length, and (d) maximum dispersion values (Dmax) as functionof dike length, which is represented in logarithmic space in (c).
The plot suggests that fractures are likely tobe diversely oriented when they are small insize. Longer fractures develop through coalescenceand propagation. These two processes probablyoccur tracking the principal axes of stress, andthereby lead fractures to orient themselves alonga particular direction, irrespective of their initialorientations.
Using equation (4) we have determined angu-lar dispersions (D) for individual dike and plot-ted them against the length (figure 11b), the plotshows that the D value decreases systematicallywith increasing dike length. We also determinedthe maximum orientation dispersions (Dmax) fordifferent dike lengths, and plotted them against thelength (figure 11c). Dmax varies systematically withdike length. The value of Dmax decreases system-atically with dike-length and eventually assumes astable value. We then plotted Dmax and dike lengthin log–log space to test whether they obey a power-law distribution (figure 11d). Our plots clearly
reveal that fluctuations in the orientation of dikesdo not follow such a distribution, as reflected fromthe strong non-linearity in the variation. Follow-ing the method described in section 3.2, it appearsthat a polynomial function of degree 3 fits betterwith the distribution.
4.3 NE–SW trending dikes
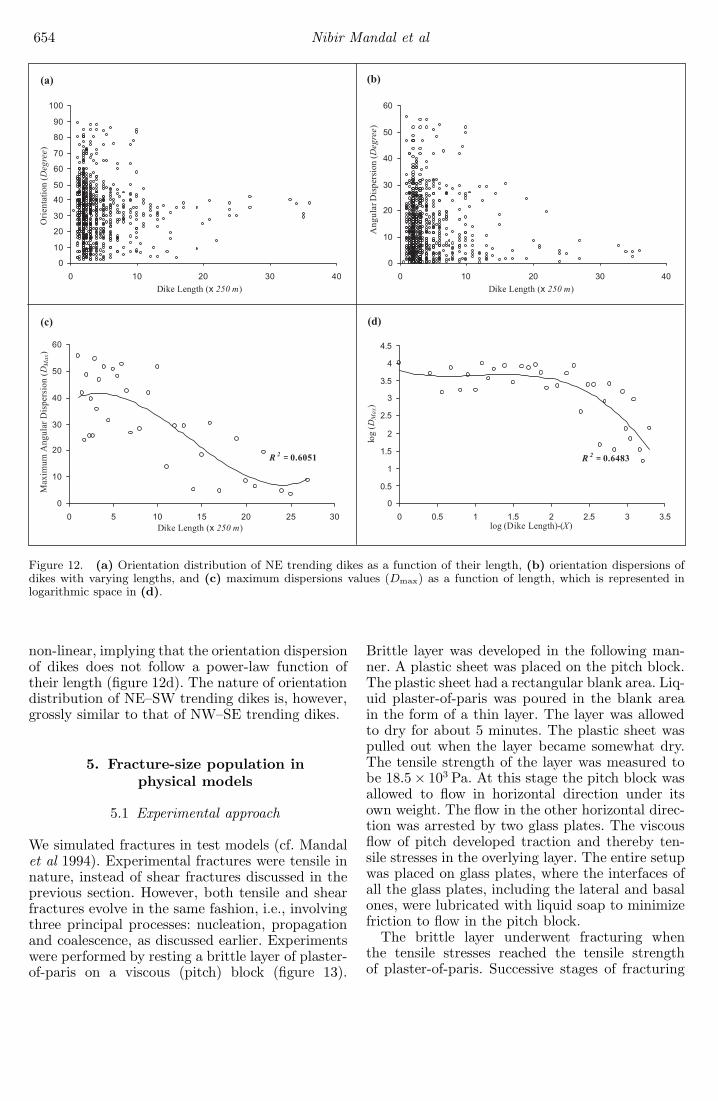
Dikes in this population also show similar varia-tions in their orientations (figure 12a). Data disper-sion is large for smaller dike lengths. Dikes tend toattend a stable orientation with increasing length.Dispersion in dike orientations was analyzed usingequation (4) and plotted against dike length andthe plot shows the same pattern as the plot forNW–SE trending dikes (figure 12b). We have alsodetermined maximum dispersion (Dmax) and plot-ted them against the length which also shows asystematic variation (figure 12c). The log–log plotof Dmax versus dike-length variation is evidently
654 Nibir Mandal et al
Figure 12. (a) Orientation distribution of NE trending dikes as a function of their length, (b) orientation dispersions ofdikes with varying lengths, and (c) maximum dispersions values (Dmax) as a function of length, which is represented inlogarithmic space in (d).
non-linear, implying that the orientation dispersionof dikes does not follow a power-law function oftheir length (figure 12d). The nature of orientationdistribution of NE–SW trending dikes is, however,grossly similar to that of NW–SE trending dikes.
5. Fracture-size population inphysical models
5.1 Experimental approach
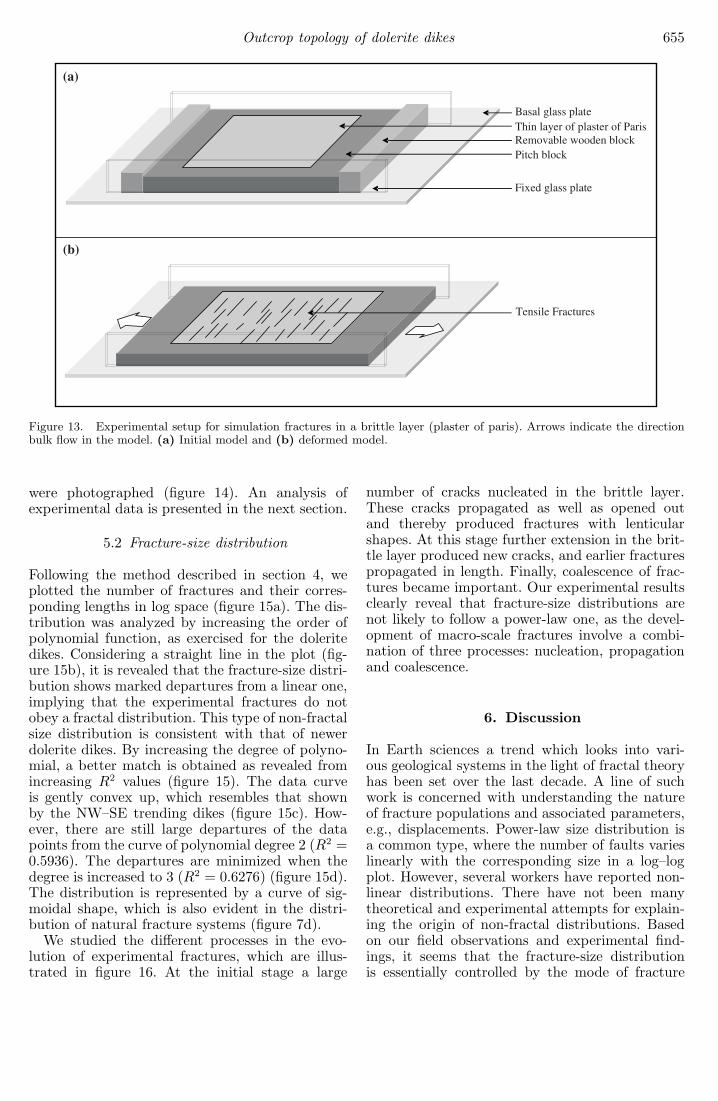
We simulated fractures in test models (cf. Mandalet al 1994). Experimental fractures were tensile innature, instead of shear fractures discussed in theprevious section. However, both tensile and shearfractures evolve in the same fashion, i.e., involvingthree principal processes: nucleation, propagationand coalescence, as discussed earlier. Experimentswere performed by resting a brittle layer of plaster-of-paris on a viscous (pitch) block (figure 13).
Brittle layer was developed in the following man-ner. A plastic sheet was placed on the pitch block.The plastic sheet had a rectangular blank area. Liq-uid plaster-of-paris was poured in the blank areain the form of a thin layer. The layer was allowedto dry for about 5 minutes. The plastic sheet waspulled out when the layer became somewhat dry.The tensile strength of the layer was measured tobe 18.5× 10³ Pa. At this stage the pitch block wasallowed to flow in horizontal direction under itsown weight. The flow in the other horizontal direc-tion was arrested by two glass plates. The viscousflow of pitch developed traction and thereby ten-sile stresses in the overlying layer. The entire setupwas placed on glass plates, where the interfaces ofall the glass plates, including the lateral and basalones, were lubricated with liquid soap to minimizefriction to flow in the pitch block.
The brittle layer underwent fracturing whenthe tensile stresses reached the tensile strengthof plaster-of-paris. Successive stages of fracturing
Outcrop topology of dolerite dikes 655
Figure 13. Experimental setup for simulation fractures in a brittle layer (plaster of paris). Arrows indicate the directionbulk flow in the model. (a) Initial model and (b) deformed model.
were photographed (figure 14). An analysis ofexperimental data is presented in the next section.
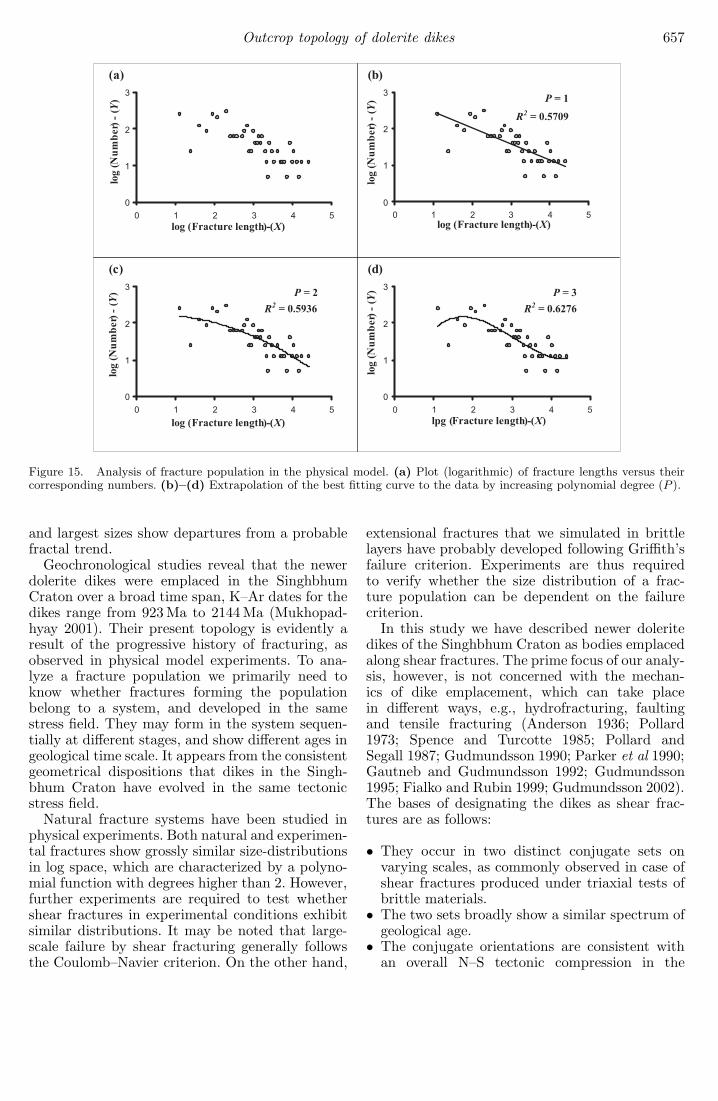
5.2 Fracture-size distribution
Following the method described in section 4, weplotted the number of fractures and their corres-ponding lengths in log space (figure 15a). The dis-tribution was analyzed by increasing the order ofpolynomial function, as exercised for the doleritedikes. Considering a straight line in the plot (fig-ure 15b), it is revealed that the fracture-size distri-bution shows marked departures from a linear one,implying that the experimental fractures do notobey a fractal distribution. This type of non-fractalsize distribution is consistent with that of newerdolerite dikes. By increasing the degree of polyno-mial, a better match is obtained as revealed fromincreasing R2 values (figure 15). The data curveis gently convex up, which resembles that shownby the NW–SE trending dikes (figure 15c). How-ever, there are still large departures of the datapoints from the curve of polynomial degree 2 (R2 =0.5936). The departures are minimized when thedegree is increased to 3 (R2 = 0.6276) (figure 15d).The distribution is represented by a curve of sig-moidal shape, which is also evident in the distri-bution of natural fracture systems (figure 7d).
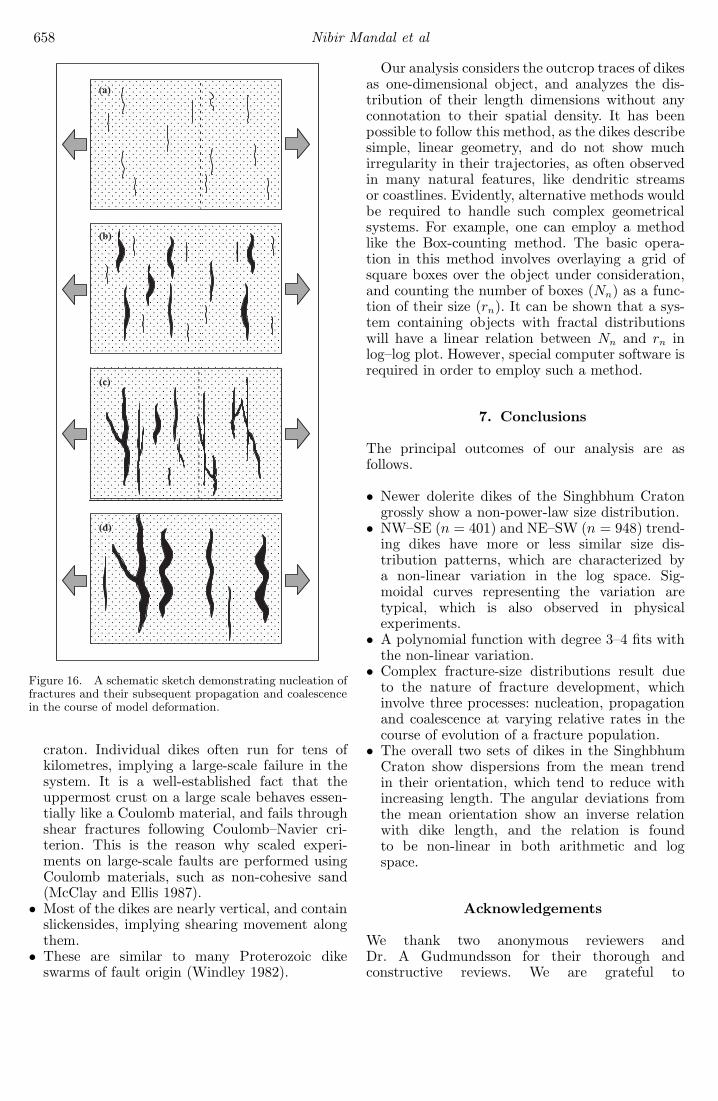
We studied the different processes in the evo-lution of experimental fractures, which are illus-trated in figure 16. At the initial stage a large
number of cracks nucleated in the brittle layer.These cracks propagated as well as opened outand thereby produced fractures with lenticularshapes. At this stage further extension in the brit-tle layer produced new cracks, and earlier fracturespropagated in length. Finally, coalescence of frac-tures became important. Our experimental resultsclearly reveal that fracture-size distributions arenot likely to follow a power-law one, as the devel-opment of macro-scale fractures involve a combi-nation of three processes: nucleation, propagationand coalescence.
6. Discussion
In Earth sciences a trend which looks into vari-ous geological systems in the light of fractal theoryhas been set over the last decade. A line of suchwork is concerned with understanding the natureof fracture populations and associated parameters,e.g., displacements. Power-law size distribution isa common type, where the number of faults varieslinearly with the corresponding size in a log–logplot. However, several workers have reported non-linear distributions. There have not been manytheoretical and experimental attempts for explain-ing the origin of non-fractal distributions. Basedon our field observations and experimental find-ings, it seems that the fracture-size distributionis essentially controlled by the mode of fracture

656 Nibir Mandal et al
Figure 14. Successive stages of fracturing in a brittle layerunder bulk extension (vertical direction).
growth (cf. Cladouhos and Marrett 1996). Most ofthe natural fracture populations involve the threeprocesses of nucleation, propagation and coales-cence of fractures. A population is likely to shownon-power-law size distributions as these processesoperate at varying rates. In order to quantify thesize distribution of an evolving fracture populationit is therefore necessary to understand the relativerates of the three processes, and how they can varywith time, giving a combined effect in the final sizedistribution.
Newer dolerite dikes in the Singhbhum Cratonshow non-linear distributions in log–log plots,which have not been reported earlier. The non-linearity is defined by polynomial functions withdegrees 3 to 4, which also conform to that of exper-imental fractures. Non-power law distributions offracture dimensions have been documented by sev-eral workers (Yielding et al 1996; Ackermann et al2001; Gudmundsson 2004; Klausen 2004). It hasbeen proposed that this kind of distribution maybe a result of varying data resolutions or obser-vational limitations (e.g., Yielding et al 1996). Weperformed physical experiments to address thisissue, and noticed that the experimental fracturesystems also showed a strong departure from apower-law distribution. The finding leads us to sug-gest that a fracture population can show a non-power law distribution even in an ideal situation.There are other probable factors, e.g., incomplete-ness in dike outcrops, which may have influencedthe length distributions of the dike populations. Toanalyze this, consider a set of lines as an example.The lines are partially erased in a random fash-ion, which basically simulates a kind of fragmen-tation process. At any stage of this operation, linesegments of varying lengths would tend to followa power-law distribution (Turcotte 1992). Basedon this point as well as experimental findings, wesuggest that incompleteness in outcrop does notseem to be a crucial factor in dictating the distri-bution to follow a non-power law, as also suggestedby others (Klausen 2004). An alternative model isthus presented to explain this type of size distri-bution qualitatively in terms of the three processes:nucleation, propagation and coalescence of frac-tures. However, the model describes schematicallythe mode of progressive evolution of a fracture sys-tem, and the approach is somewhat simplistic innature. Evidently, the study needs to be strength-ened with quantitative models, considering tem-poral variations of the relative rates of the threeprocesses and additional complex processes, likemutual interaction of fractures due to their spatialproximity. Such modelling would provide a betterunderstanding of the evolution of a fracture popu-lation and its size distributions in space and time.
Several workers have considered cumulative fre-quency in the analysis of fault or fracture lengthdistributions (e.g., Cladouhos and Marrett 1996;Knott et al 1996). Such a cumulative frequencyanalysis of newer dolerite dikes also shows a non-power-law distribution. However, we have preferedsize-class frequency (cf. Turcotte 1992; Barnsley1993) in order to understand the nature of concen-tration of dikes of different lengths in the system,and their characteristic departures from a fractaltrend, as shown in figure 6. In this approach it hasbeen possible to recognize that dikes of the smallest
Outcrop topology of dolerite dikes 657
Figure 15. Analysis of fracture population in the physical model. (a) Plot (logarithmic) of fracture lengths versus theircorresponding numbers. (b)–(d) Extrapolation of the best fitting curve to the data by increasing polynomial degree (P ).
and largest sizes show departures from a probablefractal trend.
Geochronological studies reveal that the newerdolerite dikes were emplaced in the SinghbhumCraton over a broad time span, K–Ar dates for thedikes range from 923 Ma to 2144 Ma (Mukhopad-hyay 2001). Their present topology is evidently aresult of the progressive history of fracturing, asobserved in physical model experiments. To ana-lyze a fracture population we primarily need toknow whether fractures forming the populationbelong to a system, and developed in the samestress field. They may form in the system sequen-tially at different stages, and show different ages ingeological time scale. It appears from the consistentgeometrical dispositions that dikes in the Singh-bhum Craton have evolved in the same tectonicstress field.
Natural fracture systems have been studied inphysical experiments. Both natural and experimen-tal fractures show grossly similar size-distributionsin log space, which are characterized by a polyno-mial function with degrees higher than 2. However,further experiments are required to test whethershear fractures in experimental conditions exhibitsimilar distributions. It may be noted that large-scale failure by shear fracturing generally followsthe Coulomb–Navier criterion. On the other hand,
extensional fractures that we simulated in brittlelayers have probably developed following Griffith’sfailure criterion. Experiments are thus requiredto verify whether the size distribution of a frac-ture population can be dependent on the failurecriterion.
In this study we have described newer doleritedikes of the Singhbhum Craton as bodies emplacedalong shear fractures. The prime focus of our analy-sis, however, is not concerned with the mechan-ics of dike emplacement, which can take placein different ways, e.g., hydrofracturing, faultingand tensile fracturing (Anderson 1936; Pollard1973; Spence and Turcotte 1985; Pollard andSegall 1987; Gudmundsson 1990; Parker et al 1990;Gautneb and Gudmundsson 1992; Gudmundsson1995; Fialko and Rubin 1999; Gudmundsson 2002).The bases of designating the dikes as shear frac-tures are as follows:
• They occur in two distinct conjugate sets onvarying scales, as commonly observed in case ofshear fractures produced under triaxial tests ofbrittle materials.
• The two sets broadly show a similar spectrum ofgeological age.
• The conjugate orientations are consistent withan overall N–S tectonic compression in the
658 Nibir Mandal et al
Figure 16. A schematic sketch demonstrating nucleation offractures and their subsequent propagation and coalescencein the course of model deformation.
craton. Individual dikes often run for tens ofkilometres, implying a large-scale failure in thesystem. It is a well-established fact that theuppermost crust on a large scale behaves essen-tially like a Coulomb material, and fails throughshear fractures following Coulomb–Navier cri-terion. This is the reason why scaled experi-ments on large-scale faults are performed usingCoulomb materials, such as non-cohesive sand(McClay and Ellis 1987).
• Most of the dikes are nearly vertical, and containslickensides, implying shearing movement alongthem.
• These are similar to many Proterozoic dikeswarms of fault origin (Windley 1982).
Our analysis considers the outcrop traces of dikesas one-dimensional object, and analyzes the dis-tribution of their length dimensions without anyconnotation to their spatial density. It has beenpossible to follow this method, as the dikes describesimple, linear geometry, and do not show muchirregularity in their trajectories, as often observedin many natural features, like dendritic streamsor coastlines. Evidently, alternative methods wouldbe required to handle such complex geometricalsystems. For example, one can employ a methodlike the Box-counting method. The basic opera-tion in this method involves overlaying a grid ofsquare boxes over the object under consideration,and counting the number of boxes (Nn) as a func-tion of their size (rn). It can be shown that a sys-tem containing objects with fractal distributionswill have a linear relation between Nn and rn inlog–log plot. However, special computer software isrequired in order to employ such a method.
7. Conclusions
The principal outcomes of our analysis are asfollows.
• Newer dolerite dikes of the Singhbhum Cratongrossly show a non-power-law size distribution.
• NW–SE (n = 401) and NE–SW (n = 948) trend-ing dikes have more or less similar size dis-tribution patterns, which are characterized bya non-linear variation in the log space. Sig-moidal curves representing the variation aretypical, which is also observed in physicalexperiments.
• A polynomial function with degree 3–4 fits withthe non-linear variation.
• Complex fracture-size distributions result dueto the nature of fracture development, whichinvolve three processes: nucleation, propagationand coalescence at varying relative rates in thecourse of evolution of a fracture population.
• The overall two sets of dikes in the SinghbhumCraton show dispersions from the mean trendin their orientation, which tend to reduce withincreasing length. The angular deviations fromthe mean orientation show an inverse relationwith dike length, and the relation is foundto be non-linear in both arithmetic and logspace.
Acknowledgements
We thank two anonymous reviewers andDr. A Gudmundsson for their thorough andconstructive reviews. We are grateful to

Outcrop topology of dolerite dikes 659
Prof. S C Sarkar for fruitful discussions on thegeological map of Singhbhum Craton. Finan-cial support from the CSIR, India and DST,India is greatly appreciated. CC acknowledges theinfrastructural facilities provided by the IndianStatistical Institute, Kolkata.
References
Ackermann R V, Schlische R W and Withjack M O 2001The geometric and statistical evolution of normal faultsystems: an experimental study of the effects of mechan-ical layer thickness on scaling laws; J. Struct. Geol. 231803–1819.
Anderson E M 1936 Dynamics of formation of cone-sheets,ring dykes and cauldron subsidence; Proc. Royal Soc.Edinburgh 56 128–163.
Atkinson B K 1987 Introduction to fracture mechanicsand its geophysical applications. In: Fracture Mechan-ics of Rock (ed.) Atkinson B, (London: Academic Press)pp. 1–26.
Barnsley M F 1993 Fractals Everywhere (2nd edn.) (SanFrancisco: Morgan Kaufmann).
Basu S 1996 Fracture populations in compressional and ten-sile stress regimes: an experimental study; M.Sc thesis(unpublished) Jadavpur University.
Cello G 1997 Fractal analysis of a Quaternary fault array inthe central Apennines, Italy; J. Struct. Geol. 19 945–953.
Cladouhos T T and Marrett R 1996 Are fault growth andlinkage models consistent with power-law distributions offault lengths?; J. Struct. Geol. 18 281–293.
Clark R M and Cox S J D 1996 A modern regressionapproach to determining fault displacement-length scal-ing relationships; J. Struct. Geol. 18 147–152.
Cowie P A and Scholz C H 1992 Displacement-length scal-ing relationship for faults: data synthesis and discussion;J. Struct. Geol. 14 1149–1156.
Cowie P A, Vanneste C and Sornette D 1993 Statisticalphysical model for the spatio-temporal evolution of faults;J. Geophys. Res. 98 21,809–21,821.
Dunn J A 1929 The Geology of North Singhbhum includ-ing parts of Ranchi and Manbhum Districts; Geol. Surv.India Memoir, Vol. LIV.
Dunn A J, Dey A K 1942 The geology and petrology ofEastern Singhbhum and surrounding areas; Geol. Surv.India Memoir, Vol. LXIX, Part-2.
Fialko Y A and Rubin A M 1999 Thermal and mechani-cal aspects of magma emplacement in giant dike swarms;J. Geophys. Res. 104 23,033–23,049.
Griggs D T and Handin J 1960 Observations on fractureand a hypothesis of earthquakes; In: Rock Deformation(a symposium) (eds) Griggs D T and Handin J, Geol.Soc. America Memoir 79 347–364.
Gross M R, Alonso G G, Bai T, Wacker M A,Collinsworth K B and Behl R 1997 Influence of mechani-cal stratigraphy and kinematics on fault scaling relations;J. Struct. Geol. 19 171–183.
Gautneb H and Gudmundsson A 1992 Effect of local andregional stress fileds on sheet emplacements in west Ice-land; J. Volcanol. Geotherm. Res. 51 339–356.
Gudmundsson A 1990 Emplacement of dikes, sills andcrustal magma chambers at divergent plate boundaries;Tectonophys. 176 257–275.
Gudmundsson A 1995 Internal structure and mechanics ofvolcanic systems in Iceland; J. Volcanol. Geotherm. Res.64 1–22.
Gudmundsson A 2000 Fracture dimensions, displacementsand fluid transport; J. Struct. Geol. 22 1221–1231.
Gudmundsson A 2002 Emplacement and arrest of sheets anddykes in central volcanoes; J. Volcanol. Geotherm. Res.116 279–298.
Gudmundsson A 2004 Effects of mechanical layering on thedevelopment of normal faults and dikes in Iceland; Geo-dinamica Acta 18 11–30.
Gupta A and Basu A 2000 North Singhbhum ProterozoicMobile Belt, Eastern India – a review; Geol. Surv. IndiaSpec. Publ. No. 55 195–226.
Jackson P and Sanderson D J 1992 Scaling of fault displace-ments from the Badajoz-Corborda shear zone, NW Spain;Tectonophys. 210 179–190. Applications. (London: Chap-man and Hall Ltd.).
Jager J C 1969 Elasticity, Fracture & Flow (London:Methuen and Co Ltd).
Ji S, Zhao P and Saruwatari K 1997 Fracturing of Garnetcrystals in anisotropic rocks during uplift; J. Struct. Geol.19 603–620.
Klausen M B 2004 Geometry and mode of emplacement ofthe Thverartindur cone sheet swarm, SE Iceland; J. Vol-canol. Geotherm. Res. 138 185–204.
Korvin G 1992 Fractal Models in the Earth Sciences (Ams-terdam: Elsevier), p. 396.
Li V C 1987 Mechanics of shear rupture applied toearthquake zones; In: Fracture Mechanics of Rock,(ed.) Atkinson B K (London: Academic Press)pp. 351–428.
Knott S D, Beach A, Brockbank P J, Lawson Brown J,McCallum J E and Welbon A I 1996 Spatial and mechan-ical controls on normal fault populations; J. Struct. Geol.18 359–372.
McClay K R and Ellis P G 1987 Geometries of extensionalfault systems developed in model experiments; Geology15 341–344.
Marett R A and Allmendinger R W 1991 Estimates of straindue to brittle faulting: sampling of fault populations;J. Struct. Geol. 13 735–738.
Mandal N, Deb S K and Khan D 1994 Evidence for a non-linear relationship fracture spacing and layer thickness;J. Struct. Geol. 16 1275–1281.
Mandal N, Chakraborty C and Samanta S K 2000 Boudi-nage in multilayered rocks under layer-normal compres-sion; J. Struct. Geol. 22 373–382.
Mandelbrot B B 1967 How long is the coastline of Britain?Statistical self-similarity and fractional dimension; Sci-ence 156 636–638.
Mukhopadhayay D 2001 The Arachean Nucleus of Singhb-hum: The Present State of Knowledge; Gondwana Res. 4307–318.
Nicol A, Walsh J J, Watterson J and Gillespie P A 1996Fault size distribution – are they really power-law?;J. Struct. Geol. 18 191–197.
Parker A J, Rickwood P C and Tucker D H (eds.) 1990Mafic Dykes and Emplacement Mechanisms (Rotterdam:Balkema).
Paterson M S 1978 Experimental rock deformation. TheBrittle Field (New York: Springer-Verlag).
Pollard D D 1973 Derivation and evaluation of a mechan-ical model for sheet emplacement; Tectonophys. 19233–269.
Pollard D D and Segall P 1987 Theoretical displacementsand stresses near fractures in rocks: with application tofaults, joints, veins, dikes and solution surfaces; In: Frac-ture Mechanics of Rock, (ed.) Atkinson B K (London:Academic Press) pp. 277–349.
Poulimenos G 2000 Scaling properties of normal faultpopulations in the western Corinth Graben, Greece:
660 Nibir Mandal et al
implications for fault growth in large strain settings;J. Struct. Geol. 22 307–322.
Ranalli G 1987 Rheology of the Earth (Boston: Allen &Unwin).
Saha A K 1994 Crustal Evolution of Singhbhum-NorthOrrisa, Eastern India; Geol. Soc. India, Bangalore. Mem-oir 27.
Sarkar S N and Saha A K 1962 A revision of the Pre-cambrian stratigraphy and tectonics of Singhbhum andadjacent regions; Q. J. Geol. Min. Metall. Soc. India 3497–136.
Sarkar S C 1984 Geology and ore mineralisation of theSinghbhum Copper Uranium belt, Eastern India (Cal-cutta: Jadavpur Univ. Publ.).
Spence D A and Turcotte D L 1985 Magma-driven propa-gation of cracks; J. Geophys. Res. 90 575–580.
Turcotte D L 1992 Fractals and Chaos in Geology and Geo-physics; (Cambridge: Cambridge University Press).
Van Dijk J P, Bello M, Toscano C, Bersani A and NardonS 2000 Tectonic model and three-dimensional fracturenetwork analysis of Monte Alpi (southern Apennines);Tectonophys. 324 203–237.
Vermilye J and Scholz C H 1995 Relation between veinlength and aperture; J. Struct. Geol. 17 423–434.
Villemin T, Angelier J and Sunwoo C 1995 Fractal distrib-ution of fault length and offsets: implications of brittle
deformation evaluation – the Lorraine Coal Basin; In:Fractals in the Earth Sciences (eds) Barton C C and LaPointe P R, (New York: Plenum Press).
Volland S and Kruhl J K 2004 Anisotropy quantification: theapplicaton of fractal geometry methods on tectonic frac-ture patterns of a Hercynian fault zone in NW Sardinia;J. Struct. Geol. 26 1499–1510.
Walsh J J and Watterson J 1992 Populations of faultsand fault displacements and their effects on estimatesof fault-related regional extension; J. Struct. Geol. 14701–712.
Walsh J J, Watterson J and Yielding G 1991 The impor-tance of small-scale faulting in regional extension; Nature351 391–393.
Watterson J, Walsh J J, Gillespie P A and Easton S1996 Scaling systematics of fault sizes on alarge-scale range fault map; J. Struct. Geol. 18199–214.
Windley B F 1982 The Evolving Continents (2nd edn) (Lon-don: John Wiley & Sons).
Wojtal S F 1996 Changes in fault displacement populationscorrelated to linkage between faults; J. Struct. Geol. 18265–279.
Yielding G, Needham T and Jones H 1996 Sampling of faultpopulations using sub-surface data: a review; J. Struct.Geol. 18 135–146.
MS received 21 July 2005; revised 26 April 2006; accepted 5 June 2006