is what we hear about migration really true? core messages
DESCRIPTION
In a summary of the volume 'Is What We Hear About Migration Really True? Questioning Eight Stereotypes', the Migration Policy Centre at the EUI presents the core issues regarding eight myths about migration in the EU, in light of established research findings carried out by the Centre.TRANSCRIPT
IS WHAT WE HEAR ABOUT MIGRATION REALLY TRUE? QUESTIONING EIGHT STEREOTYPESCORE MESSAGES

For decades, the topic of immigration has been polarising European political arenas. The view that immigration can be a positive contribution to Europe has had its defendants and its opponents, and it has often been the matter of harsh debates. In recent years, however, the dispute between the two groups often seems to have largely vanished. If not all politicians share the same principles about migration and migrants, fewer and fewer dare to defend the view that mi-gration is, and will continue to be, needed. They follow the trends of public opinion, in which increasingly large frac-tions see migrants as competitors in labour markets beset by unemployment, burdens on endangered welfare systems, and a factor of social disruption. This is in large part a result of the current crisis, which has ex-acerbated economic and social tensions and given rise to the search for scapegoats. If the opinion that migration is a threat rather than an asset prevails, there is a risk that European States will forego the positive benefits of immigration and make decisions that undermine Europe’s recovery from the crisis and, ultimately, its leading position in the world.This booklet re-thinks eight migration stereotypes in the light of research findings established by the Migration Policy Centre. It is based on the detailed volume: “Is what we hear about migration really true? Questioning eight stereotypes.”
– Philippe Fargues, Director of the Migration Policy Centre
FOREWORD

Authored by Cameron Thibos.
Based on the report Is what we hear about migration really true? Questioning eight stereotypes, edited by Philippe Fargues.
Contributors to the full report
Sara Bonfanti, Migration Policy Centre (MPC), Robert Schuman Centre for Advanced Studies (RSCAS), European University Institute (EUI)
Anna Di Bartolomeo, MPC, RSCAS, EUI
Philippe Fargues, MPC, RSCAS, EUI
Pawel Kaczmarczyk, Warsaw University and formerly MPC, RSCAS, EUI
Sona Kalantaryan, MPC, RSCAS , EUI
Kathryn Lum, MPC, RSCAS, EUI
Iván Martín, MPC, RSCAS, EUI, and CIDOB, Barcelona Center for International Affairs
Hillel Rapoport, MPC, RSCAS, EUI and Paris School of Economics
Cameron Thibos, MPC, RSCAS, EUI
Alessandra Venturini, MPC, RSCAS, EUI and University of Turin
Download the full report at:www.migrationpolicycentre.eu/migration-stereotypes
4 Is what we hear about migration really true?
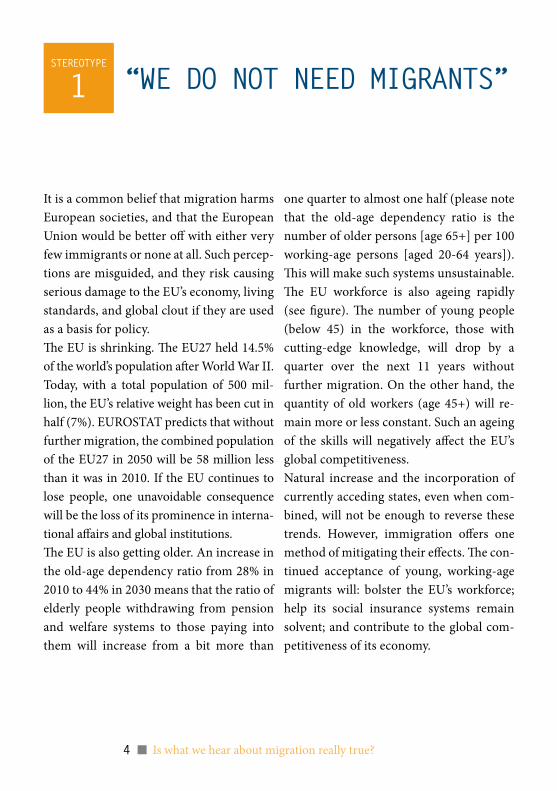
It is a common belief that migration harms European societies, and that the European Union would be better off with either very few immigrants or none at all. Such percep-tions are misguided, and they risk causing serious damage to the EU’s economy, living standards, and global clout if they are used as a basis for policy.The EU is shrinking. The EU27 held 14.5% of the world’s population after World War II. Today, with a total population of 500 mil-lion, the EU’s relative weight has been cut in half (7%). EUROSTAT predicts that without further migration, the combined population of the EU27 in 2050 will be 58 million less than it was in 2010. If the EU continues to lose people, one unavoidable consequence will be the loss of its prominence in interna-tional affairs and global institutions.The EU is also getting older. An increase in the old-age dependency ratio from 28% in 2010 to 44% in 2030 means that the ratio of elderly people withdrawing from pension and welfare systems to those paying into them will increase from a bit more than
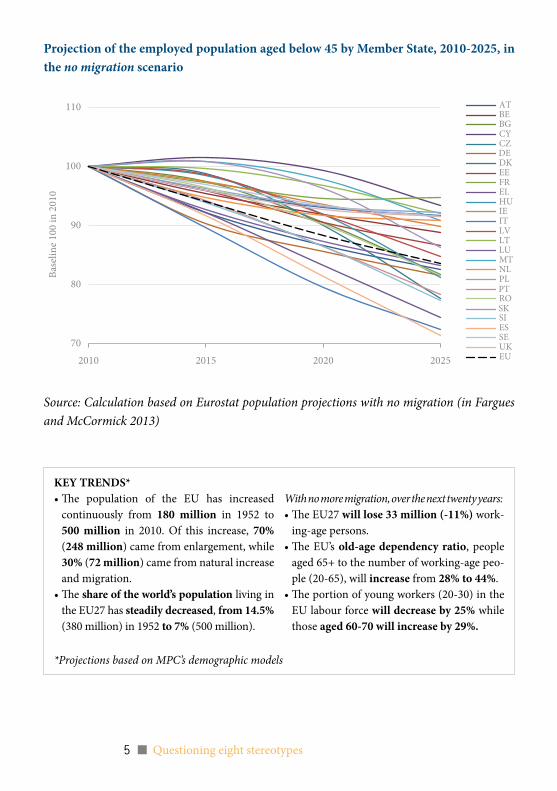
one quarter to almost one half (please note that the old-age dependency ratio is the number of older persons [age 65+] per 100 working-age persons [aged 20-64 years]). This will make such systems unsustainable.The EU workforce is also ageing rapidly (see figure). The number of young people (below 45) in the workforce, those with cutting-edge knowledge, will drop by a quarter over the next 11 years without further migration. On the other hand, the quantity of old workers (age 45+) will re-main more or less constant. Such an ageing of the skills will negatively affect the EU’s global competitiveness.Natural increase and the incorporation of currently acceding states, even when com-bined, will not be enough to reverse these trends. However, immigration offers one method of mitigating their effects. The con-tinued acceptance of young, working-age migrants will: bolster the EU’s workforce; help its social insurance systems remain solvent; and contribute to the global com-petitiveness of its economy.
“WE DO nOt nEED migRants”stEREOtypE
1
5 Questioning eight stereotypes
Projection of the employed population aged below 45 by Member State, 2010-2025, in the no migration scenario
Source: Calculation based on Eurostat population projections with no migration (in Fargues and McCormick 2013)
Base
line 1
00 in
201
0
70
80
90
100
110
2010 2015 2020 2025
ATBEBGCYCZDEDKEEFRELHUIEITLVLTLUMTNLPLPTROSKSIESSEUKEU
KEY TRENDS*•The population of the EU has increased
continuously from 180 million in 1952 to 500 million in 2010. Of this increase, 70% (248 million) came from enlargement, while 30% (72 million) came from natural increase and migration.
•The share of the world’s population living in the EU27 has steadily decreased, from 14.5% (380 million) in 1952 to 7% (500 million).
With no more migration, over the next twenty years:•The EU27 will lose 33 million (-11%) work-
ing-age persons.•The EU’s old-age dependency ratio, people
aged 65+ to the number of working-age peo-ple (20-65), will increase from 28% to 44%.
•The portion of young workers (20-30) in the EU labour force will decrease by 25% while those aged 60-70 will increase by 29%.
*Projections based on MPC’s demographic models
6 Is what we hear about migration really true?
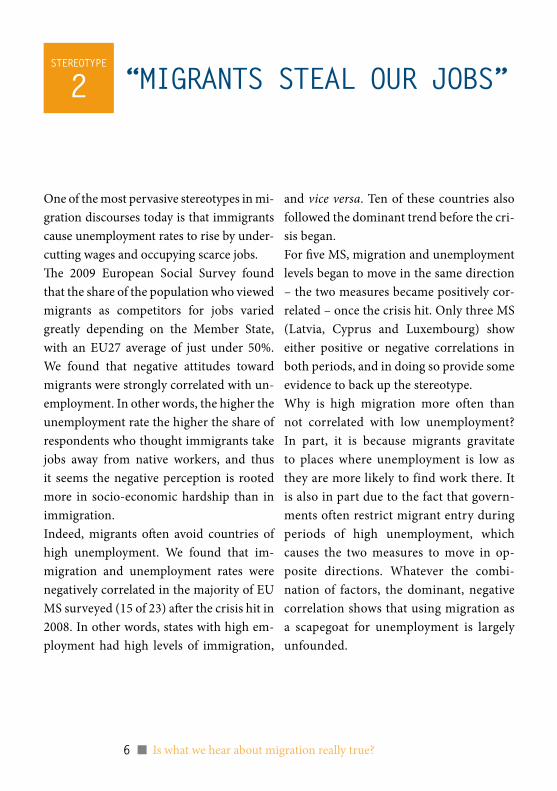
One of the most pervasive stereotypes in mi-gration discourses today is that immigrants cause unemployment rates to rise by under-cutting wages and occupying scarce jobs.The 2009 European Social Survey found that the share of the population who viewed migrants as competitors for jobs varied greatly depending on the Member State, with an EU27 average of just under 50%. We found that negative attitudes toward migrants were strongly correlated with un-employment. In other words, the higher the unemployment rate the higher the share of respondents who thought immigrants take jobs away from native workers, and thus it seems the negative perception is rooted more in socio-economic hardship than in immigration.Indeed, migrants often avoid countries of high unemployment. We found that im-migration and unemployment rates were negatively correlated in the majority of EU MS surveyed (15 of 23) after the crisis hit in 2008. In other words, states with high em-ployment had high levels of immigration,
and vice versa. Ten of these countries also followed the dominant trend before the cri-sis began.For five MS, migration and unemployment levels began to move in the same direction – the two measures became positively cor-related – once the crisis hit. Only three MS (Latvia, Cyprus and Luxembourg) show either positive or negative correlations in both periods, and in doing so provide some evidence to back up the stereotype.Why is high migration more often than not correlated with low unemployment? In part, it is because migrants gravitate to places where unemployment is low as they are more likely to find work there. It is also in part due to the fact that govern-ments often restrict migrant entry during periods of high unemployment, which causes the two measures to move in op-posite directions. Whatever the combi-nation of factors, the dominant, negative correlation shows that using migration as a scapegoat for unemployment is largely unfounded.
“migRants stEal OuR jObs”stEREOtypE
2
7 Questioning eight stereotypes
EU (27 Member States) quarterly unemployment by annual net migration, 2001-2012
Source: Eurostat, McCormick (2012)
-2.5
-2.0
-1.5
-1.0
-0.5
0.0
0.5
1.0
1.5
2.0
2.5
Q1 Q2 Q3 Q4 Q1 Q2 Q3 Q4 Q1 Q2 Q3 Q4 Q1 Q2 Q3 Q4 Q1 Q2 Q3 Q4 Q1 Q2 Q3 Q4 Q1 Q2 Q3 Q4 Q1 Q2 Q3 Q4 Q1 Q2 Q3 Q4 Q1 Q2 Q3 Q4 Q1 Q2 Q3 Q4 Q1
2001 2002 2003 2004 2005 2006 2007 2008 2009 2010 2011 2012
EU Unemployment EU Net Migration Actual EU Net Migration Projected
Stan
dard
ised
Rate
8 Is what we hear about migration really true?
It is often thought that the path out of the current crisis is through the revitalisation and improvement of Europe’s knowledge economies. As such, it is commonly as-sumed that Europe no longer needs the type of labour that low-skilled migrants provide. Following this logic, MS migration policy usually attempts to attract highly-skilled migrants while containing and discouraging low-skilled migration. This is misguided. Low-skilled labourers are still necessary for national economies to function, but as a re-sult of such migration policies the demand now often exceeds the supply.Low-skilled migrant labour also allows for the social mobility of natives. When mi-grants take over less desirable, but neces-sary work, they open up the space needed for natives to pursue higher-paying, high-er-skilled employment opportunities. They also fill jobs left vacant by native workers, who perceive such employment as unde-sirable for reasons of low pay or low social status, among others. This is often true for national industries that require large, steady workforces and
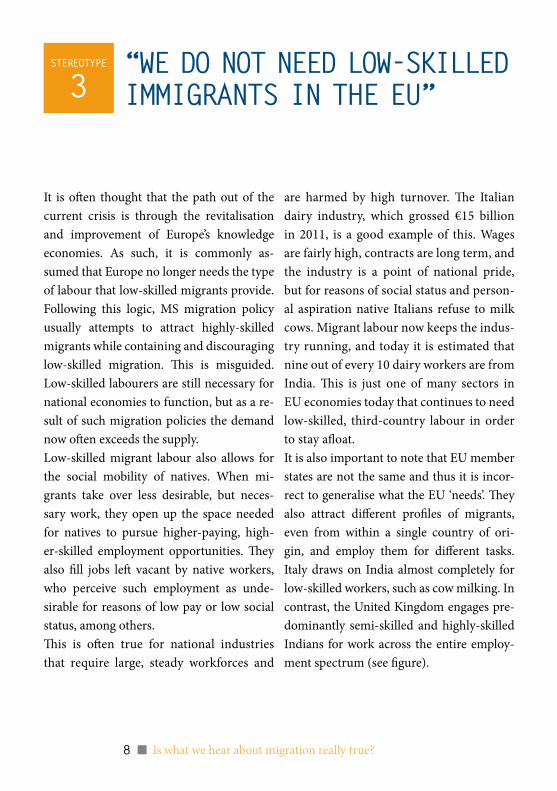
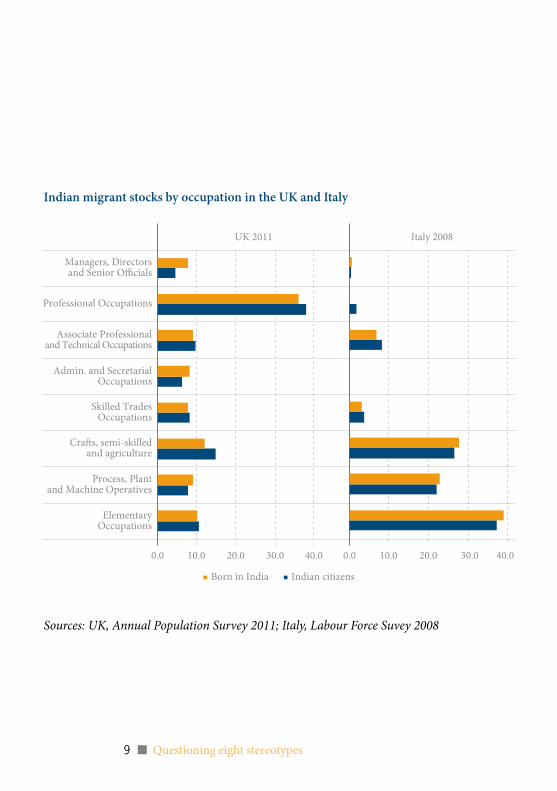
are harmed by high turnover. The Italian dairy industry, which grossed €15 billion in 2011, is a good example of this. Wages are fairly high, contracts are long term, and the industry is a point of national pride, but for reasons of social status and person-al aspiration native Italians refuse to milk cows. Migrant labour now keeps the indus-try running, and today it is estimated that nine out of every 10 dairy workers are from India. This is just one of many sectors in EU economies today that continues to need low-skilled, third-country labour in order to stay afloat.It is also important to note that EU member states are not the same and thus it is incor-rect to generalise what the EU ‘needs’. They also attract different profiles of migrants, even from within a single country of ori-gin, and employ them for different tasks. Italy draws on India almost completely for low-skilled workers, such as cow milking. In contrast, the United Kingdom engages pre-dominantly semi-skilled and highly-skilled Indians for work across the entire employ-ment spectrum (see figure).
“WE DO nOt nEED lOW-skillED immigRants in thE Eu”
stEREOtypE
3
9 Questioning eight stereotypes
Indian migrant stocks by occupation in the UK and Italy
Sources: UK, Annual Population Survey 2011; Italy, Labour Force Suvey 2008
ElementaryOccupations
Process, Plantand Machine Operatives
Cra�s, semi-skilledand agriculture
Skilled TradesOccupations
Admin. and SecretarialOccupations
Associate Professionaland Technical Occupations
Professional Occupations
Managers, Directorsand Senior O�cials
0.0 10.0 20.0 30.0 40.0 0.0 10.0 20.0 30.0 40.0
Italy 2008UK 2011
Born in India Indian citizens
10 Is what we hear about migration really true?
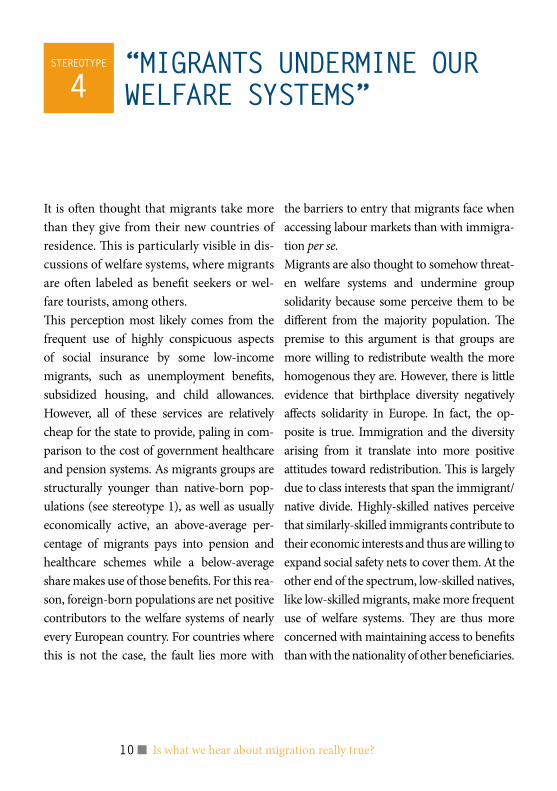
It is often thought that migrants take more than they give from their new countries of residence. This is particularly visible in dis-cussions of welfare systems, where migrants are often labeled as benefit seekers or wel-fare tourists, among others.This perception most likely comes from the frequent use of highly conspicuous aspects of social insurance by some low-income migrants, such as unemployment benefits, subsidized housing, and child allowances. However, all of these services are relatively cheap for the state to provide, paling in com-parison to the cost of government healthcare and pension systems. As migrants groups are structurally younger than native-born pop-ulations (see stereotype 1), as well as usually economically active, an above-average per-centage of migrants pays into pension and healthcare schemes while a below-average share makes use of those benefits. For this rea-son, foreign-born populations are net positive contributors to the welfare systems of nearly every European country. For countries where this is not the case, the fault lies more with
the barriers to entry that migrants face when accessing labour markets than with immigra-tion per se. Migrants are also thought to somehow threat-en welfare systems and undermine group solidarity because some perceive them to be different from the majority population. The premise to this argument is that groups are more willing to redistribute wealth the more homogenous they are. However, there is little evidence that birthplace diversity negatively affects solidarity in Europe. In fact, the op-posite is true. Immigration and the diversity arising from it translate into more positive attitudes toward redistribution. This is largely due to class interests that span the immigrant/native divide. Highly-skilled natives perceive that similarly-skilled immigrants contribute to their economic interests and thus are willing to expand social safety nets to cover them. At the other end of the spectrum, low-skilled natives, like low-skilled migrants, make more frequent use of welfare systems. They are thus more concerned with maintaining access to benefits than with the nationality of other beneficiaries.
“migRants unDERminE OuR WElFaRE systEms”
stEREOtypE
4
11 Questioning eight stereotypes
Differences in the net direct fiscal contribution of immigrant and native-born house-holds and the role of different characteristics, 2007-2009
Source: Kaczmarczyk (2013) based on OECD (2013: 151)
4000
2000
0
-2000
-4000
-6000
-8000
Euro
s (PP
P ad
just
ed)
Ger
man
ySw
eden
Belgi
umD
enm
ark
Polan
dN
ethe
rland
sFi
nlan
dAu
stria
Icela
ndSlo
vaki
aEs
toni
aCz
ech
Repu
blic
Fran
ceSlo
veni
aO
ECD
aver
age
Nor
way
Uni
ted St
ates
Austr
alia
Uni
ted K
ingd
omG
reec
ePo
rtuga
lIta
lyIre
land
Switz
erlan
dH
unga
rySp
ainLu
xem
bour
g
Total di�erenceDi�erence a�er adjustment for age
Di�erence a�er adjustment for labour market statusDi�erence a�er adjustment for education
12 Is what we hear about migration really true?
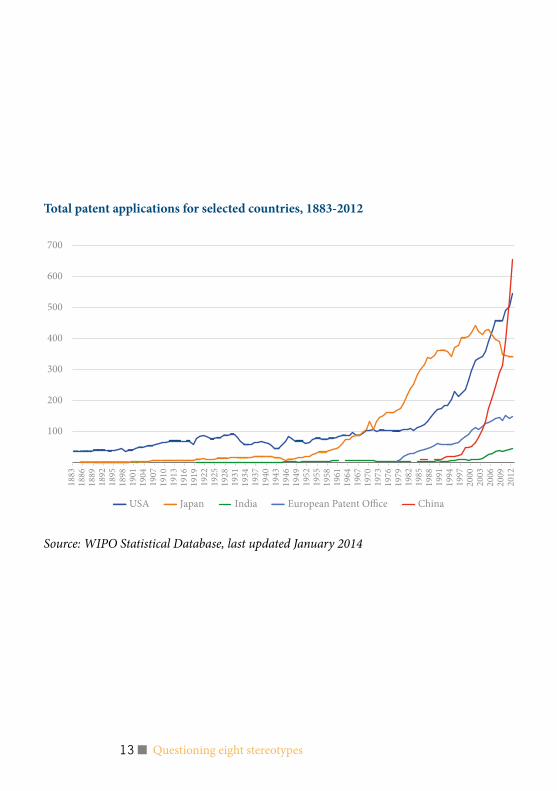
The stereotype that migration hampers in-novation starts from the premise that mi-grants are low-skilled labour, and thus do not contribute to a nation’s innovative ca-pacity. Since low-skilled migrants also ac-cept low wages, it is further presumed that firms will not invest in R&D and labour- saving techniques if there is an abundant supply of migrant labour at their finger-tips. This slows down the modernisation of industries and dulls Europe’s competitive edge. This logic is flawed for the simple rea-son that not all migrants are low-skilled.Research shows that both highly-skilled mi-grants and highly-diverse workplaces pos-itively impact innovation. This is because immigrants both invent and contribute to the inventions of others. One way of seeing this is by looking at patent applications. We find that countries with relatively open im-migration policies for specific, highly-skilled sectors receive more patent applications
than those with more restrictive policies. This research further finds that there are positive spillover effects from these sectors on the wages and innovative capacities of both complementary and non-related fields. In addition to this, studies show that overall diversity in the workplace, both in terms of the number of migrants and in terms of how many countries they represent, positively contributes to productivity. This is true at the regional, sector, and firm levels.Low-skilled migrants also have a role to play in the pursuit of innovation. By taking over some duties, such as child-care, they free highly-skilled workers to concentrate on other pursuits. This means that migra-tion may actually help spur Europe out of the crisis rather than hinder its recovery. It will also contribute to Europe’s competitive-ness at a time when challenges from South Korea, China and India are becoming more intense (see figure).
“migRatiOn hampERs OuR capacity tO innOvatE”
stEREOtypE
5
13 Questioning eight stereotypes
Total patent applications for selected countries, 1883-2012
Source: WIPO Statistical Database, last updated January 2014
100
200
300
400
500
600
700
1883
18
86
1889
18
92
1895
18
98
1901
19
04
1907
19
10
1913
19
16
1919
19
22
1925
19
28
1931
19
34
1937
19
40
1943
19
46
1949
19
52
1955
19
58
1961
19
64
1967
19
70
1973
19
76
1979
19
82
1985
19
88
1991
19
94
1997
20
00
2003
20
06
2009
20
12
USA Japan India European Patent O�ce China
14 Is what we hear about migration really true?
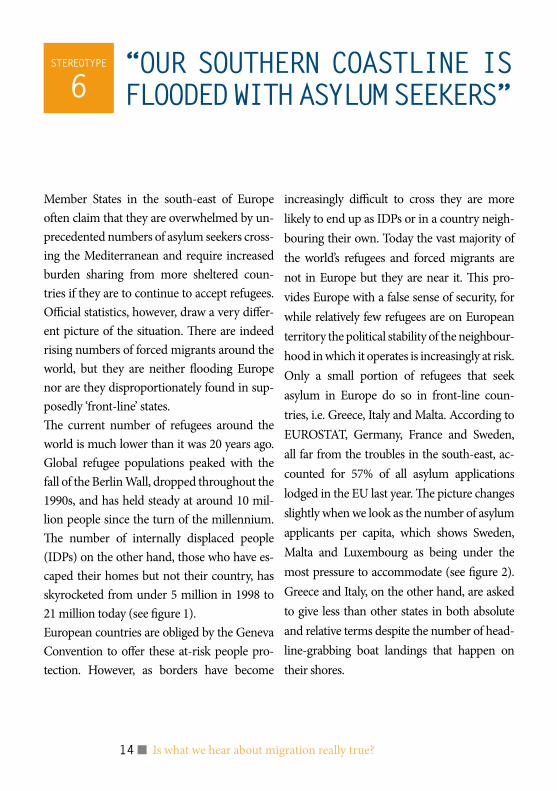
Member States in the south-east of Europe often claim that they are overwhelmed by un-precedented numbers of asylum seekers cross-ing the Mediterranean and require increased burden sharing from more sheltered coun-tries if they are to continue to accept refugees. Official statistics, however, draw a very differ-ent picture of the situation. There are indeed rising numbers of forced migrants around the world, but they are neither flooding Europe nor are they disproportionately found in sup-posedly ‘front-line’ states.The current number of refugees around the world is much lower than it was 20 years ago. Global refugee populations peaked with the fall of the Berlin Wall, dropped throughout the 1990s, and has held steady at around 10 mil-lion people since the turn of the millennium. The number of internally displaced people (IDPs) on the other hand, those who have es-caped their homes but not their country, has skyrocketed from under 5 million in 1998 to 21 million today (see figure 1).European countries are obliged by the Geneva Convention to offer these at-risk people pro-tection. However, as borders have become
increasingly difficult to cross they are more likely to end up as IDPs or in a country neigh-bouring their own. Today the vast majority of the world’s refugees and forced migrants are not in Europe but they are near it. This pro-vides Europe with a false sense of security, for while relatively few refugees are on European territory the political stability of the neighbour-hood in which it operates is increasingly at risk. Only a small portion of refugees that seek asylum in Europe do so in front-line coun-tries, i.e. Greece, Italy and Malta. According to EUROSTAT, Germany, France and Sweden, all far from the troubles in the south-east, ac-counted for 57% of all asylum applications lodged in the EU last year. The picture changes slightly when we look as the number of asylum applicants per capita, which shows Sweden, Malta and Luxembourg as being under the most pressure to accommodate (see figure 2). Greece and Italy, on the other hand, are asked to give less than other states in both absolute and relative terms despite the number of head-line-grabbing boat landings that happen on their shores.
“OuR sOuthERn cOastlinE is FlOODED With asylum sEEkERs”
stEREOtypE
6
15 Questioning eight stereotypes
1998 2000
Refugees IDPs
2002 2004 2006 2008 2010 2012 2014
25,000,000
20,000,000
15,000,000
10,000,000
5,000,000
Swed
enM
alta
Luxe
mbo
urg
Hun
gary
Ger
man
yCy
prus
Den
mar
kBe
lgium
Bulga
riaFr
ance
Net
herla
nds
Gre
ece
Finl
and
Italy
Uni
ted K
ingd
om
Polan
dCr
oatia
Irelan
dSlo
veni
aSp
ainLa
tvia
Lith
uani
aRo
man
iaEs
toni
aSlo
vaki
aPo
rtuga
lCz
ech
Repu
blic
Austr
ia
2000
1000
4000
3000
6000
5000
7000Back-line member stateFront-line member state
Fig.1 – Numbers of refugees and internally displaced persons 1998-2013
Source: Authors’ graph, based on UNHCR data
1998 2000
Refugees IDPs
2002 2004 2006 2008 2010 2012 2014
25,000,000
20,000,000
15,000,000
10,000,000
5,000,000
Swed
enM
alta
Luxe
mbo
urg
Hun
gary
Ger
man
yCy
prus
Den
mar
kBe
lgium
Bulga
riaFr
ance
Net
herla
nds
Gre
ece
Finl
and
Italy
Uni
ted K
ingd
om
Polan
dCr
oatia
Irelan
dSlo
veni
aSp
ainLa
tvia
Lith
uani
aRo
man
iaEs
toni
aSlo
vaki
aPo
rtuga
lCz
ech
Repu
blic
Austr
ia
2000
1000
4000
3000
6000
5000
7000Back-line member stateFront-line member state
Source: Authors’ graph, based on Eurostat data
Fig.2 – Number of asylum applications per million inhabitants in 2013

16 Is what we hear about migration really true?
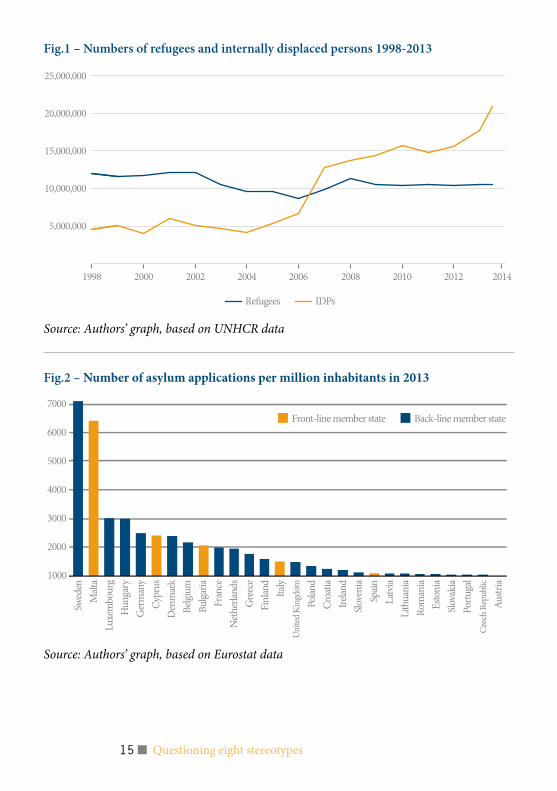
It is a common refrain that some migrants arriving to the EU by boat from across the Mediterranean want to cheat the asylum system in order to gain access to European labour markets. This flow of people is also assumed to be getting stronger.The reality is different. Between 1998 and 2009 the number of people crossing annu-ally from Africa to Europe did not mark-edly increase. The most recent years have been more erratic, with uncommonly low numbers of arrivals in 2010 and 2012 off-set by spikes in 2011 and 2013. The total for 2014 will also be high because of: the growing number of Syrians attempting to enter Europe by sea; the current political situation in Libya, which gives free reign to human smugglers; and Italy’s Mare Nostrum programme, which has rescued nearly 50,000 people since it began last October.The risk of dying during the voyage, how-ever, has dramatically increased since the turn of the millennium, to the point that the Mediterranean crossing is now one of the most dangerous sea routes in the world (see figure 1). The probability of dying has been
consistently above 3%, meaning 30 people die for every 1000 that attempt to cross, for every year except 2010 according to MPC’s calculations. The rising death toll is largely due to the cat and mouse game being played on the high seas, in which migrants adapt to more intense surveillance by taking longer and more dangerous routes. Migrants arriving by sea are different from Europe’s other migrants and should not be assumed to be job seekers in disguise. They are overwhelmingly from Sub-Saharan Africa, particularly Eritrea, Nigeria and Somalia, as well as a handful of other trou-ble spots such as Syria and Afghanistan (see figure 2). With some exceptions these are not the main countries of origin for immigrants or asylum seekers in the EU. However, they are all countries with ex-treme political conditions, and most people fleeing them would qualify for internation-al protection if they made it across the sea. This is true even if they pass through sever-al other countries on their way to Europe, as the countries they transit are often as dangerous as their own.
“EcOnOmic migRants aRE tRying tO chEat OuR asylum systEm”
stEREOtypE
7
17 Questioning eight stereotypes
Fig.1 – Arrivals at sea in Italy, Spain, Malta and Greece 1998-2014
80,000
70,000
60,000
50,000
40,000
30,000
20,000
10,000
0
1998
1999
2000
2001
2002
2003
2004
2005
2006
2007
2008
2009
2010
2011
2012
2013
2014
Italy Spain Malta Greece
0.0
10.0
20.0
30.0
40.0
50.0
1998 2003 2008 2013
Italy + Malta Spain Greece ALL ROUTES
Notes: Greek data from 2009 onwards; Maltese data from 2008 onwardsSources: Italian Ministry of Interior; Spanish Ministry of Interior; Frontexwatch Malta; Hellenic Police, Ministry of Public Order & Citizen Protection
80,000
70,000
60,000
50,000
40,000
30,000
20,000
10,000
0
1998
1999
2000
2001
2002
2003
2004
2005
2006
2007
2008
2009
2010
2011
2012
2013
2014
Italy Spain Malta Greece
0.0
10.0
20.0
30.0
40.0
50.0
1998 2003 2008 2013
Italy + Malta Spain Greece ALL ROUTES
Fig.2 – Probability of dying on irregular migration maritime routes to the EU, 1988-2013 (per 1,000)
Source: Authors’ calculation based on Fortress Europe data
18 Is what we hear about migration really true?
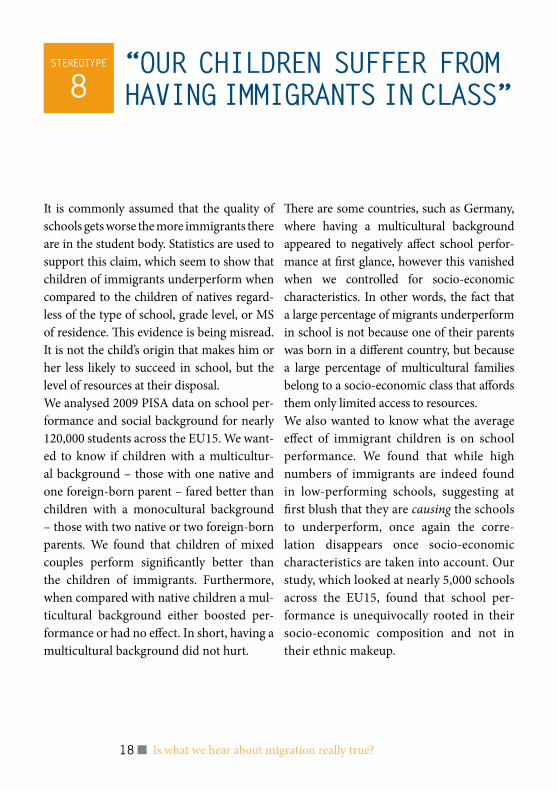
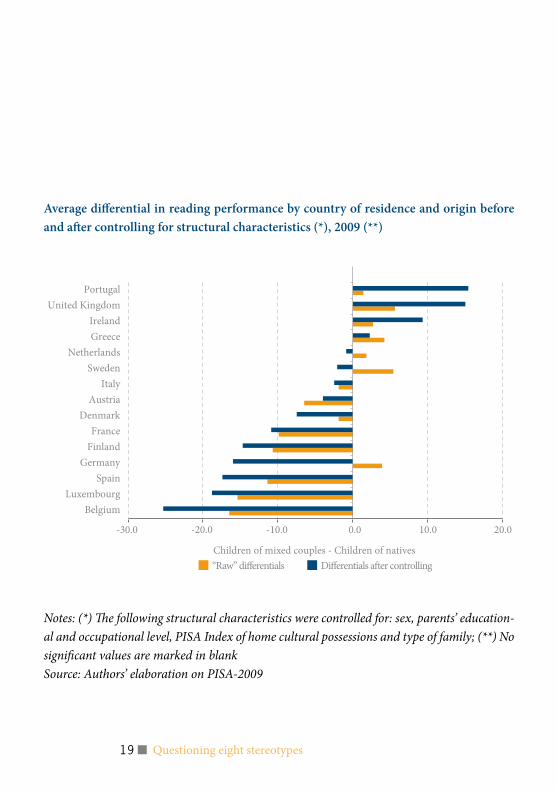
It is commonly assumed that the quality of schools gets worse the more immigrants there are in the student body. Statistics are used to support this claim, which seem to show that children of immigrants underperform when compared to the children of natives regard-less of the type of school, grade level, or MS of residence. This evidence is being misread. It is not the child’s origin that makes him or her less likely to succeed in school, but the level of resources at their disposal.We analysed 2009 PISA data on school per-formance and social background for nearly 120,000 students across the EU15. We want-ed to know if children with a multicultur-al background – those with one native and one foreign-born parent – fared better than children with a monocultural background – those with two native or two foreign-born parents. We found that children of mixed couples perform significantly better than the children of immigrants. Furthermore, when compared with native children a mul-ticultural background either boosted per-formance or had no effect. In short, having a multicultural background did not hurt.
There are some countries, such as Germany, where having a multicultural background appeared to negatively affect school perfor-mance at first glance, however this vanished when we controlled for socio-economic characteristics. In other words, the fact that a large percentage of migrants underperform in school is not because one of their parents was born in a different country, but because a large percentage of multicultural families belong to a socio-economic class that affords them only limited access to resources. We also wanted to know what the average effect of immigrant children is on school performance. We found that while high numbers of immigrants are indeed found in low-performing schools, suggesting at first blush that they are causing the schools to underperform, once again the corre-lation disappears once socio-economic characteristics are taken into account. Our study, which looked at nearly 5,000 schools across the EU15, found that school per-formance is unequivocally rooted in their socio-economic composition and not in their ethnic makeup.
“OuR chilDREn suFFER FROm having immigRants in class”
stEREOtypE
8
19 Questioning eight stereotypes
Average differential in reading performance by country of residence and origin before and after controlling for structural characteristics (*), 2009 (**)
Notes: (*) The following structural characteristics were controlled for: sex, parents’ education-al and occupational level, PISA Index of home cultural possessions and type of family; (**) No significant values are marked in blankSource: Authors’ elaboration on PISA-2009
-30.0 -20.0 -10.0 0.0 10.0 20.0
BelgiumLuxembourg
SpainGermany
FinlandFrance
DenmarkAustria
ItalySweden
NetherlandsGreeceIreland
United KingdomPortugal
Children of mixed couples - Children of natives
Di�erentials a�er controlling“Raw” di�erentials
Published by the European University Institute, Robert Schuman Centre for Advanced Studies, Migration Policy Centre.
© European University Institute, 2014
The Migration Policy Centre at the European University Institute, Florence, conducts advanced research on global migration to serve migration governance needs at European level, from develop-ing, implementing and monitoring migration-related policies to assessing their impact on the wider economy and society.
Links to an electronic version of this publication, which is available free of charge, may be found on the MPC website at www.migrationpolicycentre.eu
For queries regarding this publication, please contact the MPC at [email protected]
cOntactsMigration Policy CentreRobert Schuman Centre for Advanced StudiesEuropean University InstituteVia delle Fontanelle 18I-50014 San Domenico di Fiesole (FI), Italy
Tel: (+39) 055 4685 817Fax: (+39) 055 4685 770Email: [email protected]: www.migrationpolicycentre.eu


The Migration Policy Centre receives financing from the European Commission. This publication reflects the views only of the author(s), and the Commission cannot be held responsible for any use which may be made of the information contained therein.
Based on the report:Is what we hear about migration really true?Questioning eight stereotypes(ISBN 978-92-9084-213-2; DOI:10.2870/11242)The full report is available online at:www.migrationpolicycentre.eu/migration-stereotypes