isaca d i y living lean lean...isaca d – i – y living lean april 18, 2012 dr. laura jekabsons...
TRANSCRIPT
ISACA
D – I – Y Living Lean
April 18, 2012
Dr. Laura Jekabsons McNeil
University of Phoenix
University of North Florida - CE
Citigroup

2 2
Who has been attributed with throwing the first overhand pitch?

3 3
1856, Germantown, PA
1915, Philadelphia, PA
Taylor won the U.S. Lawn Tennis Association doubles championship using a patented spoon-shaped racket of his own design.
The Father of Scientific Management
Frederick Winslow Taylor
• Student at Phillip Exeter Academy ~1872
• Mr. Wentworth, Math Teacher
• Authored Principles of Scientific Management
• Attributed with introducing:
• Industrial Management
• Knowledge Management
• Worked with pig irons and brick layers

4 4
The Overhand DMAIC
Define Problem
- Spectators and players want faster pace game
- Not challenging – too many players make it to base (easy to hit)
D M A I C
Analyze - Is the change legal? (Procedures, Rule Book … etc)
- How long can pitchers sustain accuracy / speed?
- Can batters hit ball?
- Do the spectators like the change?
- Additional fatigue / longevity studies …
- Identify the change
Improve – Make a change / Pilot - Win more frequently?
- Improve accuracy?
- More challenging for the players and more engaging for the viewers?
Control - Limit number of pitches?
- Are there other challenges?
- Continuous Improvement
Measure
- How fast / accurate is the pitch?
- How easy is it to hit the ball?
- How tired / stressed does it make the pitcher?
- How do the spectators like the game?
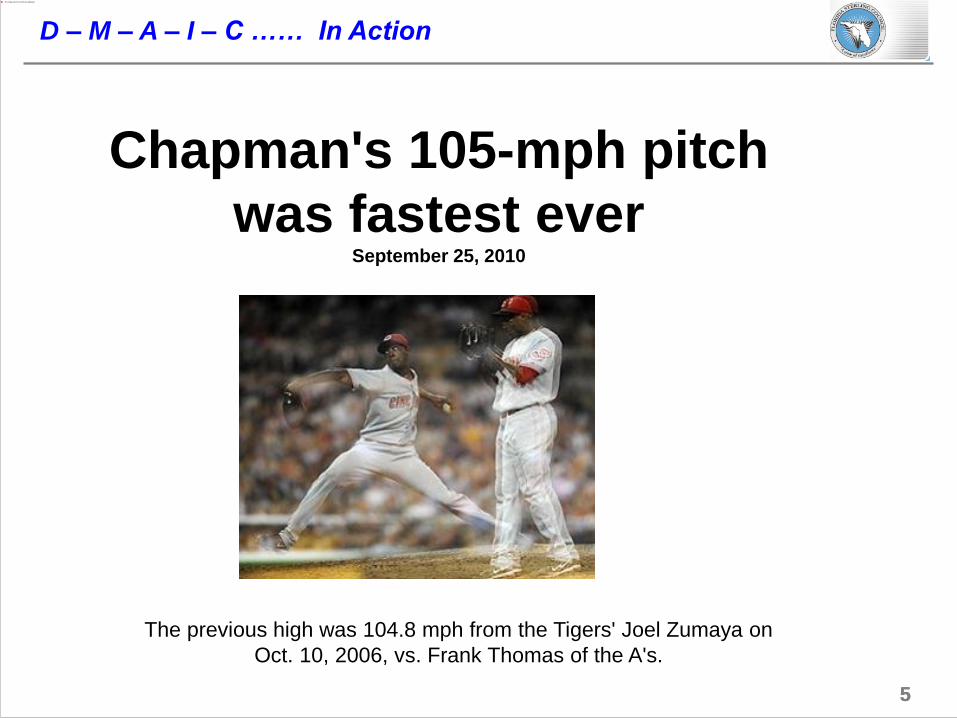
5 5
Chapman's 105-mph pitch
was fastest ever September 25, 2010
The previous high was 104.8 mph from the Tigers' Joel Zumaya on
Oct. 10, 2006, vs. Frank Thomas of the A's.
D – M – A – I – C …… In Action

6 6
Mind Game and Moneyball
By Steven Goldman - Workman Publishing (2005) - Paperback - 352
pages - ISBN 0761140182
Think You Know Baseball? Think Again. The Red Sox finally won a World
Series, in a triumph of unconventional wisdom.
• They rethought the batting order and committed to Johnny Damon as lead-off.
Saw the talent in David Ortiz that other teams overlooked.
• … the new thinking about pitch count—allowing Pedro Martinez, arguably
baseball’s best pitcher ever, to excel.
Moneyball – Oakland A's general manager Billy Beane (Brad Pitt) challenges the
system and defies conventional wisdom when his is forced to rebuild his small-market
team on a limited budget. Despite opposition from the old guard, the media, fans and their
own field manager (Philip Seymour Hoffman), Beane develops a roster of misfits...and
along the way, forever changes the way the game is played.

7 7
Today’s Agenda
8 8
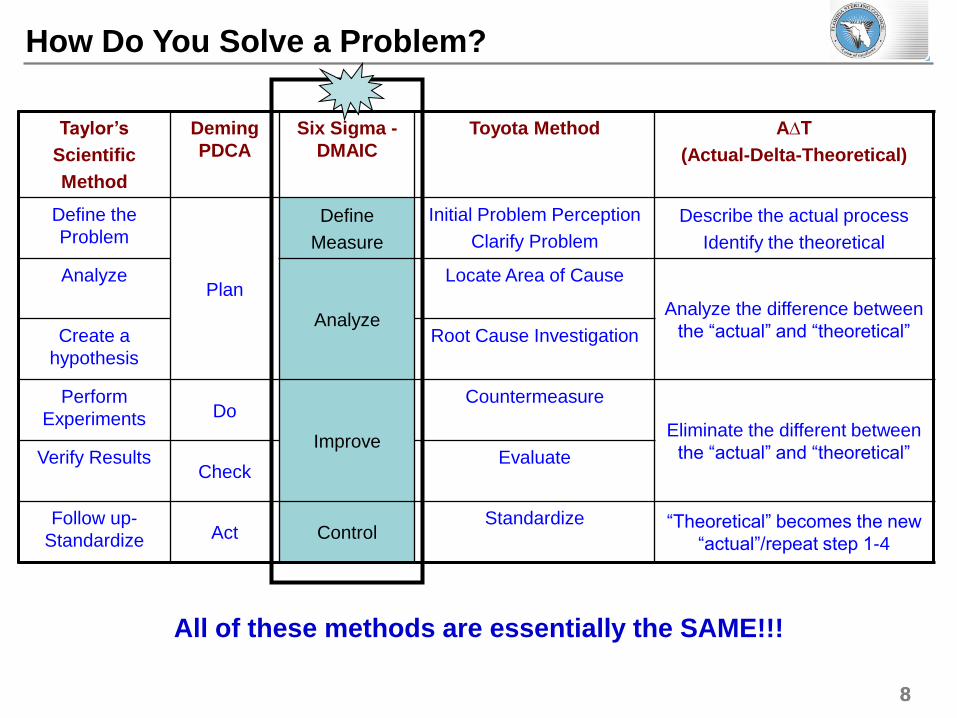
How Do You Solve a Problem?
All of these methods are essentially the SAME!!!
Taylor’s
Scientific
Method
Deming
PDCA
Six Sigma -
DMAIC
Toyota Method A∆T
(Actual-Delta-Theoretical)
Define the
Problem
Plan
Define
Measure
Initial Problem Perception
Clarify Problem
Describe the actual process
Identify the theoretical
Analyze
Analyze
Locate Area of Cause
Analyze the difference between
the “actual” and “theoretical” Create a
hypothesis
Root Cause Investigation
Perform
Experiments Do
Improve
Countermeasure
Eliminate the different between
the “actual” and “theoretical” Verify Results Check
Evaluate
Follow up-
Standardize Act Control Standardize “Theoretical” becomes the new
“actual”/repeat step 1-4
9 9
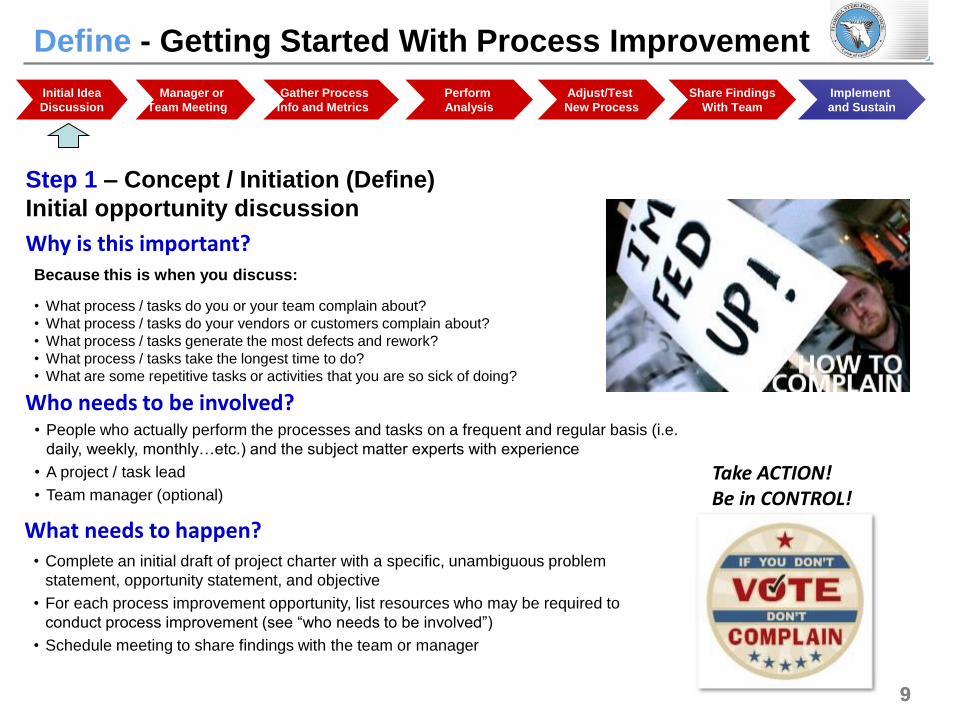
Define - Getting Started With Process Improvement
Step 1 – Concept / Initiation (Define)
Initial opportunity discussion
Initial Idea
Discussion
Manager or
Team Meeting
Gather Process
Info and Metrics
Perform
Analysis
Share Findings
With Team
Adjust/Test
New Process
Implement
and Sustain
Why is this important? Because this is when you discuss:
• What process / tasks do you or your team complain about?
• What process / tasks do your vendors or customers complain about?
• What process / tasks generate the most defects and rework?
• What process / tasks take the longest time to do?
• What are some repetitive tasks or activities that you are so sick of doing?
Who needs to be involved? • People who actually perform the processes and tasks on a frequent and regular basis (i.e.
daily, weekly, monthly…etc.) and the subject matter experts with experience
• A project / task lead
• Team manager (optional)
What needs to happen? • Complete an initial draft of project charter with a specific, unambiguous problem
statement, opportunity statement, and objective
• For each process improvement opportunity, list resources who may be required to
conduct process improvement (see “who needs to be involved”)
• Schedule meeting to share findings with the team or manager
Take ACTION! Be in CONTROL!

10 10
Getting Started With Process Improvement
Step 2 – Sponsorship (Define)
Create a sense of urgency – presenting your ideas to your team / manager
Why is this important? Because this is when you:
• Talk about what the “wake-up call” was – why do we need to act now
• Get everyone to believe you
• Get a “go-ahead” to FINALLY do something about an overlooked, unproductive
process or tasks
Who needs to be involved? • Your team
• Your team manager
• Other teams’ managers (if your process involves multiple teams)
• Sponsor (for a large process improvement project)
What needs to happen? • Present a complete project charter that includes scope, timeline, and
proposed resources
• Present meaningful preliminary data that highlight the problem and scope
• Get your team and manager’s buy-in and commitment
• Get the resources or SME’s you need to start process improvement
2009 2010
We need to act now!
?
?
SPI Project Charter
Initial Idea
Discussion
Manager or
Team Meeting
Gather Process
Info and Metrics
Perform
Analysis
Share Findings
With Team
Adjust/Test
New Process
Implement
and Sustain

11 11
Getting Started With Process Improvement
Step 3 - Measure
Gather process information and metrics
Why is this important? Because this is when you:
• Make sure that everyone on the project team understands the
current process – communication!
• Identify what metrics you need so you know what the process
performance is today if you don’t know how the process performs today, you won’t
know if any improvements will make a difference
Who needs to be involved?
• Your project team
• Assigned data source / SME’s
What needs to happen?
• Map out the As-Is process
• Review historical trend and performance (e.g. control charts)
• Complete metrics development
• Start with “cycle time,” “defects,” “rework,” “volume,” “inventory,”
and “wait time”
• Complete a data collection plan
This is our process…right? Agreed? As-Is Process Map and Scope
Data Collection Plan
Initial Idea
Discussion
Manager or
Team Meeting
Gather Process
Info and Metrics
Perform
Analysis
Share Findings
With Team
Adjust/Test
New Process
Implement
and Sustain

12 12
Getting Started With Process Improvement
Step 4 – Analyze
Perform root cause analysis, generate resolutions, and prioritize
Why is this important? Because this is when you: • Find out what is really causing problems
• Leverage experience and knowledge from representatives from all
process steps / activities to generate resolutions that address root
causes
• Prioritize the resolutions
Who needs to be involved? • Your project team
• Assigned data source / SME’s
• Lean Practice team (if necessary)
What needs to happen? • Brainstorming – a level-set environment where creativity and
facilitation skills are crucial
• Root cause analysis – Analyze what really causes the problem (e.g.
upstream delays, deliverable dependency, handoff time…etc.) using
effective process improvement tools (e.g. fishbone diagram),
• Resolutions – generate process modification / elimination that will
address the root causes and produce better performance metrics
• Prioritization – determine what is feasible given your resources,
scope and, timeline (e.g. Impact / effort matrix)
Think outside the box! Brainstorming Stickers On A Flipchart
Impact / Effort Matrix Fishbone (Ishikawa) Diagram
Initial Idea
Discussion
Manager or
Team Meeting
Gather Process
Info and Metrics
Perform
Analysis
Share Findings
With Team
Adjust/Test
New Process
Implement
and Sustain

13 13
Getting Started With Process Improvement
Step 5 - Improve
Pilot your solutions and adjust your solutions if necessary
Why is this important? Because this is when you:
• Test if your process improvement recommendation works
and meet your target
Who needs to be involved? • Your project team
• SPI Lean Practice team
What needs to happen? • Set an initial target for your pilot
• Pilot – start with testing/experimenting using small and controlled volume
• If pilot does not meet your initial target, make adjustments
• Revisit baseline data and analysis
• Tweak the process steps, volume, batch size…etc…then test again
• If applicable, choose another item from your list of solutions to test
• Record your findings
• Target becomes the new baseline
Initial Idea
Discussion
Manager or
Team Meeting
Gather Process
Info and Metrics
Perform
Analysis
Share Findings
With Team
Adjust/Test
New Process
Implement
and Sustain
Transaction Services Lean Kaizen Event Pilot
Cut down 94% distance traveled!

14 14
Getting Started With Process Improvement
Step 6 - Control
Present your findings, resolutions, and implementation plan
Why is this important? Because this is when you:
• Show off your performance metrics, root cause analysis,
and proposed resolutions!
• Present your implementation plan
• Show how much cost avoidance your recommendations will
generate!
Who needs to be involved?
• Your project team
• Your team manager
• Other participating teams and managers
• Sponsor (if not your manager)
What needs to happen? • Leadership / management pitch-out presentation
• Obtain a “go-ahead” from the leaders and sponsor
• Secure a long-term To-Be process owner
• Team celebration lunch or dinner!
Leadership Pitch-out Presentation for a Risk Originations Maintenance Kaizen Event Hagerstown, MD on May 7th 2010
Initial Idea
Discussion
Manager or
Team Meeting
Gather Process
Info and Metrics
Perform
Analysis
Share Findings
With Team
Adjust/Test
New Process
Implement
and Sustain

15 15
Tools
&
Techniques
Define
We have a problem
Measure
How bad is it?
Analyze
Find the Root Cause
Improve
Fix it- Eliminate Root Cause
Control
Make it stay fixed

16 16
Define
Define
We have a problem
Measure
How bad is it?
Analyze
Find the Root Cause
Improve
Fix it- Eliminate Root Cause
Control
Make it stay fixed

17 17
Define
We have a problem
Measure
How bad is it?
Analyze
Find the Root Cause
Improve
Fix it- Eliminate Root Cause
Control
Make it stay fixed
o Stakeholder Analysis – what is
important
o Communication Management Plan – how to get the
word out
o CTQ Tree o KANO- Model o Observation o Interview o VOC Surveys o High-Level
Process Map (Customer View)
o Affinity Diagram
o SIPOC o Flowchart / High -
Level Process Map
o Pareto / Control Charts
o Project Charter o 5S o 5 Whys o Project Screening
Criteria o In/Out Frame o Gantt Chart o Project Archives –
Lessons Learned
SIPOC VOC
(Voice Of Customer)
Stk Hldr Anal & Comm Plan
Charter
Define Phase Tools

18 18
19 19
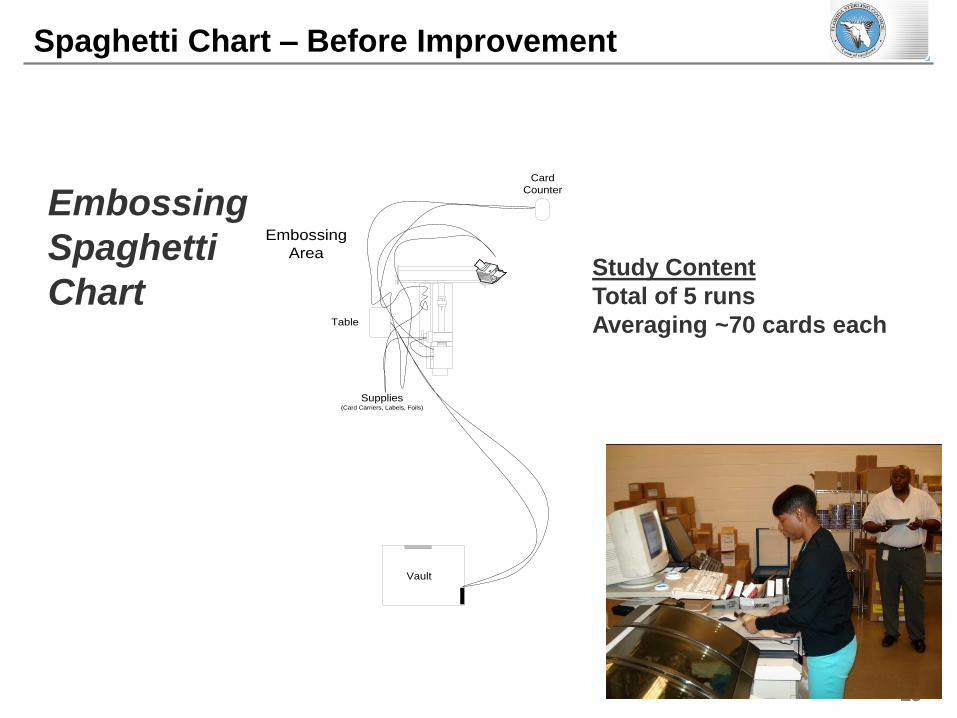
Vault
Embossing
Area
Card
Counter
Table
Supplies(Card Carriers, Labels, Foils)
Embossing
Spaghetti
Chart Study Content
Total of 5 runs
Averaging ~70 cards each
Spaghetti Chart – Before Improvement
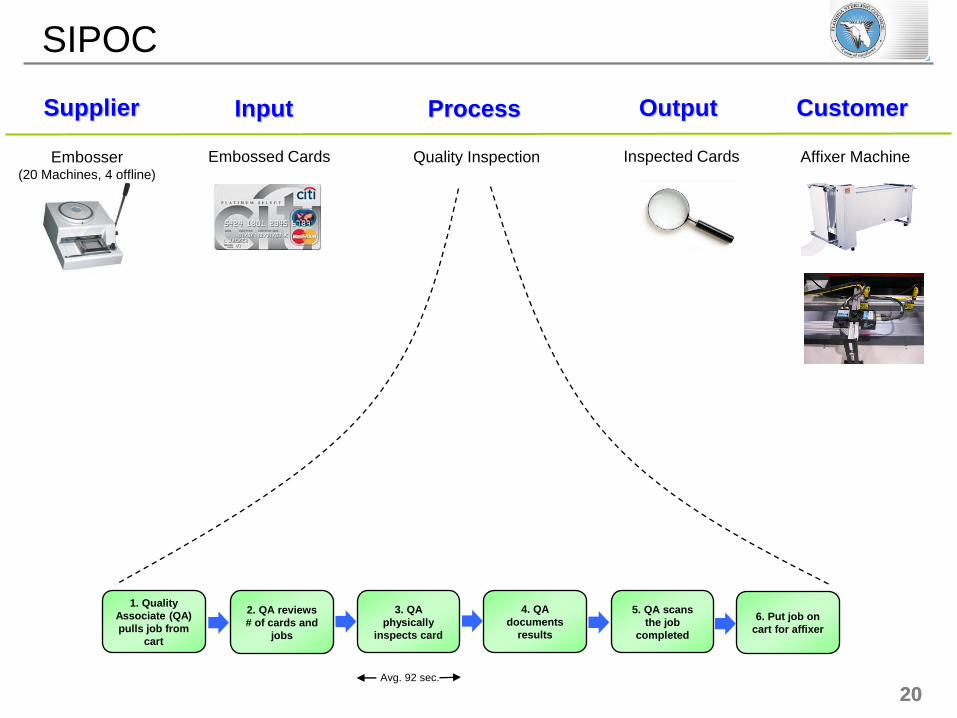
20 20 Avg. 92 sec.
1. Quality
Associate (QA)
pulls job from
cart
Supplier Input Process Output Customer
Embosser (20 Machines, 4 offline)
Embossed Cards
2. QA reviews
# of cards and
jobs
3. QA
physically
inspects card
4. QA
documents
results
5. QA scans
the job
completed
6. Put job on
cart for affixer
Quality Inspection Inspected Cards Affixer Machine
SIPOC

21 21
SIPOC - Load Testing Example
INPUTS LOAD TEST PROCESS OUTPUT
• Configured& Stable Environment
• Conditioned Data
• No SS/H Defect for Critical Flows
• Resources Available
• Approved Test Strategy
• Certified Environment
• Development Release Notes
• Required Test Scripts
• Selected Build for Deployment
• Workload Composition
• STS Code Promotion Checklist
• Stable Build Deployed to Environment
• Build meeting SLO targets
• Approved Exit Report
• Open Performance Defects
Where is the Greatest Opportunity to Reduce Cycle Time?
Most Tests Take ~4-5 hr to Run (Regression Only) Defect Resolution Critical Multiple Factors Determine
When Load Testing Starts
2 Weeks 3-4 Months 1-3 Weeks
Complete
Pretest
Checks
Perform
Load
Tests
Evaluate
Results
STS, App Dev, CTO

22 22
How do I make improvements? EFFORT
IMPACT
Action A
Action B Action C
Avoid This Box
Target Actions
Possible Actions
Action D
Action E
Action F
“Nice To Do”
Impact Matrix focuses on what is POSSIBLE!!
Low
High
Low High
Low hanging fruit!
High – Low Matrix

23 23
Effort - Impact Matrix Example
Impact
Effort
High
Low High
JCL on one sheet of paper – bar
code accessible
Reduce movement of cards
Wait time between stations
Less heavy CCT work
A different way of sorting work
Have only one quality check point
Retain data in system longer (delay purge)
to reduce risk of total rework
Split stream for quality check – if no inserts,
do not check (look at envelope to see if
insert)
Have a “quality” computer in
Embossing area
Need a process for when a
“Inserter/Quality Alert” is issued – fire
drill mode does not hit the floor
Insertion are needs insertion notes
closer to machines
Andon lights at machines to flip on when
machine is down. Light at datacard desk.
Low
High
Low High
24 24
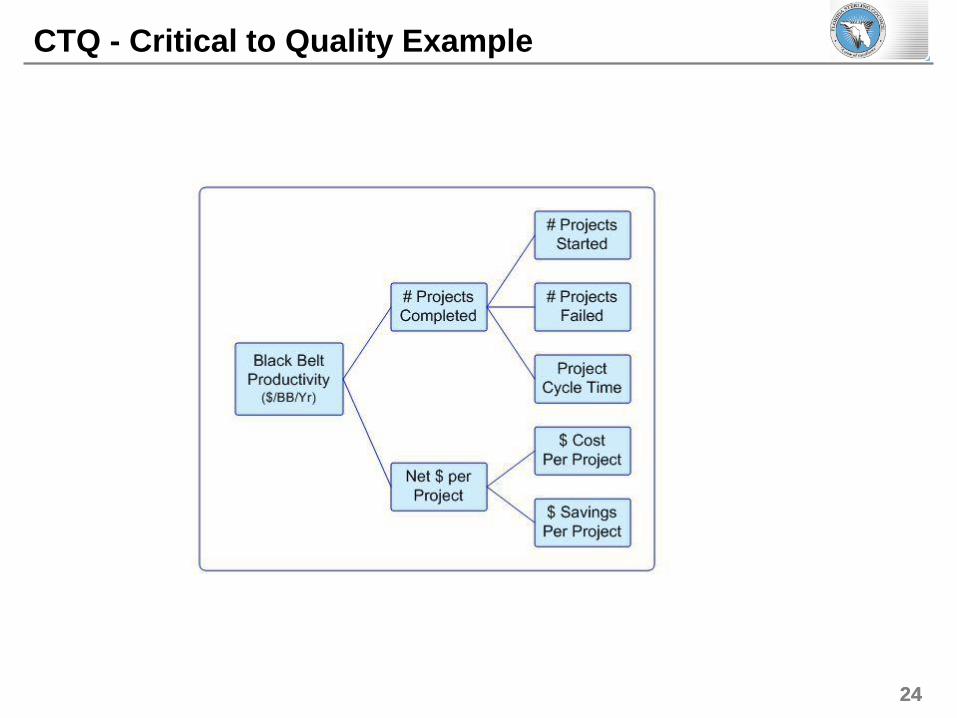
CTQ - Critical to Quality Example
25 25
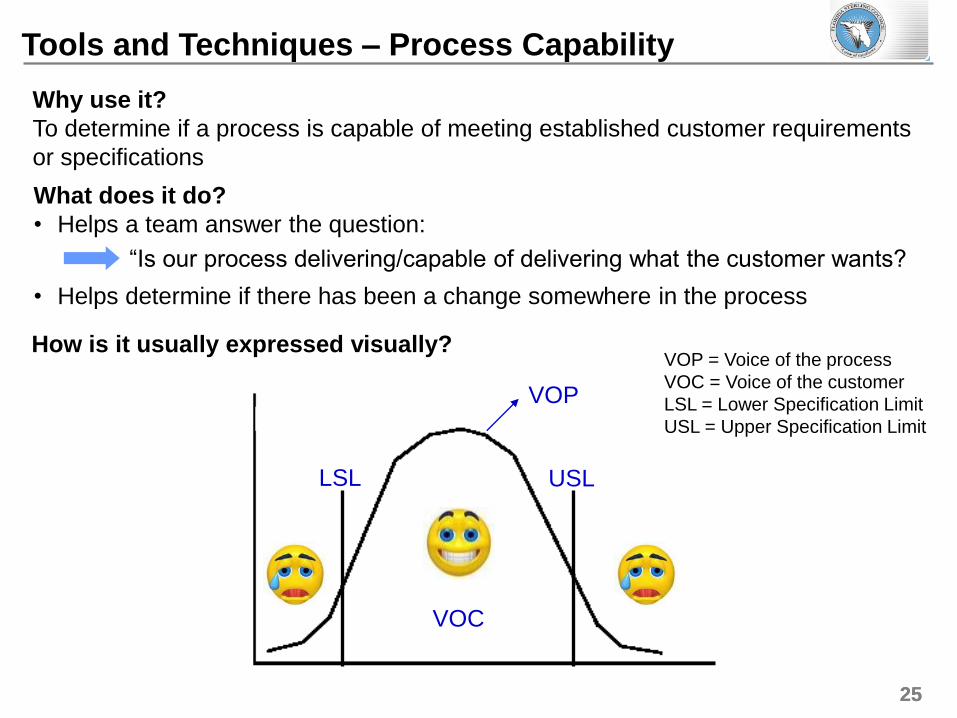
Tools and Techniques – Process Capability
Why use it?
To determine if a process is capable of meeting established customer requirements
or specifications
What does it do?
• Helps a team answer the question:
“Is our process delivering/capable of delivering what the customer wants?
• Helps determine if there has been a change somewhere in the process
LSL USL
VOP
VOC
How is it usually expressed visually? VOP = Voice of the process
VOC = Voice of the customer
LSL = Lower Specification Limit
USL = Upper Specification Limit

26 26
The Kano model is a theory of product development which classifies customer preferences into five categories:
1. Attractive quality: can be described as surprise and delight attributes; they provide satisfaction when achieved fully, but do not cause dissatisfaction when not fulfilled. These are attributes that are not normally expected. Since these types of quality attributes often unexpectedly delight customers, they are often unspoken.
- a thermometer on a package of milk showing the temperature of the milk.
2. One-dimensional quality: result in satisfaction when fulfilled and dissatisfaction when not fulfilled. These attributes are spoken and are those with which companies compete.
- new milk package says “contains 10 percent more milk for the same price” is likely to result in customer satisfaction
3. Must-be quality: are taken for granted when fulfilled but result in dissatisfaction when not fulfilled.
- in the milk example, these attributes can be represented by leakage. Customers are dissatisfied when the package leaks,
but when it does not leak the result is not increased customer satisfaction. Since customers expect these attributes and
views them as basic, it is unlikely that they are going to identify them as quality attributes.
4. Indifferent quality: refers to aspects that are neither good nor bad, and, consequently, they do not result in either customer satisfaction or customer dissatisfaction.
5. Reverse quality: refers to a high degree of achievement resulting in dissatisfaction and to the fact that not all customers are alike.
- some customers prefer high-tech products, while others prefer the basic model of a product and will be
dissatisfied if a product has too many extra features
Kano Model - developed in the 80's by Professor Noriaki Kano

27 27
Kano Model – Attribute Attractiveness

28 28
5S – Sort, Set, Sweep, Standardize, Sustain
5S is a workplace organization methodology that uses a list of Japanese words that start with the letter S.
These five words have also been translated into five words in English that start with the letter S
Phase 1 – Seiri (Sorting) – separate out and eliminate everything is not needed
Phase 2 – Seiton (Set in order) – put things in order
Phase 3 – Seiso (Shining/Sweeping) – keep the workplace swept and clean
Phase 5 – Shitsuke (Sustaining/Self-discipline)
Phase 4 – Seiketsu (Standardizing) – standardize cleanup (phase 1-3)

29 29
5S Exercise
24
20
19
18
16
17
14
12
10
11
8
26
23 21
27
22
28
33
29
32
34 31
35
36
38
37
39
41
40
44
46
47
48
49
In 20 seconds, can you find the numbers and count from 1 to 30?
2
15

30 30
5S Exercise
Now, your team decided to implement a 5S system:
The first step is “SORT”
Separate out and eliminate everything that is not needed
How can we do this in this exercise?
By getting rid of any numbers higher than 30!
Let’s see if we can count the numbers easier if all the clutter is gone

31 31
5S Exercise
19
18
16
17
14
12
10
11
8
23
21
27
22
29
Now, try again – count 1 – 30 (20 seconds) – is it easier?
2 30

32 32
5S Exercise
Now, let’s go to 5S system phase 2:
The second step is “Set in Order”
Putting things in order
How can we do this in this exercise?
By moving the numbers into 6 boxes in even number sets
33 33
5S Exercise
Now, try again – count 1 – 30 (20 seconds) – is it easier?
14
8
23
27
22 29
19
18
17
12
10
11
21
2
30
34 34
Tools and Techniques – 5S Exercise
Now, let’s go to 5S system phase 3:
The arrangement we just performed provided significant improvement.
However, this is not the best way to standardize.
Let’s try again
What can we do to clean / “Shine” the numbers up even more?
By assigning each number its own box and straighten out all
tilted numbers
The standard should always be the BEST way of doing things…not just better.

35 35
5S Exercise
Now, try again – count 1 – 30 (20 seconds) – is it easier?
5 4
16
14 13
9 8
23
27
22
28 29
1
24
20 19 18 17
12
10
11
21 25
7
15
30
36 36
5S Exercise
Try this…..in 5 seconds, can you tell what is missing?
5 4
16
14 13
9 8
23
27
22
28 29
1
20 19 18 17
12
10
11
21 25
15
30
Good visuals make it easy to find abnormalities!

37 37
5S Exercise – Do It Yourself
A neat, organized office or work environment setup:
Has higher productivity due to less inventory and shorter cycle times
Lose less information/produce less defects
Is a more convenient environment to work in
Is a less stressful environment to work in
Can be quickly rearranged for new products
Easy to detect what is missing
Is easier to sustain the process

38 38
Root Cause Analysis – 5 Why’s
Goal: Get to the ROOT Cause /Vital Few Factors
Other Ideas – for Technology
- Review Best Practices
- Consult experts
- Ask: What has worked? Why?
- Ask: Who is the expert?
- Google your problem!
5 Why’s/Fault Tree Analysis
Establish Cause/Effect Relationship Hypothesis
Level of problem Resolution at the level
Project implementation delays Move to a later release
Because testing took too long Less test passes
Because coding took too long Less code reviews/check points
Because there are requirement
changes
- File Project Change Request
- Pause / Start projects
Because customers are facing
new market demands/regulations
Use an Agile/Prototyping approach
to software development
Why?
Why?
Why?
Why?
39 39
How do I choose which Tool to use?
Success lies in understanding:
1. the end user
2. the root cause
3. the fix
4. how to control the fix
5. how to communicate
… Limit the use of tools to a sensible amount
… Do not use confusing tools like pie charts with many sections
…. Focus on simple

40 40
Tools to Avoid
Avoid Use Instead

41 41
Measure
Define
Houston, we
have a problem
Measure
How bad is it?
Analyze
Find the
Root Cause
Improve
Fix it- Eliminate
Root Cause
Control
Make it
stay fixed

42 42
Define
Houston, we
have a problem
Measure
How bad is it?
Analyze
Find the
Root Cause
Improve
Fix it- Eliminate
Root Cause
Control
Make it
stay fixed
COPQ
Data
Collection
Plan
MSA Measureme
nt System
Analysis
Data
Collection
Stratification
for Focus Stability Capability
o Cost Benefit Analysis
o Sigma Value o Proportion
Defective, PPM
o DPMO, DPO, DPU
o Final Yield o First Pass
Yield o Rolled
Throughput Yield
o Time Series Plot
o Control Charts
o Graphical Tools: Pareto Chart, Dotplot, Histogram, Boxplot, Bar Chart
o Statistical Tools: Mean, Median, Mode, Range, Standard Deviation, Count, Proportion
o Data Collection Plan
o Cause Checksheet
o Traveler Checksheet
o Survey o Spreadsheets
o Measurement System Analysis
o Gage R&R
o Discrete/Continuous Data
o Operational Definition
o Stratification Factors/4 Ws
o CTQ-Tree o High-Level
Process Map (Internal View)
o Sampling Strategy
o Sample Size
Measure Phase Templates

43 43
Creating Meaningful Metrics
Data Collection Guidelines
• Data collection must be carefully planned and organized
• Data should seek factual answers to questions
• The amount of data might be constrained by time, resources, or budget
• The data generated is only as good as the system used to collect it

44 44
Creating Meaningful Metrics
Step 1
What is the bottom-line? What is critical to our customer (internal and/or external)?
Where do I start?
A good place to start is your project charter! Even without the charter, you will at
least need to complete your problem statement and objective
Example
A
B
C
D
A. Problem Statement – What were your
customer’s problems?
B. Opportunity Statement – What were
some things the customer thought that
we could improve on?
C. Goal Statement – What was the goal
this project is trying to achieve?
D. Baseline Metrics – What were the initial
sets of metrics / measures the project
team had? How many of them do we
want to continue to monitor in the long
run?
45 45
Creating Meaningful Metrics
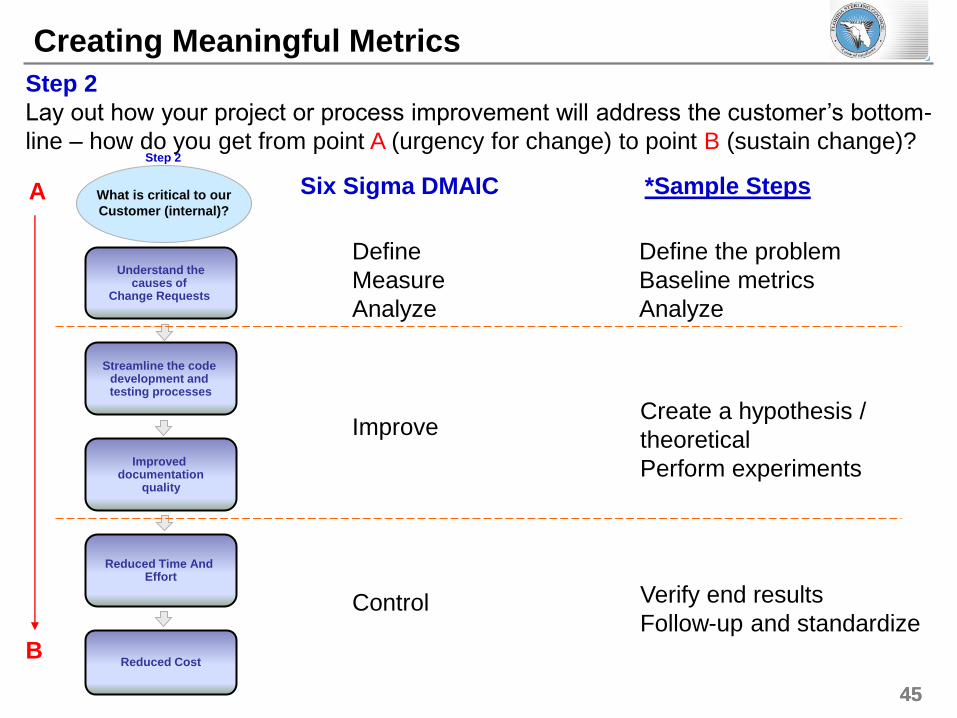
Step 2
Lay out how your project or process improvement will address the customer’s bottom-
line – how do you get from point A (urgency for change) to point B (sustain change)?
What is critical to our
Customer (internal)?
Improved documentation
quality
Reduced Time And Effort
Reduced Cost
Streamline the code development and testing processes
Understand the causes of
Change Requests
Define
Measure
Analyze
Improve
Control
Six Sigma DMAIC *Sample Steps
Define the problem
Baseline metrics
Analyze
Create a hypothesis /
theoretical
Perform experiments
Verify end results
Follow-up and standardize
A
B
Step 2

46 46
Creating Meaningful Metrics
Step 3
Derive customer-critical metrics by asking how you can measure improvements from
your project strategies / approach
What is critical to our
Customer (internal)?
Improved documentation
quality
Reduced Time And Effort
Reduced Cost
Streamline the code development and testing processes
Understand the causes of
Change Requests
Example What metrics should be
measured and
Monitored?
Number of change
request / Month
Average
Change Request
cycle time
Percentage of
Change Request
Rejects
Average effort needed /
Change Request Creation
(end-to-end)
Cost /
Change Request
What metric do I need to analyze the root cause of high
volume of change requests
Number of change requests per month, stratified by
“reason code”, “development group”, “test pass”
What metric do I need to measure improvements once the
code development and testing process are streamlined and
non-value-added activities eliminated?
How fast a change request is resolved in average –
average end-to-end change request cycle time
Inaccurate change requests prolong cycle time. What metric
do I need to measure the quality / accuracy of submitted
change requests?
Percentage of incomplete / inaccurate change
requests rejected
Step 2 Step 3

47 47
Creating Meaningful Metrics
Step 4
Lay out the different pieces of data that will make up your metrics and identify the data
source
What is critical to our
Customer (internal)?
Improved documentation
quality
Reduced Time And Effort
Reduced Cost
Streamline the code development and testing processes
Understand the causes of
Change Requests
What metrics should be
measured and
Monitored?
Number of change
request / Month
Average
Change Request
cycle time
Percentage of
Change Request
Rejects
Average effort needed /
Change Request Creation
(end-to-end)
Cost /
Change Request
• Data source
• Start / End points
• Number of change quests / release
• Change request reason code
What data make up these
metrics? What is the
source?
• Data source
• Promotion Start / End points (As-Is & To-Be)
• End-to-end code promotion cycle time per release
• Data source
• Number of change requests rejects / release
• Reason code (if any, e.g. incomplete documentation)
• Data source
• Hours – Developer x Developer Count
• Hours – Development Manager
• Hours – Release Test Manager
• Hours – Testing Support Group
• Data source
• Operating Cost / Change Request
• Rate – Developer
• Rate- Development Manager
• Rate – Release Test Manager
• Rate – Testing Support Group
Defining the source of your data and
when/where you start and end measuring
is very critical to having understandable and
accurate metrics
One metric’s data piece could feed into
another. Example: A combination of effort
and rate data can be used to calculate the
overall cost:
Developer Hours x Rate + Dev. Mgr Hours x Rate +
RT Mgr Hours x Rate + TSG Hours x Rate +
Operating Cost per Change Request = Cost / CR
Tip 1
Tip 2
Step 2 Step 3 Step 4
48 48
Creating Meaningful Metrics
Step 5
Write the operational definition – a clear and unambiguous description of what to
measure, how to measure, and how you want to “slice and dice” the data (stratification)
What metrics should be
measured and
Monitored?
Number of change
request / Month
Average
Change Request
cycle time
Percentage of
Change Request
Rejects
Average effort needed /
Change Request Creation
(end-to-end)
Cost /
Change Request
Operational Definition
End-to-end average cycle time from the receipt of change request (code promotion) to completion of request per release
(Number of change request rejects per release / Total number of change requests per release) x 100%
Accumulated hours of time charged by defined stakeholders during the defined start/end points (refer to “Change Request cycle time” metric)
Accumulated hours of time charged by stakeholders multiplied by stakeholders’ rates during the defined start/end points (refer to “Change Request cycle time” metric) per release or per year plus overall operating cost
Number of change requests (for code promotion) filed after Dev. before going into Testing per month – stratification by “reason code”, “development”, and “test pass”
Stratification Factors
Factor Example
What • Type of complaint
• Type of defect
• Reason for submitting a request
When • Date: year, month, week, day
• Time of the day
• Start/end points
Where • Country, region, city
• Workplace, computer, machine
• Location of the defect on the product
Who
• Line of business
• Group
• Individual
• Who signed off on this?
Example 1
Example 2
Step 3
• Data source
• Start / End points
• Number of change quests / release
• Change request reason code
What data make up these
metrics? What is the
source?
• Data source
• Promotion Start / End points (As-Is & To-Be)
• End-to-end code promotion cycle time per release
• Data source
• Number of change requests rejects / release
• Reason code (if any, e.g. incomplete documentation)
• Data source
• Hours – Developer x Developer Count
• Hours – Development Manager
• Hours – Release Test Manager
• Hours – Testing Support Group
• Data source
• Operating Cost / Change Request
• Rate – Developer
• Rate- Development Manager
• Rate – Release Test Manager
• Rate – Testing Support Group
Step 4 Step 5
49 49
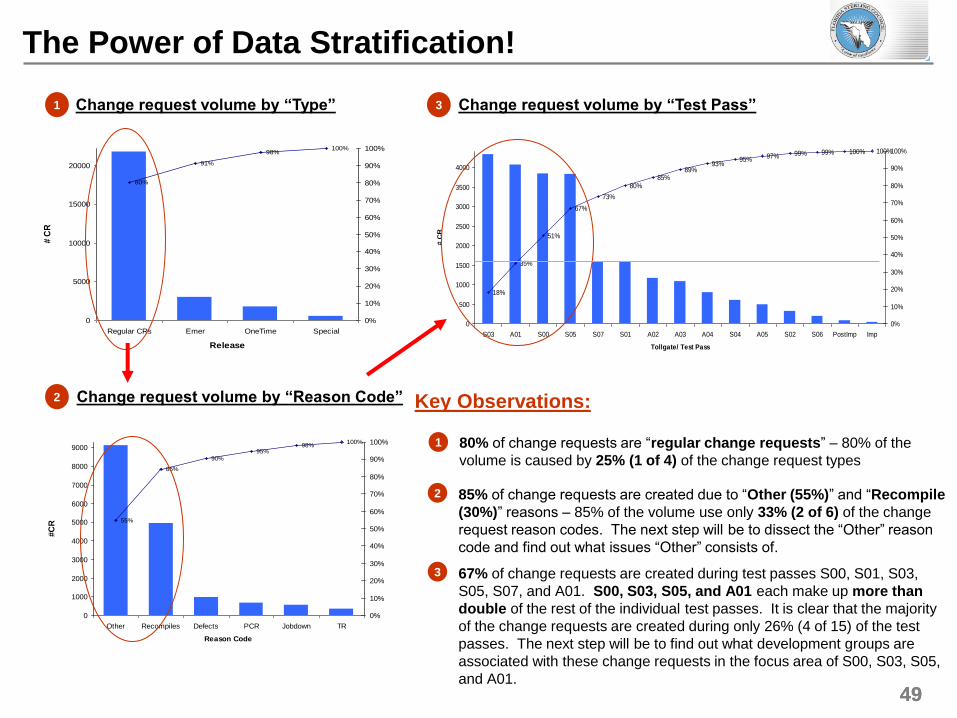
The Power of Data Stratification!
55%
85%
90%
95%98%
100%
0
1000
2000
3000
4000
5000
6000
7000
8000
9000
Other Recompiles Defects PCR Jobdown TR
Reason Code
#C
R
0%
10%
20%
30%
40%
50%
60%
70%
80%
90%
100%
80%
91%
98%100%
0
5000
10000
15000
20000
Regular CRs Emer OneTime Special
Release
# C
R
0%
10%
20%
30%
40%
50%
60%
70%
80%
90%
100%
18%
35%
51%
67%
73%
80%85%
89%93%
95% 97% 99% 99% 100% 100%
0
500
1000
1500
2000
2500
3000
3500
4000
S03 A01 S00 S05 S07 S01 A02 A03 A04 S04 A05 S02 S06 PostImp Imp
Tollgate/ Test Pass
# C
R
0%
10%
20%
30%
40%
50%
60%
70%
80%
90%
100%
1 Change request volume by “Type”
2 Change request volume by “Reason Code”
3 Change request volume by “Test Pass”
1
Key Observations:
80% of change requests are “regular change requests” – 80% of the
volume is caused by 25% (1 of 4) of the change request types
2 85% of change requests are created due to “Other (55%)” and “Recompile
(30%)” reasons – 85% of the volume use only 33% (2 of 6) of the change
request reason codes. The next step will be to dissect the “Other” reason
code and find out what issues “Other” consists of.
3 67% of change requests are created during test passes S00, S01, S03,
S05, S07, and A01. S00, S03, S05, and A01 each make up more than
double of the rest of the individual test passes. It is clear that the majority
of the change requests are created during only 26% (4 of 15) of the test
passes. The next step will be to find out what development groups are
associated with these change requests in the focus area of S00, S03, S05,
and A01.
Verified Root Causes With Data Analysis
50 50
Creating Meaningful Metrics
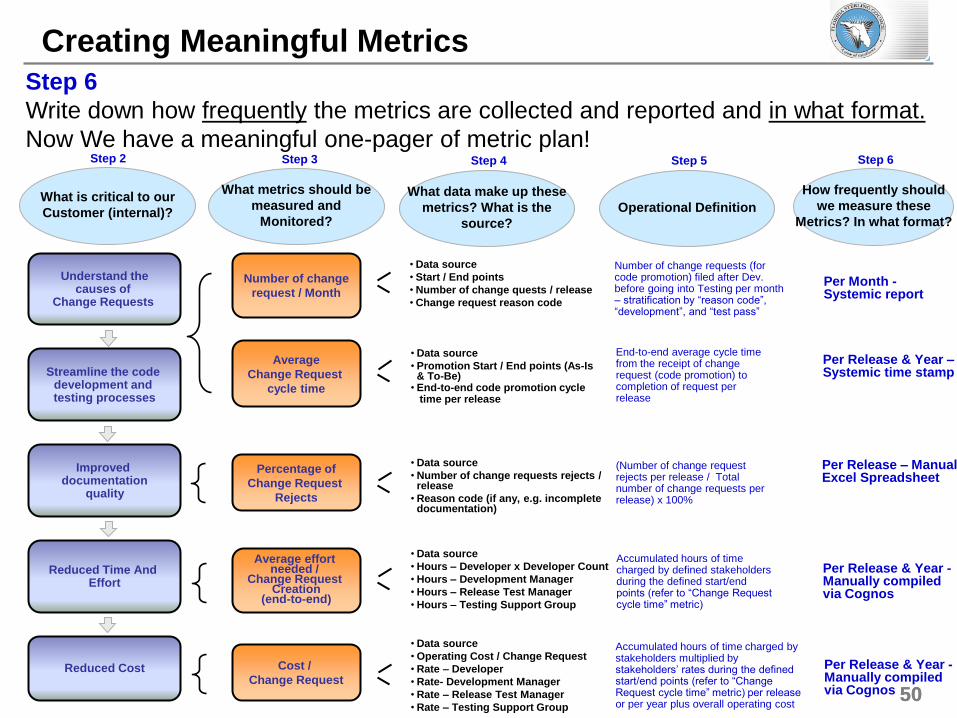
Step 6
Write down how frequently the metrics are collected and reported and in what format.
Now We have a meaningful one-pager of metric plan!
What is critical to our
Customer (internal)?
Improved documentation
quality
Reduced Time And Effort
Reduced Cost
Streamline the code development and testing processes
Understand the causes of
Change Requests
What metrics should be
measured and
Monitored?
Number of change
request / Month
Average
Change Request
cycle time
Percentage of
Change Request
Rejects
Average effort needed /
Change Request Creation
(end-to-end)
Cost /
Change Request
Operational Definition
End-to-end average cycle time from the receipt of change request (code promotion) to completion of request per release
(Number of change request rejects per release / Total number of change requests per release) x 100%
Accumulated hours of time charged by defined stakeholders during the defined start/end points (refer to “Change Request cycle time” metric)
Accumulated hours of time charged by stakeholders multiplied by stakeholders’ rates during the defined start/end points (refer to “Change Request cycle time” metric) per release or per year plus overall operating cost
Number of change requests (for code promotion) filed after Dev. before going into Testing per month – stratification by “reason code”, “development”, and “test pass”
• Data source
• Start / End points
• Number of change quests / release
• Change request reason code
What data make up these
metrics? What is the
source?
• Data source
• Promotion Start / End points (As-Is & To-Be)
• End-to-end code promotion cycle time per release
• Data source
• Number of change requests rejects / release
• Reason code (if any, e.g. incomplete documentation)
• Data source
• Hours – Developer x Developer Count
• Hours – Development Manager
• Hours – Release Test Manager
• Hours – Testing Support Group
• Data source
• Operating Cost / Change Request
• Rate – Developer
• Rate- Development Manager
• Rate – Release Test Manager
• Rate – Testing Support Group
How frequently should
we measure these
Metrics? In what format?
Per Month - Systemic report
Per Release & Year – Systemic time stamp
Per Release – Manual Excel Spreadsheet
Per Release & Year - Manually compiled via Cognos
Per Release & Year - Manually compiled via Cognos
Step 2 Step 3 Step 4 Step 5 Step 6

51 51
4
5
6
7
8
9
10
11
12
Jan Feb Mar Apr May Jun Jul Aug Sep Oct Nov Dec Jan
0
1
2
3
4
5
6
7
8
9
Jan Feb Mar Apr May Jun Jul Aug Sep Oct Nov Dec Jan
1000
2000
3000
4000
5000
6000
7000
8000
Jan Feb Mar Apr May Jun Jul Aug Sep Oct Nov Dec Jan
10%
12%
14%
16%
18%
20%
22%
24%
26%
28%
Jan Feb Mar Apr May Jun Jul Aug Sep Oct Nov Dec Jan
Meaningful Metrics In the Long Run – A Dashboard Current Performance Assessment Historical Performance Trend
Target Last (12/05/09)
Current (01/06/10)
Current vs. Last
Current vs. Target
A Volume (Unit: CR)
Cycle time (Unit: Day)
CR rejects %
Avg. resource/CR
(Unit: Hours)
B
C
D
2,500
1
15%
5
3,800
2,900
23.7%
2 1 50% Meets
19% 12% 37% 20%
9.5 7 26.3%
E Avg. cost/CR (Unit: $)
28.5%
13.8%
$800 N/A
N/A
N/A
N/A
1. Performance to Last Assessment & Target
2. Key Observations for January 2010
A
B
C
D
E
Volume
Cycle time
CR rejects %
Avg. resource/CR
Avg. cost/CR
The change request volume as of 01/06/2010 is ↓23.7% from the assessment on 12/05/2009 because of the redesign of development peer review process. Current performance is still ↑13.8% from the target of 2,500 change requests per month.
The change request cycle time as of 01/06/2010 is ↓50% (2 → 1 day) from the assessment on 12/05/2009 because of the implementation of the new “blocking” defect management process. Current performance meets the target of 1 day.
The change rejects (resubmissions) % as of 01/06/2010 is ↓37% from the assessment on 12/05/2009 because of the automation of change request
process. Current performance exceeds the target – ↓20%
The average resource (hours spent) per change request as of 01/06/2010 is ↓26.3% from the assessment on 12/05/2009 because of the automation of change request process. Current performance is still ↑28.5% from the target.
The information for average cost per change request is not ready for compilation and analysis. The target has been set to $800/CR using the target cycle time and target resource.
A Change Request Volume by Month
Target: 2500
B Cycle Time (# Day) by Month
Target: 1 Day
C Change request rejects % by Month
Target: 15%
D Average resource / Change request by Month
Target: 5 Hours
Exceeds target by 20%!
Meets target!

52 52
There are several aspects to a Gage R&R study. Among the
most important things to consider are:
- Re-produce-ability
- Repeatability
- Accuracy
- Precision
- Bias
- Linearity
- Sample Selection
Gage R&R
53 53
Gage R&R (Reproducibility and Repeatability)
54 54
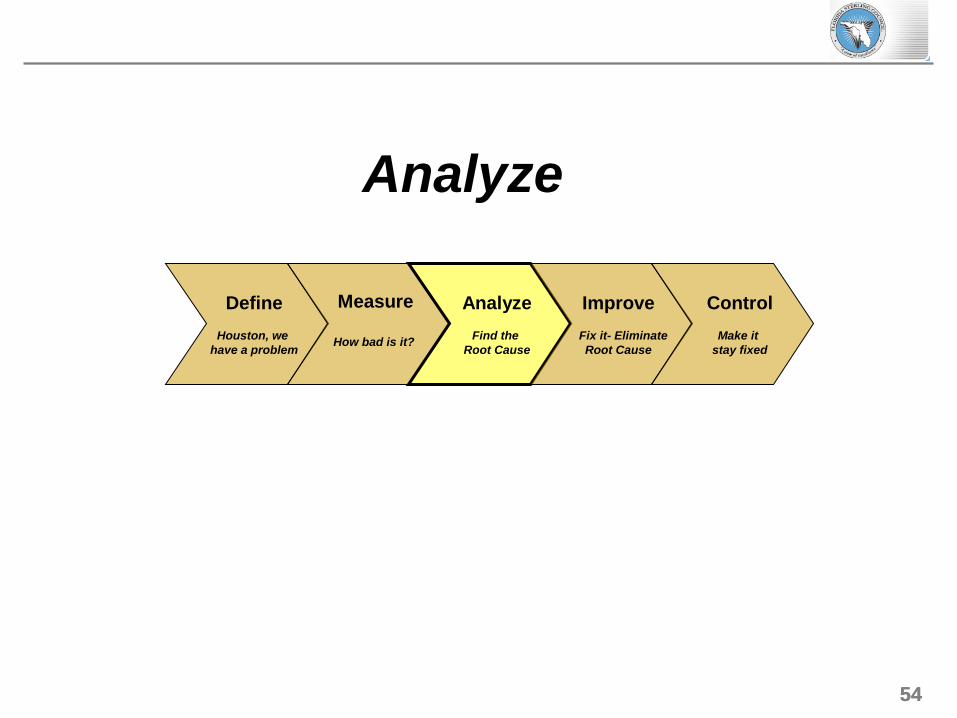
Analyze
Define
Houston, we
have a problem
Measure
How bad is it?
Analyze
Find the
Root Cause
Improve
Fix it- Eliminate
Root Cause
Control
Make it
stay fixed

55 55
Define
Houston, we
have a problem
Measure
How bad is it?
Analyze
Find the
Root Cause
Improve
Fix it- Eliminate
Root Cause
Control
Make it
stay fixed
Process
Analysis
ID Potential
Root Cause Verify Root Cause
o Stratified Graphical Tools: Pareto Chart, Dotplot, Histogram, Boxplot, Bar Chart
o Scatter plot Advanced tools: o Hypothesis tests o Correlation and Regression o DOE – Design of
Experiments
o Cause & Effect Diagram o Fishbone / Ishikawa
o Detailed Process Map o Deployment map
(handoffs) o Value Added Analysis
(Value Stream Analysis) o Time Analysis o Additional Lean tools:
Flow, Kanban (Pull)
Analyze Phase
56 56
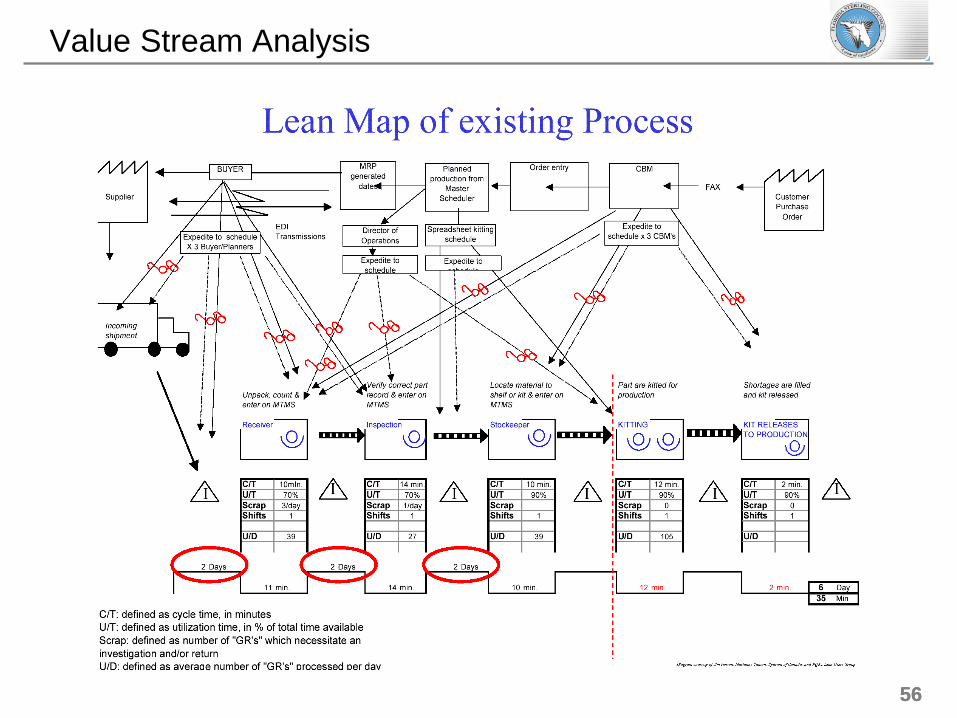
Value Stream Analysis

57 57
Ishikawa (Fishbone) Diagram – Citi Example
Project Delivery
Constraints
Process
People
Planning
Communication
b. Lack of IT initiated
communication on dev. issues
b1. Lack of JAR / JAD
b2. Lack of IT empowerment
c. Lack of early detection of dev.
Issues prior to project initiation
c1. Lack of red flag / escalation checklist
c2. Lack of tools to detect all the issues
upfront
g. Estimation
Standardization/Automation –
Lack of standardization
(heuristics?) and decision engine
increase the sizing gap variation
g1. lack of standardization /
automation /heuristics/ decision
engine
a. Project Late entry mitigation
i. Resource Planning
h. Process Adherence
j. Scope Change
e. Prior Planning Experience f. RMAC Initiation
d. Requirement Delays
f. Project Manager/List Champion
e. Development
Manager/Developers d. Business/Business Analyst
f. Release Planning &
Support
a1. Lack of all the required information
upfront to mitigate the risks
i1. Lack of visibility into available
resources from other teams
i2. Manual and time consuming activity
f1. Lack of stringent rules
for RMAC entry
f2. Lack of tools to identify
all the dependencies, cost,
benefits prior to RMAC
approvals
h1. lack of governance & process
adherence mechanisms
Source: SPI Cards IT
Delivery Constraint /
RMAC Project
58 58
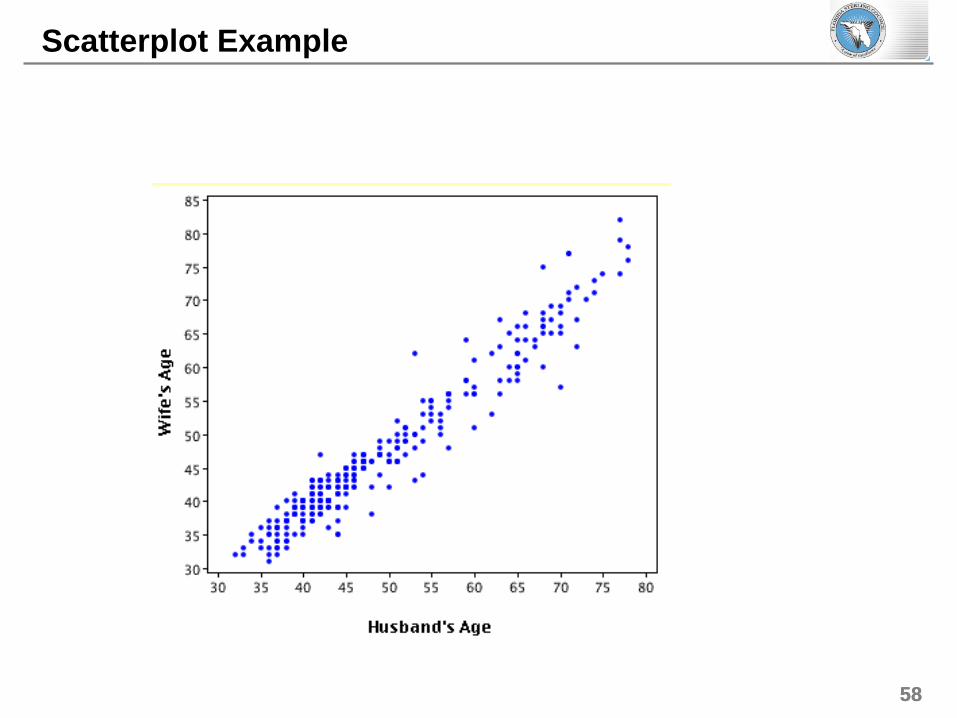
Scatterplot Example
59 59
Boxplot Example

60 60
Discrete X Continuous X
Continuous Y Discrete Y Continuous Y Discrete Y
Std Deviation Means Proportions
Test for Equal Variance Bartlett F Test Levene
ANOVA, ANOM, t-test, DoE One Way Factor Two Way Factor
Chi Square Analysis Correlation and Regression Analysis
Logistic Regression
Is there a difference in variation of flower delivery time given the weather as rain or shine?
Is there a difference in average flower delivery time in rain or shine?
Is there a difference in the proportions of flower delivery time in rain or shine?
Does it take longer to deliver flowers if the customer lives further away?
Does the distance to the customer affect correct or incorrect order delivery?
Hypothesis Testing Reference Tool

61 61
Improve
Define
Houston, we
have a problem
Measure
How bad is it?
Analyze
Find the
Root Cause
Improve
Fix it- Eliminate
Root Cause
Control
Make it
stay fixed

62 62
Define
Houston, we
have a problem
Measure
How bad is it?
Analyze
Find the
Root Cause
Improve
Fix it- Eliminate
Root Cause
Control
Make it
stay fixed
Generate & Select
Solution
Pilot & Implement
Solution Verify Improvement
o Creativity Tools o Design of Experiments o Cost Benefit Analysis o Solution Selection
Analysis o To Be Process Map
o Task Planning o FMEA Risk Analysis o Pilots o Implementation
Validation Plans
o Plan vs Actual Analysis o Before vs After Analysis
Improve Phase
63 63
Fix It

64 64
Improve – “As-IS” ”To-Be” ….Pilot the Change
Things to Remember:
Simplify and make it simple!
Supporting metrics
Access impact – up & downstream
Build consensus when resolutions are reached
Create a “To-Be” process map
“Great leaders are almost always great simplifiers, who can cut through argument,
debate, and doubt, to offer a solution everybody can understand.”
– General Colin Powell
Process improvement
Effects to upstream
teams/processes
Effects to downstream
teams/processes
Just like squeezing a balloon, improving a process always impacts either/or both upstream and
downstream – we need to know what the impact will be and plan accordingly
65 65
Pareto chart – tells us what to look for and what to be aware of
Source of continuous improvement
Verify Improvement - Adjust

66 66
Control
Define
Houston, we
have a problem
Measure
How bad is it?
Analyze
Find the
Root Cause
Improve
Fix it- Eliminate
Root Cause
Control
Make it
stay fixed

67 67
Define
Houston, we
have a problem
Measure
How bad is it?
Analyze
Find the
Root Cause
Improve
Fix it- Eliminate
Root Cause
Control
Make it
stay fixed
Control Plan Project Close Out
o Project closure checklist o Project Champion/Process
Owner sign-off o Cost/Benefit Analysis o Celebration/
Acknowledgement o Review meeting/Review
Audit after 3 months
o Control Plan o Reaction Plan o Ongoing Training Plan o Control Charts o Communication Plan
Control Phase Template

68 68
21
32
15
6
4
17
0 0 00
5
10
15
20
25
30
35
IT
Success Sharing – Technology Testing
Project Sponsor: Steve A, Karen
H, Offshore Testing Team and Fred M
Participants: Project POR
Development and IT Testing
What was the problem?
How did we solve the problem?
IT Testing recognized the issue and addressed the problem with
actions
Leadership empowered IT team to make changes
Team investing time to improve the process
What was the outcome?
Key Enablers
44% of Defects reported over 3 releases, were in fact not really defects, but fell in the “User” “Duplicate” or “Non-reproducible” tester error category and determined to be not a problem (NAP).
Teams spent large effort supporting NAP defects. No code changes for NAP defects were made to fix the defects. Dev spent more time determining defects were not a problem than they were fixing true defects. Turn around time to fix true defects lagged.
Determined Root Cause Findings were Tester Errors, Flawed or defective Testing Assets and gaps in the method of handling CCDs
Established Actions: Tester Training, Test Firm Alternatives, QA of the entire Regression Test Script suite and Process Improvements.
Results: June release approaching return to the 8% level.
The established actions performed by IT Testing made measurable difference in the amount of time used to support NAP defects.
Reduction of time in analyzing the defects, defect meetings reduced from 1 - 1 ½ hours daily to ½ hour 3 days a week.
Reduced number of hours dedicated to regression defects
Increased the turn around time to fix most defects.
App User NonRep Dup Req Env Int Known
June 2010 Release
App User NonRep Dup Req Env Int Known
April 2010 Release
Before
After
38
7
32
1
10
3
6
00
5
10
15
20
25
30
35
40

69 69
The line in the middle of the bell shaped curve is the mean (µ), each consecutive line either to
the right or left is one standard deviation or sigma distance from the mean.
Statistically,
• 68.26% of all the values fall within one sigma to the right and one to the left of the mean.
• If we move one more sigma value to the right and left of the mean this total area would
cover 95.46% of the expected values
• furthermore another sigma in either direction would comprise 99.73% of all expected values.
Applying Standard Deviation in a Process

70 70
Having a DPMO of 3.4 defects per million opportunities means you are six sigmas
(standard deviations) from the average output/measures of your process. This is
almost perfection and is what the Six Sigma Methodology in Process Improvement
strives for.
Changing your culture to think in terms of performing to a six sigma level would
lead to a significant improvement in profits and product or service quality.
How Close is Your Process to ‘Six Sigma’ Quality?
DPMO Sigma Value
500,000 <1.5
460,000 1.6
421,000 1.7
382,000 1.8
345,000 1.9
309,000 2.0
242,000 2.2
184,000 2.4
136,000 2.6
96,800 2.8
66,800 3.0
44,000 3.2
28,700 3.4
DPMO Sigma Value
17,900 3.6
10,700 3.8
6,210 4.0
3,470 4.2
1,870 4.4
968 4.6
483 4.8
233 5.0
108 5.2
48 5.4
21 5.6
8 5.8
3.4 6

71 71
Because at 99% accuracy (4 Sigmas), there are still:
Why is Six Sigma Accuracy Important?
• 2 short or long landings at major airports each day
• 5,000 incorrect surgical procedures every week
• At least 200,000 wrong drug prescriptions each year
• 20,000 lost articles of mail per hour
And even at a perceived high accuracy of 99.9%, there
are still:
• 1.2 million Citi account statements with errors each
year
• 3.9 million Citi cards point-of-sale interaction errors
each year
• 500,000 Citi Bank checks processed incorrectly each
year
• 300,000 Citi ATM transaction errors each year

72 72
DMAIC Summary Chart
Project Phase Phase Goals Activities Tools
Getting
Started
• Lean training and knowledge
sharing
• Project expectations meeting
with sponsor
• Sponsor buy-in
• Start a data collection plan
• Identify data resources
• GMT meeting (if applicable)
4-hour Lean training presentation
Project Charter / Team List
Define
• Identify the problems that need to
be fixed
• Plan the project
• Define business problem,
objective, goals, scope,
resources, risks, sponsors
Project charter Pareto chart*
Project plan Control chart*
SIPOC
High-level As-Is process map
Measure
• Measure current process
performance
• Focus on areas where most
errors take place
• Ensure there are appropriate
operational definitions for
metrics
• Ensure data is communicated
with appropriate charts
Measuring process capability
Charting – Dot plots, histograms,
control charts, et al.
Discrete data
Continuous data
Analysis
• Determine why problems are
occurring
• Prevent jumping to premature
solutions
• Brainstorming root cause
• Brainstorming multiple
solutions
• Analyze solution efforts vs.
impact
Pareto chart (brainstorming, drill-down,
etc.)
Value Stream Mapping/analysis
Root cause analysis (e.g. fishbone
diagram, 5 Why’s)
Effort/impact analysis
Improve
• Identify best improvement(s)
• Pilot improvement(s)
• Verify pilot
• Implement improvement(s)
• Select the best solution
• Create a To-Be process
• Pilot the solution
• Plan/implement the solution
• Post-implementation
presentation
To-Be process map(s)
Pilot plan
Control charts
Implementation plan
Cost-benefit analysis
Control
• Assure long term process control
• Transfer full process
responsibility back to owner
• Project closure
• Celebration / acknowledgement
• Project closure tasks are
assigned
• Follow-up meeting scheduled
Control plan – including metric tracking
Contingency plan
Training plan
Communication plan
Control charts *High-level information only

73 73
Do It Yourself

74 74
7 Forms of Waste
1. Waiting - (doctor’s office, cooking, laundry, …)
2. Motion - (cooking, clean-up, route through house, getting dressed,… )
3. Under-utilizing people – (children, spouses, .. Pets? ...)
4. Transportation – (route to pick up / drop off kids, weekend to do’s, ...)
5. Overproduction – (too much dinner, too much spending, too much doing, ...)
6. Inventory – (spoiled food, clutter, priorities, … )
7. Defects – (should-haves, accidents, cannot-finds, nobody / somebody, …)

75 75
1962, Taiichi Ohno studied the Ford Production System and combined
Toyoda’s vision and invented the ‘Toyota Production System’ that was
adopted throughout the company. Ohno calls the TPS never ending and
explains the journey of ‘absolute elimination of waste’!
Mr. Nakao spent the first 27 years of his career working for the
Toyota Group where he was mentored and trained by Mr. Ohno,
originator of the Toyota Production System (TPS). Mr. Nakao was a
part of the original autonomous study groups initiated by Ohno who
ultimately came up the basic philosophy and approach of TPS.
Kaizen History
David spent 3 years with Mr. Nakao and other consultants in
Japan/Stateside learning first-hand the ‘art’ of eliminating waste
from processes within the workplace and life. Mr. Nakao
attempted to remove the waste out of David’s golf swing
however it was a longer journey than expected!

76 76
‘Lean’ in Everyday Life – David’s Closet
Before Improvement
Tee-shirts and socks were in
drawers in bedroom. 17 feet, 4
inches from inside of closet.
After Improvement
Tee-shirts and socks were moved
to closet and put in moveable
drawers. Eliminated the daily walk
back and forth to get dressed.
17 ft. 4 inches x’s 2 = 34 ft. 8 inches per day
34 ft. 8 a day x’s 30 days = 1,040 ft. a month
1,040 ft x’s 12 month’s = 12,480 ft per year
Saved 2.3 miles per year just for seeing waste
while getting dressed in the morning!!!

77 77
5S in action

78 78
…. uses the 5S model and the 5 Whys
Before
After
79 79
Financial Planning / Expense Management
Mobile Banking
Remote Check Capture
Online Bill Payment
Expense Management

80 80
Which Email would you rather read?
Hi All,
Thanks for joining the call to review E-Keys and MIDs.
Attendees: Mary, Ken, Jeanne, Srikanth, Param, Devi, Larry V, Levi, Donna, Laura
Decisions:
• E-Key management will be owned by TS
• MID assignments will be managed and made by Frank S
• Identify Server is an option for identifying user association to LOB
Follow ups .
• Levi, Donna and Kevin will meet on Monday, May 2nd to discuss Identity Server.
• Donna in process of creating prototypes and has continued working using identity server in order to demonstrate the segmentation for the various users and groups.
• Srikanth reported that the Hub connectivity should be complete by the beginning of June
Next Steps:
• Levi to meet with Pitney on Monday to discuss Identity Server
• Levi to reach out Mahe and Larry V with outcome of meeting
• Mahe (or Larry V) to schedule follow up meeting to continue conversations with Pitney in regard to:
– Pilot approaches (setting cross reference file / e-key values)
– Aura design
– CIT design
– Reports designs for Collections and Return Mail
Some time ago, Mansoor M made the announcement that SSI would
own the Print Matrix. A short time later, Michael M asked me to
developed processes and procedures around the print matrix and how it
needs to be utilized within TS and SSI. I have to admit, although it is a
very very important task, it is also a very complex task. When I tried to
limit my focus to just the needs of TS, it became apparent very quickly
that there can be no one "owner" of the document, rather there needs to
be a single manager. A manager is responsible for ensuring that the
document is completed by the appropriate work groups and is managed
according to the requirements of the project utilizing it. The manager
does not update the document, ever.
Owner implies sole responsibility, which is not the case with the Print
Matrix. Many work groups "own" the information that must be entered
on the document, much as with the Cards BRD document. As with the
BRD, the document must be complete and accurate prior to resulting
workgroups developing their designs and code. As with the BRD, each
work group has a designated sponsor who is responsible for updating
the document and ensuring its accuracy.
Currently, there is no set workflow, manager or sponsor for the print
matrix. SSI, MMS, and Cards IT have all tried to assume control of the
document and have managed to circumvent the idea of single site
management. We all agree this isn't working. We need a central
management point and sufficient controls to support the project flow
and accuracy of our artefacts.
To reach this 'utopian state', I see we need to take several definitive
steps:
…more ….
A B

81 81
Living Lean - Video

82 82
Living Lean - Video

83 83
Bottom Line
“ Don’t wait for a Lean or Kaizen event
to practice Lean …”
… Live Lean .. use your skills and these tools in
your every day activities.

84 84
Questions

85 85
http://www.youtube.com/watch?v=mmoqjfigKc8
Spaghetti mapping
http://www.youtube.com/watch?v=9ll01UNrbR4
http://www.youtube.com/watch?v=LNtEW4DVRkE
ESigma – Toni and Ruth
http://www.youtube.com/watch?v=JHdqUZc8Ya4&NR=1
Ultrasound – General General
http://www.youtube.com/watch?v=sKyC45bwfnk
Systems Thinking