ise 730 flash enabled hybrid storage array, 60,000 iops @ full capacity
TRANSCRIPT

XIO Storage
October 2011
Hyper ISE 730
Performance Review December 2013

2 Hyper ISE 730 Performance Review
Table of Contents
Executive Summary ...................................................................................................... 3
Testing Environment Summary ................................................................................... 4
Testing Methodology ................................................................................................................................. 4
Physical Equipment ................................................................................................................................... 5
Software .................................................................................................................................................... 5
Performance Analysis ................................................................................................... 6
Summary ...................................................................................................................... 12
Contact X-IO technologies ...................................................................................................................... 12
Appendix A – Informational Links ............................................................................. 13
Appendix B – ISE Controller Sparkline Performance Report .................................. 14
Appendix C – Iometer workload profiles ................................................................... 15
Log File Iometer Profile ........................................................................................................................... 15
Database Table Scan Iometer Profile ..................................................................................................... 15
On Line Transaction Processing Iometer Profile .................................................................................... 16
Index File Iometer Profile ........................................................................................................................ 16
Temp Database Iometer Profile .............................................................................................................. 17
Database Reporting Iometer Profile ........................................................................................................ 17

3 Hyper ISE 730 Performance Review
Executive Summary
Evaluating performance of storage systems can be a complicated and difficult process. Workloads can
vary widely from one environment to another, making “standardized” tests meaningless when real-world
workloads must be accommodated. Performing simple random/sequential, read/write workloads are not
enough to emulate the performance demands of real-world environments. Thus, X-IO has developed
methods to simulate real, observed customer workloads for the purpose of performance testing. This
paper will detail one of the many tests that are performed at the X-IO world headquarters in Colorado
Springs, Colorado, U.S.A. This test is one of a series of ongoing performance tests designed to evaluate
new firmware versions for the Intelligent Storage Element (ISE) storage array.
There are two main goals of this test:
1) Mimic 6 different, mixed, multitenant workloads that are commonly observed in environments where ISE systems are deployed
2) Show how ISE technology typically excels at servicing these workloads, even as the capacity utilization exceeds 90%. Additionally, this paper will describe the various software packages that are
available for analyzing performance of ISE systems. This testing report will also show that the X-IO Hyper ISE™ 7-Series is the ideal combination of solid state drive (SSD) and hard disk drive (HDD) technologies for dynamic, high performance environments.

4 Hyper ISE 730 Performance Review
Testing Environment Summary
This test is designed to emulate the most challenging workloads that X-IO customers have in their
environments. While this not an exhaustive list, it represents the some of the workloads that are the most
challenging from a performance perspective. These are:
1) Database Reporting - Main database for reporting services to store metadata and other object definitions. This workload is characterized by a sequential, read intensive workload.
2) Online Transaction Processing (OLTP) - Databases must often allow the real-time processing of SQL transactions to support e-commerce and other time-critical applications. This workload is characterized by a very random, small block, read intensive workload.
3) Temporary Database files (TempDB) - This is a temporary database used to store temporary, tables, cursors, indexes, variables and more. This is typically a very active and high intensity, mostly read, random workload.
4) Database Index - An index is a database feature used for locating data quickly within a table. Indexes are defined by selecting a set of commonly searched attribute(s) on a table and using the appropriate platform-specific mechanism to create an index. This workload is represented by a relatively small capacity, highly random, mostly read workload.
5) Database Table Scans - A table scan is the reading of every row in a table and is caused by queries that don’t properly use indexes. This workload is a sequential, larger block, high-throughput read workload
6) Database Log Files - All databases have logs associated with them. These logs keep records of database changes. If a database needs to be restored to a point beyond the last full, offline backup, logs are required to roll the data forward to the point of failure. This workload is represented by small block sequential writes.
Testing Methodology Each one of the above workloads by itself can be a challenge for any storage system, but to show the
ability of the ISE to adapt to different performance requirements all of these tests are performed
simultaneously. This testing method shows the flexibility of the ISE’s powerful caching algorithms and
Continuous Adaptive Data Placement (CADP) algorithm for migrating data between SSD and HDD
devices. Iometer was used as the load program, and specific workload profiles were created for each of
the above workloads to be simulated. The ISE under test was configured with eight (8) LUNs presented
to a Microsoft® Windows 2008 Server, and these Iometer workloads were executed across all of the
LUNs concurrently. Each of the different workloads was offset to run on a separate portion of the ISE
LUN, and the X-IO Storage Hot Spot Analyzer will show the different patterns of each workload.

5 Hyper ISE 730 Performance Review
Physical Equipment
1) Server Configuration – The system under test was an Intel® based Server with two (2) Intel E5620 Processors and 48GB of RAM. The operating system (OS) was Microsoft Windows Server 2008 R2
2) ISE Configuration – The ISE under test was a Hyper ISE 730. This system has two sealed disk canisters called DataPacs. The two DataPacs provide the Hyper ISE 730 ten (10) 200GB SSD devices, and thirty (30) 900GB 10K RPM SAS drives. Eight (8) Raid1 protected LUNs were created from the ISE and were approximately 1TB in size each for this test, with another 1TB Raid1 LUN that was used for storing setup files and test results. This yielded a total presented capacity of 9TB which is 92% of the available capacity of the Hyper ISE 730 storage system.
3) WattsUp Pro power meter – As part of the testing, power readings were recorded with a WattsUp Pro power meter connected in-line to the power of the ISE. This allows for detailed power readings to be recorded during the testing run.
Software
1) Iometer v 2006.07.27 – Iometer was used as the program to simulate the different workloads for the test. See Appendix C for Iometer configuration profiles.
2) X-IO Performance Adapter for Windows Performance Monitor (Perfmon) – This Perfmon adapter is a customer available application that leverages the representational state transfer (ReST) communication capabilities of the ISE to populate ISE performance information into the Microsoft Windows Performance Monitor application (MS Perfmon). The Perfmon adapter application was used to enable recording of performance data from the ISE during the testing run, and allowed for detailed analysis of ISE performance metrics.
NOTE: For this test, several, service-only, advanced options were enabled that X-IO uses to monitor ISE internal counters.
3) X-IO Storage Hot Spot Analyzer (SHA) - The SHA tool is an application that uses the ISE’s ReSTful web services interface to record the CADP data movement. This, in turn, displays the data movement between the HDD and SSD media within the two ISE Datapacs. The SHA tool can also capture and display the server-side data transaction process by using a similar ReSTful web services application and third-party agent that runs on the server to observe the same data IO activity from the server’s point-of-view. In this way, both sides of the data transaction can be analyzed on the fly or captured for analysis at a later time. The SHA tool is an engineering only tool that is used to better understand the efficiency and power of CADP.

6 Hyper ISE 730 Performance Review
Performance Analysis
The SHA tool is capable of viewing the block activity from the server’s point of view that the Iometer
workloads are producing. The figure 1 shows the activity of the data blocks on the volume over time, with
increasing activity levels changing color from yellow to red. This activity pattern was also performed on
the other seven (7) ISE volumes as well.
Figure 1
Figure 1 shows the workload as the server sees it and demonstrates several interesting patterns:
1) The OLTP workload has relatively random access across a broad range of the disks. 2) TempDB operations generally have a limited range that they work over, but this comes with high
activity over that range. 3) Table Scan operations tend to be sequential read operations over a small area of the data. 4) Log file activity is sequential write in nature, with each successive log file being written to in a
serial fashion. The activity of the Logs can be directly related to the write activity of the Database, so high performance for these files is crucial.
5) Indexing operations tend to be mostly read, with some write activity when the indexes are updated. The area that is involved in most indexing functions is limited in size, meaning that this activity will be over a small area of the LUN.
6) Report Generation activities are generally sequential in nature, with mostly read activity. This activity is usually restricted to a small amount of the storage space.
While the view from the hosts can yield valuable information about the workload, seeing the same data
from the ISE shows how the system is servicing this workload.
7 Hyper ISE 730 Performance Review
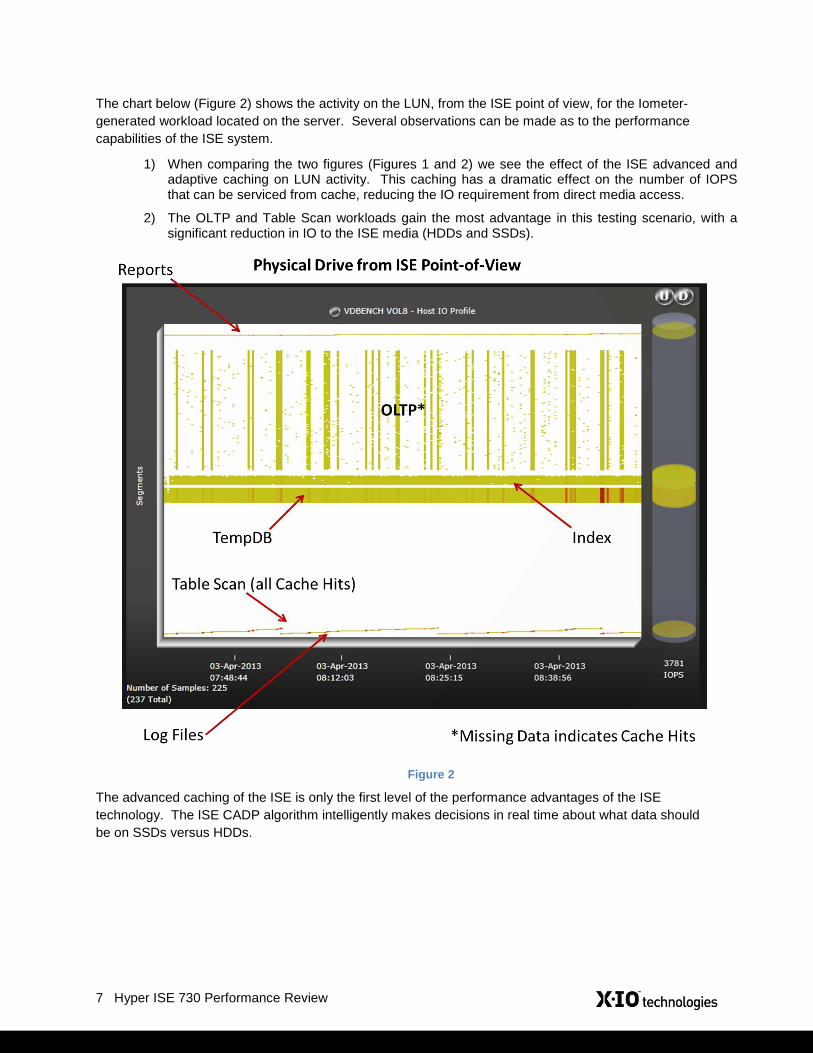
The chart below (Figure 2) shows the activity on the LUN, from the ISE point of view, for the Iometer-
generated workload located on the server. Several observations can be made as to the performance
capabilities of the ISE system.
1) When comparing the two figures (Figures 1 and 2) we see the effect of the ISE advanced and adaptive caching on LUN activity. This caching has a dramatic effect on the number of IOPS that can be serviced from cache, reducing the IO requirement from direct media access.
2) The OLTP and Table Scan workloads gain the most advantage in this testing scenario, with a significant reduction in IO to the ISE media (HDDs and SSDs).
Figure 2
The advanced caching of the ISE is only the first level of the performance advantages of the ISE
technology. The ISE CADP algorithm intelligently makes decisions in real time about what data should
be on SSDs versus HDDs.

8 Hyper ISE 730 Performance Review
CADP continuously monitors the activity of the blocks on the ISE, and makes decisions about which
blocks of workloads would be better served by SSDs. This functionality requires no tuning from the
administrator, and is a completely automatic process. The SHA graphic below (Figure 3) shows the
different activity levels of the HDDs and SSDs within the Hyper ISE 730. The activity level of the SSDs
(on the right) can be seen to be increasing as time is progressing and more of the “hot blocks” are
migrated to SSD. Since the block is being physically moved to the SSDs, read and write activity is being
serviced by the SSDs. This provides a tremendous advantage over solutions that simply utilize the SSDs
for reads, while writes have to be flushed to disk (and subsequently run at HDD speeds).
Figure 3

9 Hyper ISE 730 Performance Review
The activity level of the individual HDD and SSD components of the Hyper ISE 730 can also be monitored
so as to view the effect of CADP on the SSD and HDD activity levels. The graph below (Figure 4) shows
the total IOPS of every physical media device in the ISE (both HDD and SSD) plotted on the same graph.
The effect of CADP can be seen at the beginning of the test run as hot data is automatically migrated to
the SSD devices, with the SSDs servicing more than 4,000 IOPS (each) over the course of the test. Also
of note, the Hyper ISE 730 is able to produce HDD access speeds between 300 and 500 IOPS per HDD.
Figure 4
HDD performance in any hybrid solution offering is of critical importance, as any data that does not fit the
SSD benefit model will have to be serviced by the HDDs. This is where using enterprise grade HDDs is
paramount. Hybrid arrays are being placed in environments that have performance requirements that
would have been considered “Super Computing” just a few years ago, and performance of the data that
“lives” on the HDDs must perform as fast as possible (and be reliable). Several hybrid array vendors
utilize “enterprise” Serial-ATA (SATA) or “Neal-Line SAS” disk technology as the secondary storage
medium. These devices have a fraction of the performance that Enterprise grade serial-attached SCSI
(SAS) HDDs do, and are an order of magnitude less reliable. Furthermore, these “Near-Line” SATA and
SAS disks are not designed for the high performance demands that they will encounter, which further
reduce their reliability. The Hyper ISE 7-Series storage arrays utilize enterprise SAS HDDs for this
reason: high performance for the data that is not serviced by SSD and high reliability levels at this
workload.

10 Hyper ISE 730 Performance Review
The graph below (Figure 5) shows the total IOPS performance of the Hyper ISE 730 during the testing
run. The test initially began with the ISE performing just above 40,000 IOPS, then increases by 50% to a
sustained performance level of 60,000 IOPS.
Figure 5
Another benefit of SSD, beyond high performance, is low latency. The graph below (Figure 6) shows the
read latency values from the ISE during the test. At the beginning of the test run (when all of the data is
on the HDDs), the latency is elevated. However, as the “hot or active data” is up-tiered to SSD the read
response time falls, with the system reaching a steady state value of less than 15ms.
Figure 6
Write latency was observed to be under 10ms for the majority of the testing period. See Appendix B for
ISE Controller Performance report.

11 Hyper ISE 730 Performance Review
Data centers today consume roughly 2% of the world’s power, an amount that is expected to grow
significantly in the next three years, according to the US Environmental Protection Agency (EPA). Of that
consumption, roughly 50% is consumed by ventilation, airflow and cooling systems working to dissipate
the heat load produced by the other 50% (servers, network infrastructure and storage). According to
industry analysts, the single largest consumer of energy in the datacenter is data storage (at 27% of total
data center energy consumption). ISE systems are designed to be the most energy efficient storage
systems available. To demonstrate this, a WattsUp Pro meter was connected to the ISE to measure the
total power required during the test. The graph below (Figure 7) shows that the ISE was at a near
constant power draw of 660 watts total during the test run.
Figure 7
This is an important metric for this test, as there is the belief that all SSD solutions consume less power
than all HDD or Hybrid storage solutions. While the SSDs themselves may only take 10 watts per TB, the
entire system (e.g. All-Flash Arrays), including controller processors and fans must be taken into account,
which can drive power utilization up to 1.5KW.
Average Power: ≈ 660 Watts

12 Hyper ISE 730 Performance Review
Summary
Today’s modern applications demand an order of magnitude more performance than just a few years
ago, and storage systems have struggled to keep up. SSDs offer the promise of satisfying the
performance need, but implementations vary greatly from vendor to vendor and often with
unsubstantiated performance claims. Often these vendors perform performance tests with workloads that
are designed to show maximum performance, but have no correlation (in any way) to real applications
that are run in the Datacenter. X-IO conducts performance testing constantly in our corporate test labs in
Colorado Springs, Colorado, U.S.A. and this paper demonstrates that the Hyper ISE 7-Series storage
array can accommodate the most demanding concurrent real-world workloads. In this test, the Hyper ISE
730 achieved 60,000 IOPS with less than 20ms of Read Latency (and less than 10ms of Write Latency).
Furthermore, while the ISE was servicing this workload, it was consuming less than 700 watts of power,
proving that high levels of performance can be provided while keeping power utilization and operating
costs low. The Hyper ISE 7-Series storage arrays are designed to provide X-IO customers with the
capacity they need, the performance they require, and the reliability their businesses demand.
Contact X-IO technologies
Website: http://www.x-io.com Email: [email protected]
Get in touch with us:
http://x-io.com/contact/
or
Visit our website and chat with us to get more information
United States »
866.472.6764
International »
+1.719.388.5500

13 Hyper ISE 730 Performance Review
Appendix A – Informational Links
ISE System General Information
http://xiostorage.com/products/ise-storage/
ISE 7-Series info
http://xiostorage.com/products/hyper-ise/#specs_tab
CADP Info
http://xiostorage.com/cadp/
ISE Performance Adapter for Windows Performance Monitor
http://xiostorage.com/products/ise-software/#ise_perfmon_tab
Iometer
http://www.iometer.org
Watts Up Pro
http://www.powermeterstore.com/p1206/watts_up_pro.php?gclid=CNv1_Nndk7cCFYqk4Aodd14AVg

14 Hyper ISE 730 Performance Review
Appendix B – ISE Controller Sparkline Performance Report
Maximum 95% values 75% values 50% values (Median) Average Standard Deviation
readkbps 387,868.00 252,361.60 203,576.00 203,576.00 164,037.65 56,068.55
readiops 36,664.00 27,624.30 22,511.50 22,511.50 18,376.59 5,959.28
totaliops 77,371.00 64,514.30 59,663.00 59,663.00 55,025.27 9,172.49
writeiops 48,376.00 42,150.00 39,594.00 39,594.00 36,648.75 5,791.71
writekbps 228,594.00 197,184.60 186,714.50 186,714.50 174,197.77 26,597.21
writelatency 55.00 0.00 0.00 0.00 0.03 0.44
readlatency 108.00 61.00 22.00 22.00 21.49 14.80
queuedepth 1,582.00 3.00 2.00 2.00 3.33 24.15
avgxfrsize 33,745.00 7,071.00 6,617.75 6,617.75 6,210.74 887.82
totalkbps 560,304.00 432,494.90 382,298.25 382,298.25 338,234.74 71,578.68
ISE Controllers(3de1001j(ise-3de1001j) controllers total)

15 Hyper ISE 730 Performance Review
Appendix C – Iometer workload profiles
Log File Iometer Profile
Database Table Scan Iometer Profile

16 Hyper ISE 730 Performance Review
Online Transaction Processing Iometer Profile
Index File Iometer Profile
17 Hyper ISE 730 Performance Review
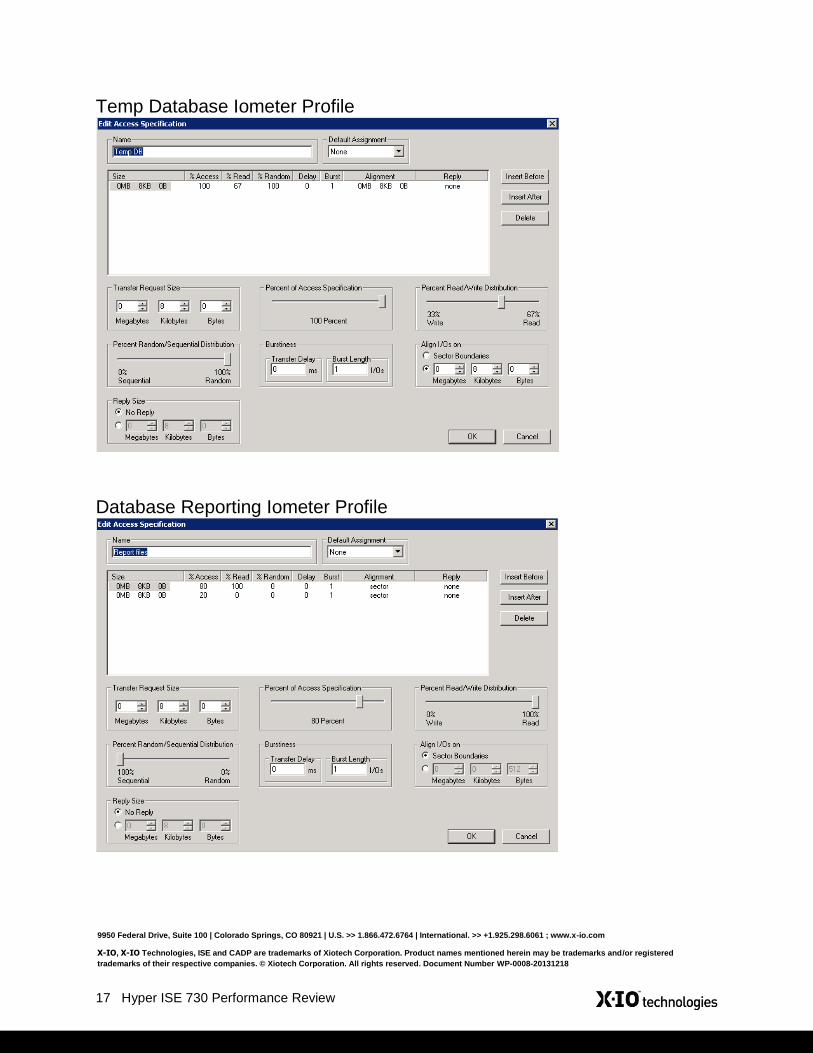
Temp Database Iometer Profile
Database Reporting Iometer Profile
9950 Federal Drive, Suite 100 | Colorado Springs, CO 80921 | U.S. >> 1.866.472.6764 | International. >> +1.925.298.6061 ; www.x-io.com
X-IO, X-IO Technologies, ISE and CADP are trademarks of Xiotech Corporation. Product names mentioned herein may be trademarks and/or registered
trademarks of their respective companies. © Xiotech Corporation. All rights reserved. Document Number WP-0008-20131218