ision ndustry pdate - harriswilliams.com advancement associates ... ‒ods are licensed...
TRANSCRIPT

VISION INDUSTRY UPDATE
March 2017
Investment banking services are provided by Harris Williams LLC and Solebury Capital LLC, registered broker-dealers and members of FINRA and SIPC, and Harris Williams & Co. Ltd, which is a private limited company incorporated under English law with its registered office at 5th Floor, 6 St. Andrew Street, London EC4A 3AE, UK, registered with the Registrar of Companies for England and Wales (registration number 7078852). Harris Williams & Co. Ltd is authorized and regulated by the Financial Conduct Authority. Harris Williams & Co. is a trade name under which Harris Williams LLC and Harris Williams & Co. Ltd conduct business.

1
Manufacturers Service Providers
Glasses / Independent
Contact Lenses Ophthalmic Lenses Optometrist Ophthalmologist
Corrective
Device
Manufacturing
Eye Exams
Medical
Eye Care
Surgical
Eye Care
Retail Sale
Corrective
Device
Notable Participants – ~23K independent providers – ~18K independent providers
– Mass retail ~54% share
– Independent ~46% share
National /
Mass Retail Market Structure
Ac
tiv
ity
– Mass retail ~32% patient share
– Independent ~68% patient share
– Highly concentrated
– Highly fragmented
Vision represents a ~$40 billion industry comprised of services and sale of corrective eye glasses and lenses with steady expected growth of ~3-4%.
Industry participants include independent opticians, optometrists, ophthalmologists, national vision retailers, mass merchandisers,and glasses / contact lens manufacturers and distributers
– Vision care providers compete based on service quality, patient loyalty, professional training, and personalization of service
– Corrective device retailers compete based on location, merchandising, price, treatment technologies / products, and ability to franchise operations
Vast majority of vision service providers also sell corrective devices; highly fragmented independent provider landscape
Several vertically integrated providers, most notably Luxottica / Essilor, participate throughout the value chain
VISION SERVICE AND PRODUCT SUPPLY CHAIN1
VISION INDUSTRY OVERVIEW
Sources: IBISWorld and Jobson Optical Research
1. Dark green denotes higher level of focus
Frames: Lenses:

2
VISION CARE OVERVIEW:PRIMARY EYE CARE
Independent eye care providers control a significant portion of the patient population. Eye care services include exams, treatment for dry eye, glaucoma, cataracts, diabetes, and macular degeneration
A prescription issued within the last one to two calendar years, depending on state, is required for the purchase of prescription eyewear and contact lenses; as a result, the patient / eye care professional relationship heavily influences buying decisions
Differentiated patient relationships, service quality, earlier technology adoption, and clinical / product knowledge enable strong independent market share position
– Independents perform 68% of all patient eye care service with share remaining stable and increasing slightly over the past 5 years vs. chains
– Despite lower service share, chains capture 46% of all primary eye care revenue driven by higher sales of eyeglasses / contact lenses
Growth in eye care professionals driven by steady increase in ODs; ophthalmologists expected to remain stable
1. Practice Advancement Associates (Jobson) estimates. Note: primary eye care market includes revenue from prescription eyewear, contact lenses, eye exams offered by eye care professionals
2. Jobson Optical Research (2013, 2012, 2009)3. Jobson Medical Information estimates
PRIMARY EYE CARE PROVIDER SHARE1 EYE CARE PROFESSIONALS BREAKDOWN3
# in ‘000s
PATIENT ASSESSMENT OF EYE CARE2
Service drives differentiation for eye
care providers
% of patients extremely satisfied% of patients, revenue in 2013
Higher capture of corrective
device sales
18 18
41
46 59
64
0
10
20
30
40
50
60
70
2014 2020
Ophthalmologists Optometrists
2014-2020 CAGR: 0.0%
53%
42%
15%
12%
32% 46%
0%
20%
40%
60%
80%
100%
Patients Revenue
Independent ODs Other Mass Retail
58%
71%
61%
45%
53%
39%
0%
20%
40%
60%
80%
100%
Overall Satisfaction Likelihood to Return Likelihood to
Recommend
Independent Mass Retail

3
Eye Exams
39%
Contact Lenses
32%
Prescription
Eyewear
29%
Optometrists capture ~$16 billion of annual vision service and product spending. Optometrists offer services through private practices, chain / mass merchandisers, and government organizations
‒ ODs are licensed practitioners who have obtained Doctor of Optometry degree (DO) from an accredited optometry school (four year program post undergraduate degree) and passed both a written and clinical state board examination
Independent optometrists are differentiated by strength in eye exams and medical eye care through personalization of care, patient loyalty, and clinical care
Increasing proportion of U.S. population will rely on ODs for refractive and medical eye care services
‒ Perform ~88 million refractive eye exams annually, representing 85% of all comprehensive eye exams1
‒ Number of practicing optometrists expected to grow 2% annually through 2020 to 46,300 to meet rising demand
‒ Number of ophthalmologists / primary care physicians will not keep pace with demand growth
Expanding scope of service offering drives new revenue opportunities
‒ Medical service offering includes treatment of ocular diseases from diabetes, ocular infection, dry eye, ocular allergies, and glaucoma
‒ 80-85% of optometrists have some level of involvement with medical eye care, representing 17% of optometrist total revenue
‒ Push for new legislation to allow ODs to perform vision correction surgery within licensed service portfolio would grow their share of the market
VISION CARE OVERVIEW:OPTOMETRISTS
OPTOMETRIST SERVICES SEGMENTATION2
1. The State of the Optometric Profession (Jobson Medical Information, 2013)2. Optometrists in the US (IBISWorld, Oct. 2016)3. AOA
PRIMARY PRACTICE SETTING BREAKDOWN (# OF ODs)3
Licensed services, 39% of business, generally
include: eye exams; treatment of eye
conditions; prescription of glasses / medications;
diagnosis of eye conditions; pre/post-operative care; post-
traumatic care for injuries; treatment plans for vision rehabilitation
Independent
Practice
22,800 or 57% Optical Chain
Affiliation
9,600 or 24%
Ophthalmology
Practice
3,300 or 8%
Other Medical
2,000 or 5%
Government
1,900 or 5%
Other
400 or 1%

4
16,000
18,000
20,000
22,000
24,000
26,000
2012 2013 2014 2015 2016 2017 2018 2019 2020
Required Ophthalmologists Expected Ophthalmologists
VISION CARE OVERVIEW:OPHTHALMOLOGISTS
Ophthalmologists capture ~$12 billion of vision service and product spending annually.
Ophthalmologists are trained MDs specializing in vision care; key difference areas from optometrists include:
‒ Education requirements – 8+ years of medical training plus optional additional “vision specialty” area training
‒ Licensed procedures scope – can diagnose and treat full spectrum of eye diseases and perform eye surgery
‒ Refractive surgery / LASIK – licensed to perform vision correction surgery in all states
‒ Higher average revenue per patient visit – provide premium, specialized services (i.e. $600-$2,000 per cataract surgery)
Stable number of practicing ophthalmologists expected through 2020 will not keep pace with underlying demand
‒ Likely to drive higher production per clinic going forward as demand for medical / surgical eye care grows with aging population
‒ Facilitates OD practice scope expansion and OD new entrants and supports rising demand for ophthalmologists
EYE CARE SERVICE COMPARISON
1. DHHS Physician Supply and Demand Projections to 2020 and Jobson Optical Research (2013, 2012, 2009)
INCREASING NEED FOR DELIVERY OF SERVICES1
Vision Services (i.e. eye exams)
Medical Eye Care (e.g. glaucoma, iritis, chemical burns)
Surgical Eye Care (e.g. trauma, cataracts, crossed eyes)
Plastic Surgery (e.g. drooping eyelids, smoothing wrinkles)
Refractive Surgery (i.e. LASIK, PRK, LASEK, RLE, EpiLasik)
Other (i.e. diagnose / treat diabetes / arthritis eye conditions)
P
P
PShortage of ophthalmologists creates opportunity for
ODs to provide greater role in delivery of services
# of ophthalmologists
P
P
P
P
P
P
OD MD
Growing unmet demand through 2020

5
~$12 billion market size
Annual growth 4-5%
Likelihood of price inflation with
total number of practicing
ophthalmologists expected to
be stable at ~18K
Higher production per clinic
~30% of the broader US vision
care category spend
VISION CARE INDUSTRY GROWTH DYNAMICS
The independent optometrist, mass retailer, and ophthalmologist segments of the vision care industry represent a combined ~$40 billion market, growing ~3-4% annually.1,2
Steady growth of vision care services driven by the following key market trends:
Aging Population
Growing Coverage for Vision Care
Ophthalmology growing more rapidly at 4-5% driven by increasing incidence of conditions such as glaucoma, cataracts, and macular degeneration requiring medical / surgical procedures, combined with stable number of practitioners
In addition to positive secular trends driving long-term growth, the vision market exhibits highly stable demand due to:
Non deferrable nature of service and corrective device purchases
U.S. VISION CARE INDUSTRY GROWTH1,2
1. Optometrists in the US (IBISWorld, Oct. 2016)2. Eye Glasses & Contact Lens Stores in the US (IBISWorld, Jun. 2015)
$ in billions
Independent Optometrists Mass Retailers Ophthalmologists
$ in billions
Increasing Prevalence of Chronic Disease
х Growing Adoption of Refractive Surgery
Limited instance of excess utilization providing for stable reimbursement
Increase in Digital Screen Usage and Asthenopia (Eye Strain)
Technological Innovation Resulting in New Products
$15 $16 $16
$16 $17
$17 $18
$0
$4
$8
$12
$16
$20
2015 2016 2017P 2018P 2019P 2020P 2021P
$12 $12 $12
$13 $13
$14 $14
$0
$4
$8
$12
$16
$20
2015 2016 2017P 2018P 2019P 2020P 2021P
6
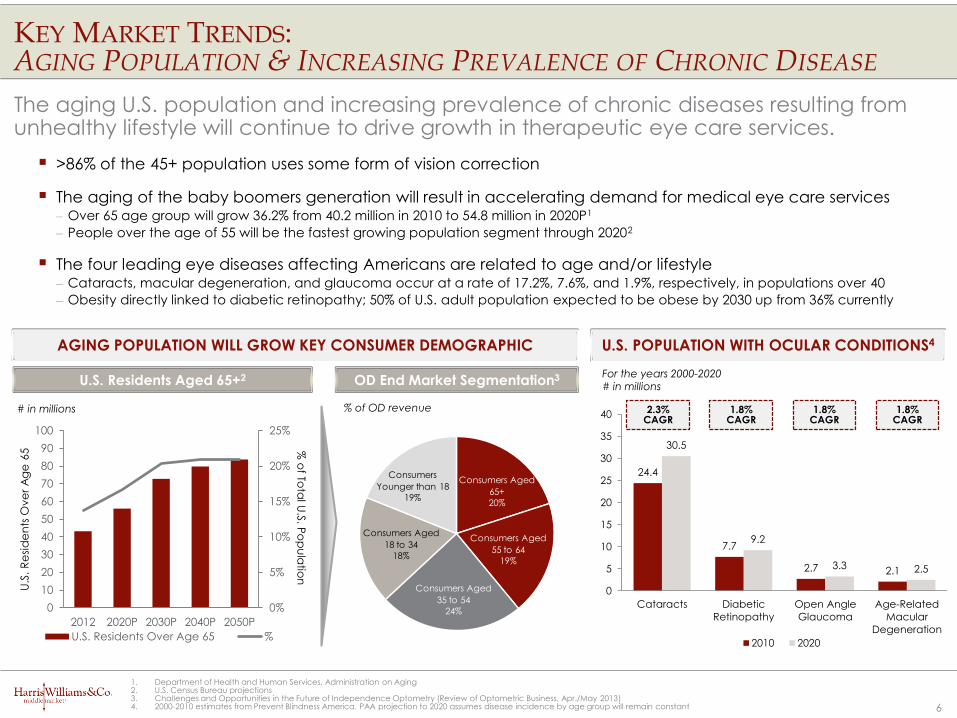
KEY MARKET TRENDS:AGING POPULATION & INCREASING PREVALENCE OF CHRONIC DISEASE
The aging U.S. population and increasing prevalence of chronic diseases resulting from unhealthy lifestyle will continue to drive growth in therapeutic eye care services.
>86% of the 45+ population uses some form of vision correction
The aging of the baby boomers generation will result in accelerating demand for medical eye care services‒ Over 65 age group will grow 36.2% from 40.2 million in 2010 to 54.8 million in 2020P1
‒ People over the age of 55 will be the fastest growing population segment through 20202
The four leading eye diseases affecting Americans are related to age and/or lifestyle‒ Cataracts, macular degeneration, and glaucoma occur at a rate of 17.2%, 7.6%, and 1.9%, respectively, in populations over 40
‒ Obesity directly linked to diabetic retinopathy; 50% of U.S. adult population expected to be obese by 2030 up from 36% currently
1. Department of Health and Human Services, Administration on Aging2. U.S. Census Bureau projections3. Challenges and Opportunities in the Future of Independence Optometry (Review of Optometric Business, Apr./May 2013)4. 2000-2010 estimates from Prevent Blindness America. PAA projection to 2020 assumes disease incidence by age group will remain constant
Consumers Aged
65+
20%
Consumers Aged
55 to 64
19%
Consumers Aged
35 to 54
24%
Consumers Aged
18 to 34
18%
Consumers
Younger than 18
19%
% of OD revenue
U.S. Residents Aged 65+2 OD End Market Segmentation3
0%
5%
10%
15%
20%
25%
0
10
20
30
40
50
60
70
80
90
100
2012 2020P 2030P 2040P 2050P
% o
f Tota
l U.S
. Po
pu
latio
n
U.S
. R
esi
de
nts
Ove
r A
ge
65
U.S. Residents Over Age 65 %
# in millions
AGING POPULATION WILL GROW KEY CONSUMER DEMOGRAPHIC U.S. POPULATION WITH OCULAR CONDITIONS4
For the years 2000-2020# in millions
24.4
7.7
2.7 2.1
30.5
9.2
3.3 2.5
0
5
10
15
20
25
30
35
40
Cataracts Diabetic
Retinopathy
Open Angle
Glaucoma
Age-Related
Macular
Degeneration
2010 2020
2.3% CAGR
1.8% CAGR
1.8% CAGR
1.8% CAGR

7
$4,291
$5,645
$611
$1,061
$4,902
$6,706
$0
$2,000
$4,000
$6,000
$8,000
2004 2013
Optometrists Ophthalmologists
Recent healthcare initiatives have expanded pool of insured and coverage for eye care.
Federal healthcare programs have expanded the number of people eligible for vision benefits‒ Insurance coverage reduces the out-of-pocket costs for patients, increasing demand / ability to pay for vision services
‒ The ACA defined pediatric eye care as an essential benefit which will increase access to optometric care (children currently 19% of OD end market)
Vision benefits offered under Medicare include cataract surgery, corrective eyewear following cataract surgery, glaucoma screening, and ocular prostheses‒ By 2020, the number of Medicare beneficiaries will increase by 10 million
Harkin Amendment aims to expand patient access and eliminate health plan discrimination against optometry and other forms of medical care‒ Eye exams now included as medical healthcare, requiring coverage in all health plans in new state and federal insurance exchanges
KEY MARKET TRENDS:GROWING COVERAGE FOR VISION CARE
MEDICARE PAYMENTS TO EYE CARE PROFESSIONALS1
1. Centers for Medicare and Medicaid
$ in millions

8
KEY MARKET TRENDS:STABLE REFRACTIVE SURGERY VOLUMES
LASIK vision correction surgery volumes have declined from peak levels of ~1.2 – 1.4 million p.a. between 2000 and 2007 to ~600k and are expected to grow ~2% going forward.
U.S. VISION CORRECTION SURGERY OVERVIEW
The maturation of refractive surgery has not dramatically impacted demand for eye exams or corrective devices
‒Corrective eye surgery (i.e. LASIK) is removing 500K patients annually from the 150 million vision correction population
Potential refractive surgery market size of 10+ million individuals;1 expected to grow ~2% annually to $2.7 billion by 2018
Growing popularity of corrective eye surgery would lead to higher patient pre/post-operative care volume for optometrists
Optometrists currently seeking to expand scope of service to include vision correction surgery
1. AAO2. Statista3. Procedure volume assumes average LASIK procedure cost of $2,000 per eye (according to LASIK)
U.S. VISION CORRECTION SURGERY INDUSTRY GROWTH2,3
$ in billions; procedure volume in ’000s
$5.6$5.2
$4.7 $4.6
$5.5 $5.5 $5.5 $5.6
$4.1
$3.0 $2.9$2.5 $2.5 $2.4 $2.4 $2.4 $2.5 $2.6 $2.7
1,400 1,310
1,176 1,150
1,375 1,380 1,375 1,395
1,034
749 723 623 624 602 608 596 613 638 663
0
400
800
1,200
1,600
2,000
$0
$2
$4
$6
$8
2000 2001 2002 2003 2004 2005 2006 2007 2008 2009 2010 2011 2012 2013 2014 2015 2016 2017P 2018P
Eye Surgery Centers in the U.S. LASIK Procedure Volume

9
Commercial and self directed plans account for the majority of third party reimbursement for vision care services. Vision insurance plan reimbursements totaled 67% of OD revenue in 2011, with 80% of patients covered by a
managed vision care plan1
‒ Continues to increase as more individuals gain access to health plan coverage
‒ Private and self-directed plans represent ~60% of plan coverage
‒ Self pay currently accounts for ~20%
‒ Low level of government reimbursement
Direct patient payments totaled 33% of OD revenue in 2011 while 20% of patients were not covered by a managed care vision plan1
Notable managed vision care plan providers include VSP, EyeMed (Luxottica), Davis Vision, and Superior Vision
REIMBURSEMENT ENVIRONMENT
1. ACA Member Survey2. American Optometric Association3. ACA 2012 Survey of Optometric Practice
% OD patients
MANAGED CARE PLAN COVERAGE2 OD SOURCES OF REVENUE3
Direct Patient
Payment
33%
Vision Insurance
31%
Private Medical
Insurers
17%
Government
17%
Other
2%
~60% private / self directed
plans
VSP
25%
Other Private
Insurance
19%Other Self-
Directed Vision
Plans
17%
Self Pay
20%
Government
19%

10
National Chain / Mass Retailer Multi-Site Independent Member Network
Sites 475 116 7,000 860 700 3,582 18 14 180 170 25 16 300 780 43 59 67 2,000 3,262
Revenue ($mm) $915 $105 $10,051 $945 $900 $1,746 NA NA NA NA NA NA NA $275 $21 $24 $222 NA $2,512
Services
Retail
Optometry
Ophthalmology
Refractive Surgery
eCommerce
Geography
Northeast
Southeast
Midwest
West
Ownership Public Public Public Private Private Private
INDUSTRY PARTICIPANTS OVERVIEW
The vision care services industry is comprised of a select set of national and regional chains and a large number of independent providers.
Two-thirds of practicing optometrists are in private practices1
Currently minimal consolidation within ophthalmology on regional or national basis
~34,333 companies in the industry today; over half have fewer than five employees2
OVERVIEW OF VISION SERVICES MARKET PARTICIPANTS
1. American Optometric Association2. Optometrists in the US (IBISWorld, Oct. 2016)3. Luxottica manages Target Optical and Sears4. National Vision manages portion of Walmart optical stores5. Represents independent optometry member sites and services offered
4355

11
Investors are highly interested in the vision industry due to its large addressable market, fragmentation, combination of retail/healthcare characteristics, and growth opportunities.
$40+ billion market forecasted to grow at ~3-4%
Highly fragmented market comprised of a select set of national / regional chains and over 10,000 independent providers
‒ Small industry players want to broaden their network and expand access to patients and referral networks
‒ Platform providers with scale seek add-on acquisitions to spur growth, realize synergies, and increase purchasing power
Unique intersection between retail and healthcare
‒ Attractive unit economics / de novo model
‒ Recession-resistant / non-discretionary services
As a result, there has been increasing M&A activity in vision services, particularly in last 12 months
‒ Initial consolidation in the industry is underway and accelerating with financial buyers leading the charge
‒ Well-capitalized strategics are entering the U.S. and intensifying the competition within the industry
‒ Platform providers with scale are seeking add-on acquisitions to expand geographic presence and achieve operating efficiencies
VISION INDUSTRY M&A ACTIVITY
1. Varsity acquires Katzen Eye Group to form EyeCare Services Partners
February
2017
February
2017
December
2016
August
2015
April
2015
May
2014
NOTABLE RECENT VISION SERVICES TRANSACTIONS
Target
Acquirer
1
‒ Stable reimbursement from limited instance of excess utilization
‒ Ability to grow rapidly via acquisition and de novo strategies
December
2015
March
2014
December
2014Pending

12
Date Target Company Acquirer Date Target Company Acquirer
Pending Luxottica Group SpA Essilor International SA Aug-14 Vision Group Holdings Audax Group
Pending Southwestern Eye Center / BDP Eye Center H.I.G. Capital May-14 EyeCare Services Partners Varsity Healthcare Partners
Mar-17 EyeSouth Partners Shore Capital Partners May-14 C & C Optical Shop Inc. Eye Care One, Inc.
Feb-17 SouthEast Eye Specialists Flexpoint Ford Mar-14 National Vision, Inc. KKR & Co. L.P.
Feb-17 Grand Rapids Ophthalmology Sterling Partners Feb-14 Heartland Eye Care Wolfe Eye Clinic, P.C.
Feb-17 Minnesota Eye Consultants Waud Capital Feb-14 Tristate Eye Care, P.C. International Eyecare Center, Inc.
Dec-16 ICON EyeCare Cortec Group Feb-14 Nevada Eye Care NVISION Laser Eye Centers Inc.
Nov-16 IDOC, LLC Investors Management Corporation Jan-14 1-800 CONTACTS, Inc. Thomas H. Lee Partners, L.P.
Apr-16 Superior Vision Services, Inc. Centerbridge Partners, L.P. Jan-14 Doctors Vision Center, Inc. MyEyeDr., Inc.
Jan-16 PRIMA, LLC IDOC, LLC Dec-13 Block Vision Inc. Superior Vision Services, Inc.
Jan-16 MARCH Vision Care Specialty Benefits, LLC Nov-13 Capital Eye Medical Group NVISION Laser Eye Centers Inc.
Dec-15 1-800 CONTACTS, Inc. AEA Investors Oct-13 Southcoast Eye Care Inc. Claris Vision
Dec-15 For Eyes Optical Co. GrandVision NV Oct-13 Yonge Eglinton Laser Eye TLC Vision Corporation
Nov-15 Professional Eyecare Resource Co-
Operative (PERC) / Infinity Vision Alliance
Essilor of America, Inc. Sep-13 Nationwide Optical Group U.S. Vision, Inc.
Sep-15 Vision Source, L.P. Essilor International SA Feb-13 Eye Institute of Southern Arizona, LLC Southwestern Eye Center, Ltd.
Aug-15 MyEyeDr., Inc. Caisse de dépôt et placement du Québec
Altas Partners LP
Jan-13 Seacoast Eye Associates Inc. Koch Eye Associates, Inc.
Apr-15 Clarkson Eyecare, Inc. Friedman, Fleischer & Lowe, LLC Dec-12 Eye Health Vision Centers, LLC Koch Eye Associates, Inc.
Dec-14 Eyemart Express, LLC Friedman, Fleischer & Lowe, LLC Jan-12 Koch Eye Associates, Inc. Candescent Partners
VISION INDUSTRY M&A ACTIVITY (CONTINUED)
M&A ACTIVITY 2012-2017YTD
Source: FactSet
Indicates financial buyer

13
Harris Williams & Co. (www.harriswilliams.com) is a preeminent middle market investment bank focused on the advisory needs of clients worldwide. The firm has deep industry knowledge, global transaction expertise, and an unwavering commitment to excellence. Harris Williams & Co. provides sell-side and acquisition advisory, restructuring advisory, board advisory, private placements, and capital markets advisory services.
Investment banking services are provided by Harris Williams LLC, a registered broker-dealer and member of FINRA and SIPC, and Harris Williams & Co. Ltd, which is authorised and regulated by the Financial Conduct Authority. Harris Williams & Co. is a trade name under which Harris Williams LLC and Harris Williams & Co. Ltd conduct business.
THIS REPORT MAY CONTAIN REFERENCES TO REGISTERED TRADEMARKS, SERVICE MARKS AND COPYRIGHTS OWNED BY THIRD-PARTY INFORMATION PROVIDERS. NONE OF THE THIRD-PARTY INFORMATION PROVIDERS IS ENDORSING THE OFFERING OF, AND SHALL NOT IN ANY WAY BE DEEMED AN ISSUER OR UNDERWRITER OF, THE SECURITIES, FINANCIAL INSTRUMENTS OR OTHER INVESTMENTS DISCUSSED IN THIS REPORT, AND SHALL NOT HAVE ANY LIABILITY OR RESPONSIBILITY FOR ANY STATEMENTS MADE IN THE REPORT OR FOR ANY FINANCIAL STATEMENTS, FINANCIAL PROJECTIONS OR OTHER FINANCIAL INFORMATION CONTAINED OR ATTACHED AS AN EXHIBIT TO THE REPORT. FOR MORE INFORMATION ABOUT THE MATERIALS PROVIDED BY SUCH THIRD PARTIES, PLEASE CONTACT US AT +1 (804) 648-0072.
The information and views contained in this report were prepared by Harris Williams & Co. (“Harris Williams”). It is not a research report, as such term is defined by applicable law and regulations, and is provided for informational purposes only. It is not to be construed as an offer to buy or sell or a solicitation of an offer to buy or sell any financial instruments or to participate in any particular trading strategy. The information contained herein is believed by Harris Williams to be reliable but Harris Williams makes no representation as to the accuracy or completeness of such information. Harris Williams and/or its affiliates may be market makers or specialists in, act as advisers or lenders to, have positions in and effect transactions in securities of companies mentioned herein and also may provide, may have provided, or may seek to provide investment banking services for those companies. In addition, Harris Williams and/or its affiliates or their respective officers, directors and employees may hold long or short positions in the securities, options thereon or other related financial products of companies discussed herein. Opinions, estimates and projections in this report constitute Harris Williams’ judgment and are subject to change without notice. The f inancial instruments discussed in this report may not be suitable for all investors, and investors must make their own investment decisions using their own independent advisors as they believe necessary and based upon their specific financial situations and investment objectives. Also, past performance is not necessarily indicative of future results. No part of this material may be copied or duplicated in any form or by any means, or redistributed, without Harris Williams’ prior written consent.
DISCLOSURES
Copyright © 2017 Harris Williams & Co., all rights reserved.