isolation and characterisation of medicinal compounds from...
TRANSCRIPT

Isolation and characterisation of medicinal compounds from Phyllanthus Niruri L
Nanda Ayu PUSPITA
PhD Thesis 2015

Isolation and characterisation of medicinal compounds from Phyllanthus Niruri L
Nanda Ayu PUSPITA
School of Environment & Life Sciences College of Science & Technology
University of Salford Salford, UK
Submitted in Partial Fulfilment of the Requirements for the Degree of Doctor of Philosophy
May 2014

i
Table of Contents
Table of Contents ........................................................................................................................ i
List of Tables ............................................................................................................................... v
List of Figures ............................................................................................................................ vi
Abstract ix
Declaration xi
Acknowledgement ................................................................................................................... xii
Dedication xiii
Abbreviations .......................................................................................................................... xiv
Introduction ............................................................................................................ 1 Chapter 1
1.1 General introduction ....................................................................................................... 2
1.2 Phyllanthus niruri L in pharmacognosy ............................................................................ 5
1.2.1 The constituents of Phyllanthus niruri L ................................................................... 5
1.2.2 Pharmacological properties of Phyllanthus niruri L ................................................. 8
1.2.3 Mechanism of action of the isolated compounds .................................................. 12
1.2.3.1 Antiplatelet activity ....................................................................................................... 12
1.2.3.2 Anti-malarial activity ...................................................................................................... 13
1.2.3.3 Anti-cancer activity ........................................................................................................ 15
1.3 Platelet and its role in cardiovascular diseases ............................................................. 15
1.3.1 Platelet activation ................................................................................................... 16
1.3.2 Platelets release reaction ....................................................................................... 18
1.3.3 Platelets aggregation .............................................................................................. 20
1.3.4 Platelet signalling cascade ...................................................................................... 21
1.3.5 Bleeding disorder .................................................................................................... 26
1.3.6 Thrombotic diseases ............................................................................................... 27
1.4 Cancer and the alteration of the cell cycle .................................................................... 28
1.4.1 Carcinogenesis ........................................................................................................ 29
1.4.2 Cell cycle ................................................................................................................. 32
1.4.3 Anticancer ............................................................................................................... 37
1.4.3.1 Tubulin-binding agent .................................................................................................... 38
1.4.3.2 Topoisomerase inhibitor ................................................................................................ 39
1.4.3.3 Chemoprotective agents ............................................................................................... 39
1.5 Malaria ........................................................................................................................... 41
1.5.1 Plasmodium life cycle ............................................................................................. 42
1.5.2 Pathogenesis and proteins involved ....................................................................... 44
1.5.3 Anti-malarial drugs ................................................................................................. 47
1.6 The method for the discovery of plant-derived natural products ................................ 48
1.6.1 Extraction ................................................................................................................ 51
1.6.1.1 Infusion and decoction .................................................................................................. 54
1.6.1.2 Maceration .................................................................................................................... 55

ii
1.6.1.3 Percolation ..................................................................................................................... 55
1.6.1.4 Soxhlet extraction .......................................................................................................... 56
1.6.2 Isolation and purification ........................................................................................ 57
1.6.3 Structure elucidation .............................................................................................. 58
1.7 Specific aims and objectives of the research ................................................................. 59
1.8 Research methodology .................................................................................................. 60
Research Methodology ........................................................................................ 62 Chapter 2
2.1 Materials ........................................................................................................................ 63
2.2 Extraction of Phyllanthus niruri L extracts ..................................................................... 65
2.2.1 Maceration ............................................................................................................. 65
2.2.2 Solvent removal ...................................................................................................... 66
2.3 Screening for anticancer activity ................................................................................... 66
2.3.1 Cancer cell culture .................................................................................................. 66
2.3.1.1 Cell lines ......................................................................................................................... 66
2.3.1.2 Recovery of frozen cell lines .......................................................................................... 67
2.3.1.3 Maintaining the optimal condition of cell culture ......................................................... 68
2.3.1.4 Subculturing adherent cell lines .................................................................................... 68
2.3.1.5 Subculturing suspension cell lines ................................................................................. 69
2.3.1.6 Cryopreservation of cell stocks ...................................................................................... 69
2.3.2 MTT colorimetric Assay .......................................................................................... 70
2.3.3 Determination of apoptosis by flow cytometry ..................................................... 73
2.4 Screening for anti-malaria activity ................................................................................. 74
2.4.1 Malaria parasite culture ......................................................................................... 74
2.4.1.1 Preparation of the erythrocytes .................................................................................... 74
2.4.1.2 Preparation of the complete culture medium............................................................... 75
2.4.1.3 Recovery of the frozen parasites ................................................................................... 75
2.4.1.4 Culture procedure.......................................................................................................... 75
2.4.1.5 Thin blood smear ........................................................................................................... 77
2.4.1.6 Cryopreservation of plasmodium .................................................................................. 77
2.4.2 Flow-cytometry-based analysis of plasmodium drug sensitivity ........................... 78
2.5 Screening for anti-platelet activity ................................................................................ 79
2.5.1 Isolation of washed platelet ................................................................................... 79
2.5.2 Platelet aggregation assay ...................................................................................... 80
2.5.3 Platelet activation and protein extraction ............................................................. 81
2.6 Identification of the active compound .......................................................................... 81
2.6.1 Fractionation of the active extract ......................................................................... 82
2.6.2 Isolation and purification of the active compound by HPLC .................................. 82
2.6.3 Molecular structure identification ......................................................................... 83
2.6.3.1 Infrared (IR) spectroscopy ............................................................................................. 83
2.6.3.2 NMR spectrometry ........................................................................................................ 83
2.6.3.3 Mass spectrometry ........................................................................................................ 84
2.7 Analysis of platelet membrane glycoprotein receptors by flow cytometry .................. 84

iii
2.8 Proteomics analysis ....................................................................................................... 86
2.8.1 Two-dimensional gel electrophoresis .................................................................... 86
2.8.2 Coomassie blue staining ......................................................................................... 87
2.8.3 Image analysis ......................................................................................................... 87
2.8.4 Label-free protein quantitation and proteomics analysis ...................................... 88
2.9 Statistical approach ....................................................................................................... 91
2.9.1 Calculation of IC50 value .......................................................................................... 91
2.9.2 Statistical analysis ................................................................................................... 91
Extraction of the Crude Extracts .......................................................................... 92 Chapter 3
3.1 Introduction ................................................................................................................... 93
3.2 Result ............................................................................................................................. 94
3.2.1 Characteristics of the plant material ...................................................................... 94
3.2.2 Characteristic of the yielding extracts .................................................................... 96
3.2.3 Initial screening of the crude extracts constituents ............................................... 98
3.3 Discussion .................................................................................................................... 108
The Screening of Biological Activities of the Crude Extracts .............................. 114 Chapter 4
4.1 Introduction ................................................................................................................. 115
4.2 Result ........................................................................................................................... 117
4.2.1 Anti-malarial screening ......................................................................................... 117
4.2.2 Anti-cancer screening ........................................................................................... 127
4.2.3 Antiplatelet screening........................................................................................... 138
4.3 Discussion .................................................................................................................... 144
4.3.1 Anti-malarial activity ............................................................................................. 144
4.3.2 Anti-cancer activity ............................................................................................... 149
4.3.3 Antiplatelet activity .............................................................................................. 157
Focusing on the Antiplatelet Activity of Phyllanthus niruri L ............................. 161 Chapter 5
5.1 Introduction ................................................................................................................. 162
5.2 Result ........................................................................................................................... 164
5.2.1 Identification of the most active extract .............................................................. 164
5.2.2 Fractionation of the most active extract .............................................................. 165
5.2.3 The exploration of the antiplatelet activity of the most active fraction .............. 167
5.2.3.1 The optimisation of platelet agonists .......................................................................... 167
5.2.3.2 The effect of P5M on platelet aggregation induced by different agonists .................. 171
5.3 Discussion .................................................................................................................... 174
The Separation of P5M by High Performance Liquid Chromatography (HPLC) . 180 Chapter 6
6.1 Introduction ................................................................................................................. 181
6.2 Result ........................................................................................................................... 181
6.2.1 Analytical HPLC for the optimization of the solvent system ................................ 181
6.2.2 Preparative HPLC for the separation of P5M ....................................................... 188
6.2.3 Identification of the most active fraction ............................................................. 191
6.3 Discussion .................................................................................................................... 194

iv
Identification of the Active Compounds ............................................................ 199 Chapter 7
7.1 Introduction ................................................................................................................. 200
7.2 Result ........................................................................................................................... 201
7.2.1 Determination of the IC50 of the isolated compounds ......................................... 201
7.2.2 Microscopic analysis of platelet aggregates ......................................................... 207
7.2.3 Purity analysis of the isolated compounds ........................................................... 214
7.2.4 Identification of the molecular structure ............................................................. 221
7.3 Discussion .................................................................................................................... 228
Elucidation of the Mechanism of Action of Corilagin as Antiplatelet Agent ..... 241 Chapter 8
8.1 Introduction ................................................................................................................. 242
8.2 Result ........................................................................................................................... 244
8.2.1 Inhibitory response towards different platelet stimulation ................................. 244
8.2.2 Analysis of CD61 expression in the presence of corilagin .................................... 245
8.2.3 Analysis of platelet activation markers in the presence of corilagin ................... 249
8.2.4 Analysis of platelet proteome by 2D gel electrophoresis .................................... 253
8.2.5 Label-free platelet protein quantification ............................................................ 259
8.2.5.1 Platelet proteome classification .................................................................................. 259
8.2.5.2 Quantitative proteomics analysis ................................................................................ 264
8.2.6 Platelet signalling pathway analysis ..................................................................... 267
8.3 Discussion .................................................................................................................... 277
Conclusion .......................................................................................................... 288 Chapter 9
List of References .................................................................................................................. 293
Appendices312

v
List of Tables
Table 1.1 – Chemical constituents isolated from Phyllanthus niruri L ...................................... 6
Table 1.2 – List of solvents for plant extraction ...................................................................... 53
Table 3.1 – Compositions of the impurities of Phyllanthus niruri L powder .......................... 95
Table 3.2 – Extraction yield ..................................................................................................... 96
Table 3.3 – Phytochemical screening of Phyllanthus niruri L extracts .................................... 98
Table 3.4 – Infrared absorption of water extracts. ............................................................... 103
Table 3.5 – Infrared absorption of methanol extract ........................................................... 104
Table 3.6 – Infrared absorption of ethanol extract ............................................................... 105
Table 3.7 – Infrared absorption of hexane extract ............................................................... 106
Table 3.8 – Infrared absorption of chloroform extract ......................................................... 107
Table 4.1 – IC50 values of Phyllanthus niruri L extracts on cancer cell lines ......................... 133
Table 4.2 – IC50 values of Phyllanthus niruri L extracts on normal cell line .......................... 134
Table 6.1 – The weight, retention time, and physical appearance fractions from P5M ...... 190
Table 7.1 – Compounds concentration required to inhibit 50% of human platelet aggregation induced by ADP .............................................................................. 205
Table 7.2 – Microscopic observation of the whole blood platelet aggregation ................... 210
Table 8.1 – Pathway analysis 2D gels .................................................................................... 257
Table 8.2 – Pathway over-representation test of ADP-activated proteins with the presence of corilagin .......................................................................................................... 270
Table 8.3 – Pathway list from REACTOME pathway analysis ................................................ 273

vi
List of Figures
Figure 1.1 – Whole plant of Phyllanthus niruri L (Wahyuni S., 2010) ....................................... 5
Figure 1.2 – Chemical structures of anti-plasmodial compounds from Phyllanthus niruri L .. 14
Figure 1.3 – Platelet activation scheme .................................................................................. 17
Figure 1.4 – Platelet surface receptors in platelet activation and aggregation ...................... 21
Figure 1.5 - GPCR-coupled platelet activation signaling ......................................................... 24
Figure 1.6 - Platelet integrin activation ................................................................................... 26
Figure 1.7 – The six hallmark of cancer ................................................................................... 32
Figure 1.8 – Cyclin-dependent kinase (CDK) functions in the cell cycle. ................................ 35
Figure 1.9 – Plasmodium life cycle .......................................................................................... 44
Figure 1.10 – Bioassay-guided natural product discovery process ......................................... 50
Figure 2.1 – The template of MTT assay for anti-cancer test ................................................. 71
Figure 2.2 – Workflow of the proteomics study ..................................................................... 90
Figure 3.1 – The physical appearance of each phase of Phyllanthus niruri L extraction. ....... 97
Figure 3.2 – Ultraviolet absorption spectrum of Phyllanthus niruri L extract. ..................... 100
Figure 3.3 – FTIR spectrum of water extract ......................................................................... 103
Figure 3.4 – FTIR spectrum of methanol extract................................................................... 104
Figure 3.5 – FTIR spectrum of ethanol extract ...................................................................... 105
Figure 3.6 – FTIR spectrum of hexane extract ...................................................................... 106
Figure 3.7 – FTIR spectrum of chloroform extract ................................................................ 107
Figure 4.1 – Comparisons of uninfected and parasitized RBC using SYBR green flow cytometric assay ................................................................................................. 118
Figure 4.2 – Anti-malarial screenings of Phyllanthus niruri L extracts .................................. 120
Figure 4.3 – Dose response of hexane extract on plasmodium life stages........................... 122
Figure 4.4 – Dose response of chloroform extract on plasmodium life stages .................... 123
Figure 4.5 – Dose response of ethanol extract on plasmodium life stages .......................... 123
Figure 4.6 – Dose response of methanol extract on plasmodium life stages ....................... 124
Figure 4.7 – Dose response of water extract on plasmodium life stages ............................. 124
Figure 4.8 – Representative dose response curve of ethanol, methanol, and water extracts ............................................................................................................................ 126
Figure 4.9 – Cytotoxic effect of different concentrations of hexane extract on cancer cell lines. ................................................................................................................... 128
Figure 4.10 – Cytotoxic effect of different concentration of chloroform extract on cancer cell lines .................................................................................................................... 129
Figure 4.11 – Cytotoxic effect of different concentration of ethanol extract on cancer cell lines .................................................................................................................... 130
Figure 4.12 – Cytotoxic effect of different concentration of methanol extract on cancer cell lines .................................................................................................................... 131
Figure 4.13 – Cytotoxic effect of different concentration of water extract on cancer cell lines ............................................................................................................................ 132
Figure 4.14 – Cell cycle analysis and gating strategy on flow cytometry ............................. 136
Figure 4.15 – The kinetics of cell cycle distribution of Phyllanthus niruri L extracts treated MOLT4 cells. ....................................................................................................... 137
Figure 4.16 – Maximum response of platelet aggregation over time .................................. 140
Figure 4.17 – The effect of the temperature on platelet aggregation. ................................ 140

vii
Figure 4.18 – Platelet aggregation response in the presence of Phyllanthus niruri L extracts ............................................................................................................................ 142
Figure 4.19 – Inhibition of platelet aggregation ................................................................... 143
Figure 4.20 – Chemical structure of anti-plasmodial compounds from Phyllanthus niruri L 148
Figure 4.21 – Chemical structure of quercetin ..................................................................... 155
Figure 5.1 – Platelet aggregation inhibition of water, methanol, and 50% methanol extracts. ............................................................................................................................ 165
Figure 5.2 – Second phase platelet aggregation test for the eluted fractions ..................... 166
Figure 5.3 – The effect of DMSO on resting platelet ............................................................ 168
Figure 5.4 – Optimization of ADP dose. ................................................................................ 169
Figure 5.5 – Optimization of collagen dose. ......................................................................... 169
Figure 5.6 – Optimization of epinephrine dose. ................................................................... 170
Figure 5.7 – Optimization of arachidonic acid dose. ............................................................. 170
Figure 5.8 – Optimization of thrombin dose. ........................................................................ 171
Figure 5.9 – Inhibition effect of P5M on of platelet aggregation induced by various agonists ............................................................................................................................ 172
Figure 5.10 – Platelet aggregation induced by various agonist in the presence of P5M ..... 173
Figure 6.1 – HPLC chromatogram of Phyllanthus niruri L plant material, crude extract, and pre-fractioned extract. ....................................................................................... 184
Figure 6.2 – HPLC chromatogram of water, P5M, and 100% methanol fractions ................ 185
Figure 6.3 – HPLC chromatogram of P5M separation using different solvent system ......... 187
Figure 6.4 – HPLC chromatogram of P5M separated with preparative column ................... 189
Figure 6.5 – Aggregation traces of the ADP-induced platelet aggregation with the presence of the active compounds .................................................................................... 192
Figure 6.6 – The inhibition potency towards ADP-induced platelet aggregation ................. 193
Figure 7.1 – Dose response of G1 ......................................................................................... 203
Figure 7.2 – Dose response of G2 ......................................................................................... 203
Figure 7.3 – Dose response of G3 ......................................................................................... 204
Figure 7.4 – Dose response of G6 ......................................................................................... 204
Figure 7.5 – Platelet aggregation response in the presence of the less-active isolated compounds ......................................................................................................... 206
Figure 7.6 – Thin blood smear of resting and aggregated platelets ..................................... 209
Figure 7.7 – The composition of platelet aggregates size after the treatment with the isolated compounds ........................................................................................... 213
Figure 7.8 – HPLC chromatograms for of the isolated compounds using different solvent composition ........................................................................................................ 216
Figure 7.9 – G1 HPLC chromatogram analysis ...................................................................... 217
Figure 7.10 – G2 HPLC chromatogram analysis .................................................................... 218
Figure 7.11 – G3 HPLC chromatogram analysis .................................................................... 219
Figure 7.12 – G6 HPLC chromatogram analysis .................................................................... 220
Figure 7.13 – Structure of corilagin isolated from 50% (v/v) methanol extract of Phyllanthus niruri L ................................................................................................................. 222
Figure 7.14 – Molecular structure identification of G2 based on 1D 1H NMR data ............. 223
Figure 7.15 – Molecular structure identification of G2 based on 1D 13C NMR data ............ 224
Figure 7.16 – Molecular structure identification of G2 based on 2D COSY data .................. 225
Figure 7.17 – Molecular structure identification of G2 based on 2D HMQC data................ 226
Figure 7.18 – HPLC chromatogram of G2 and corilagin standard ......................................... 227

viii
Figure 7.19 –Chemical structure of flavonoids from Phyllanthus niruri L. ........................... 229
Figure 7.20 – Chemical structure of terpenenes from Phylanthus niruri L. .......................... 232
Figure 7.21 – Chemical structure of niranthin and methyl brevifolincarboxylate ................ 233
Figure 7.22 – Chemical structure of geraniin, ellagic acid, and gallic acid. .......................... 235
Figure 8.1 – Inhibition effect of corilagin on of platelet aggregation induced by various agonists............................................................................................................... 245
Figure 8.2 – An illustration of gating strategy to show platelets population in flow cytometry ............................................................................................................................ 247
Figure 8.3 – Surface antigen CD61 expression ...................................................................... 248
Figure 8.4 – Two parameter flow cytometry analysis of PAC-1 and CD62P expression ....... 251
Figure 8.5 – The comparison of the expression of PAC-1 and CD62P. ................................. 252
Figure 8.6 – Image of 2D SDS PAGE electrophoresis of platelet proteins in different condition; resting, ADP-activated, and corilagin-treated ADP activated. .......... 255
Figure 8.7 – 2D gel electrophoresis analysis ......................................................................... 256
Figure 8.8 – Response to elevated platelet cytosolic Ca2+ .................................................... 258
Figure 8.9 – PCA analysis of platelet proteome HDMSE data sets at the feature and protein levels ................................................................................................................... 262
Figure 8.10 – Functional classification of platelet proteome ............................................... 263
Figure 8.11 – Over-representation analysis of platelet proteome ....................................... 266
Figure 8.12 – Haemostasis pathway ..................................................................................... 274
Figure 8.13 – ADP and thrombin activation pathway ........................................................... 275
Figure 8.14 – Response to elevated platelet cytosolic calcium ............................................ 276
Figure 8.15 – Corilagin role in platelet inside-out signalling mechanism ............................. 280
Figure 8.16 – Proposed mechanism of corilagin action ........................................................ 287

ix
Abstract
In many countries, Phyllanthus niruri L is one of the most popular alternatives of natural
herbal remedy to overcome many symptoms due to its wide range of therapeutic uses. Even
though a considerable number of research projects have been conducted in order to reveal
the pharmacological activities of Phyllanthus niruri L, and that a number of reports have
been produced mentioning its pharmacological effect, the rich constituents of this plant are
yet to be comprehensively studied, particularly with regards to the nature of the biological
activities that the compounds have.
Accordingly, the main focus of this study is the exploration of Phyllanthus niruri L as a new
candidate of natural compound. This was done through a series of bioassay-guided plant
extraction and isolation protocols. Phyllanthus niruri L crude extracts were tested against
plasmodium, cancer cell lines, and platelet aggregation. Guided by the bioassay results, the
isolation procedures were performed using advance chromatography techniques, in order
to purify the most-active substances that represent the final candidate natural product. This
study also employed flow cytometry and proteomics studies, as an attempt to identify the
fundamental principles of the mechanism of action of the isolated compounds.
The results demonstrated that Phyllanthus niruri L extracts showed a potency as
antiplasmodial, anti-cancer, as well as anti-platelet agent. In inhibiting plasmodium
falciparum growth, the potency of the extracts from the most to the least potent activity
was methanol > water > ethanol > chloroform > hexane (IC50 values were 1.6 µg/ml, 9.6
µg/ml, 25 µg/ml, and 141 µg/ml, respectively). With regards to its anti-cancer effect,
Phyllanthus niruri L extracts showed a significant cytotoxic effect on human Caucasian lung
large cell carcinoma (COR-L23), human acute T lymphoblastic leukaemia (MOLT-4), and
human caucasian chronic myelogenous leukaemia (K562). Among all extracts, methanol
extract demonstrated the strongest cytotoxicity effect with a low IC50 values for all cell lines
tested (IC50 values for COR-L23, MOLT-4, and K562 was 48.92 ± 0.52 µg/ml, 42.21 ± 4.98
µg/ml, and 139.28 ± 19.02 µg/ml, respectively). Methanol, water, ethanol, and hexane
extracts did not show any toxicity towards normal fibroblast cell line (3T3). However,
chloroform extract demonstrated a toxic effect to the normal cells line (IC50 value 164.3 ±
8.4 µg/ml).

x
The antiplatelet activity of Phyllanthus niruri L was further explored in this study due to a
remarkable inhibitory effect of methanolic extract observed on ADP-induced platelet
aggregation. With the aid of bioassay-guided isolation protocol, the study has isolated four
compounds from the methanolic extract, which demonstrated a potency in preventing in-
vitro platelet aggregation induced by ADP (compound 1, 2, 3, and 6). The IC50 of each
compound was 179.9 ± 2.67 µg/ml (compound 1), 31.91 ± 1.86 µg/ml (compound 2),
77.68±6.44 µg/ml (compound 3), and 43.35 ± 6.44 µg/ml (compound 6). Compound 2 was
identified as corilagin or [3,5-dihydroxy-2- (3,4,5-trihydroxybenzoyl)oxy-6-[ (3,4,5-
trihydroxybenzoyl) oxymethyl] oxan-4-yl] 3,4,5-trihydroxybenzoate.
The finding of this study demonstrated that corilagin altered the G-protein signalling
pathway in a selective manner by impeding Gq-protein cascade. Corilagin might act through
G13-mediated signalling; however it showed no significant effect on Gi-mediated signalling
pathway. Consequently, corilagin inhibited platelet shape changes, granule secretion, and
platelet aggregate formation, which was suggested to take place by the inhibition of the
elevation of intracellular Ca2+ level due to the inactivation of PLCβ. Although corilagin
showed no observable inhibitory effect on the initial activation of the major platelet
glycoprotein, GPIIb/IIIa, the findings suggested that the interaction between the activated
integrin and the related ligands is affected, which results in the inhibition of further
amplification of platelet aggregation.
Overall, this study confirmed the antiplatelet activity of corilagin and explained its coherent
mode of actions, which support the future development of corilagin, isolated from
Phyllanthus niruri L as a natural-sourced antiplatelet compound.

xi
Declaration
This thesis is submitted under the University of Salford requirements for the award of a PhD
degree by research. Throughout the period of the PhD study, some of the contents and
findings have been published in conference posters prior to the submission of the thesis.
The researcher, therefore, declares that no portion of the work referred to in this thesis has
been submitted in support of an application for another degree of qualification to the
University of Salford or any other institution.
Nanda Ayu Puspita

xii
Acknowledgement
In the name of Allah, the Most Gracious and the Most Merciful.
First and foremost I praise and acknowledge Allah, the most beneficent and the most
merciful. My humblest gratitude to the Holy Prophet Muhammad (Peace be upon him)
whose way of life has been a continuous guidance for me. This thesis will not appear in its
current form without the assistance and guidance of several people around me. It gives me
great pleasure to express my gratitude to all those who supported me and have contributed
in making this thesis possible.
My sincere appreciation is addressed to my supervisor Dr David Pye. His continuous
support, guidance and encouragements help me stand on my feet and climb through the
ups and downs of my PhD journey. My journey would have never been this far without his
wise advices. I would also like to extend my gratitude to my co-supervisor, Professor Alan
McGown, who has been supporting me throughout my research period.
I would also like to thank the Government of Aceh, Republic of Indonesia, for providing me
the scholarship. My special thanks would need to go to all my PhD and technicians
colleagues in Cockcroft building, who have been very supportive and inspiring to me
throughout my whole PhD journey in Salford.
My gratefulness goes to my parents, who have been supporting me in each and every step
and breath I take, to my late father, whose love, kindness, and spirit will always be in my
heart, and to my mother who gives me strength through her never-ended good wishes, pray
and emotional support. My gratitude is also forwarded to my late mother-in-law and my
father-in-law for their continuous tenderness and encouragement. To my brothers Dany and
Kiki, my sister-in-law Ria (and her baby girl Mika), Meis and Inda (and her sons Farrel and
Agi), my brothers-in-law, Poi, thank you so much for your supports.
To my sons, Jielan and Keenan, thank you for the endless joys and happiness you gave me –
I hope I have been a good mother and that I have not lost too much during my study. Saving
the best for last, from the bottom of my heart, I would like to send my deepest love and
appreciation to my dear husband, Ezri Hayat, for his unfailing love, endless support and
understanding. I may not have reached this far without you by my side.

xiii
Dedication
This piece of research is dedicated to my dearest late father, my mother, my parent in law,
my dear husband Hayat, and my lovely boys Jielan and Keenan.

xiv
Abbreviations
5HT2 5-hydroxytryptamine (serotonin) receptor 2A
AA Arachidonic Acid
ACD Acid Citrate Dextrose
ACE Angiotensin-Converting Enzyme
ACTs Artemisinin-Based Combination Therapy
ADP Adenosine Diphosphate
APS Ammonium Persulfate
ATM Ataxia Telangiectasia Mutated
cAMP Cyclic Adenosine Monophosphate
CC Column Chromatography
CDK Cyclin-Dependent Kinases
COX-1 Cyclooxygenase-1
CS Circumsporozoite
CSA Chondroitin Sulphate A
DAG Diacylglycerol
DBL Duffy-Binding-Like
DNA DeoxyriboNucleic Acid
DMSO Dimethylsulfoxide
DTT Dithiothreitol
EBA Erythrocyte-Binding Antigen
EBL Glycophorine B
ECM Extracellular Matrix
EDTA Ethylendiaminetetraacetic Acid
ER Endoplasmic Reticulum
ERK Extracellular Signal-Regulated Kinases
FBS Fetal Bovine Serum
FC Flash Chromatography
FTIR Fourier Transform Infrared

xv
GAG Glycosaminoglycan
g-COSY COrrelated SpectroscopY with gradients
GP Glycoproteins
GPA Glycophorine A
GPC Glycophorine C
GPCR G-protein-coupled receptor
HDMS High Definition Mass Spectrometry
HEPES N-2-Hydroxthylpiperazine-N’-2-Ethane-Sulfonic Acid
HMQC Heteronuclear Multiple-Quantum Correlation
HPLC High-Performance Liquid Chromatography
HPLTC High-Performance Thin-Layer Chromatography
IEF Isoelectric Focusing
IFN-γ Interferon γ
ILK Integrin-Linked Kinase
IP3 Inositol Trisphosphate
ITAM Immunoreceptor Tyrosine-based Activation Motif
MAPs Microtubule-Associated Proteins
MS Mass Spectrometry
MSP1 Malaria Merozoite Surface Protein-1
NMR Nuclear Magnetic Resonance
NO Nitric Oxide
PAGE Poly Acrylamide Gel Electrophoresis
PANTHER Protein ANalysis THrough Evolutionary Relationships
PAR Protease-Activated Family
PBS Phosphate Buffered Saline
PCA Principal Component Analysis
PfEMP1 Plasmodium Falciparum Erythrocyte Membrane Protein 1
PGE1 Prostaglandin E1
PI Propidium Iodide
PI3K Phosphoinositide 3-Kinase
PINCH Particularly Interesting Cys-His-rich Protein
PIP2 Phosphatidylinositol 4,5-bisphosphate

xvi
PKC Protein Kinase C
PLC Phospholipase C
PLCβ Phosphodiesterase β
PRP Platelet Rich Plasma
PTLC Preparative Thin Layer Chromatography
SDS Sodium Dodecyl Sulphate
SFK Src Family Kinase
SNARE Soluble NSF Attachment Protein Receptor
SOC Store-Operated Calcium
SP Sulphodoxine-Pyrimethamine
SPS Standard Platelet Suspension
TGFβ Transforming growth factor
TLC Thin Layer Chromatography
TNF Tumour-Necrosis Factor
TPC Total Plate Count
TRAP Thrombospondin-Related Adhesive Protein
TRPC6 Transient Receptor Potential Channel 6
TSP Thrombospondin
TXA2 Thromboxane A2
VEGF Vascular Endothelial Growth Factor
vWF von Willebrand Factor

Chapter 1Introduction

2
1.1 General introduction
Nature has provided numerous natural sources of traditional remedies that have been used
for many years as treatments for various ailments and diseases. Within the wide range of
living organisms available on earth including higher plants, animals, fungi, and marine
organisms, the databases of natural products have recorded more than 200.000 compounds
from almost all part of the world (Füllbeck et al., 2006). Plants have been by far the most
widely studied source of medicinal compounds (Cragg et al., 1997). Dias and co-workers
(2012) infer that one of the ancient scripts from Egypt (2600 BC) mentioned the uses of
plants as the major constituents of their traditional drugs (pills, infusions, and ointments).
Moreover, ancient Chinese scientists (100 BC) and Greek physicians (100 AD) documented
several manuscripts regarding the prescription of numerous herbal medicines. Later, a
famous Persian scientist (8th century), Avicenna, developed and introduced the basis of
modern day pharmacy and medicine science for the first time, with the emphasis being on
the application of plant-derived medicine.
The earliest examples of the uses of plants as a source of medicinal products resulted from
hundreds of years of trial-and-error experiments on local human populations, which was
then assimilated in their culture and passed to their successors. The long history of the
therapeutic (ethnomedical) applications has given much fundamental guidance in modern
research aimed at elucidating the active compounds contained in a particular medicinal
plant. Therapeutic natural products are likely to be safer than synthetically derived new
chemical entities if the active compounds derived from plants previously used for humans
use. Additionally, when one or more extracts of a particular plant shows some biological
activities in preventing or treating a particular symptom of diseases, there is a potential

3
opportunity to seek for lead compounds from such plants. This may ultimately lead to
synthetic or semisynthetic drug development and patent protection (Fabricant and
Farnsworth, 2001).
Natural compounds are typically secondary metabolites that are synthesised by an
organism; many of these metabolites are found to be unique to a particular organism. They
may not be essentially needed for metabolism, but may be related to the function of
environmental adaptation or as a possible defence mechanism for the survival of the
organism (Dias et al., 2012).
Over the past 30 years, there has been a significant rise in the number of publications on
natural products focusing on the investigation of plant-derived lead compounds (Newman
and Cragg, 2012). Fabricant and Farnsworth (2001) reviewed 122 compounds originated
from 94 plants, which are widely used as important drugs in more than one country.
Fabricant and Farnsworth further added that 80% of these compounds were used for
identical or related ethnomedical porpose of the active elements of the plant. However,
despite a resurgence of interest in the investigation of plants as a source of natural
products, the numbers of plant-derived secondary metabolites is still far from exhausted.
From a total of approximately 250.000 species of higher plant available on earth, only 15%
have been investigated so far for their active compounds and only 6% have been screened
for their biological properties (Füllbeck et al., 2006, Newman and Cragg, 2012). Accordingly,
there are many more candidates for new active compounds that remain untouched and
therefore still await to be discovered.
Phyllanthus niruri L is one of the most popular choices of natural herbal remedy to
overcome many symptoms due to its wide range of therapeutic uses in traditional medicine.

4
Examples of usage include treating high fever, respiratory disturbance, abdominal
disturbance, kidney disturbance, infection and bleeding disorders (Calixto et al., 1998,
Syamasundar et al., 1985). This plant has been mentioned in a number of historic
manuscripts, such as the ancient herbal medicine histories of Ayurveda Indian history,
traditional chinese medicine and Indonesian Jamu (Bagalkotkar et al., 2006). Consequently,
the long history of Phyllanthus niruri L use in herbal medicine from all over the world has
brought the interest of many scientists to explore the pharmacological properties of this
plant.
A number of projects have been conducted to reveal the pharmacological activities of
Phyllanthus niruri L, and, accordingly, a considerable number of publications are available
that mention its pharmacological effects. However, although various active compounds
have been identified from this plant, there are questions that remain to be answered
regarding the nature of the active compounds responsible for the observed biological
activities, and the mechanisms by which they exert their medicinal effects.
Accordingly, this thesis is focused on the exploration of Phyllanthus niruri L to seek new
pharmaceutical candidates against a number of disease conditions. This will be achieved by
screening for the most active extracts possessing a particular biological effect, followed by
the identification of the active substance responsible for the activity. This project will also
provide a comprehensive explanation regarding the possible mode of action of the active
compounds isolated from Phyllanthus niruri L. This will strengthen the knowledge used in
the future development of new drugs derived from this plant.
5
1.2 Phyllanthus niruri L in pharmacognosy
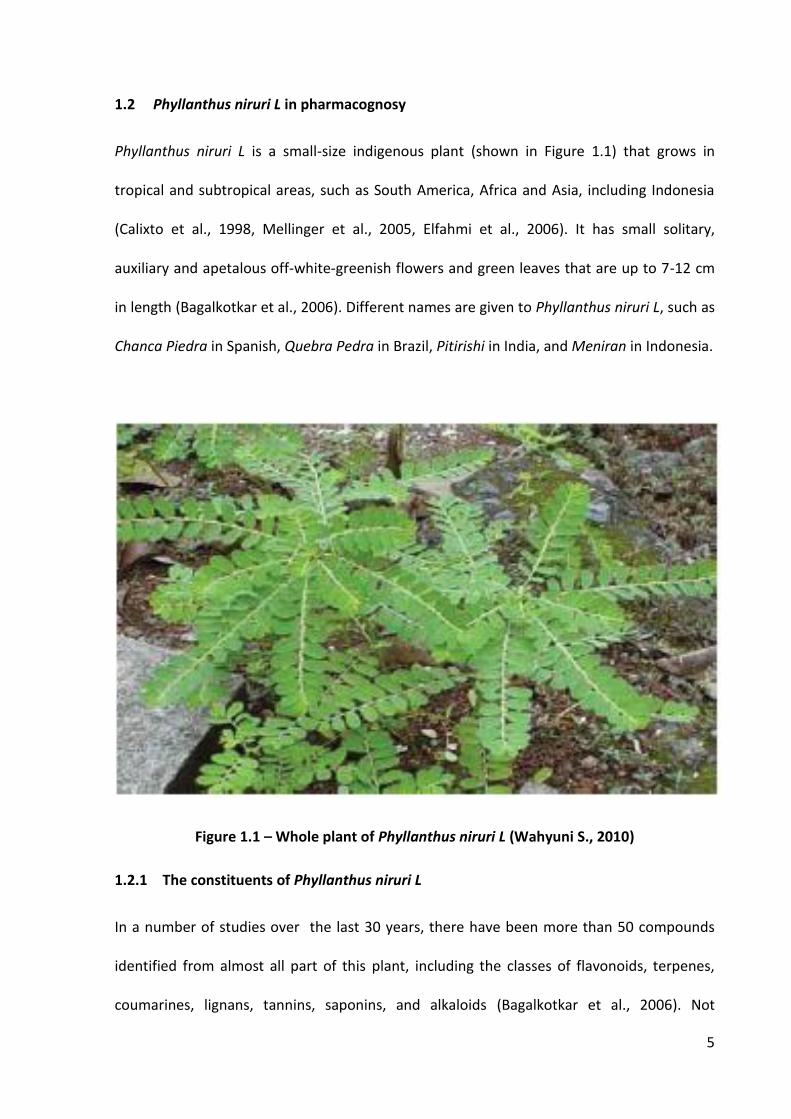
Phyllanthus niruri L is a small-size indigenous plant (shown in Figure 1.1) that grows in
tropical and subtropical areas, such as South America, Africa and Asia, including Indonesia
(Calixto et al., 1998, Mellinger et al., 2005, Elfahmi et al., 2006). It has small solitary,
auxiliary and apetalous off-white-greenish flowers and green leaves that are up to 7-12 cm
in length (Bagalkotkar et al., 2006). Different names are given to Phyllanthus niruri L, such as
Chanca Piedra in Spanish, Quebra Pedra in Brazil, Pitirishi in India, and Meniran in Indonesia.
Figure 1.1 – Whole plant of Phyllanthus niruri L (Wahyuni S., 2010)
1.2.1 The constituents of Phyllanthus niruri L
In a number of studies over the last 30 years, there have been more than 50 compounds
identified from almost all part of this plant, including the classes of flavonoids, terpenes,
coumarines, lignans, tannins, saponins, and alkaloids (Bagalkotkar et al., 2006). Not

6
surprisingly, Phyllanthus niruri L has been acknowledged as one of the richest sources of
plant-derived secondary metabolites. Among all the constituents, alkaloids, lignans,
terpenes, and tannins are the most abundant compounds contained in this plant (Calixto et
al., 1998). Some of the compounds and their known-activities are listed in the Table 1.1.
Table 1.1 – Chemical constituents isolated from Phyllanthus niruri L
Class Compound Activities Reference
Alkaloid Nor-securinine Anti-fungal (Joshi et al., 1986) (Sahni et al., 2005)
4- (Methoxy-d3) securinine
(Mulchandani and Hassarajani, 1984)
Nirurine (Petchnaree et al., 1986) Coumarin Ellagic acid Aldose reductase
inhibitor, ACE-inhibitor (Ueno et al., 1988, Shimizu et al., 1989)
Methyl brevifolincarboxylate
Vasorelaxan, anti-platelet
(Iizuka et al., 2007) (Iizuka et al., 2006, Than et al., 2006)
Brevifolin carboxylic acid
Aldose reductase inhibitor
(Shimizu et al., 1989, Ishimaru et al., 1992, Than et al., 2006)
Ethyl Brevifolin carboxylate
Aldose reductase inhibitor
(Shimizu et al., 1989)
Flavonoid Rutin Hepatoprotective (Sabir and Rocha, 2008) (Janbaz et al., 2002) (Colombo et al., 2009)
Quercetin (Subeki et al., 2005, Than et al., 2006)
Quercitrin (Sabir and Rocha, 2008) Astragalin (Kale Kumud et al.,
2001) Catechin (Ishimaru et al., 1992) Niruriflavone Antioxidant (Than et al., 2006)
Lignan Phyllanthin Hepatoprotective, (Syamasundar et al., 1985, Satyanarayana et al., 1988)
Hypophyllantin Hepatoprotective (Syamasundar et al., 1985)
Niranthin Anti-inflammatory, anti-viral
(Satyanarayana et al., 1988, Huang et al., 2003, Kassuya et al., 2006)

7
Class Compound Activities Reference
Nirtetralin Anti-inflammatory, anti-viral
(Satyanarayana et al., 1988, Huang et al., 2003, Kassuya et al., 2006)
Phyltetralin Anti-inflammatory (Satyanarayana et al., 1988, Kassuya et al., 2006)
Lintetralin (Satyanarayana et al., 1988)
2,3-desmethoxy seco-isolintetralin
(Singh et al., 1989)
2,3-desmethoxyseco-isolintetralin diacetate
(Singh et al., 1989)
Linnanthin (Singh et al., 1989) Demethylenedioxyniranthin
(Singh et al., 1989)
Nirphyllin (Singh et al., 1989) Phyllnirurin (Singh et al., 1989) Seco-4-hydroxylintetralin
(Satyanarayana et al., 1988)
Seco-isolariciresinol trimethyl ether
(Satyanarayana et al., 1988)
Hydroxyniranthin, (Satyanarayana et al., 1988)
Methylenedioxybenzyl-3',4'-
(Satyanarayana et al., 1988)
dimethoxybenzylbutyrolactone
(Satyanarayana et al., 1988)
cubebin dimethyl ether (Elfahmi et al., 2006) Urina tetralin (Elfahmi et al., 2006)
Tannin Geraniin ACE-inhibitor, anti-viral (Huang et al., 2003) Repandusinic acid Anti-viral (Ogata et al., 1992) Corilagin (Colombo et al., 2009) Isocorilagin (Than et al., 2006) Gallic Acid ACE-inhibitor (Than et al., 2006)
Other 1-O-galloyl-6-O-luteoyla-D-glucose
Anti-malaria (Subeki et al., 2005)
β-glucogallin Anti-malaria (Subeki et al., 2005) Niruriside Anti-viral (Qian-Cutrone et al.,
1996) β-sitosterol (Subeki et al., 2005)
Adapted from Calixto et al. (1998)

8
1.2.2 Pharmacological properties of Phyllanthus niruri L
Studies exploring the pharmacological properties of Phyllanthus niruri L and exploiting its
biological effects are available from a number of sources for both in-vivo and in-vitro
experiments. Within the hepatobiliary studies, the plant extracts showed a significant effect
as a hepatoprotective agent. The early report on the pharmacological activity of Phyllanthus
niruri L revealed the hepatoprotective activity of Phyllanthin and Hypophyllantin isolated
from the hexane extract of the whole plant (Syamasundar et al., 1985). Sabir and Rocha
(2008) identified that the aqueous extract demonstrated a protective effect against
paracetamol-induced liver damage in mice, which was shown by the significant decrease of
hepatic enzymes after 7 days oral administration of the extract. The Aqueous extract of
Phyllanthus niruri L was also reported to show antioxidant activity by the decreased effect of
lipid peroxidation marker level: thiobarbiturate acid-reactive substance (TBARS). The
marker, observed from liver, brain, and kidney of mice underwent a sodium nitroprusside-
induced DNA damage, was significantly decreased by the presence of the extract, thus
eliciting the hepatoprotective, neuro protective, and renal protection of Phyllanthus niruri L
crude extracts (Sabir and Rocha, 2008).
Phyllanthus niruri L has also been studied for its anti-viral effects. The aqueous extract
suppressed the binding of hepatitis B antibody (anti-HBs) to hepatitis B antigen (HBsAg),
which indicated the ability to bind the Hepatitis B surface antigen (Venkateswaran et al.,
1987). The extract also demonstrated a dose-dependent inhibitory activity towards DNA
polymerase (DNAp), which is responsible for DNA synthesis and is closely related to the
severity of the disease (Venkateswaran et al., 1987). From an in-vivo study, using
woodchucks infected with Woodchuck Hepatitis Virus (WHV), oral administration of an

9
aqueous extract significantly decreased the Woodchuck hepatitis B antigen (WHsAg) and
WHV DNAp titers to the undetected levels (Venkateswaran et al., 1987).
Looking back at the long history of the ancient medicinal practice, this plant is famous for
the elimination of renal stone and, accordingly, named as ‘renal stone breaker’ remedy. Not
surprisingly, Phyllanthus niruri L activity in the treatment of urolithiasis has become one of
the areas of interest for researchers for over the past 50 years. Yadaf and co-workers (2011)
suggested that the action of Phyllanthus niruri L in preventing renal stone formation can be
attributed to the diuretic, anti-spasmodic and vaso relaxant effects of the extracts. The
aqueous extract of Phyllanthus niruri L demonstrated a potency in inhibiting the growth of
matrix calculus and reduced the formation of stone satellites, thus prevents the
development of crystal growth (Freitas et al., 2002). Although the same study reported that
Phyllanthus niruri L extracts showed no effect on the urinary excretion of calculus promoter
elements (calcium and oxalate) or protective elements (citrate and magnesium), the
extracts significantly increased the concentration of glycosaminoglycans (GAGs). The higher
level of GAGs is correlated to the larger size of calculi formation. Accordingly, the result
suggested that the anti-lithogenic effect of Phyllanthus niruri L extracts is not related to the
inhibition of these substances, but might be attributed to the alteration of crystal adhesion
to the epithelium due to the modification of the binding sites of crystal surface (Campos and
Schor, 1999, Freitas et al., 2002).
In the case of its anti-malarial activity, based on one in-vivo study, alcoholic extracts of this
plant have demonstrated a strong anti-plasmodia activity (Totte et al., 2001, Cimanga et al.,
2004, Mustofa et al., 2007). At a dose of 200 mg/kg/day, ethanol and dichloromethane
extracts significantly decreased mice parasitemia rate to more than 50% fall against

10
Plasmodium berghei (Totte et al., 2001). A Further study confirmed the efficacy of the
methanol and aqueous extracts against Plasmodium berghei with the half maximal
inhibitory dose (IC50) of 9.1 mg/kg/day and 20 mg/kg/day, respectively (Mustofa et al.,
2007). An In-vitro study was conducted to evaluate the efficacy of methanol extract against
Plasmodium falciparum, and the result demonstrated a potent inhibition effect with IC50
range of 2.3 to 3.9 µg/ml (Mustofa et al., 2007).
Methanol extracts of the aerial part of the plant was confirmed to have a potency in
lowering blood glucose in diabetic rats as well as preventing the sudden increase of
postprandial glucose level. The research also suggested that the extract may possess
antioxidant and protective effects towards pancreas damage (Okoli et al., 2010). This study
was in line with the previous work that reported anti-hyperuricemic effect of methanol
extracts, demonstrated by the inhibition of xanthine oxidase activity (Murugaiyah and Chan,
2009). In another study, conducted by Okoli and co-workers (2009), the extract increased
the rate of wound healing, which was shown by the acceleration of wound contraction,
epithelialization, and granuloma tissue formation. The author proposed that the wound
healing effect is associated with the migration, proliferation, and the activity of epithelial
cells and myofibroblast cells, which are known to play major roles in epithelialization and
wound contraction. Moreover, the healing process showed the formation of granuloma
tissue, which indicates the activity of peptide growth factors secreted by macrophages, thus
stimulating fibroblast proliferation and angiogenesis. Taken together, these findings
suggested the efficacy of methanol extracts of Phyllanthus niruri L. on the tissue
regeneration process (Okoli et al., 2009).

11
In the same study, Okoli and co-workers (2009) reported that the extract strongly inhibited
indomethacin-induced gastric ulcer formation. The mucosal damage protective effect
implies the role of methanol extracts of Phyllanthus niruri L in prostaglandin metabolism.
Indomethacin, a non-steroidal anti-inflammatory agent, inhibits prostaglandin synthesis via
the arachidonic pathway. Therefore, it has been suggested that the extract enhances
prostaglandin synthesis followed by an increase in the activity of the mucosal defensive
factor to ultimately inhibit ulcer formation.
Furthermore, the anti-cancer effects of Phyllanthus species have been mentioned in a
number of manuscripts, which reported that extracts from several species possessed the in-
vitro growth inhibitory activity against cancer cell lines, including renal cancer (Ratnayake et
al., 2008), hepatocellular cancer, and lung cancer (Pinmai et al., 2008). Moreover, some
authors have specifically described the efficacy of Phyllanthus niruri L as anti-cancer agents.
Indeed the aqueous and methanol extracts of Phyllanthus niruri L expressed an inhibitory
effect against the human melanoma cell line (MeWo), prostate cancer cell line (PC-3), lung
cancer cell line (A549), and breast cancer cell line (MCF-7) (Tang et al., 2010, Lee et al.,
2011) , of which the methanol extracts showed a better inhibitory activity compared to the
aqueous extract. For example, the IC50 of aqueous extract against MeWo cell line was 260 ±
2.4 µg/ml while the IC50 of methanol extract was 153.3 ± 2.6 µg/ml (Tang et al., 2010). A dry
extract of this plant also presented a significant effect in inhibiting the growth of human
hepatocellular carcinoma cells (HepG2 and Huh-7) this was suggested to be brought about
by the apoptotic effect of the extract (de Araújo Júnior et al., 2012).

12
Taken together, the various studies conducted on the biological activities of Phyllanthus
niruri L extracts have given scientific evidence for its medicinal effects, which is consistent
with the traditional application of this plant (de Araújo Júnior et al., 2012).
1.2.3 Mechanism of action of the isolated compounds
Despite a wide range of medical activity of Phyllanthus niruri L crude extracts and the rich
amount of secondary metabolites contained in Phyllanthus niruri L that have been
discovered, there is only a limited number of publications, available to date, which explain
the mechanism of action of the medicinal compounds isolated from this plant.
1.2.3.1 Antiplatelet activity
One of early reports of the isolation and purification of Phyllanthus niruri L constituents was
conducted by Ueno and co-workers (1988). This group isolated the medicinal compounds by
a bioassay-guided isolation method to identify the most active compounds which exhibit the
activity of the angiotensin-converting enzyme (ACE) inhibitors. The enzyme is known as an
important player in the regulation of blood pressure. Accordingly, the inhibitory effect
shown by the crude extracts is a promising starting point to the discovery of natural-based
anti-hypertensive agent. There are three active compounds that presented the activity
towards ACE inhibition; geraniin, ellagic acid, and gallic acid. However, the efficacy was far
from a satisfactory result compared to captopril, a well-known ACE-inhibitor agent (Ueno et
al., 1988). From this point, study on discovering and exploring this extract activity upon
cardiovascular system has not shown a significant result. In 2006, Kassuya and co-workers
assessed the anti-inflammatory effect of lignans isolated from the hexane extracts of
Phyllanthus amarus, a-closely-related species of Phyllanthus niruri. The result suggested that
the lignans and niranthin, significantly reduce the inflammatory activity, characterised by

13
the low rate of Platelet Activating Plasma Factor (PAF)-mediated inflammatory reaction. PAF
is a pro-inflammatory phospholipid that plays a role in cardiovascular diseases, which
activation of the corresponding cascade involves the receptor that belongs to G-protein
coupled receptor, membrane calcium uptake, and phosphate metabolism (Nakamura et al.,
1991, Mazer et al., 1992). However, until now, there are no clear reports of a tangible
mechanism for the cardiovascular activity of these compounds.
Moriyama and co-workers (2002) were the first to report the anti-platelet activities of
methanol extract derived from Phyllanthus niruri L. The extract inhibited 30% and 50% of in-
vitro platelet aggregation induced by collagen (2 µg/ml) and ADP (5 µg/ml), respectively,
using the extract concentration of 1.5 mg/ml. When the concentration of the extract was
doubled, the inhibition of platelet aggregation induced by ADP or collagen was more than
80% compared to the control groups. The efficacy to inhibit platelet aggregation suggested a
receptor-binding activity because ADP and collagen stimulate platelet activation via distinct
specific receptors on platelet membrane (Iizuka et al., 2006).
Later, the same group isolated methyl brevincarboxylate from the methanol extract of
Phyllanthus niruri L and suggested that it possessed a potent ability to inhibit platelet
aggregation (Iizuka et al., 2007). Although the report suggested that the inhibitory activity
may involve platelet-receptor inhibition and platelet calcium mobilization, the exact
mechanism of anti-platelet effect of Phyllanthus niruri L is yet to be explained.
1.2.3.2 Anti-malarial activity
From the study of anti-malaria screening of crude extracts of Phyllanthus niruri L, Subeki and
co-workers (2005) isolated 1-O-galloyl-6-O-luteoyl-α-d-glucose from an aqueous extract,
which demonstrated a strong inhibitory activity against Plasmodium falciparum growth in-

14
vitro, with the IC50 of 1.4 µg/ml (Subeki et al., 2005). The same study also successfully
identified several compounds from the fractionation of an aqueous extract. Some
compounds that have been identified were quercetin 3-O-β-d-glucopyranosyl-(2→1)-O-β-d-
xylopyranoside, β-glucogallin, β-sitosterol, and gallic acid. All of those compounds showed
an inhibitory effect towards Plasmodium falciparum growth. Nonetheless, the study has not
been able to elucidate the mechanism of inhibition of the active compounds.
Figure 1.2 – Chemical structures of anti-plasmodial compounds from Phyllanthus niruri L
1-O-galloyl-6-O-luteoyl-α-d-glucose
Quercetin 3-O-β-d-glucopyranosyl- (2→1)-O-β-d-xylopyranoside β-glucogallin
β-sitosterol
Gallic acid
15
1.2.3.3 Anti-cancer activity
As a potential source of new anti-cancer agents, Phyllanthus niruri L extracts have shown
significant potency to inhibit in-vitro cancer cell proliferation. However, until recently, the
active compounds isolated from Phyllanthus niruri L have not been tested for anti-cancer
activities, although the secondary metabolites contained in the plant are known to possess
one or more actions towards cancer cell lines, some of which including classes of lignans,
flavonoids, and terpenes (Nobili et al., 2009, Mills et al., 1995).Tang and co-workers (2010)
suggested that the cytotoxic property might correspond to the presence of polyphenol
compounds such as ellagitanin, gallo tannins, flavonoids, and phenolic acid, as the rich
constituent of the methanol and ethanol extracts. Moreover, ethanol extracts showed an
ability to alter the cancer cell cycle by the induction of apoptosis through caspase activation
in melanoma and prostate cancer cells. It has also been reported that the extract prevented
the progression of cancer by impeding the metastatic activity, in human lung and breast
cancer (Lee et al., 2011).
1.3 Platelet and its role in cardiovascular diseases
Platelets are small blood cells derived from megakaryocytes with a diameter 3.0 x 0.5 µm
and mean volume of 7-11 femtoliter (fl). Mature platelets are produced by the
fragmentation of megakaryocytes in bone marrow releasing anucleated discoid cells, which
are then released into the circulation. The normal platelet life span is 7-10 days and
afterward will be cleared in the spleen and liver. In haemostatic processes, platelets play
essential roles in the maintenance the physiologic condition of the circulatory system. This
occurs as a result of a series of coagulation cascade events that are initiated by the platelet
activation, followed by the release of platelet granule contents and subsequent platelet

16
aggregation (George, 2000). Therefore, platelet activation is the crucial stage in stopping
blood leakage due to the vascular damage. The initial events after vascular injury involve
platelet immobilisation at the damaged area, which causes platelet to be activated.
Substances such as collagen and von Willebrand factor (vWF) which are located in the
vascular sub-endothelial layer are exposed, following vessel damage, and stimulate platelet
adhesion to the area of injury. Platelets are connected to collagen and other agonists
through glycoproteins (GP) receptors on the platelet surface. Such binding will further
expose other glycoproteins and lead to platelet aggregation (Hoffbrand and Moss, 2011).
The purposes of these events are to build a primary platelet plug and prevent blood leakage
from small vessel injury. Activated platelets also act as the initiator for blood coagulation
process to stop massive blood loss due to medium and large vessel damage through the
formation of secondary thrombotic plugs (Russel et al., 1982).
1.3.1 Platelet activation
Platelet activation is a complex cascade involving interactions between various biochemical
agonists with specific receptors in platelet plasma membrane. The first response in primary
haemostasis, or the forming of primary platelet plugs, is platelet adhesion at the site of
vascular damage. This event is initiated by platelet binding to vWF and collagen of sub-
endothelium via GPIb-IX-V and GPVI receptors that will attract more circulating platelets to
come to the injury site. Another collagen receptor, GPIa-IIa, also mediates direct platelet
attachment to the vessel wall that strengthens platelet adhesion and stimulates platelet
activation.
The next event following the interactions between pro-coagulant substances and their
corresponding receptor on the platelet surface is the alteration of cytoskeleton protein

17
formation in platelet cytoplasm, hence trigger the transformation of platelet shape. Before
activation, circulated resting platelets have an irregular discoid shape. Signalling cascade
initiated by platelet agonists, such as collagen, induce actin and myosin contraction in a
platelet cytoplasm, which lead to the protrusions of cytoplasm to form dendritic
pseudopodia. As a result, activated platelet is transformed into a spherical shape with
several long pseudopodia. These protrusions eventually facilitate firm adhesion to the
vascular wall due to the increase of the platelets surface area, on which a range of receptors
is located. Subsequently, platelet signalling cascade activates GPIIb/IIIa receptors and causes
the receptor to adopt a high fibrinogen binding affinity which is important to platelets cross-
linking to fibrinogen and further platelet aggregation process.
Figure 1.3 – Platelet activation scheme
Vascular injury exposes vWF and collagen on the vascular subendothelial, and initiates platelet adhesion to the injury site via glycoprotein receptors on the platelet surface. This event is followed by transformation of platelet shape and subsequent binding to fibrinogen, which act as a bridge for attaching other circulating platelets. The overall event is known as platelet activation. Activated platelets release cytoplasm granule contents into circulation, including platelet agonists such as ADP and thromboxane A2 that stabilise and amplify platelet aggregation and thrombus formation. Anti-platelet drugs are targeting specific receptors on platelet activation thus preventing platelets from being activated and aggregated (Jurk and Kehrel, 2005).

18
1.3.2 Platelets release reaction
As a result of platelet activation, various substances are released from platelet secretory
granules into circulation. Secretion of these contents is facilitated by the surface-connected
canalicular system in platelet plasma membrane through membrane invagination. The
canalicular system captures nearby cytoplasmic granules, followed by the discharge of
granule contents into plasma. There are two classes of secretory of granules in the platelet
cytoplasm: alpha granules and dense granules (George, 2000). Alpha granules, the most
common granules; contain clotting factors such as vWF, platelets-derived growth factor
(PDGF), platelet factor 4, fibrinogen, albumin and Immunoglobulin. The less common
granules, dense granules, contain adenosine diphosphate (ADP), adenosine triphosphate
(ATP), serotonin and calcium (Hoffbrand and Moss, 2011). These substances are responsible
for further platelet recruitment at the injury site as well as facilitating further platelet
activation (Figure 1.3).
In particular, alpha granules store platelet adhesive factors while secretion of dense granule
contents plays a key role in formation of secondary thrombotic plug. There are two crucial
platelet glycoproteins which are distributed on the membrane of alpha granules; P-selectin
and GPIIb/IIIa (Stenberg et al., 1985b). Although P-selectin is also reported to be seen along
the membrane of dense granule (Israels et al., 1992). Immediately after platelet activation,
P-selectin and GPIIb/IIIa is redistributed and rapidly expressed on platelet plasma
membrane. P-selectin is known as a member of selectin family of vascular cell surface
receptors, and it mediates platelet adhesion to neutrophils (McEver et al., 1995). In the
event of platelet aggregation, GPIIb/IIIa is a one of the pivotal adhesive molecules which
recruit circulating platelets to the growing thrombus via fibrinogen bridging. Moreover,

19
activation of GPIIb/IIIa will initiate further platelet signalling cascade which amplify the
overall process of platelet aggregation.
Some molecules that are released from platelet granules, such as ADP and serotonin, are
potent platelet agonists. ADP plays various roles in platelet activation and aggregation via
different receptors on the platelet surface. Through binding with P2Y1-receptor, ADP is
responsible in mobilization of calcium ions, initiation of platelets shapes transformation, and
temporary platelet aggregation (Jin et al., 1998, Cattaneo and Gachet, 1999). Moreover,
ADP binding to P2Y12 receptor enhances the secretion dense granule contents and
formation of irreversible platelet aggregation (Dorsam and Kunapuli, 2004, Jin et al., 1998).
In addition to ADP, serotonin, known as one of the potent platelet agonists, work together
with ADP to strengthen the platelet activation response (Jurk and Kehrel, 2005).
Moreover, endoplasmic reticulum (ER) and dense granules release calcium ions (Ca2+) which
are essential trigger of platelet activation. Extracellular Ca2+ concentration shows a strong
correlation with platelet binding to fibrinogen. High levels of Ca2+ concentration increases
platelet binding to fibrinogen in the absence of other agonists such as ADP, thus initiating
platelet aggregation (Hu et al., 2005). On the other hand, intracellular Ca2+ concentration
that rises after platelet activation also contributes to platelet shape change due to kinase
enzyme activity in phosphorylation of the myosin-light-chain in platelet cytoplasm. This is
related to Thromboxane A2 (TXA2) synthesized from platelet phospholipid that, in turn,
increases intracellular Ca2+ concentration by the inhibition of cyclic adenosine
monophosphate (cAMP) production.
TXA2 and thrombin are platelet agonists that are generated locally on the activated platelet
surface (Brass, 2003). In general, these two agonists also act to initiate platelet activation;

20
through the rearrangement of the platelet cytoskeleton, which facilitates the shape change
of platelets. In recent studies, thrombin shows the activity to activate protease-activated
receptor (PAR) family, such as PAR-1 and PAR-4 on platelets surface, subsequently initiating
platelet activation. In the end, these receptors also inhibit cAMP formation and increase
intracellular Ca2+ concentration (Brass, 2003)
1.3.3 Platelets aggregation
Platelet aggregation is characterised by the accumulation of cross-linked platelets through
active GPIIb/IIIa receptor with fibrinogen bridges (Jurk and Kehrel, 2005, Hoffbrand and
Moss, 2011). Subsequently, activation of GPIIb/IIIa receptors on platelets membrane brings
about important events for platelet aggregation. There is a significant increase of GPIIa/IIIb
receptor numbers in response to platelet stimulation. Resting platelets express around 50-
80,000 GPIIb/IIIa receptors, which have no activity to soluble fibrinogen or other ligands, but
are able to bind immobilized fibrinogen (Hoffbrand and Moss, 2011). During platelet
activation, alpha granule exocytosis and fusion with plasma membrane release GPIIb/IIIa
molecules on platelets surface. This event also activates the surface-exposed GPIIb/IIIa and
enables soluble fibrinogen to bind at the active sites. Furthermore, fibrinogen, which is
attached to activated-platelet, binds the inactive GPIIb/IIIa on circulating platelets and
causes further platelets recruitment and enhances the aggregation process (Jurk and Kehrel,
2005). Figure 1.4 below describes the role of platelet surface receptors in platelet activation
and aggregation.

21
Figure 1.4 – Platelet surface receptors in platelet activation and aggregation
Receptors on the platelet surface induce platelet activation after binding with particular platelet agonists. This event leads to secretion of platelet granules and changes of platelets shape and, in the end, activate GPIIb/IIIa receptor (or known as αIIbβ3 integrin) to enable platelets cross-linking through fibrinogen binding (Storey, 2008).
1.3.4 Platelet signalling cascade
Platelet activation and aggregation signalling cascade can be initiated by various platelet
agonists. Each agonist, in particular, must interact to specific receptor on platelet surface to
initiate further signalling events of platelet activation. In general, the signalling process can
be classified into 3 stages. The first event is the interaction of agonists with their respective
platelet receptors which mediate early platelet activation signalling. The second stage is the
intermediate signalling cascade, which is a common signalling process shared by all platelet
agonists. The last stage is integrin activation which involved the so-called inside-out and
outside-in integrin signalling (Li et al., 2010).

22
In physiologic condition, for example following vascular injury, platelet adhesion receptors
play a pivotal role in initiating platelet signalling events through the interaction of platelet
adhesion molecules, GPIb-IX-V complex and GPVI, to the exposed sub endothelial collagen
and vWF. Despite differences at the membrane receptor level, several major platelet
adhesion receptors share many similarities at downstream signalling cascade. Collagen and
vWF binding to their receptors initiate platelet signal transduction via Src family kinases
(SFKs), phosphoinositide 3-kinases (PI3Ks) and the immunoreceptor tyrosine-based
activation motif (ITAM) signalling pathway (Li et al., 2010). The cross-linking of GPVI by
collagen lead to the phosphorylation ITAM within the Fc receptor γ chain (FcRγ), which is
noncovalently bound to cytoplasmic tail of GPVI, by SFKs (Lyn and Fyn) (Ezumi et al., 1998).
Interaction of VWF with GPIb-IX-V also initiates platelet activation via phosphorylation of
ITAM receptors (FcRγRIIA or FcRγ) (Wu et al., 2001). Moreover, cytoplasmic domain of GPIb
alpha chain can interact with SFK (Lyn) and PI3Ks for transmitting signal from this receptor.
SFK Lyn is required for activation of PI3K and its downstream effectors. In common, these
overall events, initiated by GPVI or GPIb-IX-V complex, lead to the activation of tyrosine
kinase Syk which is followed by phosphorylation of its downstream targets, activation of
phospholipase Cγ (PLCγ) 2, synthesis of TXA2, secretion of platelet granule contents, and
integrin activation.
Soluble platelet agonists, such as Trombin, TXA2, serotonin, and ADP, are released into
circulatory system from stimulated platelet. These agonists are crucial to amplifying the
signal from the initial stimuli. These agonists work via G-protein-coupled receptors (GPCRs),
a family of 7-transmembrane domain receptors that transmit signals through heterotrimeric
G protein (Li et al., 2010). There are 3 subunits that build the structure of heterotrimeric G
protein; α, β, and γ subunit. After receptor binding to its ligand, α subunit is activated and

23
subsequently dissociated from the α/β/γ complex. The Gα subunit is the main effector for
transmitting the signals via interaction with downstream targets, although Gβ/γ complex
can also interact with and activate downstream effectors, including PI3Kγ (Stephens et al.,
1997). There are four subfamilies of G protein according to the similarities of α subunit :
Gq/G11, G12/G13, Gi/Go/Gz, and Gs (Offermanns, 2006b). Activation of platelet G protein
(Gq, G13, Gi, and Gs) lead to the phosphorylation of their downstream targets. Among other
G proteins, Gq is the main effector for GPCRs-mediated platelet signalling. Activation of Gq
lead to the activation of PLCβ, production of second messenger IP3 and DAG, increase of
platelet intracellular Ca2+ concentration, platelet granule secretion, integrin activation,
platelet shape transformation, and consequent platelet aggregation (Li et al., 2010). Equally
important, other G proteins also play critical role in promoting and regulating platelet
signalling cascade. The role of Gi-coupled receptor in initiating platelet activation is mainly
via SFKs and PI3K pathways. In addition, Gi protein inhibits the effect of cAMP-dependent
protein kinases on platelet activation, which is known to counteract platelet activation
signalling cascade (Li et al., 2010). G13 protein initiates platelet shape change and platelet
granule secretion through the activation of small G-protein RhoA which activates Rho
kinase, leading to phosphorylation myosin light chain. On the contrary, Gs protein is coupled
with physiologic platelet inhibitor receptors, IP receptor, which mediates inhibitory signals
by stimulating adenylyl cyclase-dependent cAMP synthesis (FIGURE).

24
Figure 1.5 - GPCR-coupled platelet activation signaling
GPCRs binding to platelet agonists initiate platelet signalling cascade via activation of G proteins, followed by a complex cascade involving the activation of PLCβ , SFKs and PI3Ks pathways, Rho proteins, and activation of PKC. Ultimately, the overall event will lead to the elevation of platelet intracellular calcium level, the release of granule contents, platelet shape transformation, and activation of integrin αIIbβ3 (Li et al., 2010)
The initial signalling of platelet activation induced by various stimuli, either via platelet
adhesive receptors or GPCRs, converge into a common signalling pathway. In general, there
are 3 signalling events which are shared by almost all agonists; elevation of intracellular
calcium level, activation of protein kinase C (PKC), and granule secretion. Almost all agonists
induce the activation of PLC, which is responsible for the hydrolysis if IP3 and DAG, leading
to calcium mobilization and activation of PKC. At the end, the rise of platelet intracellular

25
calcium level will regulate multiple signalling events, including actin-myosin interaction,
TXA2 synthesis, granule secretion, and SFKs and PI3K/Akt signalling pathway (Li et al., 2010).
The final signalling event during platelet activation cascade is the activation of major
platelet integrin, αIIb/β3, or GPIIb/IIIa. Integrin is heterodimeric (αβ) type I transmembrane
receptor. Each of α and β subunit spans on plasma membrane, and contain an extracellular
part (the relatively large domain), a single-pass transmembrane domain, and a short
cytoplasmic tail (Bennett et al., 2009). Resting platelet membrane express GPIIb/IIIa with a
low affinity/avidity for capturing fibrinogen. Immediately after platelet activation, signals
from platelet agonists will activate the so-called inside-out and outside-in signalling which,
in overall, referred to as platelet integrin signalling (Shattil et al., 1998). Inside-out signalling
denotes the signalling events initiated by the binding of one or more agonists to their
respective plasma membrane receptors which lead to the conversion of GPIIb/IIIa to its high
affinity/avidity forms (Shattil and Newman, 2004). The transformation GPIIb/IIIa involves
two characteristics of integrin active state; high affinity and high avidity. Affinity modulation
refers to the structural change of the integrin heterodimer which results in a greater
strength of ligand binding, while avidity modulation implies a functional change of the
interaction between receptor and ligand due to chelate or rebinding effects (Shattil et al.,
1998). After adapt a high affinity/avidity state, GPIIb/IIIa initiates outside-in signalling by
integrin ligation and clustering, in coordinating with signals emanating from other plasma
receptors, including GPCRs. The activated GPIIb/IIIa, by binding to its ligands (fibrinogen,
vWF, and many matrix proteins), play important role in regulating postligand binding events,
including stabilisation of large platelet aggregates, platelet spreading, granule secretion, clot
retraction, and platelet procoagulant activity (Peerschke, 1995). Ultimately, outside-in

26
signalling is a determinant of the size of hemostatic plug or a pathological thrombus (Shattil
et al., 1998)
Figure 1.6 - Platelet integrin activation
(A) The inactivated αIIb/β3, or GPIIb/IIIa, is predominantly in resting platelet, where the integrin has a low affinity/avidity toward its ligand. Upon platelet activation, signals from agonists initiate the inside-out signalling, which lead to the conversion of the integrin heterodimer structure and increase its affinity/avidity for ligand binding. (B) The GPIIb/IIIa binding to its ligand (such as fibrinogen) commence the signal complex via the so-called outside-in signalling, which amplify the platelet activation and aggregation signals and, ultimately, determine the final size of platelet aggregates (Shattil and Newman, 2004)
1.3.5 Bleeding disorder
Alteration of haemostasis pathways is characterised by abnormal bleeding manifestations.
One of the frequent causes of abnormal bleeding is thrombocytopenia or low platelet count
as a result of either failure of platelet production or increase of platelet destruction. Bone
marrow suppression, in general, is the common cause of blood cell count depletion, which is
related to genetic disorders, radioactive exposures, infections or drug toxicology. However,
thrombocytopenia due to platelet destruction is also a crucial cause of sudden bleeding
disorder that without a proper management, can lead to serious haemorrhagic

27
complications (Matei and Schiller, 2002). Immunologic reaction is known as the main
mechanism in platelet destruction (Porcelijn and Kr von dem Borne, 1998).
Platelet membrane expresses a range of glycoproteins, which are able to induce serologic
reactions in the presence of corresponding antibodies that lead to destruction of platelets.
The trigger of antibody production may come from various aspects such as autoimmune
(idiopathic thrombocytopenic purpura), infections (malaria, dengue or HIV), exposure to a
foreign platelet antigen (post-transfusion purpura), and drugs-induced immune
thrombocytopenia (quinine, quinidine and heparin).
Antibodies for platelets are usually bind to GPIIb/IIIa, GPIa/IIa and GPIb-IX-V complex, as the
main target antigens on platelets surface (Hoffbrand and Moss, 2011, Hegde, 1992, Kelton
et al., 1988, Visentin et al., 1991). Consequently, platelet-coated-antibody is recognized as a
must-degradable product that must be cleared through intravascular autolysis,
complement-mediated cytolysis or macrophage cells in spleen and liver (Matei and Schiller,
2002). Therefore, the understanding of this platelet auto-destruction mechanism has
directed the development of new drugs for immune-mediated thrombocytopenia to the
inhibition of antibody interaction with these platelet glycoprotein receptors.
1.3.6 Thrombotic diseases
Coagulation disorders have a strong correlation with platelet activation processes.
Overreaction of platelet activation, including platelet adhesion and aggregation, causes
undesired coagulation that leads to uncontrolled thrombus formation. Upon certain
conditions, these unwarranted thrombi may be broken away from their primary locations
and travel within blood circulation. This event might result in serious consequence when the
clots reach the small vasculature and obstruct blood flow to distal arteries or veins.
28
Accordingly, it is known as the basic mechanism of thrombotic diseases such as myocardial
infarction, deep-vein thrombosis and other cerebrovascular diseases.
Adhesive factors on the platelet surface are also essential contributors to this event.
Therefore, platelets surface receptors, which act as initial stimuli for platelet's adhesion and
aggregation, have been intensively studied in the research of the development of
antiplatelet drugs (Jennings, 2009). Recent studies have demonstrated the efficacy of
GPIIb/IIIa inhibitor as a potent antiplatelet therapy (Peter et al., 1999). Other platelet-
surface-receptor inhibitors that are targeted to P2Y12 and protease-activated receptor
(PAR)-1, which are known as the specific receptor for ADP and thrombin, have
demonstrated a contribution to halt platelet activation pathway and to prevent the
occurrence of thrombotic diseases (Jennings, 2009, Dorsam and Kunapuli, 2004).
1.4 Cancer and the alteration of the cell cycle
From the beginning of cell development to the mature cell life cycle, there is a natural
mechanism to maintain the balance and harmony between cell division and cell death. Such
arrangements are tightly controlled by intricate genetic control systems, which play roles in
the responses to various growth signals, growth-inhibiting signals, and death signal (Lodish,
2008). The failure of the mechanisms that control cell growth and proliferation is a key
factor in cancer. The main factor affecting a cell’s ability to escape the cellular regulation is
genetic damage, which is very often related to the effects of tumour-promoting chemicals,
hormones, and virus (Lodish, 2008).
To date, there are three broad classes of gene that have been identified to be related to the
development of cancer. The first class is known as proto-oncogenes (for example: ERBB2 in

29
breast cancer (Révillion et al., 1998), c-myc in leukaemia (Allen et al., 2014), and myc in lung
cancer (Larsen et al., 2015)) that usually promote normal cell growth. When mutations
occur in these types of genes, they can transform into oncogenes, which have limited
control of their function and have a tendency to be excessively active in promoting cell
growth. The second class of genes are tumours-suppressor genes (for example: KRAS and
p53 (Aguda, 2014)), which are important in restraining cell growth. In normal conditions,
these genes work as surveillance genes that detect any genetic errors produced during cell
duplication, and prevent the cells further progress in the cell cycle process by sending the
cells into arrest. Any mutations that occur in these genes may halt their normal function,
thus allowing the unregulated cells to continue their proliferation and survival. The third
class are known as caretaker genes (for example: BRCA1 and BRCA2 (Venkitaraman, 2002)),
that normally protect the integrity of the genome. The mutation of the caretaker genes can
lead to the accumulation of mutation in the affected genes. Overall, these three classes of
genes are crucial in regulating cell proliferation and the cell cycle, programmed cell death or
apoptosis, and encoding protein for DNA repair (Lodish, 2008)
1.4.1 Carcinogenesis
The uncontrolled growth of cells that leads to the formation of an undifferentiated group of
cells is known as tumours. The cells possess a tendency to be cancerous when they show a
metastatic ability to invade and spread to the other parts of body tissue through blood or
lymphatic circulation. This condition is very often followed by the formation of secondary
malignant mass of tumours, which are usually located far away from the primary mass. This
stage is known as cancer, which defines the condition or group of diseases arising from
uncontrolled cell growth, which express a high speed of growth and metastatic ability.

30
No exact conclusion has been made to explain the main causes of cancer, as it is such a
complex process. The development of this disease is known as carcinogenesis, which can be
separated into three distinct phases: initiation, promotion, and progression (Gescher et al.,
1998). The initiation of cancer starts when normal cells are exposed to a carcinogen, for
example, ultraviolet (UV) light, a virus, or carcinogenic compounds. This exposure might
cause cellular changes, such as DNA alteration, gene mutation, and cell damage. As a result,
normal cells may undergo irreversible transformation into an abnormal cell (initiated cell).
At this point, the newly transformed cell population is harmless and may remain as benign
tumour without any further development to a cancerous state. Yet it can be enhanced in
terms of cellular proliferation and genetic changes. In certain circumstances, the initiated
cell may go through a promotion and progression process. Promotion is a reversible process
involving clonal expansion of initiated cells induced by mutagens. Promotion and
progression stages allow the propagation of cellular damage inflicted by initiation, resulting
in the proliferation of the damaged-cell to become a malignant or cancerous tumour. The
overall process of carcinogenesis can take a decades or more to move on to a more
cancerous stage (Pitot, 1993).
Hanahan and Weinberg (2011) mentioned six important hallmarks in cancer development,
as shown in Figure 1.7, which are derived from the initial changes in the physiology of
normal cells. In order to promote the malignant growth, all of these hallmarks have to
interact with each other. In normal cells, proliferation takes place by the stimulation from
appropriate growth factors. On the contrary, cancer cells develop the ability for self-
sufficiency in growth signals through the action of oncogenes, for example, the Ras
Pathway, that produces a large amount of mutated growth-stimulating proteins (Becker et
al., 2003).

31
In order to escape the growth-inhibiting mechanism, cancer cells have to possess the
insensitivity to anti-growth signals. As discussed in many publications, the dominant
checkpoint response for DNA damage is during late G1 phase. For example, through the
retinoblastoma (RB) protein restriction pathway (Kastan and Bartek, 2004). Mutation in the
RB gene leads to the disruption of the checkpoint response and allows the cancer cells to
escape the anti-growth signal (Giacinti and Giordano, 2006). Furthermore, cancer cells have
to escape programmed cell-death or apoptosis. This ability is conveyed by the mutation of
tumour suppressor genes, for example: p53 and BCL2 genes (Cory and Adams, 2002).
Consequently, these three properties of cancer cells allow the abnormal cells to continue to
proliferate in an uncontrolled manner. In order to maintain a limitless replication potential,
cancer cells develop a mechanism to maintain telomere length either by activating the gene
coding for telomerase or by the exchange of sequence information between chromosomes
(Blasco et al., 1997). Along with the increase of cell number and the size of cancer mass,
sufficient blood supply is also needed to ensure that every single cell is able to grow further.
Therefore, cancer cells must be able to trigger angiogenesis, the process of the growth of
new capillary blood vessels from the existing vasculature. Although the mechanism is not
well understood, a number of oncogenes are thought to be causative for the onset of
angiogenesis, for example p53 and RAS, and therefore responsible for building-up of the
cancer vascular supply (Rak and Yu, 2004).
The main difference between a tumour and cancerous cells is that cancer cells have invasion
and metastatic ability. There are three properties exhibited by cancer cells, which are crucial
in the metastatic ability: decreased cell adhesion, increased cell motility, and the production
of proteases that degrade the extracellular matrix and basal lamina (Becker et al., 2003).

32
Down regulation of E-cadherin, a transmembrane glycoprotein encoded by CDH1 gene,
which plays a key role in maintaining cell-cell adhesion, has been reported to be involved in
the invasion and metastatic ability of cancer cells (Huiping et al., 1999) (Liu and Chu, 2014).
Figure 1.7 – The six hallmark of cancer
The initiation of cancer starts from gene mutation which causes the affected cells to develop a sustaining proliferative signalling and escape growth suppressor signals. This event enables the cells to grow rapidly in an uncontrolled manner, as well as to possess the ability to escape apoptosis or cell death. Furthermore, the mutations can also give rise to the dysfunction of replication enzymes, which causes cancer cells to have limitless replication ability. Cancer cells also express a self-controlled angiogenesis capacity and exhibit the ability for invasion and metastasis (Hanahan and Weinberg, 2011)
1.4.2 Cell cycle
With regard to the mammalian cellular reproductive system, cell division is a crucial process
to replenish essential cells that are restricted to a certain lifespan. The process must be
The Hallmark of Cancer
sustaining proliverative
signaling
Evading growth
suppressors
Inducing Angiogenesis
Activating Invasion and metastasis
Enabling replicative
immortality
Resisting cell death

33
carried out to a high level of accuracy, involving cell duplication that requires the precise
partitioning of genetic material and other cellular components to daughter cells. Any errors
that occur may lead to loss of genetic stability, which will have a serious effect on cell
survival. As mentioned earlier, DNA mutation and gene alteration play a major role in the
development of malignancy and, therefore, a failure to safeguard the cell division process
may result in the accumulation of genetic instability, which may ultimately increase the cells
vulnerability to genetic transformation. Accordingly, cells have evolved cell-duplication
strategies that includes redundant safeguards to prevent errors or to correct them (DeVita,
2011), in order to prevent any replication errors from being carried on into the next stage
of cell division, which will be inherited to the daughter cells.
The overall processes of the cell cycle is divided into four distinct phases, according to
Howard and Pelc (1951), that are eventually referred to as GAP1 (G1 phase), synthetic
phase (S-phase), GAP2 (G2 phase), and mitosis (M-phase). The observations made by these
investigators showed that the division of the cell is a series of events that do not occur
continuously, but in fact, contain a specific checkpoint that marks the transition from one
phase to the subsequent phase. When an error occurs, the safeguard mechanism will
automatically stop the cell cycle through the checkpoint-inspection process that prevents
the cell division to be continued and. As a result, this may give rise to cell rest and the
activation of the auto-destruction mechanism, which is known as apoptosis (Hartwell and
Weinert, 1989).
The crucial part of the genetic material partitioning events occurs from the early phase of
the cell cycle, the S-phase, when a single round of DNA synthesis is taking place. The
preceding and subsequent phases, G1 and G2, are the intervals in which all information

34
from internal and external environment is integrated, and provide important clues to
determine whether the cell cycle is able to proceed into the next phase.
Mitosis phase (M-phase) indicates the final genetic material division to be inherited to the
upcoming daughter cells. This process itself is subdivided into five phases: prophase,
prometaphase, metaphase, anaphase, and telophase. During prophase, when most of the
membranous internal compartments of the cells are disassembled and dispersed, the
chromatids (replicated chromosomes from S-phase) are condensed into paired-compact
rods, followed by the assembly of the bipolar microtubule spindles. At this stage, most of
the protein biosynthesis largely ceases. In prometaphase, chromosomes form bivalent
attachments to the spindle, which drives them to the cellular equator. Metaphase is
indicated by the proper alignment of the paired chromatids on the spindle. During
anaphase, the paired sister chromatids lose their interconnected cohesion, thus allowing
the tension from microtubule forces separates the chromatids and pulls them to the
opposite poles of the cells. The final process is telophase, when the nuclei and other
membrane structures reassemble, the chromosomes decondense, and protein synthesis
resumes. At the end of M-phase, the two daughter cells that contain a complete set of
genetic materials pull apart and separated, and this process in known as a cytokinesis
(DeVita, 2011).
As mentioned earlier, mammalian cells have developed a safeguard mechanism to protect
cells from mutation as a result of any errors during cell division. Numerous studies over the
last three decades have discovered pivotal regulators of the cell cycle, which are known as
cyclin-dependent kinases (CDKs) (Suryadinata et al., 2010). This group of enzymes are
binary, proline-directed, serine-threonine-specific protein kinases that consist of a catalytic

35
subunit, or CDK, that has little if any intrinsic enzymatic activity and a requisite positive
regulatory subunit known as a cyclin (DeVita, 2011). The structure of CDKs is similar to that
of other protein kinases and, likewise, CDKs promote cell cycle progression by
phosphorylating critical downstream substrates to alter their activity. Interestingly, there is
a difference of the CDKs regulatory functions between unicellular and higher organism. In
unicellular organism, the cell cycle is regulated by a single CDK protein, coupled with several
different cyclins, which are expressed at different cell cycle phases (Moser and Russell,
2000, Sherr and Roberts, 2004). On the contrary, in eukaryotic cells, this function is brought
about by different CDKs that associated with different cyclins.
Figure 1.8 – Cyclin-dependent kinase (CDK) functions in the cell cycle.
The cell cycle represents the process of cell division is divided into four phases; DNA synthesis (S) phase, mitosis (M) phase, and two gap (G1 and G2) phases. In mammalians, the regulatory function of the cell cycle is carried out by a number of different CDKs and cyclins (Suryadinata et al., 2010).

36
A number of studies conducted on mammalian cells have shown some combination of CDKs
and cyclins to be associated with certain phases of the cell cycle. As shown in figure 5, the D-
type cyclins in association with CDK4 and CDK6 are expressed during the progression of G1
phase, and important for the transition from G1 to S phase (Peters, 1994). The E-type cyclin
in complex with CDK2 is expressed during the transition of G1 to S-phase, and extends into
early S-phase (Hwang and Clurman, 2005). Cyclin A-CDK2 complex is expressed at the early
S-phase until the boundary of S/G2 phase (Pagano et al., 1992). Cyclin A is also known to be
associated with CDK1, formerly known as CDC2, and is important during the G2 phase
progression. Finally, cyclin B activates CDK1 during the progression of the cell cycle from G2
phase to enter M-phase, and lasts until the complex is degraded during anaphase (DeVita,
2011). Given the importance of cyclin–CDKs in mediating cell cycle progression, these
kinases are tightly regulated at several levels to ensure that cell cycle progression occurs
only under appropriate circumstances when cell division is required (Suryadinata et al.,
2010).
When errors are detected at a certain point in the cell cycle, the CDKs play a role in the
control mechanism used to detect and prevent the upcoming DNA mutation, which may
lead to a danger impact of the cell life cycle, by halting cell cycle progression or by initiating
programmed cell death (apoptosis) (Collins et al., 1997). In normal cells, the early
degradation of cyclin B-CDK1 complex upon the incomplete DNA replication or DNA damage
will activate the so-called ‘DNA structure checkpoints’ to prevent cyclin B-CDK1 activation
leading to the inhibition of mitosis (Castedo et al., 2002). In neoplastic cells, this function is
noticeably disrupted. Moreover, a report written by Hwang and Clurman (2005) explains
that the deregulated effect of Cyclin E-CDK2 complex in cancer cell causes the genomic
instability, centrosome amplification, prolonged S phase, and shortened G1 phase.

37
As mentioned earlier, the general processes in cancer development involves a disconnection
between the phases within cell cycle. Consequently, cell proliferation takes place in the
absence or with minimum supervision from normal regulatory machinery, which is
supposed to instruct a cell to adhere, differentiate, or to die. As a summary, the entire
combination of altered properties increases the possibility of cancer development.
1.4.3 Anticancer
Discovery of anticancer drugs has become one of the main areas of interest in
pharmacological research. During the last few years, the development of natural-product-
based drugs has risen significantly, this can, in part, be attributed to the new technologies in
natural product isolation and purification, combinatorial synthesis and high-throughput
screening (Nobili et al., 2009). Among all the anticancer agents being discovered or
developed over the last few decades, more than 70% are derived from natural products,
derived from various sources, including plants, animals, microorganisms, and marine-origin
organisms (Newman and Cragg, 2007). Some examples of naturally derived compounds with
confirmed anticancer property are: Vincristine, irinotecan, etoposide and paclitaxel (plants
source); actinomycin D, mitomycin C, bleomycin, doxorubicin and l-asparaginase (microbial
source); cytarabine (marine source).
Anticancer drugs exert a specific mechanism of action to attack certain points in cancer
replication and/or metabolism process. Below are several mechanisms of anticancer
therapy that are commonly used as targets for anticancer drugs:

38
1.4.3.1 Tubulin-binding agent
Microtubules are important components of the cell cytoskeleton and are required for
various cellular functions including intracellular trafficking of vesicle and organelles, cellular
motility and mitotic chromosome segregation (Risinger et al., 2009). In cell replication,
microtubules play a crucial role in forming the mitotic spindle for transporting the
chromosomes to separate the poles of the upcoming daughter cells. Accordingly, the failure
of microtubule function during this event leads to the disruption of cell division due to the
unsuccessful alignment of daughter chromosomes and their bipolar attachment to the
mitotic spindle, resulting in mitotic arrest during the metaphase/anaphase transition. In
normal condition, all of these consecutive events will lead to the activation of apoptosis
cascade. Hence, one of the target events of anti-cancer drugs is to interfere with the
microtubules function (Jordan and Wilson, 2004, Hadfield et al., 2003). In performing their
function, microtubules should be in a dynamic equilibrium state with tubulin heterodimers
that consist of one molecule of α-tubulin and one molecule of β-tubulin. During
polymerization, the heterodimers link together to form protofilaments (Nobili et al., 2009).
There are several factors controlling the equilibrium of the heterodimers, one of them is
microtubule-associated proteins (MAPs), which have become the main target for
microtubule-disrupting agents (Itoh and Hotani, 1994). Vinca alkaloids (vincristine,
vinblastine, and vinflunine), cryptophycins, and taxens (abraxane, doxataxel,
docosahexaenoic acid (DHA)-paclitaxel) are some of the natural-product derived anti-cancer
agents, that mainly work by disturbing microtubules dynamic. They have shown a high
activity towards a spectrum of haematological and lymphatic neoplasms, as well as in
several solid tumours such as breast cancer, ovarian, and lung cancer (Nobili et al., 2009).

39
1.4.3.2 Topoisomerase inhibitor
The DNA topoisomerases are nuclear enzymes that reduce torsional tension in supercoiled
DNA, allowing selected regions of DNA to become sufficiently untangled and relaxed to
allow the replication, recombination, repair and transcription to take place (Nobili et al.,
2009). There are two groups of topoisomerases; topoisomerase I and topoisomerase II. The
earlier is the enzyme that catalyses the opening of closed circular and supercoiled DNA, by
cutting and subsequent ligation of one strand of double helix DNA. Topoisomerase II
enzymes create a temporary double-stranded breakage of the DNA structure to allow a
subsequent passage of a second intact DNA duplex through the break (Berger et al., 1996).
Accordingly, the mechanism of action of topoisomerase inhibitor agents in cancer therapy is
by preventing the enzymes for functioning, thus alter the DNA replication, chromosome
condensation, and chromosome segregation, which will lead to the failure of cell cancer
division (Hande, 2008). To date, there are a number of natural-product-derived anticancer
agents available, which act as either inhibitors of topoisomerase I (irinotecan and
topotecan) or topoisomerase II (etoposide, teniposide, doxorubicin, and epirubicin) (Hande,
1998) .
1.4.3.3 Chemoprotective agents
Chemoprevention is an anticancer approach to counteract cancer development, targeting
specific phases during carcinogenesis in order to delay, arrest or reverse the process of
cancer progression (Sporn and Suh, 2000). This approach is considered as an alternative way
for cancer therapy, which is suggested to reduce the morbidity and mortality of cancer
(Gescher et al., 1998). Therefore, chemoprotective agents have become one of the anti-
cancer modalities that counteract tumour progression.

40
According to which phase in the carcinogenic process they exert their protective effect,
chemoprotective agents fall into three categories: inhibitor preventing the formation of
carcinogens, tumour blocking agents, and tumour suppressor agents (Wattenberg, 1985).
The agents inhibiting carcinogen formation prevent the generation of carcinogen, and
therefore, are considered to be the first line of cancer prevention modality. One example is
ascorbic acid, which prevents the formation of nitroso carcinogen from its precursor amines
or amides, which is initiated by the exposure to high level of nitrate (Mirvish, 1975).
Blocking agents interfere the initiation stage of carcinogenesis, which is probably related to
their role in reducing the accumulation of mutation. Although the mechanism of action of
cancer prevention is still poorly understood, in general, there are three main mechanism of
action have been reported (Wattenberg, 1985). First, it works by inhibiting the activation of
carcinogens to the active form, which is capable to initiate carcinogenic. Such activity is
shown by ellagic acid by preventing the production of the carcinogenic form of
benzo[a]prene, one of the highly carcinogenic substances (Wood et al., 1982). The second
route is by enhancing the detoxification of the existing carcinogens. The third mechanism is
by scavenging the reactive form of carcinogens.
Tumour suppressing agent acts by suppressing the expression of neoplasia in cells
previously exposed to carcinogenic agents (Wattenberg, 1985) and, accordingly, is targeting
the promotion and progression phases during cancer development. There are several
possible mechanisms of tumour suppression as described by Gescher et al. (1998) including
scavenging oxygen radicals, modulation of arachidonic acid metabolism and alteration of
signal transduction pathway, inhibition of oncogene activity, and modulation of hormonal
and growth factor activity.

41
As mentioned previously, most of the known substances exerting chemoprotective activity
are derived from natural sources, some of which are naturally occurring constituents of food
(Wattenberg, 1985). Some examples are ascorbic acid, tocopherols, and gallic acid, which
showed the activity to prevent the formation of carcinogens. Moreover, phenols (ellagic
acid, ferulic acid, and caffeic acid), flavonoids and coumarin have been reported to be a
potent tumour blocking agents. Retinoid acid, genistein, and curcumin are of most studied
food-naturally-occurring substances, which showed the effect of tumour suppression agents
(Gescher et al., 1998). Hence, the accumulated knowledge of mechanism of action of
chemoprotective agents and other anti-cancer agents, most of which originate from natural
sources has attracted a lot of interest of researchers to further explore and elucidate the
naturally available substances for the discovery of new and better anticancer agents.
1.5 Malaria
Malaria is one of the life-threatening transmissible diseases in human caused by the
introduction of Plasmodium parasites into the bloodstream to infect red blood cells. The
transmission is brought about by the bite of the infected female Anopheles mosquito
(Abdalla and Pasvol, 2004). The most common symptom of the disease are acute periodic
febrile episodes which usually appear between seven to fifteen days after the infective
mosquito bite (WHO, 2014). There are four Plasmodium species that cause malaria in
humans: Plasmodium falciparum, Plasmodium vivax, Plasmodium malariae, and
Plasmodium ovale. Among these species, Plasmodium falciparum and Plasmodium vivax are
the most common causes. The severe and deadliest malaria manifestation is caused by
Plasmodium falciparum, attributed to the rapid rate of reproduction and the ability to
sequester in small blood vessel (Murambiwa et al., 2011, Trampuz et al., 2003).

42
The malaria parasite is a eukaryotic organism, which is unique in a number of respects. Due
to the nature of the plasmodium life cycle, that takes place in two different hosts involving
several distinct stages of life, it is difficult to perform such a complete parasite life cycle
culture in the laboratory. As a eukaryotic cell, they possess similar properties to those of
higher organisms. However, the parasites' chromosomes are very small and do not
condense into typical rod-shaped stainable structures during mitosis and miosis. The other
special characteristic of plasmodium is that all cells during the entire life cycle, apart from
the zygote and possible the ookinete stages, contain the haploid number (14) of
chromosomes, which gives the parasites a distinct variety in terms of the size of the
chromosomes that range from 800 kilobases (kb) to 3500 kb in length. Thus, these unique
characteristics offer interesting opportunities for therapeutic intervention yet they require
the uses of special techniques in order to study various aspects of the disease, including in
the search of new anti-malarial agents, in order to increase the control over this infectious
and deadly disease (Reeve and Black, 2001).
1.5.1 Plasmodium life cycle
The Plasmodium parasites are inoculated into the bloodstream when the infected
anopheles mosquito takes a blood meal (Figure 1.9). At this stage, the parasites are called
sporozoites, a motile infective form, which will be circulating in the blood flow and enter
hepatocytes within an hour after inoculation. Hereafter, they begin to divide into
exoerythrocytic merozoites form. Plasmodium vivax and Plasmodium ovale may remain in
quiescent stage in hepatocytes as a dormant form, which is known as hypnozoites, while
Plasmodium falciparum does not undergo this dormant stage. Once merozoites leave the

43
liver, they enter erythrocytes to start the asexual multiplication part of the life cycle
(Winzeler, 2008).
In the red blood cells, merozoites develop into early trophozoites, characterized by a ring
form. Afterward, the parasites begin to divide into many daughter merozoites and, at this
stage, the trophozoites are called schizonts. The symptoms of the disease begin once the
asexual parasite multiplies in red blood cells. In Plasmodium falciparum and Plasmodium
vivax life cycle, the duration of the erythrocytic life cycle stage usually a period of 48 hours
which is started when the merozoites enter the erythrocytes, followed by parasites
development into trophozoites, and finally parasites division into schizonts. Eventually, the
erythrocytes burst and the parasite releases around 20 new merozoites into the
bloodstream, which subsequently invade intact erythrocytes to start new erythrocytic
phases of life cycle (Trampuz et al., 2003)
After several life cycles, some of the merozoites may develop into immature gametocytes
forming the precursors of male and female gametes. This form is ready for further
transmission through the female Anopheles mosquito bite that takes up the gametocytes
along with the blood meal and enters the mosquito gut. The gametocytes start their sexual
reproductive cycle through the fusion of male and female gametocytes to form an ookinete.
Subsequently, this fertilized motile zygote of plasmodium develops into sporozoites, travels
to the salivary gland of the infected mosquito. The parasites will remain in a quiescent stage
in the salivary gland until a later time and ready to start a new life cycle in a new human
host when the mosquito is taking its subsequent blood meal. Figure 1.9 below illustrates the
sexual and asexual plasmodium life cycle.

44
Figure 1.9 – Plasmodium life cycle
Hundreds of sporozoites are injected into one human bloodstream by the bite of Anopheles mosquito. The parasites migrate to the liver to form pacytophorous vacuoles in hepatocytes. Afterward, they can undergo two life cycle stages; one is to remain dormant as a hypnozoite form (P.vivax or P.ovale), the second fate is the production of thousands of merozoites. At the latter stage, they will leave the hepatocyte to quickly invade the red blood cells, allowing the parasites to replicate in an erythrocytic life cycle. This cycle corresponds to the periodic fever and chills of the malarial symptoms, due to the erythrocytes rupture, which releases merozoites into the bloodstream, which either will infect intact erythrocytes or differentiate into gametocytes. At the latter stage, the gametocytes will be taken up by mosquito via the blood meal, subsequently entering the mosquito gut to start the sexual life cycle of Plasmodium (Winzeler, 2008)
1.5.2 Pathogenesis and proteins involved
Malaria pathogenesis is a complex process, which cannot be represented by one single
scheme. The progression of the symptoms varies from simple asymptomatic infection,
which may develop into periodic febrile episodes, and at the later stage may lead to a
severe condition with metabolic acidosis, severe anaemia or cerebral malaria (Clark and
Schofield, 2000). There are several factors affecting the clinical outcome of malaria infection
that falls into three categories: parasite factors, host factors, and geographic and social
factors (WHO, 2013). Parasite factors, such as the ability of the plasmodium to develop

45
resistance to malarial drug, the quick rate of multiplication, the various invasion pathways,
have become the main interest of the research for the development of anti-malarial drugs.
The aims of these studies are to overcome the drawback of existing drugs for better
effectiveness and efficacy of the anti-malarial agents, expanding their knowledge for better
understanding of the pathogenesis of the disease, as well as searching for new candidates
for anti-malarial drugs.
As a result of many studies over the years, on malaria pathogenesis, a number of proteins
have been explained to have an important role in various stages of malarial infection. In the
event of parasitic inoculation into the blood stream, circumsporozoite (CS) protein and
thrombospondin-related adhesive protein (TRAP) mediate the sporozoites invasion into
hepatocytes (Miller et al., 2002). During parasitic invasion into erythrocytes, the merozoites
must recognise and bind receptors on the surface of erythrocyte via the ligand-receptor
interaction. Accordingly, there are several parasite proteins, which act as ligands, such as
Plasmodium falciparum erythrocyte-binding antigen (EBA)-175, erythrocyte-binding ligand
(EBL)-1, and EBA-140 that bind erythrocyte receptors glycophorine A (GPA), glycophorine B
(GPB), and glycophorine C (GPC) respectively (Gaur et al., 2004). Duffy-Binding-like (DBL)
family was found on Plasmodium vivax only, which invades Duffy blood group positive
phenotypes (Zimmerman et al., 1999).
Red blood cells infected with Plasmodium falciparum express the Falciparum erythrocyte
membrane protein 1 (PfEMP1), which mediates the parasitic binding to various host
receptors. Such binding explains the mechanism of plasmodium parasitic binding to the
endothelial cells of various organs, thus allowing parasitic adhesion and invasion to
placenta, brain, and microvasculature. The identified target receptors for PfEMP1 are

46
chondroitin sulphate A (CSA), CD36, intercellular adhesion molecule 1 (ICAM-1). Therefore
these proteins are crucial for the development of severe malaria, they are recognized as the
main proteins, which plays central role in the parasite pathogenesis.
After the parasites engagement with the surface of erythrocytes, they must undergo apical
orientation. To do so, the plasmodium apical end, which is marked by the presence of
membrane bound organelles, must face the erythrocyte surface. This orientation is essential
for the formation of a parasite-erythrocyte connecting junction to allow the merozoites
invasion into the erythrocyte (Gaur and Chitnis, 2011). When merozoite surface molecules
recognize the erythrocyte surface receptor, it activates the parasites intracellular signalling
pathway. As a result, the event induces the release of essential molecules from the apical
organelles and initiates the actin-myosin reorganization that allows the parasites to invade
the erythrocytes. This signalling cascade is initiated by phosphoinositide, cyclic AMP, and
calcium-dependent mechanism (Miller et al., 2002).
The pro-inflammatory response, as well as the corresponding mediators such as nitric oxide
(NO), is also one of the important factors in malaria pathogenesis. Clark and Cowden (1999)
proposed that the sequestered parasites in the blood vessel induce the inflammatory
response that releases inflammatory mediators such as NO. There is a strong relationship
between high plasma levels of NO and the severity of malaria, which has been debated to
be related with inflammatory cytokines such as tumour-necrosis factor (TNF) and interferon
γ (IFN-γ). Some reports have reviewed the involvement of parasites toxins such as
glycosylphosphatidylinositol (GPI), apoptosis of pro-inflammatory T cells, and malarial-
related antibodies such as MSP1, in the pathogenesis of malaria (Miller et al., 2002).
Nevertheless, the physiological significance of this evidence remains to be proved.

47
1.5.3 Anti-malarial drugs
The aim of malaria drug therapy is the treatment of the patient, combined with blocking the
infectivity of the parasite to the vector by exploiting differences in metabolism of the
plasmodium parasite and host. Currently-available anti-malarial drugs act as blood
schizonticidal, which explains why the drugs that attack the blood forms of the parasites,
and/or gametocidal were the drugs kill the sexual form of the parasites. However, due to
the development of drug resistance by the malaria parasites, which commonly occurs during
the gametocyte stage, malaria therapy is now mainly targeted at the inhibition of
gametogenesis by a combination of schizonticidal and gametocytocidal drugs to avert
malaria transmission (Murambiwa et al., 2011).
The mechanism of action of these drugs varies depending on which pathway of plasmodium
metabolism they are targeting. The first anti-malarial agent, quinine, derived from Cinchona
plant, disrupts plasmodium membrane integrity and cause cell lysis, leading to
autodigestion of the released parasites. Some of the quinine-related drugs possess different
modes of action, for example, chloroquine and primaquine that act via the inhibition of
haem degradation and inhibition of protein transport, respectively. Artemisinin, originated
from the Chinese traditional plant Artemisia annua L (Abdin et al., 2003) and its derivatives
act as anti-malarial agent through the production of free radicals that ultimately lead to
haemolysis and lysis of infected cells. Antifolate agents are also used in malaria eradication.
The mechanism of action of antifolate derivatives are by the inhibition of enzymes essential
for folate metabolism; dihydrofolate reductase and dihydropteroate synthase (Murambiwa
et al., 2011).

48
Artemisinin-based combination therapy (ACTs), is recommended by WHO as the first-line
treatment for treating malaria caused by Plasmodium falciparum, due to higher risk and
incidence of drug resistance with artemisinin monotherapy. Chloroquine comes as the first-
line drug of choice of malaria treatment in an area where Plasmodium vivax is endemic.
However, the effectiveness of the treatment is decreasing due to the development of
resistance in most parts of the world (WHO, 2013).
The goal of anti-malaria chemotherapy research is to find a drug that has both anti-
recrudescence and blood schizocintocidal activity with minimal side effects. Early treatment
with effective anti-malarial drugs is the main life-saving intervention; however, the
treatment is threatened by the growing resistance of the parasites, especially Plasmodium
falciparum. Hence, the therapeutic life of widely used anti-malarial agents, such as
sulphodoxine-pyrimethamine (SP) and amodiaquine, one or the malaria treatments
recommended by WHO, also appear to be limited due to an increase in parasitic resistance
around the world. Accordingly, the search for effective, safe, and affordable new anti-
malarial drugs has become a worldwide challenge. Natural products are a promising source
of new compounds with anti-malarial properties. Historically the most significant
achievements in anti-malarial treatment was made through the discovery of plant-derived
natural compounds: Artemisinin and Quinine.
1.6 The method for the discovery of plant-derived natural products
A large number of herbal manuscripts have been written that explain how plants were
prepared and applied as traditional medicines, while some traditional prescriptions were
transmitted by word of mouth through the generations. In general, the parts of the plant
used as medicine were treated by simple galenical preparations to obtain impure crude

49
extracts in the form of liquid, semisolid or powder prior to oral or external administration
(Evans et al., 2009).
In the modern era, exploration of the active compounds contained in the traditionally-
known medicinal plants has become of interest in drug development research. Many
sophisticated methods are currently available, especially in separation, spectroscopic and
bioassay techniques, as the consequence of the growing demand for natural product
research. The strategy of natural product isolation has shifted from ‘old-fashioned
approach’ based on a straightforward-crude-extraction, to the modern day ‘bioassay-guided
isolation’ method. The old approach uses phytochemical methods concerned with the
organic substances accumulated by plants, which means that the main interest of study was
on the chemical structures, biosynthesis/metabolism, the natural distribution and the
biological functions of these substances. Although both approaches may begin with the
ethnopharmacological information, such as traditional used medicines, the emphasize of
the new approach is focused on the screening of the bioactivity of the active compound(s),
aimed at the isolation and identifying the ‘lead’ compound(s) responsible for the bioactivity
(Seidel, 2006). As described in Figure 1.10, the active compound(s) derived from plants are
discovered through a series of extraction, isolation and purification processes, which is
directed by repeating tests for biological activity before moving on to the next steps of the
protocol. This method has been applied in a number of drug discovery research papers,
most of which were exploring plant-derived natural products (Sudha and Srinivasan, 2014,
Rashid et al., 2014).
Following the identification of the molecular structure of the active compound responsible
the bioactivity, the next question is to determine the actual mechanism responsible for the

50
biological effects. There are several ways of identifying the biological-mechanism of actions
of newly identified drugs which are commonly used in many laboratories including genomics
and proteomics studies that are focused on observing the changes of gene and proteins
expressions. Once the question is answered, in vivo assay and toxicological studies will be
performed before entering the clinical trial phase for further pharmaceutical production
process (Sarker et al., 2006)
Figure 1.10 – Bioassay-guided natural product discovery process
The new approach to the discovery of natural compounds applies early screening for the biological activity of the crude extracts. The extraction, fractionation, isolation, and purification of the active compound(s) are guided by in-vitro bioassay, which means only the biologically-active fractions will enter the next stage of the process (Sarker et al., 2006) .

51
1.6.1 Extraction
Extraction is a process by which the substances contained in the plant material are
separated using a particular solvent through a standard procedure (Handa, 2008). There are
several typical steps in the extraction of plants. The first step is size reduction of dried plant
materials. The main purpose of this step is to break the cell wall to ensure that all plant
structures are exposed to the solvent. It also increases the materials surface area, which
raises the transfer rate of soluble components from plant to the solvent. The next step is the
treatment with the selective solvents to extract the desired components, followed by the
filtration of the extract to eliminate the bulk materials. Finally, the extract is subjected to a
concentration and drying process to remove the solvent in order to obtain dried crude
extract (Sarker et al., 2006).
The solvent extracts the soluble molecules and leaves the insoluble material behind. Prior to
the extraction step, the handling of plant material is important as a starting point of natural
product isolation. Plant tissues should be prepared in a way to minimize the risk of
contamination and losing the valuable active compounds, or the chemical changes of the
constituents. In most cases, drying of plant tissues is considered to be the best way to
preserve the plant material and suitable for long storage of the samples (Harborne, 1998).
The drying process must be carried out in a controlled condition to avoid too many chemical
changes during the process (Seidel, 2006). The next step is grinding the plant material to
improve the subsequent extraction. This process significantly increases the surface area as
well as facilitating the penetration of solvents into the plant cells.
As mentioned earlier, plant extracts consist of complex mixtures of substances.
Consequently, initial treatment is needed in order to eliminate, at least, some of the

52
unwanted biomass, contaminants, or inert material from the plant to be extracted. This also
helps to prevent enzymatic oxidation or hydrolysis occurring, particularly when extracting
from fresh plant materials. This is typically achieved by immersing the plant materials in
alcohol and can be used as the start of the extraction process.
The selection of the procedures and solvents for extraction of the particular components
from a plant primarily depends on the nature of the desired molecules. For example, if the
suspected component is a non-polar molecule, then a non-polar solvent should be used, and
vice versa for polar solutes. For the isolation of thermolabile components, heat exposure
should be avoided, and therefore, cold extraction procedures are preferred. However,
despite the nature of the desired components, solvent characteristics also need to be
carefully considered. The solvent has to be easily removed from the extract by simple
procedures, such as evaporation or distillation. Therefore, highly recoverable solvents are
preferred. Other factors such as physical and chemical properties of the solvents have to be
taken into consideration as they may affect the effectiveness and efficiency of the
extraction procedure.
Table 1.2 shows several solvents that are commonly used for plant extraction and their
properties. Plant material is extracted using the principal of ‘like dissolves like’. For example,
nonpolar solvents are used to extract lipophilic compounds (alkanes, fatty acids, sterols,
pigments, waxes, some terpenoids, alkaloids, and coumarin), while polar solvents are used
to extract polar compounds (flavonoid, glycosides, tannins, and alkaloids) (Seidel, 2006).
Solvent polarity is qualitatively described as the capacity of one solvent for solvating
dissolved charged or dipolar species. It is generally measured quantitatively by the dielectric
constant (or relative permittivity Ɛr), dipole moment (µ), or the sum of all molecular

53
properties responsible for all interaction forces between solvent and salute molecules
(Reichardt, 1988). Dielectric constant measures the solvent’s tendency to partly cancel the
field strength of the electric field of a charged particle immersed in it, which then compared
to the field strength of the charged particle in a vacuum (Malmberg and Maryott, 1956).
Dipole moment, shows the charge separation in a molecule: the greater the difference in
electronegativity of bonded atoms, the larger the dipole moment. Reichardt (1988)
mentions the polarity index, which is empirically derived from spectroscopic measurements
of the solvents. The index values are in the range of 0 to 1, from the non-polar to polar
solvents. For the purpose of isolating unknown substances from one plant, particularly using
the bioassay-guided extraction approach, utilisation of solvents from a distinct range of
polarity will beneficial in the screening for the active components of extracts. Moreover,
the solvent polarity might provide an important clue to the characteristics of the active
components responsible for the bioactivity.
Table 1.2 – List of solvents for plant extraction
Solvent Boling Point Dielectric constant
Dipole Moment
Polarity Index
Hexane 69°C 2.02 0 0.009
Diethyl ether 35°C 4.3 1.15 0.117
Ethyl acetate 77°C 6.02 1.78 0.228
Chloroform 61°C 4.81 1.04 0.259
Dichloromethane 40°C 9.1 1.6 0.309
Acetone 56°C 21 2.88 0.355
Acetonitrile 82°C 37.5 3.92 0.46
n-Butanol 118°C 18 1.63 0.602
Ethanol 79°C 24.55 1.69 0.654
Methanol 65°C 33 1.7 0.762
Water 100°C 80 1.85 1

54
There are several procedures for solvent extraction, which are commonly applied in plant
extraction, such as decoction, infusion, percolation maceration and Soxhlet extraction.
These procedures rely on the principle of solid-liquid extraction, as the plant material is
placed in contact with a particular solvent to allow the diffusion of solvent into the cells.
Thereafter, the solvent will dissolve the substances of the plant cells. Finally, yield-
containing solvent has to diffuse out of the cells to enrich the extracted metabolites (Seidel,
2006). According to Handa (2008), plant extraction can be carried out in three ways; cold
aqueous extraction (infusion, percolation and maceration), hot aqueous extraction
(decoction and percolation) and organic solvent extraction (maceration and Soxhlet
extraction). Certain treatments, such as heat exposure and evaporation, might cause the
loss or degradation of the plant constituents. Therefore, the choice of extraction procedure
needs to be carefully considered.
1.6.1.1 Infusion and decoction
Infusion and decoction are simple natural product preparations by using water to dissolve
the desired component from one plant material. Infusion is prepared by immersing the
crude plant material (fresh or dried preparations) for a short period of time with cold or
boiling water. In the decoction process, plant material is boiled in a certain proportion of
water for a defined period of time, this is suitable for extracting heat-stable constituents
(Handa, 2008). These methods work by dissolving the readily soluble constituents of the
plant, however the rest of plant substances remain in the residual crude plant material
(marc).

55
1.6.1.2 Maceration
This procedure is performed by immersing the pulverised plant material in a particular
solvent in a closed container at room temperature. During the extraction process,
occasional or constant stirring is given to increase the speed of extraction. The substances
diffuse out of the plant cells into the enriched extract, until equilibrium is achieved. The
exhausted extract is separated from the marc by filtration. Fresh solvent is subsequently
added to the marc and the extraction process is repeated several times to ensure maximum
extraction yield. After the exhaustion point is achieved, all extracts-containing filtrates are
pooled together and the solvent is evaporated to obtain the crude extract.
The disadvantages of this method are that it is time-consuming, requires a large volume of
solvent, and lacks a yield of compounds that are poorly soluble at room temperature.
However, this is considered as the best option to extract the thermolabile substances
(Seidel, 2006, Handa, 2008)
1.6.1.3 Percolation
Percolation is performed by placing the grounded and pulverised plant material to soak in a
percolator. The basic principle of this method is similar as maceration, however, the
decanting and filtration of the exhausted extract-containing solvent is no longer needed. A
percolator is a cylinder or container with a tap equipped with a filter at the bottom part, to
allow the solvent to percolate slowly (dropwise) out of the percolator. As for maceration,
successive extraction can also be done by refilling the percolator with fresh solvent.
The drawback of percolation mainly relies on the structure of the equipment. Fine powder
and plant material which swells excessively may clog the percolator, and the material is not
56
distributed homogenously in the container. This problem results in the incomplete
extraction which leads to the low amount of the yield produced (Handa, 2008).
1.6.1.4 Soxhlet extraction
This method is known as hot continuous extraction by using a special Soxhlet apparatus
system. The finely ground plant material is placed in a cellulose thimble, a porous bag made
of strong filter paper, which is inserted into an extraction chamber on the top of a collecting
flask beneath the reflux condenser. When the solvent in the collection flask is heated, the
vapours start to condense when they get into contact with the reflux condenser. The
condensed solvent will drip into the thimble containing the plant material. The liquid in the
thimble chamber is filled up to the certain level and then siphons into the collection flask.
This process is continuous and stopped only when the extraction reaches an exhausted
point as the solvent from the siphoned tube turns clear without any dissolved extraction
material.
This method has the advantages due to the continuous extraction process. As the
solubilized-metabolites-containing solvent empties into the collection flask, fresh solvent is
re-condensed and extracts the plant material in the thimble in a continuous way. Therefore,
this method is less time-and-solvent consuming than the previous methods. Nevertheless,
as the extract is exposed to the constant heat at the boiling point of solvent used,
thermolabile compounds might be damaged during the extraction process. Consequently,
Soxhlet extraction will give more benefit in extracting thermostable components. Generally,
the solvents of choice for Soxhlet extraction must have a relatively low boiling point to
prevent the decomposition of the compounds. Thus, water, as the boiling point is at 100 ˚C,
is not suitable for this method.

57
1.6.2 Isolation and purification
Plant extract is a mixture of complex molecules which have different physical, chemical and
biological properties. It is almost impossible to obtain pure molecules with only one
isolation procedure. Several isolations protocols are usually applied to isolate single
compounds and are specifically developed based on the nature of the compound to be
isolated. Isolating secondary metabolites from plants, as one of the potential sources of
natural products, is usually a complex and time-consuming process. Hence, good initial
sample preparation might make these processes easier. Filtration is one of the simplest
sample preparations, particularly for eliminating particulate and insoluble materials by using
various filtration methods such as filter paper, special membranes with controlled pore size
or short silica gel columns (Hostettmann et al., 1986). Fractionation is considered as the
next step of sample preparation, aimed at the separation of the extracted components into
discrete fractions of similar properties, such as polarity or molecular size. The crude extract
is separated by various chromatography techniques to attain a few large fractions, in order
to avoid the spreading of the target compound over so many fraction (Sarker et al., 2006)
Chromatography is one of the most powerful techniques in the isolation and purification of
natural products. In general, this method is divided into two categories based on the
complexity of the techniques. The simple and older methods are categorized as classical
chromatographic techniques, which include thin layer chromatography (TLC), preparative
thin layer chromatography (PTLC), open column chromatography (CC) and flash
chromatography (FC). The latest methods are known as modern chromatography
techniques, which include High-Performance thin-layer chromatography (HPLTC) and High-
Performance Liquid Chromatography (HPLC).

58
Analytical and preparative HPLC methods are utilised to optimise the separation and
purification system. Analytical HPLC gives a general estimate of a relative proportion of the
compounds in the crude extract as well as developing a strong mobile phase system for
optimum resolution of chromatographic separation. There are three important parameters
that influence the resolution, namely the capacity factor (K’), selectivity (α), and column
efficiency (N), which will be critically observed and manipulated to achieve well-resolved
peaks of separation. The correlation between these parameters and the resolution of the
separation (R) is shown as follows:
R = ¼ (α-1)/α x √N x K’/ (K’+1)
As a general rule, K’ is relatively easy to be manipulated by varying the mobile phase
composition. Every 10% modification of the composition will result in a 2-3 times change in
K’ value (Mellwig and Jakobs, 1980).
Selection of isolation protocols for a known molecule can be carried out on the basis of its
physical and chemical properties such as molecular size, stability, solubility, charge, and
acid-base properties. However, it would be more difficult to identify such properties if the
target compound is an unknown molecule. In this case, the nature of the crude extracts, in
particular the solvents used in the extraction, becomes an important factor to be
considered. It is also worthwhile carrying out analytical chromatography techniques, in
order to determine a general profile for the extracts.
1.6.3 Structure elucidation
The final step of plant extraction is to conclusively identify the molecule that is responsible
for a given pharmacological effect. This is often thought as the bottleneck of natural product
isolation due to the complexity of procedures that are often needed to obtain sufficient

59
purity of compounds. Several advanced spectroscopic techniques used in obtaining chemical
information of natural products include mass spectrometry (MS) and nuclear magnetic
resonance (NMR) spectroscopy. In general, MS provides information in relative to the
molecular mass, molecular formula and chemical structure. NMR gives further useful data
on the identity of the molecular structure of purified compounds. NMR is capable of
differentiating molecules with the same molecular mass or molecular formula as well as
discerning constitutional and geometric isomers (Bobzin et al., 2000). The protons in
molecule appear as an NMR signal and this provides information on the proton environment
and coupling partners. Therefore this technique is capable of differentiating molecules with
the same molecular mass or molecular formula as well as discerning constitutional and
geometric isomers (Bobzin et al., 2000)
1.7 Specific aims and objectives of the research
Although the biological effects of Phyllanthus niruri L have been intensively studied, there is
no comprehensive review available so far, which explains the whole story of the screening,
isolation, identification of active compounds, and detailed elucidation the mechanism of
action. Accordingly, this project conducted a screening of the effects of various extracts of
Phyllanthus niruri L for their activities as anti-platelet aggregation, anti-cancer, and anti-
malaria, which had previously raised significant interest of many researchers, in order to
identify a number of therapeutically important extracts. Once identified the extracts of
interest were further explored to isolate and identify the compound(s) which were
responsible for the observed activities. The elucidation of possible mechanisms of action of
the activity was also studied in this report using a LC MS/MS proteomics approach. The data

60
obtained from this project has added significantly to our understanding of therapeutic
natural products derived from Phyllanthus niruri L.
The main aim of this project, however, is the development of new drugs from natural
products derived from Phyllanthus niruri L, which will be achieved by the following protocol:
1. Screening of the activity Phyllanthus niruri L extracts as the anti-cancer, anti-malaria,
and anti-platelet compounds.
2. Isolation and identification of the active compounds contained in the extracts that
possesses the biological effect.
3. Elucidating of the mechanism of action of the active compound linked with biological
activity.
1.8 Research methodology
Extraction and purification of Phyllanthus niruri L compounds are followed by bioassays.
Several variations in methodology were used in this study including:
1. The extraction of the whole plant of Phyllanthus niruri L.
Complex molecules contained in Phyllanthus niruri L were extracted from the
biomass by solvent extraction.
2. Biological assay
The crude extracts and isolated compounds were tested in vitro against cancer cells,
plasmodium growth, and platelet aggregation by employing appropriate biological
assays in order to investigate their potential therapeutic activities.
61
3. Isolation of active compounds
Several isolation processes were used in order to obtain active component (s) that
possessed biological activity including analytical and preparative HPLC.
4. Structure elucidation
Identification of the isolated compounds is the key stage in natural product drug
discovery. This was achieved by applying a number of spectroscopic methods.
5. Data analysis
The proteomics data used to elucidate the mechanism of action of new compounds
were analysed using various computer software packages, including statistical and
proteomics software.

Chapter 2Research Methodology

63
2.1 Materials
Powdered extract of Phyllanthus niruri L was obtained from PT Haldin Pacific Semesta,
Jakarta, Indonesia. Product specification is shown in Appendix 1. The powder was prepared
by drying and grinding the plant leaves, resulting in a fine yellowish powder. For the initial
extraction process, a number of solvents were used. Methanol, ethanol, hexane and
chloroform were purchased from Fisher Scientific, Loughborough, UK.
Whole blood for platelet aggregation assay and anti-malarial testing was obtained from
National Health Service (NHS) Blood and Transplant, Manchester, UK. Reagents for platelet
aggregation assay were ADP, collagen, adenosine, fibrinogen, Prostaglandin-E1, 4- (2-
Hydroxyethyl) piperazine-1-ethanesulfonic acid, N- (2-Hydroxyethyl) piperazine-N′- (2-
ethanesulfonic acid) or HEPES, Ethylene-bis (oxyethylenenitrilo) tetraacetic acid or ETGA,
and apyrase. All of these reagents were purchased from Sigma-Aldrich, Dorset, UK. Blood
counts were measured by automated haematology Analyzer PocH-100i, Sysmex
Corporation, Kobe, Japan. Speedy-Diff complete kit for blood smear staining was purchased
from Clin-Tech, Guildford, UK.
Cell culture media (RPMI 1640) were obtained from Lonza, Belgium. Fetal Bovine Serum
(FBS), L-Glutamine (100x) and trypsin EDTA (1x) were purchased from Biosera, Belgium.
Dimethylsulfoxide (DMSO) was purchased from Fisher Scientific, Loughborough, UK.
Phosphate buffered saline (PBS), Ethylendiaminetetraacetic acid (EDTA), thiazolyl blue
tetrazolium bromide, propidium iodide solution, and SYBR Green® I nucleic acid stains were
purchased from Sigma-Aldrich, Dorset, UK. Cell culture flasks were obtained from Fisher
Scientific, Leicestershire, UK. 96-wells Microplates were purchased from Greiner bio-one,
Stonehouse, UK. Multiskan FC® microplate photometer was obtained from Thermo

64
Scientific, Massachusetts, United States. Flow cytometry was performed by using the BD
FACSVerseTM flow cytometer from BD Bioscience, Oxford, UK.
Human Caucasian lung large cell carcinoma (COR-L23), human acute T lymphoblastic
leukaemia (MOLT-4), human Caucasian chronic myelogenous leukaemia (K562), and mouse
embryonic fibroblast (3T3) cell lines were obtained from the cell culture laboratory of the
Centre for Biochemistry, Drug Design and Cancer Research, University of Salford, UK. For
antimalarial assay, Plasmodium falciparum strain K1 was kindly provided by Dr Niroshini
Nirmalan, University of Salford, Manchester, UK.
Diaion HP-20 resin was obtained from Mitsubishi Chemical Corp, Japan. A GraceSmart
Reverse Phase column for analytical HPLC was obtained from Grace, Columbia, United
States. Preparative HPLC used a Hyperclone ODS column from Phenomenex, Macclesfield,
UK. Acetonitrile, triflouroacetic acid, and other HPLC mobile phase were purchased from
Sigma-Aldrich, Dorset, UK. All reagents used for HPLC were of analytical grade. The HPLC
system was purchased from Agilent Technologies, Santa Clara, United States.
Electrophoresis consumables including acrylamide, Tris base, glycine, DL-dithiothreitol
(DTT), 2-Merchaptoethanol, ammonium persulfate (APS), and sodium dodecyl sulphate
(SDS) were obtained from Sigma-Aldrich, Dorset, UK. Protein quantification assay was kit
was using the 2-D quant kit from GE Healthcare Life Sciences, Buckinghamshire, UK.
Immobilized pH gradient (IPG) strips (pH 3-10), Bio-Safe™ Coomassie Stain, Bio-Lyte broad
range carrier ampholytes (pH 3–10), protein standards (SDS-PAGE and IEF standards), and
the electrophoresis instruments (1D and 2D electrophoresis systems) were obtained from
Bio-Rad Laboratories, Hertfordshire, UK.

65
Otherwise stated, all other chemicals and material such as sodium chloride, ammonium
bicarbonate, and potassium hydrogen carbonate were purchased from Sigma Aldrich,
Dorset, UK.
2.2 Extraction of Phyllanthus niruri L extracts
2.2.1 Maceration
The method of choice for the extraction of the crude extracts in this study was cold
extraction, or maceration. As described in section 1.6.1.2, the advantage of using this
method is to yield more substances in the extract because all of the thermolabile and
thermostable components are preserved. Despite the large amount of solvent needed and
longer time for extraction, maceration gives a benefit in extracting unknown compounds for
screening their biological activities.
In order to develop the standard procedure of the extraction method, each batch of plant
extraction used equal amounts of plant material and extraction solvent, as well as the
extraction time. Consequently, exhausting point was not necessarily achieved. By doing so,
the final yield obtained from different solvent used could be compared one to another.
Dried powder of Phyllanthus niruri L was extracted by maceration using solvents of different
polarities. Hexane and chloroform are of nonpolar solvents used for the extraction, whereas
the polar solvents used were methanol, ethanol, and water. For each solvent extraction, 100
grams (g) of the plant powder were immersed into 200 millilitre (ml) of solvent and was left
overnight to allow the solvent extracts the soluble molecules from plant material. During
this period, occasional stirring was given. After 24 hours, the solvent was separated from
the insoluble plant material by filtration. The residual plant material was subsequently

66
immersed in a 200 ml of fresh solvent and this process was repeated three times. On the
third day, all filtrate was pooled together and resulted in a 600ml of solvents containing the
extracted metabolites.
2.2.2 Solvent removal
The next step of following solvent extraction was to separate the yield from the extractant
which was performed by evaporation using a rotary evaporator followed by freeze drying.
The earlier step is aimed at reducing the amount of solvent from the extract, which was
performed under reduced pressure using IKA RV 10 digital rotary evaporator system (IKA
Werke GmbH & Co, Germany) at a temperature below 40 ˚C to minimize the degradation of
thermolabile components (Seidel, 2006). Finally, all extracts were freeze-dried to remove all
residual organic and aqueous mixtures from the extracts and yield a completely-dry crude
extracts. Dried extracts were stored in an airtight container at -20 ˚C before use.
2.3 Screening for anticancer activity
As briefly explained in section 1.2.3, the current study started with the screening of the
biological activities of Phyllanthus niruri L as anti-cancer, antimalarial, and antiplatelet.
2.3.1 Cancer cell culture
2.3.1.1 Cell lines
Three cell lines were used for the anti-cancer test of the crude extracts; human acute T
lymphoblastic leukaemia (MOLT-4), human Caucasian chronic myelogenous leukaemia
(K562), and human Caucasian lung cell carcinoma (COR-L23). For the cytotoxicity test,
mouse embryonic fibroblast cells (3T3) were used. All cell lines used were grouped into

67
adherent cells (COR-L23 and 3T3 cell lines) and suspension cells (MOLT-4 and K562). All cell
lines were cultured in culture medium containing 90% (v/v) RPMI 1640, 2mM L-glutamine,
and 10% (v/v) Fetal Bovine Serum (FBS). To prevent bacterial infection during cell culturing,
50 IU/ml penicillin and 50µg/ml streptomycin were added into the media. Additional
reagents or materials needed for performing cell culture or anti-cancer test of Phyllanthus
niruri L extracts were sterilized by autoclaving, or filtered through a sterile 0.2µm filter. The
cells were cultured in 25 cm2 sterile flasks and incubated at 37 ˚C, in an atmosphere of 95 %
air and 5% CO2. All procedures during cell culture were performed in a class II biological
safety cabinet and, in addition, all precautions were carefully taken to prevent the
occurrence of any aspects of contamination (Markovic and Markovic, 1998).
2.3.1.2 Recovery of frozen cell lines
All cell stocks were kept in a 0.5 ml aliquot of cell suspension in a medium containing 10%
(v/v) concentration of DMSO at a -80 ˚C environment or in liquid nitrogen (-196 ˚C), which is
suitable for a long term storage. Prior to the regular culturing procedure, the cells were
recovered from the frozen condition and prevented from the toxic effect of DMSO. At a
concentration of more than 4%, DMSO induced monolayer disruption and an alteration of
cell-to-cell tight junctional complexes, whereas at higher concentration (more than 10%),
DMSO will disturb cell membrane permeability (Da Violante et al., 2002). Accordingly, cell
aliquots were quickly thawed in a 30 ˚C waterbath after removal from the -80 ˚C condition.
Immediately after the ice crystal had melted, the cell suspension was transferred into a flask
containing pre-warmed medium. By doing so, the containing DMSO was diluted to a lower
concentration that is tolerable for the cells and without giving any deleterious effects.
Subsequently, the cell suspension was incubated at a 37 ˚C incubator with 5% CO2

68
environment for a minimum of one passage to allow the cells to recover and achieve the
optimum conditions for the anti-cancer test by MTT assay and protein extraction.
2.3.1.3 Maintaining the optimal condition of cell culture
The cells were monitored regularly to ensure the cell viability as well as to observe if there
were any sign of contaminants. The colour and turbidity of media were monitored, as well
as cell morphology and cell density. In conditions where the cell population was too dense,
the media environment became acidic, and nutrient was depleted, cell culture grew which
led to cell detachment and death. Therefore, when the cell suspension had reached sub-
confluent condition or 70-80% confluency, the medium was changed to replenish the
nutrient supply, restore the optimum conditions for cell growth, as well as to restore the cell
density back to optimum condition for cell growth (Macleod and Landon, 2004).
To maintain the healthy growth of cells, the culture required regular subculture, the
procedure in which the sub-confluent culture was split into a fresh medium. Generally, the
subculture of the cells was performed every three days to ensure that the cells did not
overgrow. Subculturing was also referred as harvesting because at this stage, cells are ready
for further biological assays.
2.3.1.4 Subculturing adherent cell lines
Adherent cell lines grow by adhering to a plastic wall of the culture flask, which acts as the
substrate, and proliferate as a monolayer of cells. As the first step of the subculture, the old
medium was removed from the flask, followed by subsequent washing of the interior
surface of the flask to remove the remaining medium and non-viable cells. Sterile phosphate
buffer saline (PBS) was used in this step. A sterile 0.5 ml trypsin solution at 0.25% (w/v)
concentration was added to the flask, which then was incubated in a 37 ˚C incubator for 2-3

69
minutes until the cells have detached. Trypsin is a proteolytic enzyme that breaks the cell-
substrate and cell-cell bonds, which then results in cell detachment and creates a single-cell
suspension. Subsequently, 4.5 ml of fresh medium was added into the flask, which
eventually diluted the enzyme and halted the proteolytic activity. At this stage, healthy cells
were ready for harvesting for further MTT and protein extraction (see section 2.3.2 and
2.3.3). Although the cell lines used in this study had different rate of cell growth, as a
general rule, a split ratio of 1:5 was used for routine culture COR-L23 and, due to the fast
rate of cell growth, split ratio used for 3T3 cell line was 1:50.
2.3.1.5 Subculturing suspension cell lines
Suspension cell lines grow as suspended cells in the medium, therefore subculturing does
not require trypsinization step. The whole volume of cell suspension was transferred into a
sterile universal bottle for subsequent centrifugation at 1500 rpm for 5 minutes to spin
down all cultured cells. The spent medium was carefully pipetted and discarded, and a fresh
medium was added into the cell pellet. At this stage, healthy cells were ready for harvesting
for further MTT and protein extraction (see section 2.3.2 and 2.3.3). After homogenization
the cell pellet into the medium by several times pipetting, the cell suspension was then split
at a ratio of 1:10.
2.3.1.6 Cryopreservation of cell stocks
As mentioned in section 2.3.1.2, the cell stocks were stored at an extreme low temperature
(below -80°C) with several conditions to maintain the cell viability. The important feature is
to ensure that cells are in optimum condition without any feasible contaminants. For
adherent or monolayer cells, the cultured cells were detached by trypsinization, followed by
addition of fresh media to inactivate trypsin activity. Subsequently, for adherent and

70
suspension cells, the suspension was centrifuged at 1500 rpm for 5 minutes to obtain cell
pellet, then a freeze-cold medium containing 10% (v/v) DMSO was added to re-suspend the
cells at a concentration of approximately 107 cells/ml. DMSO is another crucial element in
the cell cryopreservation, that acts as a cryoprotective agent which prevents the formation
of ice crystal and fragmentation of the cell membrane. The final suspension of cells stock
was aliquoted in several cryovials. To prevent the formation of intracellular ice crystal which
causes cell lysis upon cell thawing, the cryovials were placed overnight in a cryocontainer
containing isopropyl alcohol, which slowly reduced the cell temperature at a cooling rate of
1˚C/min when it was stored in a -80 ˚C freezer. This treatment is necessary to allow water
from the intracellular environment to diffuse out of the cells thus inhibit the ice crystal
formation. When the final temperature of -70 ˚C to 80 ˚C was achieved, cell were
transferred to -80 ˚C freezer or liquid nitrogen storage tank.
2.3.2 MTT colorimetric Assay
MTT assay was first described by Mosmann (1983) who introduced a colorimetric assay for
measuring cell viability, which therefore is used as a method for cell proliferation and
cytotoxicity assay. The basic principle of this assay is based on the ability of living and
metabolically-active cells to reduce MTT (3, (4,5-dimethylthiazol-2-yl)-2,5-diphenyl
tertrazolium bromide) salt to formazan product. MTT is soluble in water and, after being
cleaved by the activity of mitochondrial enzymes, is converted to an insoluble crystal-form
purple formazan by the cleavage of the tetrazolium ring.
Healthy cells, which had been sub-cultured at least once and subsequently reached 70-80%
confluency were ready for the MTT assay. Cells density of the single cell suspension (from
section 2.3.1.4 for adherent cells and section 2.3.1.5 for suspension cells) was adjusted to

71
reach a final density of cell at 104 cells/ml. Into each well of a sterile 96-wells microplate,
100 µl cell suspension was added. The template for the anti-cancer assay of the extracts is
shown in Figure 2.1. The cells were then incubated at a temperature of 37 ˚C with 5% CO2.
After 24 hours incubation, cells were examined macroscopically and microscopically to
ensure that there were no signs of contamination and the cells were healthy. Subsequently,
100 µl extracts of Phyllanthus niruri L, which had been diluted with a complete media (and
previously dissolved in DMSO to reach a maximal final concentration in the culture
suspension of 1%) and filtered by a 0.2µm sterile filter, was added into corresponding wells.
The concentration of the extract was prepared in a serial dilution according to the
microplate template, which started with a negative control in the first well (row A) and
doubled each level down until it reached the highest concentration in row H (Figure 2.1).
The assay was performed in triplicate for each extract tested. Cis-platinum, a known anti-
cancer drug was used as a positive control.
Figure 2.1 – The template of MTT assay for anti-cancer test

72
Afterward, the plates were incubated to allow the cell proliferation with or without the
presence of the tested compounds. After five days of incubation, the plates were taken out
from the incubator and 50µl of MTT solution at a concentration of 5 mg/ml was added into
each well. The plates were then kept in the incubator for the next 3-4 hours until the purple
crystals of formazan salt were produced, followed by removing the media through gentle
aspiration of the liquid, leaving the crystals at the bottom of the wells. Subsequently ,200 µl
DMSO was added into each well to dissolve the formazan crystal, followed by the reading of
the absorbance of the formazan solution in microplate reader, at the test wavelength of 450
nanometre (nm) (OD1) and reference wavelength at 690nm (OD2).
The results were expressed as the value of optical density (OD) generated from OD1
subtracted from OD2, which represented the amount of the purple formazan crystal
formation after elimination of the background reading generated from the DMSO,
remaining media or the microplate plastic base. The calculation of cell viability on each well
of the corresponding column on the plate is performed by the following equation:
Cell viability (%) = OD0/ODn x 100%
Where OD0 is the OD from the negative control (row A) and ODn is the OD of the
corresponding well. The mean value of cell viability from each extracts were then plotted on
a graph and used for calculation of the 50% inhibitory concentration (IC50) of each tested
extract.

73
2.3.3 Determination of apoptosis by flow cytometry
One of the most common features of apoptotic cells is the reduction of cellular DNA as the
result of the fragmentation of DNA from the activity of endonucleases. Accordingly, the
measurement of DNA contents of the cultured cancer cells has been intensively used as one
of the methods to observe the efficacy of the anti-cancer drugs to induce cell death
(Darzynkiewicz et al., 1992, Armania et al., 2013). In this study, propidium iodide (PI) flow
cytometric assay was used as a method to determine the cell cycle arrest or apoptosis
points within the cell cycle by staining the cellular DNA with PI as described by Riccardi and
Nicoletti (2006). Propidium Iodide is known as a fluorochrome that binds the nucleic acids
and emits fluorescence emission that is proportional to the DNA content.
To perform the analysis, cultured cells were prepared according to the method described in
section 2.3.1.4 and 2.3.1.5 for adherent and suspension cell lines, respectively, and treated
with the extracts of Phyllanthus niruri L. After certain days of incubation, the cells were
harvested by centrifugation (previously trypsinised for adherent cells only) and removing
the medium without disturbing the cell pellet. A 500 µL fresh medium was added to
resuspend pellet, followed by 4.5 ml of 70% (v/v) cold ethanol to fix the cell samples. After
incubation at -20 ˚C for 30 minutes, the cells were spun down at 1500 rpm for 5 minutes,
followed by subsequent washing with 5 ml of PBS. The pellet was resuspended in 1 ml of
DNA staining solution containing 20 µg/ml PI and 0.2 mg/ml RNAse A (Sigma-Aldrich, Dorset,
UK). The cell solution was incubated for at least 30 minutes in the dark at room temperature
before analysing by Partec CyFlow ML (Sysmex UK Limited, UK). The reading was performed
by 488 nm laser line for excitation to measure red fluorescence (peak at > 600nm) using side
scatter parameter. The reading from 20,000 events was collected to examine the

74
hypodiploid and diploid DNA peaks. The hypodiploid peak corresponds to the apoptotic cells
in sub-G1 phase, whereas the narrow diploid peak represents the normal DNA of cells in the
G0/G1 cell-cycle phase.
2.4 Screening for anti-malaria activity
2.4.1 Malaria parasite culture
Multidrug resistant Plasmodium falciparum strain K1 was used in this study through a
regular cultivation and maintenance of continuous culture using standard technique for
plasmodium culture (Doolan, 2002, Hyde, 1993). Unless otherwise stated, all procedures
during the parasite culture were performed in a class II biological safety cabinet.
2.4.1.1 Preparation of the erythrocytes
Human erythrocytes are the main component of complete medium of plasmodium
parasites; type O+ is commonly used for the culture as it is more compatible with other
blood groups. The anti-coagulated whole blood from the blood bank must be stored at 4 ˚C
in salinized bottles and can be used up to 1 month after blood donation. To prepare the
erythrocytes, the whole blood was centrifuged at 2500 rpm for 5 minutes and the bottom
layer of red blood cells was separated from the plasma and buffy coat of leucocytes. The
clear plasma and the leukocytes were carefully pipetted out. Thereafter, the washed
erythrocytes were resuspended in an equal volume of sterile RPMI 1640-HEPES with 0.3 g/l
L-glutamine and re-centrifuged. This process was repeated two to three times to ensure the
minimal contamination of other blood cells. Finally, the remaining packed red cells were
resuspended in a volume of complete medium (section 2.4.1.2) at a final concentration of
50% haematocrit.

75
2.4.1.2 Preparation of the complete culture medium
Culture medium for parasites culture was RPMI 1640 supplemented with 24mM N-2-
hydroxthylpiperazine-N’-2-ethane-sulfonic acid (HEPES), 0.3g/L L-glutamine (Gibco Life
Technologies, UK) with the addition 50 mg/ml hypoxanthine, 4g/L glucose, 50mg/L
gentamycin, and 10% (w/v) Albumin bovine serum fraction V (Sigma-Aldrich, Dorset, UK).
The medium was stored at 4 ˚C until required.
2.4.1.3 Recovery of the frozen parasites
Parasites stocks were kept frozen in liquid nitrogen and, prior to cultivation, quickly thawed
by leaving the cryovials in a 37 ˚C waterbath. The content of the cryovials was transferred
into sterile 1.5ml eppendorf tubes and the parasites were spun down by centrifugation at
12.000 rpm for 1 minute. The supernatant was discarded, following by the addition of 1ml
of sterile 10% (v/v) sorbitol in PBS to draw the glycerol out of the cells, allowing the
parasites to recover and ready for cultivation. After 1 minute of incubation, the parasites
was centrifuged to discard the supernatant and subsequently washed in 5% (v/v) sorbitol in
PBS. The centrifugation was repeated to discard the supernatant. Finally, the parasites were
resuspended in 1 ml of complete medium. For the initial cultivation after recovery from
frozen state, the washed parasites suspension was combined with 0.5ml freshly washed
erythrocytes and 10ml of complete media, then proceed to the culture procedure as
described in section 2.4.1.4. The newly cultured parasites required about 1 week with 1-2
subculture before returning to normal growth rate (Doolan, 2002)
2.4.1.4 Culture procedure
The cultivation of plasmodium parasites in complete media is typically started at
parasitemia of 0.5% in 0.1-1% haematocrit. The medium and haematocrit stock were pre-

76
warmed before using. To determine the parasitemia prior to subculturing, the existing
plasmodium culture was checked by manual counting infected blood as described in section
2.4.1.5.
To perform the subculture, the flask containing parasitized blood was gently transferred in
the sterile cabinet to prevent dislodging of blood from the layer on the floor of the culture
flask. The medium was carefully removed from the flask by pipetting the medium out from
the bottom corner to prevent the removal of the infected blood. By removing approx. 9-10
ml of medium, the remaining blood in the flask was at a concentration of approx. 50%
haematocrit. After measuring the parasitemia level, the culture was diluted with fresh
washed red blood cells to bring back the parasitemia to the level of 0.1-1%. Subsequently,
the culture was transferred into a new flask with the addition of fresh complete medium
added to give a 5% final haematocrit. Afterwards, a mixture of gas containing 5% CO2, 5% O2,
and 90% N2 (BOC Limited, UK) was passed into the flask for approx. 15 seconds, and the
culture was subsequently incubated in the 37 ˚C incubator (Lee culture safe touch 190 CO2,
Lee Limited, UK).
Cultures were regularly checked to observe the parasitemia level. The parasite growth will
be distressed if the parasitemia level is more than 30%. Accordingly, the medium was
changed on a regular basis, which was performed every 2-3 days. The infected bloods tend
to form a layer on the floor of the flask, thus the old medium could be carefully pipetted out
from the above layer to minimize the disturbance of the settled blood cells and replaced by
fresh pre-warmed medium.

77
2.4.1.5 Thin blood smear
The blood smear was taken from a culture flask prior to subculturing or further antimalarial
assay to measure the parasitemia level and observe the stage of parasitemia. 10 µl of red
blood cell suspension were pipetted out of the flask and transferred to the surface of a
clean microscope slide. The blood drop was thinly smeared across the surface of the slide to
create a monolayer of well-spaced red blood cells for easy counting of the parasitemia level.
After the blood smear dried, the slide was fixed in 100% methanol by irrigation method. The
slides were left at room temperature to dry. Giemsa staining was used to stain the blood
film by covering the slide with a sufficient volume of the staining for a minimum of 20
minutes. To remove the excess Giemsa stain, the slide was briefly washed under a gentle
stream of running water for approx. 20 seconds. After air-drying, the blood smear was
examined using a Leica DM 500compound microscope and a 100x objective lens. Calculating
the parasitemia level was performed by counting 100-200 red blood cells per field of view
and noting individual red blood cells containing parasites. The parasitemia was obtained
from the average number of infected red blood cells from a minimum of three field of view.
2.4.1.6 Cryopreservation of plasmodium
The parasites culture were allowed to reach a 15-20% parasitemia level and brought to 50%
haematocrit. The parasites were spun down by centrifugation at 3400 rpm for 5 minutes.
Subsequently, the pellet was resuspended in the complete medium, and 0.5 ml of the
suspension was divided in cryovials. Equal volume of 20% (v/v) DMSO was added into each
tube which then immediately immersed in liquid nitrogen.

78
2.4.2 Flow-cytometry-based analysis of plasmodium drug sensitivity
The method used in this project was a fluorescence-based assay by the detection of the
fluorescence signals arising from the parasites DNA when stained with SYBR green, a
fluorescent DNA binding dye that binds all double-stranded DNA. The quantification of the
measurement results was achieved by flow cytometry, by which the high-throughput
individual cell sorting is allowed.
Plasmodium sensitivity assay was a modification of the method described by Karl et al.
(2009). From the 25ml culture flask, plasmodium culture at 0.5% parasitemia and 5%
haematocrit was transferred into a 96-well plate with a final volume of 200 µl/well. A stock
with the maximum dose was prepared for each extract by dissolving samples with DMSO
with the precaution that the final DMSO concentration in the culture well must not exceed a
1% final concentration. A set of serial dilution of Phyllanthus niruri L extracts were prepared
in complete culture medium without hypoxanthine. Following the seeding of the
plasmodium culture in the 96-well plates, the extract samples were added into the
corresponding wells. All experiments, including the negative control, were performed in
triplicate.
After 72 hours incubation, the content of each of microplate well was transferred into clean
eppendorf tubes and centrifuged at 3400 rpm for 90 seconds. Subsequently, the pellet was
washed carefully with PBS for 2-3 times. The pellet was then resuspended in 2.5 x SYBR
Green® I in PBS and incubated in the dark at room temperature for 20 minutes. Samples
were then centrifuged at 3400 rpm for 90 seconds, the supernatant was removed and the
pellet was resuspended in 250µL of 1% (v/v) paraformaldehyde in PBS for cell fixation. After
a 30 minutes fixation at 4 ˚C, the samples were washed twice with PBS and kept at 4 ˚C

79
protected from light before being analysed on a FACS Verse flow cytometer system (BD
Biosciences, Oxford, UK). The reading was performed by 497 nm laser line for excitation to
measure green fluorescence (peak at 520 nm) against side scatter and forward scatter
parameters. The reading from 50,000 events was collected to examine DNA peaks in mono-
nucleated and multi-nucleated parasites.
2.5 Screening for anti-platelet activity
2.5.1 Isolation of washed platelet
Blood obtained from the blood centre was prevented from the coagulation by the addition
of acid citrate dextrose (ACD) containing 85mM sodium citrate, 65mM citric acid, and
110mM dextrose. The isolation of platelets was conducted by the differential centrifugation
method as described by Májek et al. (2010). Citrated whole blood was centrifuged at 1250
rpm for 15 minutes to obtain platelet rich plasma (PRP). Prostaglandin E1 (PGE1) was added
at final concentration of 1 μM, then incubated at 37°C for 10 minutes, followed by
subsequent centrifugation at 2500 rpm for 10 minutes. The platelet pellet was resuspended
in a Ca2+ free Tyrode’s buffer (140 mM NaCl, 3 mM KCl, 12 mM NaHCO3, 0.4 mM NaH2PO4, 2
mM MgCl2, 5.6 mM glucose; pH 6.2) in the addition of 1 μM prostaglandin E1 (PGE1) and
centrifuged at 2500 rpm for 10 minutes and the supernatant was carefully removed and
discarded. The platelet pellet was then resuspended in a Tyrode’s buffer (140 mM NaCl, 3
mM KCl, 12 mM NaHCO3, 0.4 mM NaH2PO4, 1 mM MgCl2, 2 mM CaCl2, 5.6 mM glucose; pH
7.4) to give a standard platelet suspension (SPS) with a final concentration of 1-3 × 10⁸
cells/ml. An automated haematology analyser PocH-100i (Sysmex Corporation, Kobe, Japan)

80
was used to count the platelet numbers. Unless otherwise stated, all procedures were
performed at room temperature.
2.5.2 Platelet aggregation assay
This assay was performed using the basic principle of measuring the changes of light
transmission through resting and aggregated platelets suspensions in a 96-wells microplate.
The method previously described by Bednar et al. (1995) allows a simultaneous
measurement of multiple samples in a relatively short period of time.
The SPS previously prepared according to section 2.5.1 and incubated at 37 ˚C prior to the
aggregation test to maintain platelet function. The samples were divided into three groups;
treatment, negative control, and positive control. Each group was repeated in triplicate.
Crude extracts (5 µl) were added to each well of treatment group. Subsequently, 100 µl of
SPS was transferred into each well, including all control groups wells and the samples left at
room temperature for 15 minutes. Into each corresponding well, excluding the negative
controls, 5 µl of platelet agonist was added. Immediately thereafter, the first absorbance
reading were taken with a 405 nm filter using Multiskan FC microplate photometer (Thermo
Scientific, Massachusetts, United States), and the timer was started to record the
aggregation time. After the first reading, the plate was continuously agitated at 1000 rpm
and subsequent readings were recorded at 1 minute intervals. The aggregation data was
collected at 405nm for 10 minutes at room temperature. Platelet aggregation was
calculated by subtracting the final reading from the initial reading collected from the same
well. Data normalisation was performed by comparing it with the maximum response from
the corresponding platelet agonists controls.

81
2.5.3 Platelet activation and protein extraction
Platelet activation for protein extraction was conducted according to the method described
by Májek et al. (2010). The SPS, as previously prepared, was divided into a 1 ml aliquots. The
compound to be tested was added into one sample group designated as the P group,
whereas the resting platelets and platelet-agonist activated platelets were designated as R
and A groups, respectively. After incubation of the samples at 37°C for 30 min, the agonists
were added to the P and A tubes, followed by agitation of the tubes at 1000 rpm to initiate
platelet activation and aggregation. The resting platelets group (R samples) were left
untreated as negative controls. Ten minutes after aggregation induction, a four times
volume of cold acetone was added into all tubes, including the resting platelets, and the
samples left for 2 hours at -20 ˚C to precipitate total proteins. The protein pellet was spun
down by centrifugation at 13.000 rpm for 10 minutes and the supernatant discarded. The
platelet proteins were stored at -80 ˚C until further proteomics analysis (as described in
section 2.8).
2.6 Identification of the active compound
Isolation and identification of the active compounds were conducted according to the
guidance of the bioassay-guided isolation protocol as previously described. Briefly, the
active extract was separated by column chromatography, followed by bioassay test to
determine which fractions were most likely to contain the active substances. Furthermore,
the compounds were isolated and purified by HPLC technique, and finally analysed by
spectrometry technique to identify their molecular structures.

82
2.6.1 Fractionation of the active extract
The bioactive extracts were further purified by column chromatography using HP-20
absorbent resin with successive elution using different concentrations of methanol,
according to the protocol described by Iizuka et al. (2007). HP-20 is a styrene-divinylbenzene
based resin used for the capture of hydrophobic compounds. The size of the particles range
from 250 to 850μm and the average pore size is 260 Å. The resin was prepared in a column
according to the instruction from the manufacture. Briefly, 20 g of resin was immersed in
100% methanol for 15 minutes with occasional stirring. The solvent was removed by
decanting and replaced with an equal amount of distilled water and the resin slurry was
allowed to stand for another 15 minutes. The resin slurry was loaded onto a 50 cm x 1.5 cm
column, and allowed to settle down to give an approximate bed volume of 50 cm2.
Subsequently, 2 g of dried extract was dissolved in a small amount of distilled water and
applied onto the column. The column was eluted with a methanol gradient starting with
100% water, followed by 80% (v/v) methanol, and finally 100% methanol. Fractions from the
column were collected, and the solvent removed by evaporation and freeze drying as
described in section 2.2.2.
2.6.2 Isolation and purification of the active compound by HPLC
Fractions obtained from the previous separation process were subjected to further
fractionation and purification procedure by a high performance liquid chromatography
(HPLC). For analytical reverse phase HPLC, a C18 5u GraceSmart Reverse Phase column, 250
mm in length and 2.1 mm internal diameter was used (Grace, Columbia, United States),
while a Hyperclone ODS column, 250 x 21.1 mm, 5µm, (Phenomenex) was used for the
preparative scale separations. The mobile phase for analytical and preparative HPLC was a

83
mixture of acetonitrile and 0.5% (v/v) trifluoroacetic acid in water. Mobile phase
compositions of 0.5% TFA:acetonitrile were 85:12 and 88:12 were used in the initial
separation process, gradient and isocratic system were exercised for the analytical scale.
Prior to injection onto the column, samples were dissolved in 30% (v/v) methanol and
filtered with a 0.2 µm syringe filter. Conditions were optimised on the analytical column and
the mobile phase that produced the best separation was applied in the preparative HPLC
separations. The eluent was monitored by UV detection at 254nm and the data was
recorded using a PicoLog ACD software (Pico technology Ltd, Cambridge, UK).
2.6.3 Molecular structure identification
2.6.3.1 Infrared (IR) spectroscopy
Infrared spectrum of the compound was measured using Nicolet iS10 Fourier transform
infrared (FTIR) spectrometer (Thermo Scientific, Massachusetts, United States) according to
the manufacturer’s protocol. The IR spectra was identified and analysed by OMNIC Spectra
software provided in the spectrometer system.
2.6.3.2 NMR spectrometry
NMR experiments were performed using Bruker AV400 NMR spectrometer in the NMR
laboratory of Salford Analytical Services centre. Samples were dissolved in deuterated
DMSO (DMSO-d6) and filtered through a cotton wool pugged Pasteur pipette and then
placed in 5mm NMR tubes (Norell, United States). A very small amount of tetramethylsilane
(TMS) was added to the sample solution to be used to reference the 1H and 13C spectra.
Therefore all resonance assigned are relative to TMS. The NMR experiments were analysed
using “TopSpin” software under automation controlled by “iconnmr”. The 1D 1H and 13C

84
NMR experiments were carried out. In addition, homo and heteronuclear 2D experiments,
COrrelated SpectroscopY with gradients (g-COSY) and Heteronuclear Multiple-Quantum
Correlation (HMQC) spectra were also acquired. All pulse sequences used were standards
used in Bruker instruments.
2.6.3.3 Mass spectrometry
Samples of small molecular weight natural products were sent to Intertek Analytical
Services, Blackley, Manchester for accurate mass analysis. Waters ZQ detector integrated
with Waters 265 Alliance HPLC system (Waters Corp, Milford, MA) was used for the
experiment. Prior to the injection to the HPLC system, the sample was dissolved in 50% (v/v)
acetonitrile in water. Typically volume injected is 10ul of approximately 1mg/ml. The eluent
was 9:1 ACN/water at 0.15ml/min and 2 second scans were acquired over the range m/z
100 to 1500 in positive and negative ion modes. The sample was introduced into an
electrospray (ES) ionization source to ionize the molecules at atmospheric pressure. The
ions were separated according to their mass-to-charge ratio. The separated ions were
detected by the detector which then amplified the signals and sent the spectra to the
Waters Empower software for further MS analysis
2.7 Analysis of platelet membrane glycoprotein receptors by flow cytometry
In this study, CD61 was used as the primary platelet marker due to its interaction with
integrin β3 chains, which are abundantly expressed on the platelet surface. To observe
platelet activation with or without the presence of the antiplatelet agent, the activated-
platelet marker used were GPIIb/IIIa marker (PAC-1) and P-selectin marker (CD62P) that
recognize the glycoprotein complexes of activated platelet.

85
The procedure for the platelet preparation and immunofluorescence staining of activated
and resting platelets were in accordance with the manufacturer protocols (BD Bioscience,
Oxford, UK). Platelets were isolated from citrated-anticoagulated whole blood by
centrifugation at 1250 rpm for 10 minutes to obtain the PRP, followed by further
centrifugation at 2500 rpm for 10 minutes after the addition of 1 µl prostaglandin E1 (PGE1).
Subsequently, the isolated platelets were washed twice in PBS and then resuspended in PBS
to obtain the platelet suspension, which was divided into three groups; resting, ADP-
activated, and corilagin-pretreated prior to ADP activation. The dose of ADP was 25 µM, and
the corilagin was added at the final concentration of 100 µg/ml. Subsequently, 2% of
formaldehyde was added, to fix the platelets, and samples incubated at room temperature
for 30 minutes, followed by two-times PBS washing to remove the remaining fixative agent.
The immunofluorescent staining with fluorescent-labelled monoclonal platelet antibodies
panel (CD61 PE, PAC-1 FITC, and CD62P APC) was conducted by pipetting 100µl of each of
the platelet samples into an eppendorf tube and adding 30 µl of the antibody mixture,
followed by the incubation in the dark at room temperature for 30 minutes. The unbound
antibodies were removed by washing using PBS followed by centrifugation at 2500 rpm for
5 minutes. This step was repeated twice and the final platelet pellets were resuspended in
500 µl of PBS before the analysis with FACS Verse flow cytometer system (BD Biosciences,
Oxford, UK). The reading was performed by 488 nm and 640 nm laser lines for excitation to
measure the fluorescence emission of Fluorescein/FITC (peak at 518 nm), Phycoerythrin/PE
(peak at 578 nm), and Allophycocyanin/APC (peak at 660 nm). The reading from 100,000
events was collected to examine the antibodies peaks.
86
2.8 Proteomics analysis
Proteomics studies in this thesis were performed by the analysis of isolated proteins under
three different conditions; untreated, stimulated, and with the presence of the isolated
compounds.
2.8.1 Two-dimensional gel electrophoresis
The protein samples were resuspended in sample buffer (7 M urea, 2 M thiourea, 4% w/v
CHAPS, 65 mM DTT, 1.5% v/v ampholytes, and a trace of bromophenol blue) and
centrifuged at 13,000 rpm for 1 hour. The clear protein containing supernatant was
collected and the undissolved pellet was discarded. Protein was quantified using 2D Quant
Kit according to the manufacturer’s protocol.
To load the protein sample into the IPG strips, 125 µl of the sample (containing 150 µg
protein) was pipetted along the channel of rehydration tray, followed by the application of
the IPG (7 cm) strip onto the sample. The strips were incubated at room temperature for at
least 16 hours to allow the complete rehydration of the strips. The proteins were
subsequently separated according to their isoelectric points using the Protean IEF System
(Bio-Rad Laboratories, Hertfordshire, UK). The isoelectric focusing (IEF) condition were 100
V for 40 min, 200 V for 20 min, 450 V for 15 min, 750 V for 15 min, reaching 2000 V in 10
min, for a total of 4000 Vh (max 0.125 mA and 0.125 W per strip). Following the IEF, the
strips were equilibrated in DTT buffer (6 M urea, 50 mM Tris pH 6.8, 2% (w/v) SDS, 1% w/v
DTT, 30% (v/v) glycerol, containing a trace of bromophenol blue) for 20 minutes. The strips
were then transferred to a iodoacetamide buffer (6 M urea, 50 mM Tris pH 6.8, 2% w/v SDS,
2.5% w/v iodoacetamide, 30% v/v glycerol, and a trace of bromophenol blue) for further 20
minutes.

87
The second separation of the proteins was performed by SDS-PAGE (sodium dodecyl
sulphate polyacrylamide gel electrophoresis) using a 12% polyacrylamide gel (1mm thick).
The IPG strip was placed on the SDS polyacrylamide gel and sealed with 0.5 % (w/v) agarose
overlay. The gels were then placed in the electrophoresis tank filled with Laemmli running
buffer (1 g/l SDS, 14.4 g/l glycine, and 3 g/l Tris pH 8.3) run at a constant voltage of 200V.
The electrophoresis was stopped before the bromophenol blue dye reached the lower level
of the gel. The gels were stained with Coomassie blue and scanned with GS-800 Calibrated
Densitometer (Bio-Rad Laboratories, Hertfordshire, UK) to obtain 16-bit grayscale pictures.
2.8.2 Coomassie blue staining
After electrophoresis, the gels were gently removed from the glass slab, transferred into a
suitable container, and washed briefly with distilled water to remove the remaining buffer.
Gels were initially stained with Coomassie blue 0.1% (w/v) in fixative solution (40% (v/v)
methanol and 10% (v/v) acetic acid. Destaining was achieved using several changes of
destaining solution (20% (v/v) methanol and 7% (v/v) acetic acid.
2.8.3 Image analysis
The gel images were analysed using the ImageJ software (Rasband, W.S., ImageJ, U. S.
National Institutes of Health, Bethesda, Maryland, USA, 1997-2014).The 2D gels were
examined with the aid of suitable ImageJ plugins, following a protocol as described by
Natale (2011); including bUnwarpJ and Watershed. The earlier plugin was used to align the
images with a reference image, in order to remove the spatial distortion of the images
resulting from dye-front deformation and run time differences, whereas the latter plugin
performed the spot detection on the images. All data was normalised and statistically
analysed by Anova test.

88
2.8.4 Label-free protein quantitation and proteomics analysis
Label-free quantitative proteomics analysis is a proteomics platform based on the
observation that the intensity of the MS spectrum is linearly proportional to the
concentration of the ion being detected. (Levin et al., 2007) .
The isolated platelet proteins samples (section 2.5.3) were quantified and the
concentrations were adjusted to obtain an equal amount of protein between all samples.
To perform tryptic digestion, 50 µl of each sample was washed using 0.05% (w/v) RapiGest
washing solution (Waters Corporation, USA) in 50 nM ammonium bicarbonate.
Subsequently, the samples were reduced using 100 mM dithiothreitol (DTT) at 60°C for 15
minutes and alkylated at 25°C for 45 minutes in the presence of 200 mM iodoacetamide.
Proteolytic digestion was performed overnight, using sequencing grade trypsin (Promega,
USA) at a ratio of 1:50 (w/w) in a 37°C incubator. The digested proteins were hydrolysed by
the addition of TFA at 37°C, before being vortexed and subsequently centrifuged at 13.000
rpm for 30 min.
The separation and subsequent mass spectrometry analysis of the tryptic peptides was
performed according to the protocol described by Rodriguez-Suarez et al. (2013). Briefly, 1D
nanoscale LC separation was performed with a nanoAcquity system (Waters Corporation,
USA), employing a symmetry C18 5µm pre-column (20 cm x 180 µm) and a BEH C18 1.7 µm
analytical RP column (20 cm x 75 µm). Mobile phase used were water (A) and acetonitrile
(B) containing 0.1% (v/v) formic acid. After desalting and preconcentration, peptides were
eluted from the pre-column to the analytical column and separated with a gradient of 3-
40% mobile phase B over 90 min at a flow rate of 300 nl/min, followed by a 10 min column
89
rinse with 90% mobile phase B at a flow rate of 300 nl/min and a constant temperature of
35°C.
Mass spectrometry analysis of the complex peptide mixtures was performed using SYNAPT
G2-S HDMS mass spectrometer (Waters, Manchester UK), operated in a data-independent
manner coupled with ion mobility (HDMSE). The analysis was performed in electrospray
ionization mode with nominal resolution >20,000 FWHM. The experiment was programmed
to step between low energy (4 eV) and elevated (14-40 eV) collision energies on the Triwave
collision cell, using a scan time of 0.9 s per function over 50-2000 m/z. All samples were
analysed in triplicate. Alignment of precursor and product ions by drift and retention time
aids peptide identification by assignment of product ions to parent ions during data
processing and database searching.
Protein identifications and quantification information were obtained using PROGENESIS QI
by searching UNIPROT human database. Datasets of protein were investigated to assess the
biological role, molecular function, and cellular localization by the aid of PANTHER
classification system (Mi et al., 2013). Finally, pathway analysis was conducted by the aid of
Panther pathway analysis and Reactome analysis tools.
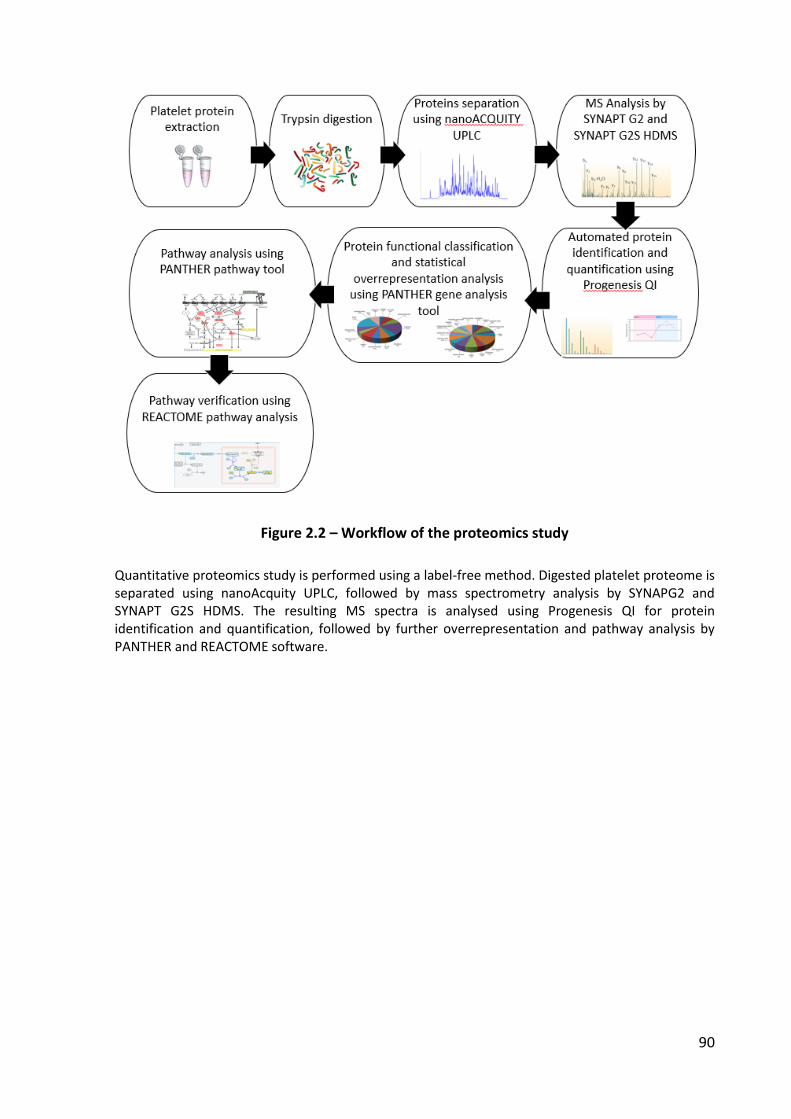
90
Figure 2.2 – Workflow of the proteomics study
Quantitative proteomics study is performed using a label-free method. Digested platelet proteome is separated using nanoAcquity UPLC, followed by mass spectrometry analysis by SYNAPG2 and SYNAPT G2S HDMS. The resulting MS spectra is analysed using Progenesis QI for protein identification and quantification, followed by further overrepresentation and pathway analysis by PANTHER and REACTOME software.

91
2.9 Statistical approach
2.9.1 Calculation of IC50 value
Data from MTT colorimetric assays (section 2.3.2), SYBR green flow cytometry assays
(section 2.4.2), and platelet aggregation assays (section 2.5.2), was further analysed using
Graphpad prism 5.0 (GraphPad Software, San Diego California USA). For data
normalisation, the largest value in the data set corresponds to 100% and the smallest
corresponds to 0%. Log-transformed drug concentrations were plotted against the dose
response and the IC50 values were determined using non-linear regression.
2.9.2 Statistical analysis
All data set was analysed using Graphpad prism 5.0. Data were presented as mean ±
standard mean error (SEM). Statistical analysis was performed by two-way ANOVA test with
Bonferroni’s multiple comparison post-test. A p-value of < 0.05 was considered statistically
significant.

Chapter 3Extraction of the Crude
Extracts
93
3.1 Introduction
The extraction of the plant was carried out by the maceration method as described in
section 2.2.1., in order to preserve most of the constituents contained in Phyllanthus niruri
L. Having suggested that this plant contains a plentiful amount of secondary metabolites,
which encompasses distinct physical and chemical properties, as well as to be able to
maximise the quality of the yielding crude extract, the extraction process must be able to
minimise the possibility of losing the active substances due to various confounding factors.
Some of the most common problems in natural product extraction are the excessive heat
(i.e., during Soxhlet extraction), which may cause the degradation of thermolabile
components and the evaporation of the volatile compounds during the solvent removal to
yield a solvent-free crude extract.
To address the former issue, this study implemented a basic solvent extraction method, or
maceration, that relies solely on the capability of the solvents used to disrupt the cell wall of
the plant, diffuse into the cells, solubilize the intracellular metabolites, and diffuse out into
the enriched extractant. Accordingly, this procedure does not apply any other additional
treatments to the plant material, which might potentially affect the stability of the
secondary metabolites being extracted. However, as the extraction rate is limited to a
certain point where equilibrium between the extractants and plant cells has been achieved,
several changes of fresh solvent were needed.
Seidel (2006) determined that total extraction is commonly carried out by a polar organic
solvent (ethanol, methanol, or an aqueous alcoholic mixture) targeting to extract a maximal
amount of compounds, this can be attributed to the solvents' ability to increase cell wall
permeability, facilitating the efficient extraction of large amounts or polar and medium-to-

94
low polarity constituents. In addition, the use of less-polar solvents (hexane and chloroform)
is beneficial for the extraction of a group of relatively non-polar substances i.e., lipid and
terpenoids (Harborne, 1998).
3.2 Result
3.2.1 Characteristics of the plant material
The starting material of Phyllanthus niruri L plant was obtained from the healthy leaves,
which were prepared by the air-drying and grinding into a fine powder. The product was
packed in an airtight container to maintain optimal conditions during shipping. The physical
characteristics of the product were a dry yellowish-brown powder and an approximate 8%
moisture content. The physical appearance of the plant material is shown in Figure 3.1 and
comprehensive information of the plant material is available in (Appendix 1). In compliance
with the standard requirement for the production of herbal preparations, the plant material
had been previously screened by the manufacturer for the presence of substances, which
might affect the purity of the product or serve as hazardous contaminants. The result of the
analysis is summarized in the Table 3.1.
Microbiological screening shows the absence of Escherichia coli (E. coli) and salmonella in
the plant material. Total plate count (TPC) number, which represented the total aerobic and
mesophilic microorganism colonies (including bacteria, yeast and mould fungi) grown from a
sample of plant material on an agar plate at 30 ˚C, was less than 5000 colony forming unit
per unit weight (cfu). These numbers were found to be far below the control limit for a
herbal remedy agreed by the European commission (Pharmacopoeia, 2002); not more than
105 cfu/g for bacteria and 105 cfu/g for fungi based on TPC method, and should be free from

95
E. coli and salmonella (Kolb, 1999). The quantitative tests had shown that the concentration
of aflatoxins, heavy metals (arsenic, lead, cadmium, and mercury) and pesticide residues
contained in the plant material were also within the acceptable limits for herbal medicines
and products regulation, according to the world health organization (WHO, 2007). Overall,
the plant material used in this study for further process of extraction, purification, and
biological assay procedure is of acceptable condition.
Table 3.1 – Compositions of the impurities of Phyllanthus niruri L powder
Contaminants Concentration
Microbial contamination
Total plate count (TPC) < 5.000 cfu1/g
Yeast and mould < 100 cfu/g
Coliform none
Escherichia coli none
Salmonella none
Toxic metal contamination
Lead (Pb) < 10 ppm2
Cadmium (Cd) < 0.3 ppm
Arsenic (As) < 10 ppb3
Mercury (Hg) < 0.5 ppm
Toxin
Total aflatoxin < 20 ppb
Pesticides
Organophosphate and organochlorine < 5 ppb
The method for the detection of each contaminant was performed according to the Quality Control Methods for Medicinal Plant Material (WHO, 1998). (1Coloni forming unit, 2part per million, 3part per billion).

96
3.2.2 Characteristic of the yielding extracts
Typical weights of the extracts, obtained with the different solvents used, were 18.7 g in the
water extract, 5.2 g in the methanol extract, 4.7 g in the ethanol extract, 1.3 g in the
chloroform extract, and 0.8 g for the hexane extract. Table 3.2 explains the physical
appearance of each extract, and the yield compared to the initial weights of starting plant
material. Figure 3.1 shows the pictures of each step of the extraction procedure. The
starting material of Phyllanthus niruri L powder was the yellowish-brown powder on the top
part of the Figure 3.1.
After three consecutive days of maceration with water, methanol, ethanol, hexane, and
chloroform, the extractant and the plant residue (marc) were separated by filtration. The
intensity of each filtrate decreased from water, methanol, ethanol, chloroform, and hexane.
Water extraction was found to leave insignificant amount of residue as the plant powder
was almost completely dissolved in water. The marc left from methanol extraction gave a
compact appearance with a darker colour. The appearance of other marc; from ethanol,
hexane, and chloroform, were relatively similar to the starting material.
Table 3.2 – Extraction yield
Extraction solvent Extract yield (w/w) Extract description
Water 18.7% Brown, dry flake consistency
Methanol 5.2% Dark brown, thick consistency
Ethanol 4.7% Dark green, thick consistency
Hexane 0.8% Light green, viscous oil consistency
Chloroform 1.3% Dark green, flakes and oil-like consistency

97
Water ChloroformHexaneEthanolMethanol
Filtrates
Marcs
Crude Extracts
Figure 3.1 – The physical appearance of each phase of Phyllanthus niruri L extraction.
The maceration was started with the powder of Phyllanthus niruri L leaves. The filtrate from the water extraction was a dark-brown extractant that yielded a brown-and-flakes-appearance dry extract. Methanol extraction yielded a thick crude extract from the evaporation of a yellowish filtrate with a reduced amount of marc compared to the starting material. Ethanol, chloroform, and hexane maceration resulted in clear light green filtrates and yielded a dark-green, light green, and greenish crude extracts.

98
3.2.3 Initial screening of the crude extracts constituents
Preliminary analysis of the constituents of the crude extracts is useful as an exercise to
identifying the possible phytochemical groups contained in each preparation. In this study, a
series of phytochemical screens was performed on each extract using various methods
previously described by Harborne (1998). The result revealed the presence of saponin,
alkaloid, flavonoid, tannin, amino acid, and carbohydrate. Steroid, triterpenoid, and
glycoside were not detected in all extracts. Water and methanol extracts contained more
groups of compounds, while the chloroform extracts contained the least constituents.
Table 3.3 – Phytochemical screening of Phyllanthus niruri L extracts
Water extract
Methanol extract
Ethanol extract
Hexane extract
Chloroform extract
Saponin
Foam test + + - + -
Alkaloid
Wagner's test + + + + +
Flavonoid
Ferric chloride + + - - -
Tannin
Gelatine test + +
Bromine water test + + + + +
Amino acid
Ninhydrin test + + + + +
Carbohydrate
Benedict test + + + - -
Steroid/Triterpenoids
Liebermann-Burchard's test - - - - -
Salkawaski's test - - - - -
Glycoside
Keller Killiani's test - - - - -

99
The ultraviolet absorption spectra of the extracts was measured from a solution consisting
of a dilution of the crude extracts with the extraction solvents. To remove the background
reading, the spectra were measured against the corresponding solvent. Due to the nature of
the colour of the extracts, the wavelength range for the measurement was set from 200 to
700 nanometre (nm) to cover all the possible occurring plant pigment's spectral range
(Harborne, 1998).
The spectra recorded major wavelength maxima at 205-210 nm and 268-280 nm on all
extracts, and also wavelength minima at 248-258 nm. In the chloroform extract, the 205-
210 nm wavelength maxima was comprised of multiple peaks instead of the finely resolved
peak, this is due to chloroform’s strong absorption in the 200-260 nm region. Although all
spectra showed similar absorption of the UV region, the presence of additional bands
within these regions is an indication of the occurrence of any of numerous compounds such
as tannins (280 nm), quercetins (255 and 366 nm), phenolics (255 and 365 nm), flavonoids
(325 nm) and so on (Nakweti et al., 2013). In addition, there was a single peak occurred in
the region of 460 nm on water, methanol, and hexane extracts; which was relatively intense
in the latter extract. This peak might correspond to chlorophyll and carotenoid, organic
pigments produced by plants, which provides the green and yellow colour presented on the
extracts, respectively. (Harborne, 1998). Taken together, the spectra indicated the richness
of the constituents within the crude extracts.

100
Figure 3.2 – Ultraviolet absorption spectrum of Phyllanthus niruri L extract.
Water and methanol extracts showed wavelength maxima at 210, 268, and 460 mm and minima at 248 and 460nm. Ethanol extracts wavelength maxima were at 210 and 270 NM; minima at 250 NM. Hexane extract spectrum had wavelength maxima at 209, 275, and 460 nm, and minima at 255 and 460 nm. Chloroform extracts showed a noise peak at 200-220 NM, wavelength maxima at 240 and 282 NM, and wavelength minima at 258 nm.
Water Extract Methanol Extract
Ethanol Extract Hexane Extract
Chloroform Extract
101
Infrared (IR) spectra were recorded for all extracts to measure the absorbance of the
infrared frequencies caused by the vibrations (stretching and bending) of particular bonds
presence in each extract. The spectra were collected between wavelength numbers of 4000
and 600 cm-1 for all extracts.
Water, methanol and ethanol extract exhibited a broad band in the region from 3600 – 3000
cm-1, which was absent on the other two extracts spectra (hexane and chloroform). Such
band is attributed to the stretching frequency of O-H and N-H bonds presented in the
containing molecules of the extracts. In the region of 1607 – 1607 cm-1, a peak of medium
intensity occurred (in water, methanol, and ethanol extracts) which might be related to the
vibration of N-H bond in addition to a C-N stretching band in the region from 1080 – 1040
cm-1. Accordingly, the occurring peaks were attributed to the presence of aliphatic
functional groups such as amine groups in the extracts. Moreover, the IR absorption above
3000 cm-1 suggested that the compound is likely to be unsaturated as it contains C=C or
aromatic bonds (Coates, 2000).
In general, the IR absorbances recorded in the region below 1500 cm-1 represented the
characteristics of what is known as the fingerprint region due to the vibration of bonds of
specific functional groups. Three crude extracts (water, methanol, and ethanol) exhibited
several peaks within the region of 1420-1370 cm-1 and 1170-1150 cm-1 that are
characteristic of S=O bond stretching, thus suggesting the presence of the organic sulphate
groups. In the region of 1350-1250 cm-1, specific peaks caused by P=O bond vibrations were
found, in the same spectra, which suggested the presence of organic phosphates. Spectra
from hexane and chloroform extracts showed several absorbance peaks in the region
around 1270-1250 cm-1, which can be attributed to Si-methyl group vibration, and in the

102
region from 900-800 cm-1 due to Si-H vibration. Such bands possibly showed the occurrence
of silicone organic compounds as one of the constituents in ethanol and hexane extracts.
Within the frequency in the spectrum of ethanol, hexane, and chloroform extracts, there
was a strong and intense peak within the region of 1705-1660 cm-1, which was attributed to
C=O bond stretching. There was another peak at around 1440-1395 cm-1 region that
occurred due to C-O bond vibration which, together with the former peak, might be
assigned to the ketone, general ester, and carboxylic acid groups in the extract.
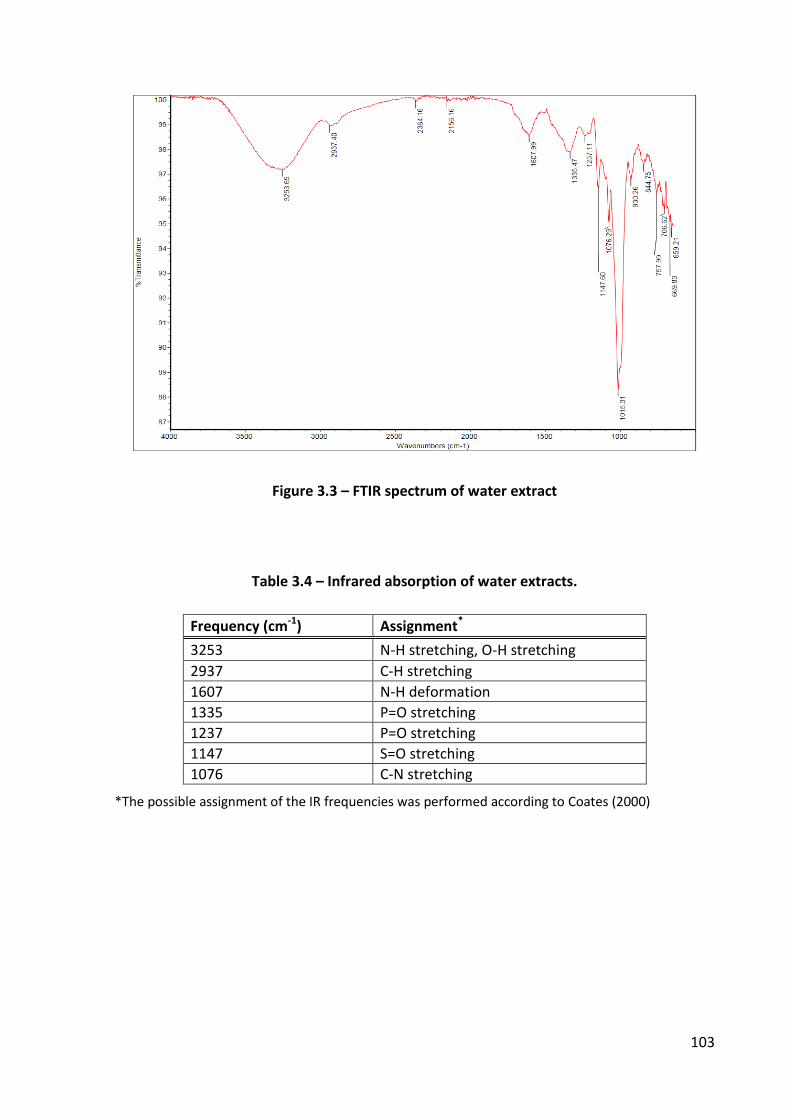
103
Figure 3.3 – FTIR spectrum of water extract
Table 3.4 – Infrared absorption of water extracts.
Frequency (cm-1) Assignment*
3253 N-H stretching, O-H stretching
2937 C-H stretching
1607 N-H deformation
1335 P=O stretching
1237 P=O stretching
1147 S=O stretching
1076 C-N stretching
*The possible assignment of the IR frequencies was performed according to Coates (2000)

104
Figure 3.4 – FTIR spectrum of methanol extract
Table 3.5 – Infrared absorption of methanol extract
Peak Frequency (cm-1) Assignment*
3237 N-H stretching, O-H stretching
2980 C-H stretching
1605 N-H deformation
1443 S=O stretching
1342 P=O stretching
1202 S=O stretching
1148 S=O stretching
1073 C-N stretching
*The possible assignment of the IR frequencies was performed according to Coates (2000)

105
Figure 3.5 – FTIR spectrum of ethanol extract
Table 3.6 – Infrared absorption of ethanol extract
Peak Frequency (cm-1) Assignment*
3344 N-H stretching, O-H stretching
2919 C-H stretching
2850 C-H stretching
1705 C=O stretching
1605 N-H deformation
1451 C-O stretching
1376 C-O stretching
1310 P=O stretching, C-O stretching
1228 P=O stretching, C-O stretching
1202 S=O stretching
1167 S=O stretching
*The possible assignment of the IR frequencies was performed according to Coates (2000)

106
Figure 3.6 – FTIR spectrum of hexane extract
Table 3.7 – Infrared absorption of hexane extract
Peak Frequency (cm-1) Assignment*
2958 C-H stretching
2922 C-H stretching
2852 C-H stretching
1727 C=O stretching
1453 N-H deformation
1379 C-O stretching
1260 Si-methyl group vibration
1073 C-N stretching
864 Si-H deformation
*The possible assignment of the IR frequencies was performed according to Coates (2000)

107
Figure 3.7 – FTIR spectrum of chloroform extract
Table 3.8 – Infrared absorption of chloroform extract
Peak Frequency (cm-1) Assignment*
2962 C-H stretching
2916 C-H stretching
2849 C-H stretching
1707 C=O stretching
1412 C-O stretching
1258 Si-methyl group vibration
1080 C-N stretching
863 Si-H deformation
*The possible assignment of the IR frequencies was performed according to Coates (2000)
108
3.3 Discussion
As previously explained in section 1.1, natural products extracted from plants contain
complex mixtures of secondary metabolites, which generally refer to a small molecules
(usually with molecular weight less than 2000 Dalton) synthesized by an organism as a result
of an overflow metabolism under certain environmental conditions, such as nutrient
limitation, shunt metabolism products during idiophase, and the production of defence
mechanism molecules. As a consequence, they cover a wide range of organic compound
types, many of which are found to be useful in drug discovery research due to their
pharmacological or biological activities.
The extraction procedure determines both the quantity and quality of the crude extracts
obtained from each extraction solvent (Markom et al., 2007). In this study, maceration using
water, methanol, ethanol, hexane, and chloroform brings about a range of crude extract
with yields ranging from 18.7 % (water extract) to 0.8 % (hexane extract). This result is in
line with a work conducted by Markom and co-workers, which performed Soxhlet extraction
using organic and aqueous solvents to obtain various crude extracts from Phyllanthus niruri
L. The authors reported that the yield was high when using water and polar-solvents
(ethanol and methanol), however the yield was significantly decreased when non-polar
solvents was used (hexane and petroleum ether). Although by introducing continuous heat
during Soxhlet extraction to achieve the solvent’s boiling point which increase solvent’s
transfer rate to the active site of the plant’s matrix, these authors argued that heat has
minimum contribution for the solvent governing the extraction of salute or the quantity of
the yielding extract (Markom et al., 2007). Therefore, provided that the basis of the range of
yield can be attributed more significantly to the solvent polarity, and the highest yield was

109
obtained from water, it can be concluded that the major constituents of Phyllanthus niruri L
are of hydrophilic or water-soluble compounds, as previously indicated by Markom and co-
workers (2007).
Each solvent tends to extract different group of compounds, however it may not be
selective for extraction of single compounds. Therefore, crude extract is more likely be a
mixture of compounds derived from a plant’s matrix consisting of a variety of substances,
which comprise all material needed for a plant’s physiological processes, or merely present
as secondary metabolites. From the physical observation on the crude extracts, water,
methanol, and ethanol extracts were brown to dark-green in colour, which can be attributed
to the presence of polar plant-pigments such as chlorophyll. The extracts obtained using the
less-polar solvents resulted in lower extract yields (1.3% for chloroform and 0.8% for
hexane), and the colour was observed to be lighter green to yellow. The yellowish colour
can be attributed to the presence of non-polar pigments such as carotenoid.
Phyllanthus niruri L has been widely studied with regards to its phytochemical constituents.
Nekwati and co-workers (2013) reported that, from thin layer chromatography (TLC) and
HPLC analysis, Phyllanthus niruri L aerial extracts showed a positive result for the presence
of phenols, flavonoids, tannins, saponin, steroids, and lipids. Furthermore, the extracts
obtained from Soxhlet extraction, as reported by Okoli and co-workers (2009), gave positive
reactions for alkaloids, carbohydrate, flavonoids, glycosides, saponin, steroids and tannins.
Phytochemical-analysis presented in this thesis demonstrated a few variation compared to
the literatures. Our results confirmed the presence of saponin, alkaloid, flavonoid, tannin,
and carbohydrate, however showed negative result for steroid/triterpenoids and glycosides.
The variation in results from the phytochemical tests might be a result from at least three

110
possible factors. Geographical location of where the plant material was cultivated has
become one of the important factors. This is due to differences in environmental condition,
e.g. soil composition and average temperature, which alter the secondary metabolic
pathways and affect the extract yield composition (Nakweti et al., 2013). The second
potential factor is the extraction procedure by which the crude extracts were obtained. In
this case, non-exhaustive maceration based on a variable periods of extraction. This could
easily cause a partial extraction which may yield a limited amount of extracted substances,
thus leaving some proportion of natural compounds within the plant material. However, in
spite of this limitation, the quality of the extracted components will be benefited from the
maceration method as it is more likely to preserve the molecular structure of the
constituents. The last feasible factor affecting the variability of the plant extracts
composition is the sensitivity of the techniques used for the phytochemical analysis. The
positive result is solely determined by the chemical reaction of the tested compounds with
particular reagents, which give specific physical characteristics such as precipitation or
colour changes. Consequently, the positive reaction might not be visible for those
compounds that are present in a trace amounts.
In order to address the latter factor, further investigation of the substances from the crude
extracts was performed by utilising the absorbance of the visible and UV light to identify
plant constituents. The value of UV and visible spectra in identifying unknown constituents
is obviously related to the complexity of the spectrum and to the general position of the
wavelength maxima. As presented in Figure 3.2, all extracts exhibited major bands within
the range of wavelength in which the UV absorptions for most of the organic compounds
fall such as tannins, quercetin, phenolics, and flavonoids (Harborne, 1998). The occurrence
of the peaks in the region of 400-500 nm might suggest the presence of plant pigments,

111
such as chlorophylls and carotenoids, which were likely to be responsible for the colour of
the crude extracts. Unlike the other phytochemical analysis methods, the absence of certain
peaks in the UV spectra might provide useful information, such as an indication of the
presence of lipids, organic acids, amino acids, or sugars (Harborne, 1998).
Furthermore, IR spectrum measurements were also used for the screening of the extracts'
constituents, as it is known as a simple yet sensitive technique in evaluating the presence of
certain kinds of chemical bonds thus useful in identifying the functional groups present in
samples. It is frequently used in phytochemical studies as a fingerprinting device for
comparing natural compounds with the synthetic samples, or for comparing the purified
natural compound with a known standard (Harborne, 1998). The method is also extensively
used to evaluate the purity of the compounds or the presence of contaminants as the result
of the complex extraction and purification procedures. The absorbance of the IR light by
organic molecules corresponded to the energy required to cause the stretching or bending
of the molecular bonds within the molecule. Different kinds of bonds require specific
amounts of energy to initiate such molecular vibrations and accordingly, absorbed different
frequencies of the IR radiation. Consequently, the absorption peaks plotted in the spectra
reflect the types of chemical bonds present in the molecules.
The complexity of the spectra, as shown from the water extract spectra presented in this
study, suggests the abundance of the many different metabolites. As the crude extracts
were isolated from a natural entity, hydrocarbon groups are present as the main
component and reason for the complexity of the extracts constituents. Absorption above
3000 cm-1 is likely to be unsaturated because it might contain C=C or aromatic groups.
Absorption below 3000 (with main absorption at approx. 2935 and 2860 cm-1) provides an

112
indication of the presence of aliphatic groups. Accordingly, the IR spectra suggest the
presence of aliphatic hydrocarbon in all extracts, whereas the aromatic groups are likely to
be exclusively present in the water, methanol, and ethanol extracts. In addition, the peaks
observed in the region of 1700 and 1500 cm-1 indicate the assignment of the aromatic
groups on the ethanol extracts. The broad peaks in the region of 3600-3000 cm-1 (Figure 3.3,
Figure 3.4, and Figure 3.5) could be assigned to N-H and O-H stretching or additionally may
indicate the presence of aromatic groups. Moreover, the bands at 2800-3000 cm-1
demonstrate the presence of C-H stretching. Such peaks are sharp and strong on the
ethanol and hexane extracts; with lower intensities on chloroform extract. Thus, these
bands indicate the presence of the aliphatic hydrocarbon groups in the ethanol, hexane and
chloroform extracts.
Within the region of 1900 – 1600 cm-1, all extracts exhibited several peaks, which can be
assigned to C=C, C=N, and C=O stretching, thus suggest the presence of several functional
groups (Coates, 2000); carboxylic acid (1725-1700 cm-1) and amine groups (1650 - 1550cm-1)
in all extracts; ketone (1725-1705 cm-1 and 1690-1675 cm-1) in water, methanol and ethanol
extracts; aldehyde (1740-1725 cm-1 and 1700 - 1690 cm-1) in ethanol, hexane, and
chloroform extracts; ester (1750-1725 cm-1) in hexane and chloroform extracts. Numerous
organic compounds have multiple banding patterns in the region 1150-950 cm-1 as the in-
plane C-H bending vibrations of aromatic compounds typically occur in this region, and can
exist as complex band structure (multiple, well-defined bands). They tend not to be
diagnostic for many compounds because of the conflict and overlap with other functional
group absorptions, including some skeletal (backbone) vibration (Coates, 2000).

113
The crude extracts consist of a complex mixture of substances, which made it impossible to
assign its absolute constituents by these initial screening procedures alone. However, the IR
spectra have suggested the presence of many specific classes of secondary metabolites
within the extract. Within the fingerprint region, IR spectra presented in this study indicated
the presence of nitrogen in all extracts. Moreover, the presence of sulphur and
phosphorous spectrum was found in water, methanol and ethanol extracts, while a silicon
spectrum was presence in hexane and chloroform extracts. Samali and co-workers (2012)
reported the mineral content of Phyllanthus niruri L, including sodium, calcium, potassium,
magnesium and phosphorous. These elements are known as the main components of
plant’s micronutrients, which concentration in plant’s matrix is proportional to the soil’s
content (Epstein, 2001).
In conclusion, the maceration extraction of Phyllanthus niruri L plant, using various solvents
with different ranges of polarity, resulted in a different yield of extracts. The major
constituents of the plant are shown to be of hydrophilic and polar compounds. Water and
methanol extracts yield the higher amount of crude extracts, which give positive results for
numerous classes of organic compounds, including alkaloid, saponin, flavonoid, tannin,
amino acid, and carbohydrate. Nevertheless, the presence of other organic compounds such
as steroid, lipid, and glycosides still cannot be discounted in these solvent extracts as the UV
and IR spectra suggested the occurrence of a number of functional groups related to those
compounds. Overall, the data presented here provides confirmatory evidence of the rich
mixture of constituent within the Phyllanthus niruri L plant that could potentially play an
important role in the biological and therapeutic properties previously observed with this
plant.

Chapter 4The Screening of Biological
Activities of the Crude Extracts

115
4.1 Introduction
Pharmaceutical properties of the crude extracts isolated from Phyllanthus species have
been reported many times in the literature. Phyllanthus niruri L is a widely distributed
species in the Phyllanthus family and has certainly become one of the most widely used
natural remedies in the world. The traditional use of this plant covers a wide range of
therapeutic applications, including the treatment of gallbladder stones, management of
airway diseases, and as a painkiller and antidiabetic remedy (Calixto et al., 1998).
Predictably, it has drawn the interest of many scientists interested in exploring its biological
properties. This has resulted in a number of publications, which prove the presence of
medical activities of several crude extracts obtained from Phyllanthus niruri L. There has
been intensive research conducted into the activity on the hepatobiliary system, which
demonstrates the hepatoprotective effect of this plant (Syamasundar et al., 1985,
Bhattacharjee and Sil, 2006, Sabir and Rocha, 2008, Manjrekar et al., 2008), and the antiviral
properties towards hepatitis B virus (Venkateswaran et al., 1987). Moreover, the extracts
demonstrate strong potency in the inhibition of renal stone formation (Freitas et al., 2002,
Campos and Schor, 1999, Nishiura et al., 2004), glucose and lipid lowering activity (Okoli et
al., 2010, Khanna et al., 2002).
However, most of the reports are focused on exploring particular extracts, with only a few
explorations having been made to examine the biological effects of a wider variety of crude
extracts. For example, the inhibitory activity of Phyllanthus niruri L against malaria parasites,
in which a number of scientists have reported the activity of alcoholic, dichloromethane,
and aqueous extracts in the inhibition of plasmodium growth (Totte et al., 2001, Subeki et
al., 2005, Mustofa et al., 2007). Another example is a study conducted by Sharma and co-

116
workers (2009) that demonstrated the anti-tumour activity of an alcoholic extract, based on
in vitro assays that showed a significant reduction in cancer cell growth. Although the above
findings have suggested the efficacy of Phyllanthus niruri L as anti-malarial and anti-cancer
agent, little has been done to accurately determine the nature of the active components
within these extracts. This may in part be due to the complexity in the component mixtures
within the crude extracts being tested. There has also been an increasing interest in the
exploration of the effect of Phyllanthus niruri L on the vascular system. This was initiated by
Iizuka et al. (2007) who conducted a study on the vasorelaxant and the antiplatelet effects
of the alcoholic extracts.
This chapter is focused on the screening of the activities of the crude extracts from
Phyllanthus niruri L towards a number of biological systems. The study begins with anti-
malarial screening as an investigation of their impact on the parasite growth, followed by a
discussion of plant extracts inhibitory effects against the growth of cancerous cells, and
finally the activity towards platelet aggregate formation. Finally a discussion will be
presented to provide an overview on the possible mechanisms of action of each measured
biological activity.
In addition, as the crude extracts consist of a mixture of unknown substances, the report
provides data of the cytotoxicity of each extract, which is important in determining the
safety of the extract in a living cell. This complies with the NIH requirements for a good
candidate of natural product which must show selective and strong potency for abnormal
cell/biological process and at the same time have a protective or a minimal effect on the
normal cell/metabolic pathways.
117
4.2 Result
4.2.1 Anti-malarial screening
The anti-malarial test of the crude extracts used in this study adopted the method for drug
susceptibility determination by the SYBR Green flow cytometry assay (Karl et al., 2009), as
previously described in section 2.4.2. The method allows the evaluation of plasmodium
falciparum parasite viability (strain K1) when cultured in complete media containing 5%
haematocrit (section 2.4.1.2). The nature of the assay, which requires a small volume of
sample, allows for high-throughput screening of various crude extracts by performing all
tests at the same time in a 96-well microplate. Accordingly, it was possible to maintain
relatively similar conditions whilst performing the assay. The test was initiated when the
parasites entered the ring shape stage of their life cycle. All extracts were dissolved in DMSO
to ensure the complete dissolution, which were then diluted in PBS to achieve the desired
final concentration. The DMSO concentration was carefully calculated in order to maintain
the acceptable concentration which was safe for the parasite growth.
Flow cytometry analysis was conducted upon the staining of all samples. Gating strategy
was applied for a dot plot of forward scatter (FSC) versus side scatter (SSC) to obtain the red
blood cell (RBC) population, and FSC against the fluorescence reading to enable the
differentiation of parasites according to the life stages they were in. As the assay was
started during the mono-nucleated ring stage of the parasite life cycle, after 72 hours, they
would have completed one life cycle and entered the next stage to trophozoite and multi-
nucleated schizont forms. Accordingly, the red blood cell (RBC) in which the parasites had
progressed into the latter stage should give intense fluorescence emission compared to
those containing the mono-nuclear ring forms, as illustrated in Figure 4.1 below:

118
Figure 4.1 – Comparisons of uninfected and parasitized RBC using SYBR green flow cytometric assay
A dot plot of forward light scatter (FSC) versus side scatter (A), and FSC versus SYBR Green dye fluorescence (excitation and emission maxima at 494 and 521, respectively) showed (B) uninfected and (C) infected cultures. The gating strategy was performed to capture the RBC population (P1) and differentiate the mononuclear and multinuclear stages (inset) of the plasmodium life cycle.
B
A
C
119
An initial screening was conducted on all plant extracts using the highest dose of 200 µg/ml
which was diluted in a serial manner to achieve a minimum concentration of 12.5 µg/ml.
The data produced from triplicate tests on each dose, were statistically analysed and
presented as a graph in Figure 4.2. The result showed that all extracts inhibited plasmodium
falciparum strain K1 proliferation at the highest dose of 200 µg/ml. Interestingly, water and
methanol extract, significantly inhibited the parasite growth at all dose used. While the
untreated parasites reached a parasitemia level of 1.82±0.07 %, the administration of water
extract and ethanol extract, even at the lowest dose of 12.5 µg/ml, showed a complete
inhibition of the parasite development (the parasitemia level was 0.08±0.5% and
0.05±0.01% for water and methanol, respectively). Given that the assay was started at an
initial parasitemia level of 0.5%, the result suggested that the extracts might not only be
halting the proliferation of the plasmodium but also reducing the parasite level in the RBC.
The other extracts, namely ethanol, chloroform, and hexane extracts, expressed a lesser
dose-dependent inhibitory effect. These extracts demonstrated a total inhibitory activity at
a doses starting from 50 µg/ml (parasitemia level of 0.07±0.01%) and 200 µg/ml
(parasitemia level of 0.04±0.01) for ethanol and chloroform extracts, respectively. The latter
extract was found to show good plasmodium growth inhibitory potency at the maximal dose
200 µg/ml which halted the parasites proliferation at a 0.9±0.1 % parasitemia level.

120
Figure 4.2 – Anti-malarial screenings of Phyllanthus niruri L extracts
The experiment for antiplasmodial test was conducted using five serial doses started from the lowest to the highest: 12.5, 25, 50, 100, and 200 µg/ml. The data were obtained from a triplicate test resulted in a panel of a 72-hours-incubation of parasitemia level after the administration of the crude extracts. The result for each extracts, presented as the average of the replication tests and the standard error of the mean (SEM) from each dose given.
0
0.2
0.4
0.6
0.8
1
1.2
1.4
1.6
1.8
2
200100502512.5
Par
asit
em
ia (
%)
Extract dose (µg/ml)
Water
Methanol
Ethanol
Chloroform
Hexane
Control

121
As previously mentioned, the extracts were added to the continuous plasmodium culture
when the parasites were entering the RBC in the mononuclear ring forms. As expected, after
72 hours of incubation, the untreated or control group had undergone a complete cycle and
started the next phase of the second round of their life cycle. Figure 4.3 to Figure 4.7
illustrate that each control group expressed an equal level of mono-nuclear and
multinuclear parasites, which was supported by the flow cytometry FCS-Fluorescence dot-
plot of infected RBC (figure 18), showing a similar amount of population amongst the
parasites population. From the overall results, the administration of Phyllanthus niruri L
extracts at the maximum dose (200 µg/ml) into the plasmodium culture had significantly
inhibited the erythrocytic development of the parasites through the extensive eradication of
the schizont form from the RBC. It was shown by the low level of the multinuclear
parasitemia level of all treatment groups (0.06± 0.02 for hexane, 0.02±0.01 for chloroform,
0.01± 0.01 for ethanol, 0.01± 0.01 for methanol, and 0.01± 0.00 for water extracts
respectively). This data indicate the toxic effect of all extracts on the plasmodium growth.
With the exception of chloroform, other extracts also exhibited similar activity on the
mononuclear (ring) stage of the parasites, which strengthened the evidence for the toxic
effects of the water, methanol, ethanol, and hexane extracts against the plasmodium
parasites at the highest concentration of 200µg/ml.

122
Figure 4.3 – Dose response of hexane extract on plasmodium life stages
(A) The result of the mononuclear (ring/trophozoite) and multinuclear (schizont) forms of the parasites was obtained from the average (AV) of triplicate tests for control and dosed groups. The data of each group was presented as mononuclear/multinuclear AV with the standard error of the mean (SEM). (B) Mono/multinuclear ratios of parasites life stages at different doses.
0.00
0.20
0.40
0.60
0.80
1.00
1.20
1.40
200 µg/ml100 µg/ml50 µg/ml25 µg/ml12.5 µg/mlControl
Par
asit
em
ia (
%)
MultinuclearMononuclear
A
B

123
Figure 4.4 – Dose response of chloroform extract on plasmodium life stages
The result of the mononuclear (ring/trophozoite) and multinuclear (schizont) forms of the parasites was obtained from the average (AV) of a triplicate test for control and dosed groups. The data of each group was presented as mononuclear/multinuclear AV with the standard error of the mean (SEM).
Figure 4.5 – Dose response of ethanol extract on plasmodium life stages
The result of the mononuclear (ring/trophozoite) and multinuclear (schizont) forms of the parasites was obtained from the average (AV) of a triplicate test for control and dosed groups. The data of each group was presented as mononuclear/multinuclear AV with the standard error of the mean (SEM).
0.00
0.20
0.40
0.60
0.80
1.00
1.20
1.40
200 µg/ml100 µg/ml50 µg/ml25 µg/ml12.5 µg/mlControl
Par
asit
em
ia (
%)
Multinuclear
Mononuclear
0.00
0.20
0.40
0.60
0.80
1.00
1.20
200 µg/ml100 µg/ml50 µg/ml25 µg/ml12.5 µg/mlControl
Par
asit
em
ia (
%)
Multinuclear
Mononuclear

124
Figure 4.6 – Dose response of methanol extract on plasmodium life stages
The result of the mononuclear (ring/trophozoite) and multinuclear (schizont) forms of the parasites was obtained from the average (AV) of a triplicate test for control and dosed groups. The data of each group was presented as mononuclear/multinuclear AV with the standard error of the mean (SEM).
Figure 4.7 – Dose response of water extract on plasmodium life stages
The result of the mononuclear (ring/trophozoite) and multinuclear (schizont) forms of the parasites was obtained from the average (AV) of a triplicate test for control and dosed groups. The data of
0.00
0.20
0.40
0.60
0.80
1.00
1.20
200 µg/ml100 µg/ml50 µg/ml25 µg/ml12.5 µg/mlControl
Par
asit
em
ia (
%)
Multinuclear
Mononuclear
0.00
0.20
0.40
0.60
0.80
1.00
1.20
200 µg/ml100 µg/ml50 µg/ml25 µg/ml12.5 µg/mlControl
Par
asit
em
ia (
%)
Multinuclear
Mononuclear

125
each group was presented as mononuclear/multinuclear AV with the standard error of the mean (SEM).
The ratio of mono/multi-nuclear population (M ratio) was used to predict the inhibition
point of the erythrocytic parasite development cycle. Such values were obtained by
comparing the average parasitemia of the culture groups which succeeded in undergoing a
complete life cycle, shown by the parasitemia level exceeding the initial concentration when
the treatments were given. Only the hexane group provided complete ratios on all doses,
and the result suggested a significant increase of mono/multinuclear ratio with the dose as
shown in Figure 4.3. This data indicated that the extracts reduced the rate of parasite
multiplication and caused their failure to enter the latter stage of its life cycle.
The differences in the 50% maximal inhibitory concentrations (IC50) of all extracts were
extensive. The IC50 values were obtained from plotting a dose response curve as illustrated
in Figure 4.8. The greatest potency was demonstrated by methanol extract with an IC50 of
1.6 µg/ml, whereas chloroform displayed the lowest efficacy of the inhibition with an IC50 of
141 µg/ml. Hexane IC50 values could not be calculated as the maximum concentration the
extract did not reach a half of the maximum inhibitory concentration. In summary, the
effectiveness of the crude extracts to restrain parasite growth, from the most to the least
potent activity was methanol > water > ethanol > chloroform > hexane (IC50 values were 1.6
µg/ml, 9.6 µg/ml, 25 µg/ml, and 141 µg/ml, respectively).

126
Figure 4.8 – Representative dose response curve of ethanol, methanol, and water extracts
The parasites were treated at ring stage and analysed after 72 hours. The IC50 values were calculated from a series of dose-response data by plotting extract concentration (in x axis) versus parasite growth (in y axis). Data was normalised so that the smallest parasite growth corresponded to 0% and the largest growth corresponded to 100%. With the aid of Graphpad prism 5.0, log-transformed drug concentrations were plotted against the dose response and the IC50 values were determined using non-linear regression.
B
A
C

127
4.2.2 Anti-cancer screening
In the screening of the anti-cancer property of Phyllanthus niruri L, all extracts were tested
on three cell lines; human Caucasian lung large cell carcinoma (COR-L23), human acute T
lymphoblastic leukaemia (MOLT-4), and human Caucasian chronic myelogenous leukaemia
(K562). The COR-L23 cell line is an epithelial derived line, which grows as adherent cells,
whereas the other cell lines grow as suspension cells. Based on an MTT assay, the viable
cells were counted as a percentage of purple formazan crystals absorbance. This assay was
used to investigate the potential cytotoxic effects of Phyllanthus niruri L extracts on
different cell lines, after treatment with an increasing concentration from 2 µg/ml up to 125
µg/ml for five days incubation. The impact of the extracts on cell growth is presented in
Figure 4.9 -Figure 4.13, and the cytotoxicity was recorded as IC50 (µg/ml) values as shown in
Table 4.1 and Table 4.2.
The results showed that Phyllanthus niruri L extracts effectively inhibited the growth of COR-
L23 and MOLT-4 in a dose-dependent manner, with an IC50 range from 27.47 ± 1.25 to 61.41
± 3.06 µg/ml and 42.21 ± 4.98 to 97.06 ± 18.29 µg/ml, respectively. The inhibitory activities
of each extract against COR-L23 from the highest to the lowest was chloroform > water >
methanol > and ethanol, whilst towards MOLT-4 cell line the extracts activity was methanol
> chloroform > hexane > and ethanol. Phyllanthus niruri L extracts appear to show some
inhibitory activities against K562 cell line. The inhibitory effects were lower than that against
the other cell lines, with the IC50 range from 120.19 ± 8.48 to 256.55 ± 26.22 µg/ml (hexane
> methanol > ethanol > and chloroform). These data showed that Phyllanthus niruri L
extracts have the potential anti-cancer effect towards COR-L23 and MOLT-4, however have
limited activity against K562 cell line, thus suggested that the extracts were selectively toxic

128
against the cell line tested. In comparison, growth inhibition of methanol extract on MOLT-4
(IC50 value 42.21 ± 4.98 µg/ml) and COR-L23 (IC50 value 48.92 ± 0.52 µg/ml) was more
effective than K-562 cell line (IC50 value 139.28 ± 19.02 µg/ml). Another example, water
extract demonstrated inhibitory effect towards COR-L23 (IC50 value 47.48 ± 1.33 µg/ml),
however showed no activities against MOLT-4 and K562 cell lines. Among all extracts,
methanol extract demonstrated the strongest cytotoxicity with a low IC50 values for all cell
lines tested.
Figure 4.9 – Cytotoxic effect of different concentrations of hexane extract on cancer cell lines.
Data on the graph represent the percentage of the viable cells from three experiments (n=3) as mean ± SEM. Statistical analysis was performed using two-way ANOVA with Bonferronis’s multiple comparison post-test. (*) indicates the significant difference of each treated-cell lines with the corresponding control group (p < 0.01).
0.0%
20.0%
40.0%
60.0%
80.0%
100.0%
Control 2 µg/ml 3.9 µg/ml 7.8 µg/ml 15.6 µg/ml 31.3 µg/ml 62.5 µg/ml 125 µg/ml
Ce
ll V
iab
ility
(%
)
Dose
MOLT-4 COR-L23 K562
*
*
*
*
*
*
*

129
Figure 4.10 – Cytotoxic effect of different concentration of chloroform extract on cancer cell lines
Data on the graph represent the percentage of the viable cells from three experiments (n=3) as mean ± SEM. Statistical analysis was performed using two-way ANOVA with Bonferronis’s multiple comparison post-test. (*) indicates the significant difference of each treated-cell lines with the corresponding control group (p < 0.01).
0.0%
20.0%
40.0%
60.0%
80.0%
100.0%
Control 2 µg/ml 3.9 µg/ml 7.8 µg/ml 15.6 µg/ml 31.3 µg/ml 62.5 µg/ml 125 µg/ml
Ce
ll V
iab
ility
(%
)
Dose
MOLT COR-L23 K562
*
*
*
**
*
***
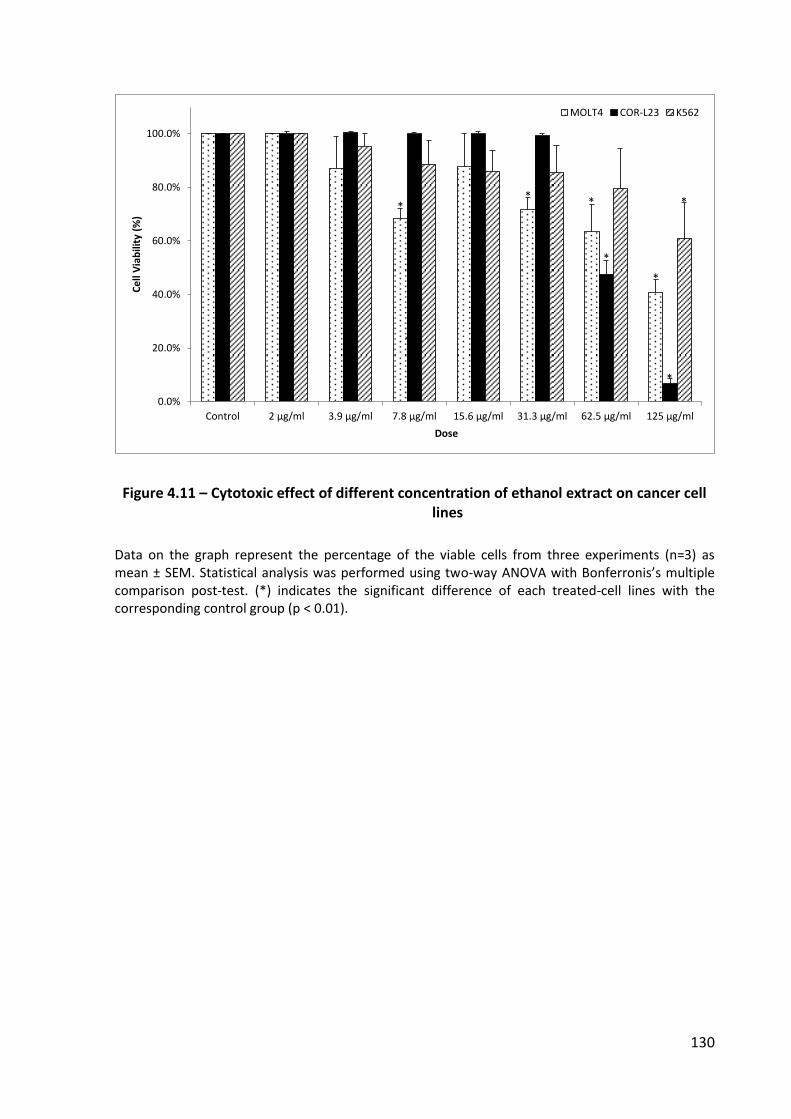
130
Figure 4.11 – Cytotoxic effect of different concentration of ethanol extract on cancer cell lines
Data on the graph represent the percentage of the viable cells from three experiments (n=3) as mean ± SEM. Statistical analysis was performed using two-way ANOVA with Bonferronis’s multiple comparison post-test. (*) indicates the significant difference of each treated-cell lines with the corresponding control group (p < 0.01).
0.0%
20.0%
40.0%
60.0%
80.0%
100.0%
Control 2 µg/ml 3.9 µg/ml 7.8 µg/ml 15.6 µg/ml 31.3 µg/ml 62.5 µg/ml 125 µg/ml
Ce
ll V
iab
ility
(%
)
Dose
MOLT4 COR-L23 K562
*
*
*
*
*
**
*
*

131
Figure 4.12 – Cytotoxic effect of different concentration of methanol extract on cancer cell lines
Data on the graph represent the percentage of the viable cells from three experiments (n=3) as mean ± SEM. Statistical analysis was performed using two-way ANOVA with Bonferronis’s multiple comparison post-test. (*) indicates the significant difference of each treated-cell lines with the corresponding control group (p < 0.01).
0
20
40
60
80
100
Control 2 µg/ml 3.9 µg/ml 7.8 µg/ml 15.6 µg/ml 31.3 µg/ml 62.5 µg/ml 125 µg/ml
Ce
ll V
iab
ility
(%
)
Dose
MOLT4 COR-L23 K562
*
*
*
*
*
**
**
*

132
Figure 4.13 – Cytotoxic effect of different concentration of water extract on cancer cell lines
Data on the graph represent the percentage of the viable cells from three experiments (n=3) as mean ± SEM. Statistical analysis was performed using two-way ANOVA with Bonferronis’s multiple comparison post-test. (*) indicates the significant difference of each treated-cell lines with the corresponding control group (p < 0.01).
0%
20%
40%
60%
80%
100%
Control 2 µg/ml 3.9 µg/ml 7.8 µg/ml 15.6 µg/ml 31.3 µg/ml 62.5 µg/ml 125 µg/ml
Ce
ll V
iab
ility
(%
)
Dose
MOLT4 COR-L23 K562
*
*
*
*
**
**
*
*
*
*

133
Table 4.1 – IC50 values of Phyllanthus niruri L extracts on cancer cell lines
Extract IC50 (± SD)
MOLT4 COR-L23 K562
Water >500 µg/ml 47.48 ± 1.33 µg/ml >500 µg/ml
Methanol 42.21 ± 4.98 µg/ml 48.92 ± 0.52 µg/ml 139.28 ± 19.02 µg/ml
Ethanol 97.06 ± 18.29 µg/ml 61.41 ± 3.06 µg/ml 148.51 ± 10.81 µg/ml
Hexane 89.57 ± 3.60 µg/ml >500 µg/ml 120.19 ± 8.48 µg/ml
Chloroform 85.08 ± 8.57 µg/ml 27.47 ± 1.25 µg/ml 256.55 ± 26.22 µg/ml
Cisplatin 1.16 ± 0.27 µM 0.33 ± 0.04 µM 0.43 ± 0.03 µM
The IC50 values obtained that the Phyllanthus niruri L extracts significant anti-proliferative
activities on the MOLT4, COR-L23, and K562 cancer cell lines. It is however also important to
investigate the potential cytotoxicity effects that the extracts might have on the growth of
normal cell lines. Accordingly, an MTT assay was performed using Balb/c 3T3 cell lines to
observe the cytotoxicity effects of Phyllanthus niruri L extracts. The 3T3 is a fibroblast cell
line that has been widely used for this purpose in the past. The results, as shown in Table
4.2, indicated that water, methanol, and ethanol extracts did not show any significant
cytotoxic effect on normal cells. The standard anti-cancer drug cisplatin was included and,
as expected, the IC50 it exhibited confirmed that the cisplatin had significant cytotoxic
effect on 3T3 cell line, unlike the plant extracts. Among all extracts, hexane extract showed
some inhibitory effect on the growth of 3T3 cells with an IC50 value 555.30 ± 86.61 µg/ml,
however this value is categorised as minimal toxicity to normal cell line (Lee et al., 2011). In
contrast, chloroform extract demonstrated a toxic effect to the normal cells (IC50 value
164.3 ± 8.4 µg/ml), which appear to be comparable to its activity against cancer cell lines.

134
Table 4.2 – IC50 values of Phyllanthus niruri L extracts on normal cell line
Extract 3T3 Cell line
IC50 (± SD)
Water
>1000 µg/ml
Methanol
>1000 µg/ml
Ethanol
>1000 µg/ml
Hexane
555.30 ± 86.61 µg/ml
Chloroform
164.3 ± 8.4 µg/ml
Cisplatin
1.6 ± 0.1 µM
To determine the effect of the Phyllanthus niruri L on cancer cell cycle, control flow-
cytometry based-cell cycle analysis assay was conducted on MOLT4 cells. The cell line was
used due to the similar range of IC50 value obtained from all Phyllanthus niruri L extracts
tested. In this case, the water extract was excluded from the test, due to the insignificant
inhibitory effect it had shown towards MOLT4 cells. To perform the assay, MOLT4 cells were
treated with extracts at their respective IC50 values for 24, 48, and 72 hours before analysis
by flow cytometry. Gating strategy was applied to examine the cells life cycle stage (Figure
4.14). The results presented in Figure 4.15 show the kinetics of the distribution of the
population of cells according to their stage in cell cycle phases.
As shown in Figure 4.15, changes in cell distribution within the phases of the cell cycle were
observable even after 24 hours of treatment. Phyllanthus niruri L extracts demonstrated
growth arrest at the S-phase and remained evident after 72 hours of treatment. After 24
hours incubation, untreated cells reached a total population of 37.5 ± 1.2 % in G1-phase,
41.1 ± 1.1 % in S-phase, and 21.5 ± 0.5 % in G2/M-phase. In the presence of Phyllanthus

135
niruri L extracts, the range of cell population percentage was 53.8 ± 2.0 to 56.0 ± 1.0 % in
G1-phase, 13.8 ± 1.0 to 22.4 ± 2.4 % in S-phase, and 21.6 ± 2.0 to 32.3 ±2.5 % in G2/M-
phase. After 72 hours incubation in the presents of the extracts, the distribution of cell
population was 38.4 ± 1.7 to 49.5 ± 0.9% in G-phase, 21.2 ± 1.0 to 8.3 ±0.7% in S-phase, and
36.0 ± 1.7 to 53.3 ± 1.5 % in G2/M-phase.
Ethanol extract treatment of MOLT-4 cells showed a lower overall percentage in S-phase cell
in a time-dependent manner from 16.5±1.3% after 24 hours to 13.9±1.0% after 72 hours
incubation. This was accompanied by an accumulation of cells in the G1-phase after 72
hours of treatment (the cells percentage was 49.5 ± 0.9%),
For the chloroform extract, an S-phase arrest was evident after 24 hours of treatment (cell
percentage was 22.4 ± 2.4%). However, cell population after 72-hours treatment with
chloroform extract demonstrated a comparable result to the control group (cell population
was 21.2 ± 1.0 % in S-phase). Nevertheless, MOLT-4 cells treated with chloroform extract
showed an inhibition effect on cell percentage in G2/M-phase (36.0 ± 1.7 %).
Among all extracts tested on MOLT-4 life cycle, methanol and hexane exerted a significant
inhibition effect during S-phase. After 24 hours incubation, cells treated with methanol and
ethanol extracts demonstrated a lower percentage of cell populations in S-phase; 13.8 ± 1.0
% for methanol and 14.1 ± 0.8 % for hexane extract. Following the 72-hour treatment of
MOLT-4 cells with methanol and hexane extracts, the S-phase was significantly decreased.
The final percentage of S-phase cells from the control group was 21.1±1.1%, whereas
methanol and ethanol extract treated cell populations were 9.1±0.7% and 8.3±0.7%,
respectively. The percentage of G2/M-phase population increased from 32.3±2.5% to
51.4±1.5% for methanol extract treated cells and 31.3±2.0 to 53.3±1.5% for the hexane

136
extract, accompanied by a decrease of G1 phase cell. The results indicated that the cells
were arrested at G2/M-phase at 24 hours and this remained evident after 72 hours of
treatment. Interestingly, for methanol extract treated cells, the cell cycle at 48-hour
treatment demonstrated a similar pattern as the untreated control cells. This finding
suggested at some point, the arrested cells passed the G1-arrest and succeeded in
advancing to DNA synthesis at the S-phase, however ultimately they failed to complete the
G2/M-phases, which lead to cell division failure due to the cytostatic effect of the methanol
extract on the cell growth.
Figure 4.14 – Cell cycle analysis and gating strategy on flow cytometry
A Propidium iodide Histogram of the gated MOLT-4 cells distinguishes cells at G1, S, and G2/M cycle phases.
Methanol-48 hours
G1S
G2/M
G1 S
G2/M
Propidium Iodide Propidium Iodide
Ce
ll co
un
ts
Ce
ll co
un
ts
Control-48

137
Figure 4.15 – The kinetics of cell cycle distribution of Phyllanthus niruri L extracts treated MOLT4 cells.
The percentage of Phyllanthus niruri L extracts-treated cells at A) G1, B) S, and C) G1/M phases of MOLT4 cells at different time intervals of treatment (24, 48, and 72 hour). Data on the graph represent the percentage of the viable cells from three experiments (n=3) as mean ± SEM.
A
B
C

138
4.2.3 Antiplatelet screening
In order to perform a screen for antiplatelet aggregation effects of Phyllanthus niruri L crude
extracts, we utilized a 96-wells microplate-based assay system that was introduced by
Bednar et al. (1995). Compared with the commonly used ‘gold standard’ assay of platelet
aggregometry, the former method is superior in term of its capability to analyse a large
numbers of samples in a single assay run, with a small amounts of sample. Indeed,
screening of anti-platelet activity of unknown platelet-modulating agents requires a robust
and high-throughput assay. For that reason, this assay is considered to be the most suitable
method, in addition to the advantages resulting from its rapidity and sensitivity. Moreover,
this assay can also overcome additional drawbacks of a standard platelet aggregrometer,
such as time-consuming measurement and a requirement for more specialised equipment
(Moran et al., 2006).
In this study, the whole blood sample supplies from the blood bank (as mentioned in section
1.2) might be varied in term of its age, time required for blood withdrawal, processing and
delivery until they were ready for the assay. Certainly, platelet function is the key factor in
monitoring the anti-aggregation, and ensuring that platelets were still functioning to
perform the aggregation was crucial. Considering that platelet tends to deteriorate and lose
its activity over time, a preliminary assessment for monitoring platelet aggregation function
over a series of time points since blood withdrawal was conducted. The main objective of
this initial test was to optimise and standardise blood sample conditions for maximum
platelet activity. This was done in order to obtain a usable blood sample and to ensure that
the platelets were still functioning, before embarking on the anti-platelet studies of the
Phyllanthus niruri L extracts.

139
The maximum response of platelet aggregate formation upon the addition of 10 µM
adenosine diphosphate (ADP), a platelet agonist, is shown in Figure 4.16. The figure
illustrates the various maximum responses of platelet aggregation relative to the age of
blood. The data shows that, whilst the maximum response was achieved when fresh blood
(day 0) was used, the platelet aggregation of 1-day and 2-days old blood were also
significant and applicable for the purpose of the test. Nevertheless, after three days, platelet
function seemed to have deteriorated significantly and was effectively unusable as it started
to show insignificant responses when compared with the controls.
Furthermore, the effect of the temperature on platelet storage and platelet aggregation was
also monitored in this preliminary test. The data shown in Figure 4.17 suggested that
platelet function is preserved when the blood was kept at room temperature. The result
also indicated that storing the blood at -8 ˚C did not conserve platelet function and, on the
contrary, tended to diminish the platelet’s ability to form platelet aggregates.
Data from the initial assessment suggested that platelet aggregation is still observable when
using blood sample from the age of up to two days old. Therefore, the limit of blood age
obtained from the blood bank for the anti-platelet screening was set accordingly. Moreover,
to avoid further deterioration of platelet function, it is crucial to perform the aggregation
test immediately after the sample arrived in the laboratory and to store the blood at room
temperature before needed.

140
Figure 4.16 – Maximum response of platelet aggregation over time
Aggregation response of platelets isolated from a different age of blood sample; fresh blood (0 day), 1 day, 2 days, and 3 days old. Platelet aggregation was induced by the addition of ADP at a final concentration of 10 µM and continuous shaking at 1000 rpm. Changes in absorbance were monitored at 405nm. First reading was taken before the agonist was added; the second reading was taken after 10 minutes. Data on the graph represent the maximum response of platelet aggregation from four replicates of the experiment (n=4) as means ± SEM. Statistical analysis was performed using two-way ANOVA with Bonferroni's multiple comparison post-test, (*) indicates the significant difference of control compared with ADP from each group of blood age (p < 0.01)
Figure 4.17 – The effect of the temperature on platelet aggregation.
Blood samples were kept at room temperature and -8 degree Celsius. Platelet aggregation was induced by adding ADP as a platelet agonist at a final concentration of 10 µM. Data shown on each bar represent the maximum response of platelet aggregation from four replicates of the experiment (n=4) as mean ± SEM.
0%
20%
40%
60%
80%
100%
O day 1 Day 2 Days 3 Days
Max
imu
m r
esp
on
se (
%)
Age of blood sample
Control
ADP 10 uM
*
*
*
0%
20%
40%
60%
80%
100%
120%
1 Day 2 Day 3 Day
Max
imu
m r
esp
on
se (
%)
Age of blood
Room Temperature-8 Degree

141
Platelet aggregation tests were next performed to monitor the extent of platelet aggregate
formation in the presence and absence of Phyllanthus niruri L crude extracts. Water,
methanol, ethanol, chloroform, and hexane extracts at a concentration of 250 µg/ml were
added into platelet suspension. In this assay, adenosine as a known platelet-aggregation
inhibitor was included to compare the exposed inhibitory effect. Platelet aggregation was
induced by addition of ADP at a concentration of 50 µM, and the absorbance was recorded
in 1-minute intervals for a total of 10-minutes.
The results, as shown in Figure 4.18, illustrate the relative ability of the crude plant extracts
to inhibit ADP-induced platelet aggregation. Maximum responses of aggregation traces
were demonstrated by platelet aggregation induced by ADP without any addition of
adenosine/plant extracts, which is a classic pattern of the biphasic aggregation curve (inset)
showing the primary and secondary wave of platelet aggregation. In the presence of
adenosine, the extent of the aggregation trace was decreased, and this was accompanied by
the disappearance of the second wave of aggregation.
The graph of platelet aggregation traces in Figure 4.18 indicated that Phyllanthus niruri L
extracts exerted an inhibitory effect on ADP-induced platelet aggregation. The extent of the
inhibition shown methanol, ethanol, and chloroform extracts were relatively similar to
adenosine, whilst hexane expressed a relatively lower effect on the platelet aggregation.
Surprisingly, water extract greatly diminished platelet aggregate formation, as the traces of
aggregation was very close to that shown by the untreated resting platelets (control group).
Moreover, the aggregation curves in the presence of the extracts also indicated the
disappearance of the secondary wave of platelet aggregation.

142
Figure 4.18 – Platelet aggregation response in the presence of Phyllanthus niruri L extracts
Platelet aggregation responses are shown as the changes of absorbance (at 405nm) after the addition of ADP, as a platelet agonists, and adenosine or Phyllanthus niruri L extracts, as platelet aggregation antagonists. The first reading was taken after 30 second of ADP addition, followed by every minute reading up to 10 minutes. Platelet counts were set up to 1.5 x 10⁸ cells/ml. ADP concentration was 10µM, Adenosine concentration was 50µM and each extract concentration was 250µg. Data points on the graph represent the mean ± SEM of eight replicates of the experiment (n=8). (Control-Isolated platelets without the addition of agonist or antagonist, ADP-Platelet aggregation induced by ADP without the presence of adenosine/extracts, Water/Hexane/Chloroform/Ethanol/Methanol-Platelet aggregation induced by ADP with the presence of Phyllanthus niruri L extracts. Inset: the biphasic platelet aggregation curve.
-10%
10%
30%
50%
70%
90%
110%
130%
0 1 2 3 4 5 6 7 8 9 10
Max
imu
m r
esp
on
se (
%)
Time (min)
Control ADP only Adenosine Water
Hexane Chloroform Ethanol Methanol
-10%
10%
30%
50%
70%
90%
110%
130%
0 2 4 6 8 10 12
ADP only
Adenosine
Primary wave
Secondary wave

143
The percentage of the inhibition is shown in Figure 4.19, as a measure of the extent of
platelet-aggregation inhibition of Phyllanthus niruri L extracts. The value was calculated by
the following equation:
Inhibition (%) = (1-B/A) x 100
where A represents the changes of absorbance after 10 minutes aggregation induced by
ADP, and B is the changes of absorbance of platelet aggregates with the presence of
adenosine or extracts. Figure 4.19 indicates a strong inhibitory activity of Phyllanthus niruri L
extracts. The water extract exhibited the highest inhibitory potency (80.5±3.7%), followed
by methanol extract (54.0±2.8%). Other extracts exhibited a lower inhibitory effect with
inhibition value of 46.2±2.7 for chloroform extract, 44.4±17.1% for hexane, and 41.7±21.4%
for ethanol extract. Overall, the antiplatelet aggregation effect of Phyllanthus niruri L
extracts was similar to that displayed by adenosine (47.0±2.3%).
Figure 4.19 – Inhibition of platelet aggregation
Data points on the graph represent the mean ± SEM of eight replicates of the experiment (n=8). Platelet aggregation was induced by ADP at a concentration of 10µM, and the extract concentration was 250µg. Data points on the graph represent the mean ± SEM of eight replicates of the experiment (n=8).
47%
87%
44% 46% 42% 54%
0%
10%
20%
30%
40%
50%
60%
70%
80%
90%
100%
Adenosine Water Hexane Chloroform Ethanol Methanol
Inh
ibit
ion
(%
)

144
4.3 Discussion
4.3.1 Anti-malarial activity
The fact that the majority of effective drugs available to date actually originated from plants
has given an assertive view that natural products have played a dominant role in drug
discovery and development for many years. One important example is the discovery of the
first and most potent anti-malarial drug, quinine, a compound isolated from the bark of
Cinchona species, which has remain in use today for treating malaria, and has initiated the
synthesis of many theraupeutic derivatives. In this study, Phyllanthus niruri L as one the
richest sources of natural entities originated from plants, has been subjected to an
investigation of its biological activities, in order to seek lead compounds for further
development into definite drug candidates. Screening for medicinal properties of the crude
extracts of Phyllanthus niruri L, as one of the well-known herbal remedy, has become a
crucial step in the drug discovery process.
In this investigation, we have determined the anti-malarial effects of five crude extracts
obtained from the leaves of Phyllanthus niruri L. For determination of the efficacy of the
given extracts, Basco and co-workers (1994) introduced a criteria for considering the
antiplasmodial activity of extracts isolated from many plant species, which has been
adopted in this report. The IC50 values below 10 µg/ml were classified as good potency, IC50
value within the range from 10-50 µg/ml were identified as moderate potency, IC50 from 50-
100 µg/ml were known as low potency, and those whose IC50 exceeding 100 µg/ml was
considered to have no effect on the plasmodial growth. From the data presented in this
study, four extracts out of five tested possess anti-malarial activity; however they show a
varied pattern of inhibitory potency. Water and methanol extracts were found to express

145
the highest potency in inhibiting plasmodium growth. Moderate anti-malarial potency was
showed by the ethanol extract, whereas chloroform extract exhibited the lowest activity.
Various crude extracts originated from a diverse source of other plants species have been
thoroughly explored and tested against plasmodium parasites. Batista and co-workers
(2009) reported that various extracts from at least 60 species of higher plants within the
group of 34 plant families had been tested against chloroquine-resistant and chloroquine
sensitive plasmodium strains. From more than a hundred extracts showing the inhibitory
effect on the parasite growth, methanol extract were identified as the one most frequently
containing the highest levels of inhibitory activity in the anti-malarial assay and to express
significant antiplasmodial potency for chloroquine-resistant and chloroquine-sensitive
strains (IC50 values from 1-79 µg/ml). In the same review, water, ethanol, chloroform,
hexane extracts were found to be less frequently identified as the source of the most potent
inhibitory compounds. Nevertheless, the latter extracts did exhibited some activity against
plasmodium parasites. In accordance with our result, the methanol extract inhibitory
activity was the greatest among others tested thus indicated that, from the plant containing
anti-malarial substances, the compound (s) responsible for anti-malarial activity tend to be
enriched in the crude extract obtained by methanol extraction. At this stage, the candidates’
chemical groupings for the anti-malarial agents are as yet inconclusive, considering that the
crude extracts were more likely to consist of a diversity of secondary metabolites.
Moreover, the variety of active constituents present in this extract may benefit its anti-
malarial activity as the substances might show some potentiating synergy effects on the
other constituents. One example of this was seen with a class of flavonoids isolated from
Artemisia annua which were not effective as anti-malarial agent when administrated alone,

146
however it significantly enhanced the antiplasmodial effect of artemisinin, the well-known
anti-malarial agent that was originally found from the same plant (Saxena et al., 2003).
Natural compounds obtained from plants which have shown anti-malarial activity are
classified into two general categories : alkaloid and non-alkaloid natural products (Batista et
al., 2009). The alkaloid group is exclusive due to the extensive number of compounds it
consists of. The latter group encompasses several classes, namely terpenes, limonoids,
flavonoids, chromones, xanthones, antraquinones, and other related compounds. Quinine
and artemisinin, the famous anti-malarial agents isolated from plants, are included in the
previously mentioned groups; alkaloid and sesquiterpene, respectively. The other essential
groups are included but not limited to flavonoids and xanthones, triterpenoids, quinones.
Recently, several miscellaneous compounds isolated from a number of plants, which are not
of the above classes of compound, have been reported. Saxena and co-workers (2003) has
highlighted at least 127 alkaloids, 18 quassinoids, 23 sesquiterpenes, 27 triterpenoids, 21
flavonoids/xanthones, nine quinones, 25 miscellaneous compounds that were either
isolated or originated from plant extracts. The above data, to date, support the fact that
ethnopharmacological approaches have been proven to be more productive for the search
of new candidates of anti-malarial agents.
From a number of published works on the chemical constituent of Phyllanthus niruri L,
Bagalkotkar and co-workers (2006) concluded that several compounds isolated from the
crude extracts of this plant are listed as natural compounds showing anti-malarial
properties. The first one is catechin (Batista et al., 2009), a phenolic compound that is
reported as one of flavonoid found in Phyllanthus niruri L. Three terpenes; limonene, p-
Cymene, and lupeol; are of antiplasmodium inhibitory secondary metabolites isolated from
147
this plant. Limonene and lupeol were found to inhibit the erythrocytic development of the
chloroquine-resistant plasmodium falciparum strains (Batista et al., 2009). Moreover,
securinine was found as one of alkaloid contained in Phyllanthus niruri L. The latter
compound showed an activity in inhibiting the growth of K1 strain Plasmodium falciparum.
The activity was argued to be related to the presence of unsaturated α,β-carbonyl that
undergoes a reaction with nucleophilic sites in the parasite DNA molecules, causing the
inhibition of parasite growth (Batista et al., 2009). A bioassay-guided fractionation of
aqueous extracts from the whole plant of Phyllanthus niruri L has led to the isolation of 1-O-
galloyl-6-O-luteoyl-α-D-glucose, that exhibited a strong inhibitory action against
Plasmodium falciparum growth with an IC50 of 1.4 µg/ml, β-glucogallin with an IC50 of 4.6 ±
0.4 µg/ml , 3-O-β-d-glucopyranosyl-(2→1)-O-β-d-xylopyranoside with an IC50 of 11.0 ± 1.3
µg/ml, β-glucogallin, β-sitosterol with an IC50 of 32.0 ± 3.7 µg/ml, and gallic acid with an IC50
of 14.8 ± 1.9 µg/ml (Subeki et al., 2005).

148
Figure 4.20 – Chemical structure of anti-plasmodial compounds from Phyllanthus niruri L
According to phytochemical screening results as previously described in section 3.2.3, water
and methanol extracts were positive for alkaloid, flavonoids, saponin, amino acid, and
carbohydrate but negative for steroid/triterpenoids and glycoside. The results in this thesis
demonstrate slight differences with results being reported elsewhere regarding the
phytochemical constituents of Phyllanthus niruri L, attributed to variation in the
geographical location of the plant source, extraction method, and phytochemical analysis
technique (Section 3.3). The alkaloid contained in Phyllanthus niruri L (e.g. securinine),
flavonoids (e.g. catechin) and glucose (e.g. 1-O-galloyl-6-O-luteoyl-α-D-glucose) groups
might be of important and responsible for the anti-malarial efficacy of water and methanol
extracts seen in this study. The ethanol extract that showed negative result for flavonoids,
according to the data presented in Table 3.3, was more likely to contain less active
compounds which are responsible for the anti-malarial activity and as the consequence,
presented a lower inhibitory activity compared to the other plant extracts.
Catechin
Limonene p-Cymene
Lupeol
Securinine

149
4.3.2 Anti-cancer activity
Cancer is one of the major causes of worldwide mortality and has become a huge medical
problem due to the nature of the disease, which stems from uncontrolled growth of highly
mutated cells. This disease is extremely hard to manage owing to a wide range of types of
tumours, which show various responses to existing chemotherapy agents and treatment
regimes (Tang et al., 2010). Despite the growing of cancer cell resistance to existing anti-
cancer drugs, undesirable effects might occur from chemotherapy such as vomiting, nausea,
and alopecia. These symptoms are the result of the high toxicity of typical anti-cancer drugs,
which are supposedly targeting the mutagenic and highly differentiated cells, however the
selectivity is not perfect as many of normal cells also similarly affected by the drugs. Bone
marrow elements, gastrointestinal mucosa, epithelial and hair follicles are of regenerating
tissues possessing high proliferative capacity, and thereby endure most of the toxic effects
of antineoplastic agents. Herbal and plant-derived medicines have become a new hope in
modern society as a natural alternative to traditional chemotherapy, which are expected to
kill cancerous cells with less potential harmful side effects (Newman and Cragg, 2007).
In the present study, Phyllanthus niruri L extracts were seen to display a range of cytotoxic
effect on human Caucasian lung large cell carcinoma (COR-L23), human acute T
lymphoblastic leukaemia (MOLT-4), and human Caucasian chronic myelogenous leukaemia
(K562). As a comparison, growth inhibition of Phyllanthus niruri L extracts on COR-L23 and
MOLT-4 cell lines was shown to be more effective than on K562. The result showed that
methanol extract exhibited high cytotoxicity for both COR-L23 and MOLT-4 cells. Towards
COR-L23 cells, our data demonstrated that chloroform extract exhibited the strongest
toxicity with the lowest IC50. Interestingly, based on the IC50 values, water extract of

150
Phyllanthus niruri L was only effective on COR-L23 while showing insignificant activity
towards the growth of the other cell lines.
The efficacy of Phyllanthus species in inhibiting the growth of cancer cells, with no toxic
effect towards normal cell lines, has been reported in the literatures (Tang et al., 2010, Lee
et al., 2011). Lee and co-workers (2011) reported that methanol and water extracts of four
Phyllanthus species (Phyllanthus amarus, Phyllanthus niruri, Phyllanthus urinaria and
Phyllanthus watsonii) displayed cytotoxicity on adherent cells, human lung carcinoma cells
(A549) and breast cancer cells (MCF-7), with an ability to inhibit the migration and adhesion
of the cancer cells. This ability of Phyllanthus species is suggested to be associated with the
presence of polyphenol compounds in its extracts (Lee et al., 2011). Moreover, Phyllanthus
species were reported to exhibit anticancer effects against leukaemia cells, for examples on
HL-60 and Dalton lymphoma cells, possibly by inducing apoptosis activities on these cell
lines (Harikumar et al., 2009, Huang et al., 2004). Marten-Talcott and co-workers (2003)
mentioned in their report on MOLT-4 cell line study that quercetin and ellagic acid,
polyphenols containing in Phyllanthus niruri L, demonstrated a synergistic influence in the
induction of MOLT-4 apoptosis. In accordance with these earlier studies, our initial results
have provided an insight of anticancer activities of Phyllanthus niruri L against COR-L23 and
MOLT-4 cell lines.
Based on the IC50 values in this present study, Phyllanthus niruri L showed a lower
cytotoxicity on K562 cells, compared to other cell lines tested. K562 cells is known as a
multidrug resistance (MDR) cell line, which was reported to demonstrate resistance to
existing chemotherapy agents, such as vincristine and imatinib (Rumjanek et al., 2001,
Pocaly et al., 2008). The resistance of K562 cells was probably due to the expression of the

151
multidrug transporter, P-glycoprotein, which reduce the cytotoxic effect of a given
anticancer drugs by pumping out the drugs out of the cells, thus providing the cancer cells
the ability to resist even lethal dose of cytotoxic drugs (Lehne, 2000). Our study
demonstrated that hexane extract of Phyllanthus niruri L showed the highest potency to
inhibit the growth of K562 cells with an IC50 of 120.19 ± 8.48 µg/ml, followed by methanol
and ethanol extracts at an IC50 of 139.29 ± 19.02 µg/ml and 148.51 ± 10.81 µg/ml,
respectively. Leite and co-workers (2006) tested hexane extract of Phyllanthus amarus, a
closely-related species to Phyllanthus niruri L, on vincristine-resistant K562 cell lines. The
authors suggested the potential action of Phyllanthus amarus to reverse the K562 cells
resistance on anticancer chemotherapy. Therefore, similar finding in this study indicated the
impact of active constituents in hexane extract towards K562 cell lines. Sakkrom and co-
workers (2010) isolated two triterpenoids, gliochidone and lupeol, hexane extract of one of
Phyllanthus species, Phyllanthus taxodiifolius beille. The authors suggested that these active
compounds were responsible for the inhibition of the proliferation of both sensitive and
resistance K562 cell lines (Sakkrom et al., 2010). However, the clear mechanism of the
inhibitory effect is still not understood.
The variation in the efficacy of Phyllanthus niruri L extracts against COR-L23, MOLT4, and
K562 is due to the differences of the bioactive substances present in each extract. As
previously explained, phytochemical studies of Phyllanthus niruri L showed a rich mixtures
of compounds including alkaloid, flavonoid, tannin, and terpenes (Bagalkotkar et al., 2006).
Based on data presented in the previous chapter, all extracts showed positive reaction for
alkaloid and tannin, thus might be implicated in the observed cytotoxic effects. Flavonoids
were only found in the water and methanol extracts; whereas ethanol, hexane and
chloroform extracts FITR spectra indicated the presence of hydrocarbon groups that might
152
be due to a trace of terpenoids in the crude extracts. The differences in the type of
compounds found in each of the crude extracts might contribute to the variety of the
cytotoxic effects seen in this study. Moreover, the presented data suggests that the
methanol extract of Phyllanthus niruri L expresses the most evident cytotoxic activity
compared to the other four extracts.
Among others, flavonoids, known as polyphenol compounds ubiquitously in plants, have
been widely reported as promising anti-cancer agents. A number of studies based on
laboratory experiments, epidemiological investigations, and human clinical trials suggested
that flavonoids have significant effects on cancer treatment (Ren et al., 2003). Alkaloids and
tannin are of important chemical compounds isolated from medicinal plants that exhibit
antiproliferation effects on various types of cancer lines, some of which have already been
successfully developed into anti-cancer drugs (Li et al., 2003, Lu et al., 2012).
Terpenes consist of a large and varied classes of hydrocarbons that are abundant in plants.
Terpenes can exist as hydrocarbons or have oxygen-containing compounds such as hydroxyl,
carbonyl, ketone or aldehyde groups. After chemical modification of terpenes, the resulting
compounds are referred to as terpenoids (Paduch et al., 2007). Limonene and lupeol are of
terpenoids present in Phyllanthus niruri L which are reported to express anti-cancer
properties. Limonene anti-cancer activity may be associated with selective inhibition of the
post-translational isoprenylation of oncoprotein p21ras and other small GTP binding
proteins, which may alter intracellular organization leading to cell death (Crowell et al.,
1991).
One of the challenges in the discovery of effective chemotherapy in cancer treatment is that
cancer cells have the ability to escape a programmed cell death or apoptosis. Many drugs

153
have failed to show efficacy against tumour cells because of this unique ability. Therefore,
one of the mode of actions of anti-cancer drugs is aimed the reactivation of this mechanism
of cell death mechanism. The cell cycle is a continuous process of the control of cell growth
and proliferation. This process is tightly regulated by stringent checkpoints that are applied
to each cell cycle phase to avoid any errors in the overall development of cells. Thus, the cell
cycle could serve as a target for anti-cancer agents to halt the uncontrolled proliferation of
cancer cells and to initiate them into undergoing apoptosis. (Tang et al., 2010) . In normal
mammalian cells, M-phase usually lasts less than an hour while the S-phase is typically
about 6-8 hours in length. Cells usually spend most of their time in growth phase between
divisions, or in known as interphase which typically occupies about 95% of the cycle. In
contrast, the length of G1 and G1 is quite variable; G2 is shorter than G1 and more uniform
in duration. Synthesis of DNA during S-phase and cell division into two daughter cells
happening in M-phase are the main features of cell cycle progression. G2 phase allows cells
to repair errors occurring during DNA replication, whereas the G1 phase represents the
period of cell preparation for the subsequent DNA duplication. Moreover, progression
through the cell cycle is controlled by CDKs as previously described in section2.4.2.
The leading checkpoint involved in preventing cells with damaged DNA from proceeding
through the cell cycle is known as the DNA damaged checkpoint. This checkpoint is capable
of monitoring DNA damage and halting the cell cycle at various time points, including late
G1-, S-, and late G2-phases, by impeding the formation of different Cdk-cyclin complexes. A
protein called p53 is known as ‘guardian of the genome’. Phosphorylation of p53 prevents it
from interacting with mouse double minute 2 homolog (mdm2) protein, which would
otherwise mark p53 for destruction. ATM-catalysed phosphorylation of p53 therefore
protects it from degradation and leads to a built-up of p53 in the presence of damaged DNA.

154
The accumulation of p53 in turn activates two types of events; cell arrest and cell death. P53
has the ability to act as the transcription factor of specific genes, including the gene coding
for p21, which halts cell cycle progression causing the cells to enter the arrest stage. The
other fate of damaged cells upon the activation of p53 protein is the activation of a group of
genes coding proteins involved in triggering cell death by apoptosis. Some of the proteins
promote apoptosis by binding to and inactivating a normally occurring inhibitor of apoptosis
known as Bcl-2 protein (Becker et al., 2003).
Based on the data presented in this study, ethanol and chloroform extracts exhibited a G1-
phase arrest after 72 hour treatment, indicating their activity in halting the cell progression
into DNA synthesis. Both extracts therefore disrupt the cell cycle by S-phase arrest, leading
to cell death by apoptosis/necrosis, although the S-phase arrest caused by the chloroform
extract was not as pronounced as ethanol extract. One of the key target of the G1
restriction point is the Rb protein, which controls the expression of genes whose products
are needed for moving through the restriction point and into S-phase. Phosphorylation of
Rb protein, which remains bound to the inactive-E2F molecules which keep the genes from
being activated, abolish its ability to bind to E2F. This event is initiated by growth factors
through the activation of the Ras pathway. Therefore, chloroform and ethanol extracts may
interfere with the protein synthesis in MOLT4 during G1-phase, thus halting their
progression from G1 to S-phase during the cell cycle. Another possible mechanism of cell
cycle arrest is due to inactivation of the phosphorylation of cdc25A/cdc25C-cdc2 via ataxia
telangiectasia mutated (ATM) - checkpoint kinase 2 (Chk2) activation (Agarwal et al., 2006).
Such mode of action was seen after treatment of cells with by Gallic acid, one of the
constituents of Phyllanthus niruri L, which induced G1-phase arrest and further apoptosis in
cancer cells lines. Gallic acid also exhibited a selective induction of Cip1/P21 which might be
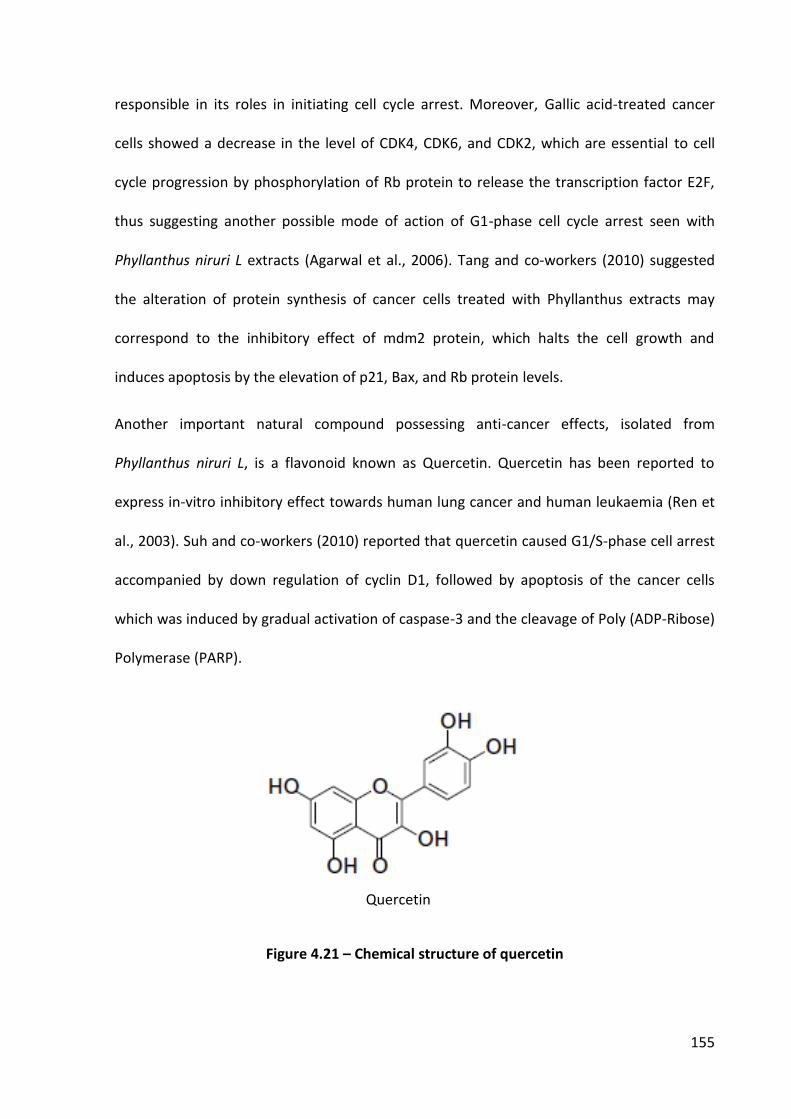
155
responsible in its roles in initiating cell cycle arrest. Moreover, Gallic acid-treated cancer
cells showed a decrease in the level of CDK4, CDK6, and CDK2, which are essential to cell
cycle progression by phosphorylation of Rb protein to release the transcription factor E2F,
thus suggesting another possible mode of action of G1-phase cell cycle arrest seen with
Phyllanthus niruri L extracts (Agarwal et al., 2006). Tang and co-workers (2010) suggested
the alteration of protein synthesis of cancer cells treated with Phyllanthus extracts may
correspond to the inhibitory effect of mdm2 protein, which halts the cell growth and
induces apoptosis by the elevation of p21, Bax, and Rb protein levels.
Another important natural compound possessing anti-cancer effects, isolated from
Phyllanthus niruri L, is a flavonoid known as Quercetin. Quercetin has been reported to
express in-vitro inhibitory effect towards human lung cancer and human leukaemia (Ren et
al., 2003). Suh and co-workers (2010) reported that quercetin caused G1/S-phase cell arrest
accompanied by down regulation of cyclin D1, followed by apoptosis of the cancer cells
which was induced by gradual activation of caspase-3 and the cleavage of Poly (ADP-Ribose)
Polymerase (PARP).
Figure 4.21 – Chemical structure of quercetin
Quercetin

156
In this study, methanol and hexane extracts exerted growth arrest on treated MOLT4 cells
by the accumulation of cells at G2/M phase at the end of 72 hour treatment. The finding
implies that the extracts may impede the protein synthesis during the G2 phase, thus halting
the progression of cell cycle into M-phase and subsequent division into daughter cells. In
other study, Lee et al. (2006) observed the anti-cancer effect of quercetin towards human
leukaemia cells, by inhibiting cell cycle progression through G2/M phase arrest and by
inducing caspase dependent apoptotic cell death. Furthermore, prolonged incubation of
quercetin was reported to induce the G2/M arrested cells progression into cell death, which
might explain a possible mechanism by which the methanol extract induce the S-phase
arrest. Upon the treatment with methanol extract used in this study, the cells exerted a
temporary G1-phase arrest and succeeded to progress into the S-phase after 48 hours of
treatment. However, when the cells were treated for more than 48 hours, the population in
the S-phase underwent apoptosis. Long-term growth arrest has been reported to be
induced by cisplatin, a commonly used anti-cancer drug, by the clustering of Fas/CD95 in the
plasma membrane leading to mitotic failure and premature aging of the cancer cell (Nobili
et al., 2009). Moreover, the S-phase arrest demonstrated by the treatment of MOLT-4 cells
with Phyllanthus niruri L extracts might corresponded to the inhibition of DNA
topoisomerase II or the inhibition of cdc25 enzymes that leads to the activation of caspases.
High level of caspase-3 and caspase-7 activities were detected in cell treated with
Phyllanthus niruri L extracts suggesting the involvement of mitochondrial pathway in
apoptosis (Tang et al., 2010), that could serve as one of key factor in their affect towards the
cell cycle arrest and apoptosis.
Taken together, the presented data indicated the capability of Phyllanthus niruri L extracts
to interfering with the proliferation of cancer cells from leukaemia and lung cancer cell lines

157
in a selective manner. The selectivity was marked by the evident cytotoxic effects towards
cancer cell lines, yet protective towards normal cell lines (de Araújo Júnior et al., 2012).
Although the actual underlying mode of actions of Phyllanthus niruri L against COR-L23,
MOLT4, and K562 has not been elucidated, this initial finding demonstrated the cytostatic
effect of the Phyllanthus niruri L extracts through the modulation of cell cycle, thus partially
explaining their mode of activity.
4.3.3 Antiplatelet activity
Undesirable platelet aggregation is a key underlying mechanism in thrombotic diseases such
as myocardial infarct and stroke, hence preventing the incidence of platelet aggregate
formation has become an important target of anti-thrombotic agents. In the early 1960s,
(Born and Cross) introduced a fundamental base of optical aggregatory, later known as
‘Born aggregrometer’ which led to the discovery of the first-known antiplatelet agents,
including adenosine. Soon after, an important discovery was made, which introduced aspirin
as the first antiplatelet drug, and is still used in the prevention of coronary and cerebral
thrombosis. Thereafter, a big leap was made from an extensive study, which uncovered
platelet aggregation pathways that made possible the discovery of several antiplatelet drugs
employing distinct modes of action in halting platelet aggregation. Aspirin inhibited platelet
function by the irreversible blockade of cyclooxygenase-1 (COX-1). Clopidogrel and
ticlopidine are some of the drugs that target ADP receptors on the platelet surface,
dipyridamole showed a synergetic affect with adenosine as it inhibits the uptake of
adenosine by platelet, whilst others altered arachidonic acid metabolism in platelets (Born
and Patrono, 2006). However, starting from the early of 1980 until recently, there seems to
have been slow progress in the development of platelet aggregation inhibitors, with only

158
four new chemical entities being discovered so far. Incidentally most of these are derived
from natural products (Newman and Cragg, 2012). Some of the new antiplatelet agents,
including an inhibitor for platelet membrane glycoproteins GPIIb/IIIa, are currently in phase
2 or phase 3 of the clinical trial.
In this study, we tested the inhibitory effects of Phyllanthus niruri L extracts on ADP-induced
platelet aggregation. ADP is one of important platelet agonist and is naturally stored in the
dense granules of resting platelets. ADP causes several intracellular responses in platelets
including the inhibition of adenyl cyclase, formation of inositol triphosphate, mobilisation of
intracellular calcium stores, rapid calcium influx, and the activation of phospholipase A2 (Jin
et al., 1998). When exposed to external ADP, platelets change their shape from smooth
discs to speculated spheres leading to a series of platelet aggregation events involving the
activation of platelet membrane receptors for ADP (P2Y1 and P2Y12), the release of granule
contents, and the synthesis of TXA2. However, it has been revealed the platelet activation
initiated by ADP is reversible. When ADP levels are not sufficient to maintain platelet
aggregates formation, platelet activation is disrupted, resulting in the recovery of platelets
into their resting state. The formed aggregates then lose their adhesiveness and, finally the
breakdown of platelet aggregates occurs. In our preliminary study, ADP demonstrated its
potency to induce platelet aggregation, using a dose slightly higher than the threshold for
ADP-induced platelet aggregation based on the standard assay aggregrometer, which is
within the range of 1-7.5 µM. Bednar and co-workers (1995) who introduced the 96-well
microplate platelet aggregation assay used in this study, showed that ADP at a dose of 1 to
10 µM was able to induce an observable aggregation traces. However, the higher end of the
dose range was chosen in this study as it exerted the highest response with little decline on
platelet aggregates traces over the time.

159
In performing its main function as a surveillance cell in haemostasis, platelets must have a
fully functioning activity to initiate the platelet aggregation reactions. Based on our
preliminary test, fresh platelets appeared to have the highest aggregation response when
exposed to the external ADP compared with older platelets (1 to 3 days old). The result
suggested that blood age is a crucial factor of the platelet aggregation function, indicated by
the fact that 1-2 days old platelets exhibited lower aggregation response and the 3-days old
platelets lost the most of its aggregation ability. The similar results were reported by
Thompson et al. (1984), based on the study of baboon’s platelet, which concluded that
young platelets at the age of 2 days are still able to form platelet aggregates. Our
preliminary result of platelet aggregation suggested that although fresh platelets are
favourable for monitoring the platelet function the usage of stored blood sample is possible,
with the conditions that (1) blood age is not more than two days and (2) blood sample is
stored at room temperature.
Based on the initial screening for antiplatelet activity in this study, Phyllanthus niruri L
extracts showed a remarkable inhibitory effect on platelet aggregation induced by ADP. The
result indicates that the water extract possesses the stronger anti-platelet activity followed
by methanol, which inhibiting more than 50% of platelet aggregate formation, compared
with the maximum aggregation induced by ADP. The other extracts, which were ethanol,
chloroform, and hexane, inhibited platelet aggregation with similar potency to that shown
by adenosine. Adenosine was used as a positive control as its activity in inhibiting platelet
aggregation has been widely recognised. Adenosine’s mechanism of action is believed to be
due the alteration of adenylate cyclase leading to an increase in the concentration of cAMP,
and the inhibition of calcium influx as well as the release of intracellular calcium stores (Paul
et al., 1990).

160
Furthermore, the aggregation curve in the presence of Phyllanthus niruri L extracts did not
show a secondary wave of platelet aggregation compared with the biphasic curve normally
seen to arise from ADP-induced platelet aggregation. The initial changes in platelet
aggregation caused a decrease of light transmittance followed by a primary wave of
aggregation. The second wave arises from the release of platelet granule contents including
fibrinogen, serotonin, TXA2, and ADP with potentiate the initial aggregation response (Zhou
and Schmaier, 2005). The finding indicated that the active compounds contained in the
crude extracts might be able to prevent platelet release reactions, thus might be related
with the inhibitory activity.
Despite this initial finding, the possible mechanism of action of the antiplatelet effect is still
far from being determined. Water and methanol soluble compounds contained in
Phyllanthus niruri L plant might be responsible for the antiplatelet potency. Furthermore,
the relative amount of the active compound within these mixtures must also be taken into
consideration when comparing relative activities of crude mixtures. However, they are a
useful indicator when comparing initial activity data of antiplatelet properties possessed by
Phyllanthus niruri L.

Chapter 5Focusing on the Antiplatelet
Activity of Phyllanthus niruri L

162
5.1 Introduction
The initial screening results have confirmed that Phyllanthus niruri L extracts expressed a
substantial biological activity in hindering parasites and cancer cells growth, as well as in
inhibition of platelet aggregation. The finding also suggested that the water and methanol
extracts were the most active extracts which showed the highest potency for the biological
effects. Based on data presented in section 3.2 , the yield weight of the water and methanol
extracts are higher, relative to the starting plant material. Therefore, the result indicates
that amongst all extracts used, water and methanol extracts might contain the most active
substances responsible for the biological effects as anti-malarial, anti-cancer, and
antiplatelet. And it is also suggested that the active compounds might be of polar
compounds and hence more soluble in water and/or methanol.
The volume of work required to identify both the active components from the extract and
to elucidate their mechanisms of action in all three medical areas chosen in this thesis
would be a vast undertaking. Hence a decision was made to focus on Phyllanthus niruri L
antiplatelet effects as this has been less widely studied and the need for new therapeutics in
thrombotic diseases is great. The efficacy of the water and methanol extracts towards in-
vitro platelet aggregation was evident; the former extract showed that ADP-induced platelet
aggregation was halted at about more than 80%, in addition to the fact that both extracts
showed an inhibitory potency which surpassed the potency of adenosine, a well-known
antiplatelet agent. Furthermore, the need for a new and safe antiplatelet drug is emerging
due to a slow progress of new antiplatelet drug discovery during the period of the last 30
years. With regards to natural-derived antiplatelet agent, although some progress has been
made which revealed the antiplatelet properties of some herbal remedies, kitchen spices,
and dietary sources (Samuels, 2005), the investigation of the active constituents, expressing
163
the antiplatelet activity, isolated from Phyllanthus niruri L is very limited. Accordingly, having
revealed the strong antiplatelet potency of Phyllanthus niruri L extract showed by water and
methanol extracts, the next chapters will focus on further exploration of the extracts with
the final aim of the isolation of the active compounds responsible for the antiplatelet
activity.
As previously mentioned in section 3.2, the relative amount of the biologically-active
materials within the crude extracts is the crucial factor affecting the activities. Water is a
polar solvent that is superior in term of it safety and low toxicity and, accordingly, is used
widely in herbal remedy preparation such as decoction or infusion. However, it conveys
some disadvantages for solvent extraction processes due to the high boiling point which
risks of losing the thermolabile compounds, and the extraction of a bulk of unwanted plant
biomass in the crude extract as most of plants materials are particularly water soluble.
Based on the observation of the residual plant material (marc) after a non-exhaustive
maceration (chapter 4.2.2), water extraction left insignificant remaining marc thus indicating
that Phyllanthus niruri L plant material is water soluble. As the means of plant extraction is
a process of separation of plant constituents from the plant material, water extract might
not show a distinct properties and biological activities compared with the starting material,
which is obviously consists of a large number of substances. Therefore, it would not provide
an initial purification step and lead to prolonged separation and isolation process.
Therefore, for the purpose of isolation of active compounds, water extraction is rarely used
as the initial extraction step for the bioassay-guided isolation protocol (Sarker et al., 2006).
For this reason, a mixture of water and a miscible organic solvent was included as one of the
initial extraction solvents used in the protocol for isolation of the antiplatelet agent(s) from
Phyllanthus niruri L. This might be beneficial in the initial purification of the active

164
compounds from the plant material, in addition to simplifying further isolation (Sarker et al.,
2006). A research group from japan in 2002 were first to publish antiplatelet effect
associated with an extract from Phyllanthus niruri L. They reported that a 50% (v/v) ethanol
extract demonstrated some inhibition effect on in-vitro platelet aggregation at a
concentration of 1.5mg/ml (Moriyama et al., 2002). A few years later in 2007, the same
research group isolated methyl brevifolincarboxylate from the 50% (v/v) methanol extract
that exhibited a strong of antiplatelet effect (Iizuka et al., 2007). Accordingly, in our study,
the latter proportion of water relative with methanol or 50% (v/v) methanol was also used
as an initial extraction solvent for Phyllanthus niruri L. Finally, the 50% (v/v) methanol
extract, together with water and methanol extracts, was used as the initial starting extracts
used to purify and identify the active antiplatelet compounds present in Phyllanthus niruri L.
5.2 Result
5.2.1 Identification of the most active extract
The extraction of 100 g of Phyllanthus niruri L with 50% (v/v) methanol extract yielded 12.75
g of crude extract or 12.75% (w/w) relative to the starting plant material. The yield is greater
than the yield obtained when Phyllanthus niruri L was extracted by methanol alone (the
yield was 5.2 %). The result of the first test for identifying the most active extract using the
solvent system is shown in Figure 5.1. In this test, ADP-induced platelet aggregation, with
and without the presence of the crude extracts at a final concentration of 250 µg/ml, was
observed. Figure 5.1 shows that Phyllanthus niruri L extracts were able to inhibit ADP-
induced platelet aggregation. The highest inhibition was demonstrated by 50% (v/v)
methanol extract which almost completely halted the formation of platelet aggregates (the
percentage of the inhibition was 98.0±1.1%). Water and methanol extracts inhibitory

165
activities were 78.3±0.5% and 63.6±1.3%, respectively, on the ADP-induced platelet
aggregation.
Figure 5.1 – Platelet aggregation inhibition of water, methanol, and 50% methanol extracts.
The platelet aggregation was monitored for 10 minutes after the addition of ADP at a final concentration of 25 µM with and without the addition of crude extracts at 250 µg/ml. The traces of platelet aggregation are shown in (A) and the extent of the inhibition is shown in (B). Each data point on the graph represents the mean ± SEM of three replicates of the experiment (n=3).
5.2.2 Fractionation of the most active extract
The above finding indicated that the 50% (v/v) methanol extract contained substances
responsible for the most active antiplatelet effect, further purification of the active
components contained in this 50% (v/v) methanol extract was therefore initiated. As
previously described in section 2.6.2, fractionation is an initial separation process, aiming to
obtain various discrete fractions containing compounds of similar polarities or molecular
sizes. For this purpose, the dried 50% (v/v) extract was dissolved in 30% (v/v) methanol and
passed through a column of HP-20 by a successive elution of water, 80% (v/v) methanol, and
100% methanol. The yield weight relative to the amount of 50% (v/v) extract loaded onto
the column was 54.25% (w/w) for water fraction, 11.35% (w/w) for 80% (v/v) methanol
fraction, and 0.47% (w/w) for 100% methanol fraction. Subsequently, the three fractions
0
0.05
0.1
0.15
0.2
0.25
0.3
0.35
0.4
0 0.5 1 2 3 4 5 6 7 8 9 10
Ab
sorb
an
ce
at
40
5n
m
Time (min)
Water
Methanol
50% methanol
ADP only
78%
98%
64%
0%
20%
40%
60%
80%
100%
120%
Water 50% methanol Methanol
Inh
ibit
ion
(%
)
A B

166
were tested against platelet aggregation using the final dose of 125 µg/ml. After the initial
fractionation of the crude extracts, the active compounds were expected to be
concentrated in one of the separated fractions and therefore the dose used in the second
phase of antiplatelet assays is lower than that for the initial aggregation test.
The result are presented in Figure 5.2 and showed that the 80% (v/v) methanol elution is
the most active fraction, which demonstrated an inhibitory level of 82.3±3.3%. The other
fractions showed a lower activity with an inhibition level of 27.3±1.7% (water fraction) and
15.1±5.3 (100% methanol fraction). It is suggested that the active substances responsible for
the antiplatelet activity are accumulated within the 80% (v/v) methanol fraction, whilst the
unwanted substances were dispersed into the water and 100% methanol fractions. This
bioassay-guided preliminary fractionation narrowed down the isolation process by revealing
the most active fraction. The 80% (v/v) methanol fraction, separated from 50% (v/v)
methanol was then analysed further in this chapter.
Figure 5.2 – Second phase platelet aggregation test for the eluted fractions
The fractions from an HP-20 column chromatography were tested for the inhibitory activity towards platelet aggregation induced by ADP (25 µM). The fractions were added at a final concentration of 125 µg/ml. The traces of platelet aggregation are shown in (A) and the extent of the inhibition is shown in (B). Each data point on the graph represents the mean ± SEM of three replicates of the experiment (n=3).
0
0.05
0.1
0.15
0.2
0.25
0.3
0.35
0.4
0 0.5 1 2 3 4 5 6 7 8 9 10
Ab
so
rba
nce
at
40
5n
m
Time (min)
Water F
100% Methanol F
80% Methanol F
ADP only 27%
82%
15%
0%
10%
20%
30%
40%
50%
60%
70%
80%
90%
Water F 80% Methanol F 100% Methanol F
Inh
ibit
ion
(%
)
A B

167
5.2.3 The exploration of the antiplatelet activity of the most active fraction
5.2.3.1 The optimisation of platelet agonists
Prior to separation and fractionation process, the 80% (v/v) methanol fraction (designated
as P5M) was challenged against platelet aggregation induced by different platelet agonists
that represented different pathway of platelet aggregation initiation. For this purpose, in
addition to ADP, several other agonists were used; thrombin, collagen, epinephrine, and
arachidonic acid.
The doses of the agonists used were optimised to obtain the ideal dose for performing the
aggregation test. The result of the dose optimisation is presented in Figure 5.4 - Figure 5.8.
According to the graph in Figure 5.4 - Figure 5.8, the optimum doses were: 15 µM ADP, 62.5
µg/ml collagen, 1 NIH U/ml thrombin, 250 µg/ml arachidonic acid (AA), and 5µM
epinephrine. Furthermore, DMSO was used to prepare P5M solution prior to the addition
into platelet suspension. To obtain the acceptable dose, at which the DMSO presence has
no significant alteration on platelet functions, an initial test was conducted. The results are
shown in Figure 5.3, which suggested that at a concentration from 0.5% (v/v), DMSO
showed an inhibition effect on platelet function. This result was taken into consideration
when preparing P5M solution by setting a maximum acceptable final concentration of
DMSO at a 0.25% (v/v).

168
Figure 5.3 – The effect of DMSO on resting platelet
DMSO was added to the resting platelet suspension prior to the induction of aggregation by horizontal shaking at 1000 rpm. The changes of absorbance were recorded for 10 minutes (A), and compared with resting platelet absorbance at the end of the observation (B). Statistical analysis was performed using two-way ANOVA with Bonferronis’s multiple comparison post-test. Significant difference is shown by (*) for p < 0.05 and (**) for p < 0.01, which represented the difference between DMSO-treated and control groups. The result suggested that at a dose starting from 0.5% and above, the changes of absorbance of platelet showed no significant difference with resting platelet, suggesting that platelet function started to be altered. At a lower dose of DMSO, platelet showed some responses on the physical stimulation, thus causing the initial activation of platelets. Based on this finding, the maximum concentration of DMSO used for the assay was less than 0.25%.
0
1
2
3
4
5
6
7
8
9
10
Max
imu
m r
esp
on
se (
%)
0
0.005
0.01
0.015
0.02
0.025
0.03
0.035
0 0.5 1 2 3 4 5 6 7 8 9 10
Ab
sorb
an
ce a
t 4
05
nm
Time (min)
DMSO 1 %
DMSO 0.5 %
DMSO 0.25 %
DMSO 0.063 %
control
A B
*
**

169
Figure 5.4 – Optimization of ADP dose.
Platelet aggregation was induced by a various dose ADP. The traces of platelet aggregation are shown in (A) and the extent of the maximum aggregation responses is shown in (B). Each data point
on the graph represents the mean ± SEM of three replicates of the experiment (n=3).
Figure 5.5 – Optimization of collagen dose.
Platelet aggregation was induced by a various dose of collagen. The traces of platelet aggregation are shown in (A) and the extent of the maximum aggregation responses is shown in (B). Each data
point on the graph represents the mean ± SEM of three replicates of the experiment (n=3).
0
0.05
0.1
0.15
0.2
0.25
0.3
0.35
0.4
0 0.5 1 2 3 4 5 6 7 8 9 10
Ab
sorb
ance
at
40
5n
m
Time (min)
ADP
ADP 125 µM
ADP 62.5 µM
ADP 31.25 µM
ADP 15.63 µM
ADP 7.81 µM
ADP 3.9 µM0
20
40
60
80
100
120
Max
imu
m r
esp
on
se (
%)
ADP Dose
0
0.05
0.1
0.15
0.2
0.25
0.3
0.35
0 2 4 6 8 10
Ab
sorb
an
ce a
t 4
05
nm
Time (min)
Collagen
250 µg/ml
125 µg/ml
62.5 µg/ml
31.25µg/ml15.63µg/ml
0
10
20
30
40
50
60
70
80
90
100
Ma
xim
um
re
spo
nse
(%
)

170
Figure 5.6 – Optimization of epinephrine dose.
Platelet aggregation was induced by a various dose of epinephrine. The traces of platelet aggregation are shown in (A) and the extent of the maximum aggregation responses is shown in (B). Each data point on the graph represents the mean ± SEM of three replicates of the experiment (n=3).
Figure 5.7 – Optimization of arachidonic acid dose.
Platelet aggregation was induced by a various dose of arachidonic acid. The traces of platelet aggregation are shown in (A) and the extent of the maximum aggregation responses is shown in (B). Each data point on the graph represents the mean ± SEM of three replicates of the experiment (n=3).
0
0.05
0.1
0.15
0.2
0.25
0.3
0.35
0.4
0 0.5 1 2 3 4 5 6 7 8 9 10
Ab
sorb
ance
at
40
5n
m
Time (min)
Epinephrine
Epinephrine 5 µM
Epinephrine 2.5 µM
Epinephrine 1.25 µM
Epinephrine 0.636 µM
Epinephrine 0.31 µM
Epinephrine 0.16 µM
Epinephrine 0.08 µM
0
20
40
60
80
100
120
Max
imu
m r
esp
on
se (
%)
0
10
20
30
40
50
60
70
80
90
Max
imu
m r
esp
on
se (
%)
0
0.05
0.1
0.15
0.2
0.25
0.3
0.35
0 0.5 1 2 3 4 5 6 7 8 9 10
Ab
sorb
ance
at
40
5n
m
Time (min)
Arachidonic Acid
AA 500 µg/ml
AA 250 gu/ml%
AA 125 ug/ml%
AA 62.5 µg/ml
AA 31.25 µg/ml
AA 15.63 µg/ml
AA 7.81 µg/ml

171
Figure 5.8 – Optimization of thrombin dose.
Platelet aggregation was induced by a various dose of thrombin. The traces of platelet aggregation are shown in (A) and the extent of the maximum aggregation responses is shown in (B). Each data
point on the graph represents the mean ± SEM of three replicates of the experiment (n=3).
5.2.3.2 The effect of P5M on platelet aggregation induced by different agonists
The inhibitory effect of the presence of P5M on the aggregation induced by distinct platelet
agonists is shown in Figure 5.10. Data obtained shows the inhibitory potency of P5M
towards platelet aggregation induced by various agonists, from the strongest to the weakest
activity in the following order was AA-thrombin-epinephrine-collagen-ADP. The extent of
the inhibition was 83.9±3.0% for AA, 80.8±1.3% for thrombin, 79.7±4.6 for epinephrine,
73.1±5.3% for collagen, and 72±1.2% for ADP-induced platelet aggregation.
The traces of aggregation were recorded for 10 minutes as presented in Figure 5.10. In the
presence of P5M, the formation of platelet aggregate, induced by various agonists, was
significantly halted (Figure 5.9). The finding suggested that P5M inhibited platelet
aggregation, irrespective of the aggregating agents used. The inhibition effect of P5M was
greater in platelet aggregation induced by AA, which expressed a relatively low aggregation
effect. In addition to this, as presented in Figure 5.10, AA significantly inhibited the first
-0.05
0
0.05
0.1
0.15
0.2
0.25
0.3
0.35
0 0.5 1 2 3 4 5 6 7 8 9 10
Ab
sorb
ance
at
40
5n
m
Time (min)
Thrombin
Thrombin 1 NIH U/ml
Thrombin 0.5 NIH U/ml
Thrombin 0.25 NIH U/ml
Thrombin 0.125 NIH U/ml
Thrombin 0.063 NIH U/ml
Thrombin 0.031 NIH U/ml
Thrombin 0.016 NIH U/ml
0
10
20
30
40
50
60
70
80
90
100
Max
imu
m r
esp
on
se (
%)
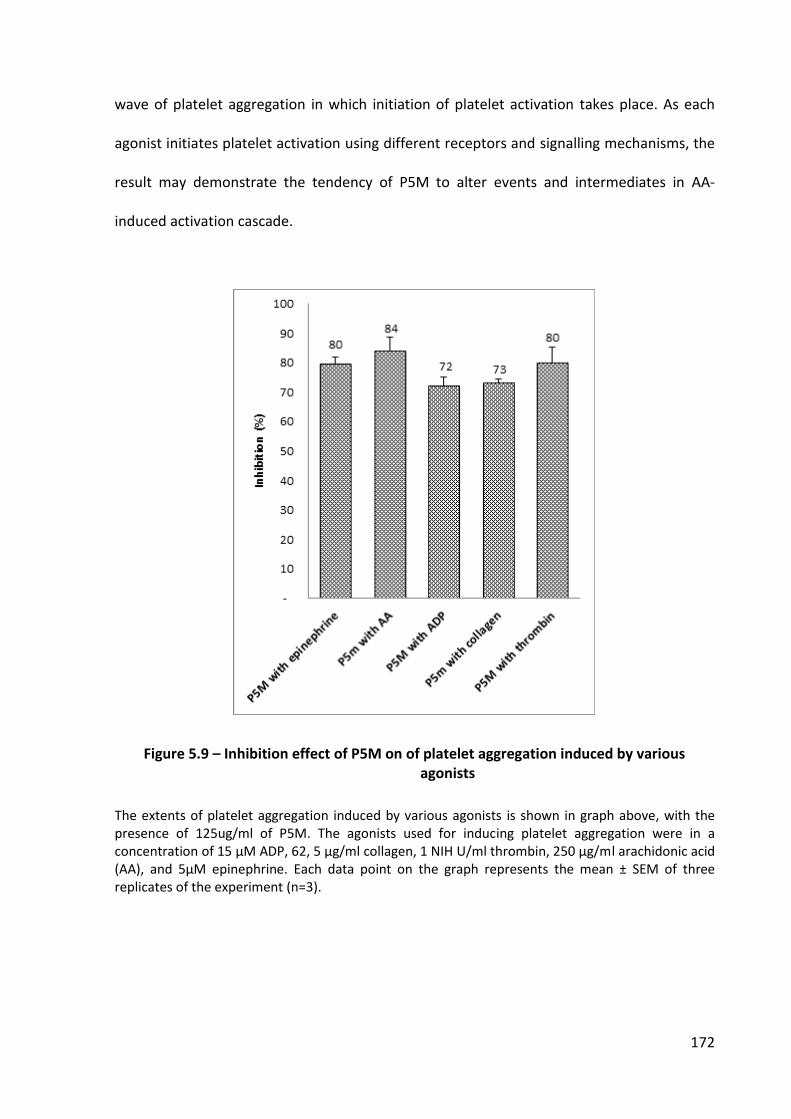
172
wave of platelet aggregation in which initiation of platelet activation takes place. As each
agonist initiates platelet activation using different receptors and signalling mechanisms, the
result may demonstrate the tendency of P5M to alter events and intermediates in AA-
induced activation cascade.
Figure 5.9 – Inhibition effect of P5M on of platelet aggregation induced by various agonists
The extents of platelet aggregation induced by various agonists is shown in graph above, with the presence of 125ug/ml of P5M. The agonists used for inducing platelet aggregation were in a concentration of 15 µM ADP, 62, 5 µg/ml collagen, 1 NIH U/ml thrombin, 250 µg/ml arachidonic acid (AA), and 5µM epinephrine. Each data point on the graph represents the mean ± SEM of three replicates of the experiment (n=3).

173
Figure 5.10 – Platelet aggregation induced by various agonist in the presence of P5M
Platelet aggregation was monitored every minute for a total of 10 minutes observation. The aggregation was induced by 15 µM ADP, 62.5 µg/ml collagen, 1 NIH U/ml thrombin, 250 µg/ml arachidonic acid (AA), and 5µM epinephrine. Each graph (A-E) showed the traces of platelet aggregation with and without the presence of 125 µg/ml P5M. Each data point on the graph represents the mean ± SEM of three replicates of the experiment (n=3)
0
0.05
0.1
0.15
0.2
0.25
0.3
0 2 4 6 8 10
Ab
sorb
ance
(%
)
Time (min)
ADP
P5M
A
0.00
0.05
0.10
0.15
0.20
0.25
0.30
0.00 2.00 4.00 6.00 8.00 10.00
Ab
sorb
ance
(%
)
Time (min)
Thrombin
P5M
D
0
0.05
0.1
0.15
0.2
0.25
0 2 4 6 8 10
Ab
sorb
an
ce (
%)
Time (min)
EpinephrineP5M
0
0.05
0.1
0.15
0.2
0.25
0 2 4 6 8 10
Ab
sorb
ance
(%
)
Time (min)
Collagen
P5M
E
0
0.02
0.04
0.06
0.08
0.1
0.12
0.14
0.16
0.18
0 2 4 6 8 10
Ab
sorb
an
ce (
%)
Time (min)
Arachidonic acidP5M
C
B

174
5.3 Discussion
Researchers working on phytochemicals are often met with the challenge of the solvent
extraction of plant materials as the initial step on the isolation of the active compounds
responsible for the biological activities (Sarker et al., 2006). Several considerations must be
taken into account at every step involved including, biological testing, and chromatographic
preparation. When attempting the isolation of known compounds, the features of the
molecule provide general data of the desired substances, including the solubility, stability,
and molecular size. However, isolation of unknown compounds does not provide such basic
information, which is crucial for determining the methods and solvents for the plant
extraction. In this situation, bioassay-guided isolation is considered as the ideal protocol for
isolation of the biologically-active substances contained in the plant material, as previously
explained in section 1.6.
The first step of the bioassay-guided protocol adopted in this study was the extraction of
Phyllanthus niruri L plant material, in order to determine the most active extract possessing
antiplatelet activity. As the nature of the target compound(s) is unidentified, the extraction
was started using a various solvents of distinct polarity, in order to cover a wide-range of
extracted substances. From the result previously discussed in section 3.2, the highest
amount of Phyllanthus niruri L extract yield was obtained from water and methanol
extraction, thus suggesting that the most extractable components contained in this plant
are of polar substances. When water was added in methanol to obtain 50% (v/v) methanol
for extraction solvent, the extract yield increased, compare to methanol extraction, because
both polar and less polar compounds might be extracted together (Markom et al., 2007).
The initial bioassay test on the crude extracts indicated the hydrophilicity of the active

175
constituent responsible for the antiplatelet activities, which was demonstrated by the high
potency of water and methanol extracts in inhibiting in-vitro ADP-induced platelet
aggregation (chapter 3.3). From the data presented in this chapter, the anti-aggregation
effect of P5M was greater compare to water and methanol extracts. At this step, an initial
hypothesis was made, based on the preliminary finding, that the active compounds
responsible for the antiplatelet activity are relatively polar and hydrophilic.
According to Markom et al. (2007), in order for a compound to dissolve in a particular
solvent, the solubility parameters of both substances must be similar. The authors
highlighted the important role of solvent polarity (dipole moment), in addition to other
parameters including hydrogen bonding, electrostatic bonding, and conformational
(dihedral angle). Moreover, Markom and co-workers stipulated that the solubility of one
compound in the solvent can be roughly estimated according to its functional groups. For
example, when the components contain carboxylic acid and hydroxyl groups, their solubility
in water tends to be higher due to hydrogen bonding between the solvent and salute.
Components containing carboxylic acid, ketone and ester groups have the ability to donate
electron (nucleophilic), thus can interact with both aqueous and alcoholic solvents. Whilst
the less polar components, such as ether, require less polar solvents (Markom et al., 2007).
Given that most of natural products have more than one functional group, the containing
active compounds in Phyllanthus niruri L responsible for the antiplatelet effect can be
selectively soluble in water and methanol, as shown in this study.
Prior to the isolation of natural products, several preparation and clean-up steps were
required to selectively remove interfering components, such as some classes of lipids and
plant pigments (Sarker et al., 2006, Sticher, 2008). As previously described, based on the

176
phytochemical analysis in section 3.2, water and methanol extracts consist of a number of
classes of compounds including saponin, alkaloid, flavonoid, tannin, amino acid, and
carbohydrate. The clean-up process can be carried out using a number of chromatography
techniques, which is not only beneficial in separating a bulk of contaminants from the
compounds of interest but also in accumulating the active compounds in one fraction
(Markom et al., 2007). The findings of the bioassay test in this study indicated that the pre-
fractionation step has removed some of the unwanted substances and, moreover, resulted
in the concentration of the target compounds in the 80% (v/v) fraction. After fractionation
with a continuous elution using a HP-20 column, it is more likely that the water fraction
mostly consist of carbohydrates and related polyphenols, whilst the methanol fraction
consist of aromatics glycosides (Sarker et al., 2006).
DMSO is previously reported to affect platelet function by halting the shear-induced
adherence of human platelet which is suggested to be attributed to its ability to alter COX-1
activity (Asmis et al., 2010). In this present study, a trace of DMSO was present in the
platelet suspension when performing the platelet aggregation test. This condition is
unavoidable as the crude extract used is mostly soluble in DMSO. Therefore, a preliminary
test was conducted to monitor DMSO effects towards platelet aggregation induced by a
given physical stimulation. The result showed that at a concentration of 2.5% (v/v) or lower,
DMSO presence did not alter platelet activation. This finding provides the evidence that the
presence of a trace of DMSO does not affect the platelet function and, accordingly, is
acceptable for the platelet aggregation assay.
Platelet aggregation is a result of multiple events involving intercellular signal transmission
through various cellular process and biochemical pathways. Extensive studies on the
mechanism of platelet aggregation has revealed that the outer surface of platelet

177
membrane expresses a number of receptors that play a central role in the initiation of
platelet activation, which commonly occurs after exposure to physical or chemical
stimulation. Platelet activation is initiated by various agonists that utilises a protein-related
signalling cascade, to release protein and non-protein granule content, bring about
cytoskeleton protein phosphorylation, and modification of a number of platelet proteins
(Hoffbrand and Moss, 2011, Zufferey et al., 2012). Physiological platelet agonists, including
ADP, collagen, epinephrine, thrombin, and AA, activate the platelet signalling system
through binding to specific protein receptors on the membrane of platelet and, in turn, lead
to platelet aggregation.
The data produced in this study shows that the isolated platelets are actively responsive to
the stimulation of the agonists, causing the formation of platelet aggregates. Arachidonic
acid (AA) is released from platelet phospholipid present in granules and membranes of
resting platelets. AA is known as a potent platelet agonist which induces platelet
aggregation through the synthesis of thromboxane A2 (TXA2) by the activity of
cyclooxygenase and thromboxane synthase. Addition of AA in isolated platelet causes a
sudden increase of oxygen consumption and TXA2 synthesis, which then activates its
receptor on the platelet surface, induces further mobilized calcium from platelet internal
storage and rearrangement of platelet cytoskeleton, leading to platelet aggregation (Parise
et al., 1984).
Thrombin, in physiological conditions, is generated locally by vascular endothelial upon
damage of the vascular wall. Through its binding with thrombin-specific receptors, PAR1 and
PAR2, thrombin activates its receptors by binding and cleaving the amino terminal of these
receptors, which in turn initiates the signal transduction events required for optimal platelet
activation (Brass, 2003). Likewise AA, thrombin is known as a strong agonist that, in

178
physiological condition, mainly function in the amplification of platelet aggregation. Their
activity in platelet aggregation is considered as an irreversible reaction, which contributes to
their great potency. In comparison to the ADP-induced aggregation which shows a biphasic
aggregation curve (previously explained in section 3.2), AA and thrombin induce a sudden
increase and single peak pattern platelet aggregation curve, as shown in aggregation traces
(Figure 5.10). When their concentration is not adequate to induce platelet aggregation,
thrombin and AA enhances the effect of biological agonists released from initial activation
and causes indirect effect of stimulation. Our data showed that P5M, significantly prevented
platelet aggregates formation induced by AA and thrombin, thus provides further evidence
of antiplatelet activities of Phyllanthus niruri L.
ADP and epinephrine were confirmed in this study as two weak agonists that inhibit the
activity of adenyl cyclase. Two ADP receptors, P2Y1 and P2Y12, and the epinephrine
receptor (α2 -adrenergic receptor) are responsible in platelet activation and shape change.
Although they have the ability to stabilise platelets aggregation, ADP and epinephrine are
considered as weak platelet agonists because the granule secretion that enhance further
platelet activation, is strongly dependent to platelet aggregation (Charo et al., 1977). There
are two major collagen receptors that have been identified, GPIa-IIa ((α2 β1 integrin) and
GPVI which contribute to platelet adhesion and stimulate the activation of signalling
cascades. Overall, all of these agonists work in synergy to initiate platelet activation and
aggregation. Differences in the effect of these agonists with and without the Phyllanthus
niruri L extracts will provide useful information on the mechanism of action of the
containing active compounds.
The Inhibition of platelet aggregation induced by different agonists in the presence of P5M
has provided further evidence of the powerful effect of Phyllanthus niruri L in hampering

179
the signalling cascades involved in platelet activation. The effectiveness of the inhibition
may well correspond to the mechanism-of-action of the given anti-platelet agents. ADP,
epinephrine, collagen thrombin and AA cause initial platelet activation and the release of
granular content which further enhances the initial events of activation. P5M, which is
believed to contain more concentrated-quantity of the active compounds, has
demonstrated a strong potency in preventing the manifestation of aggregating platelets
and, provided convincing evidence of its capacity to alter more than one route of signalling
during platelet activation. It is also important to highlight that the early inhibitory effect was
obvious in AA-stimulated platelet activation. Arachidonic acid exposure to platelets triggers
platelet prostaglandin metabolism by the activation of enzymatic reaction that generate
TXA2, thus leading to the forming of platelets aggregates. Given that P5M significantly halts
the initiation of the primary wave of platelet aggregation, inhibition of TXA2 synthesis may
be considered as one of P5M inhibitory pathways. As an initial conclusion, although the
mechanism of action of various platelet aggregation agents differ from one agonist to
another, the findings might imply that P5M acts by blocking a common step shared by these
agonists. Nevertheless, the broad ranging inhibitory effect of P5M towards platelet
aggregation, when activated by different agonist, also indicates that the active compound
(s) in Phyllanthus niruri L. hinder the overall signal transmission in platelet activation and
aggregation.
Chapter 6The Separation of P5M by High Performance Liquid Chromatography (HPLC)

181
6.1 Introduction
Based on the data presented in the previous chapter, the next step is the separation of P5M,
as the most active fraction, for the elucidation of the active compounds responsible for the
antiplatelet activity demonstrated by Phyllanthus niruri L plant. In this study, analytical and
preparative high performance liquid chromatography (HPLC) was employed. The pre-
fractionated sample, P5M, still contains a considerable amount of secondary metabolites
and requires an optimum and suitable HPLC parameters for the separation. Iizuka and co-
workers have introduced an HPLC parameters used for the separation of several medicinal
plant extracts, including Phyllanthus niruri L, which has brought this group to a discovery of
methyl brevifolincarboxylate that expressed some antiplatelet properties (Iizuka et al., 2006,
2007). The parameter described in one of their publications was used as a starting point for
performing the optimisation of the solvent system in the analytical HPLC used in this study.
This system was then used for upscaling to the preparative scale, with some modifications
that will be explained later in this chapter.
The next section in this chapter will present the results from the antiplatelet bioassay tests
on the isolated compound(s) to reveal which are the most active and therefore the best
candidate for development as new antiplatelet agent derived from Phyllanthus niruri L
plant.
6.2 Result
6.2.1 Analytical HPLC for the optimization of the solvent system
As an initial step in the separation process, analytical HPLC was performed on the plant
material, 50% (v/v) methanol extract, and P5M samples. The aims of this analysis was to

182
evaluate the complexity of the mixture of compounds contained within these samples. The
separations were conducted by injecting an equal amount of sample onto the C-18
analytical HPLC column. The similar amount of sample was eluted isocratically using mobile
phase consisted of 0.5 (v/v)% TFA in water:acetonitrile (85:15 v/v) at a flow rate of 0.5
ml/min. The elution was recorded at 254 nm for 25 minutes and the result is shown in
Figure 6.1.
The chromatogram of Phyllanthus niruri L plant material (as shown in Figure 6.1-A)
displayed several major peaks within the first 5 minutes of the separation (retention time of
2.2min, 2.7min, 3.4 min, 4.2min, and 5.2 min). There were also two major peaks at a
retention time of 13.0 min and 14.7 min. The peaks were similar to those produced from the
50% (v/v) methanol extract and P5M HPLC analysis. From the 50 % (v/v) methanol
chromatogram (shown in Figure 6.1-B), the peak height at a retention time of 2.7 min and
13.0 min showed a decline, relative to the other major peaks on the same chromatogram,
thus suggesting that their quantity within methanol extract is lower, compared with that in
the Phyllanthus niruri L plant material. The chromatogram of P5M separation (Figure 6.1-C)
showed that the early eluting peaks, ranging from 0 min to 4.8 minutes in retention time,
were certainly because of sample overloading and no separation was achieved. However,
from visual observation, the other peak retention times corresponded to those displayed on
plant material, 50% (v/v) methanol extract chromatograms. The above finding indicates
that, the major peaks eluted within the first 25 minutes, between Phyllanthus niruri L plant
material, 50% (v/v) methanol crude extract, and pre-fractionated P5M, showed differences
in the quantity of some major peaks. Nevertheless, given that the chromatograms were
produced from the separation of the same amount of samples, the data suggested that the

183
amounts of active substances in P5M, relative to the plant starting material is increased and,
accordingly, may correspond to the increase of its antiplatelet activity.
The same HPLC condition was used for comparing the HPLC separation profile of water
fraction, 80% (v/v) fraction (P5M), and 100% methanol fractions, which were obtained from
the separation of 50% (v/v) methanol extract. Based on this presented chromatograms,
shown in Figure 6.1, the separation of the water fraction resulted in a number of significant
peaks. In accordance with the previous results presented in section 5.2.2, water fraction
showed no inhibitory activities on platelet aggregation. Therefore, it is more likely that the
peaks seen in these samples resulted from some interfering materials or contaminants. On
the contrary, the 100% methanol fraction only produced a few minor peaks with an absence
of any noticeable major peaks, suggesting that the latter elution condition used did not
bring about significant elution and substances remained on the column.
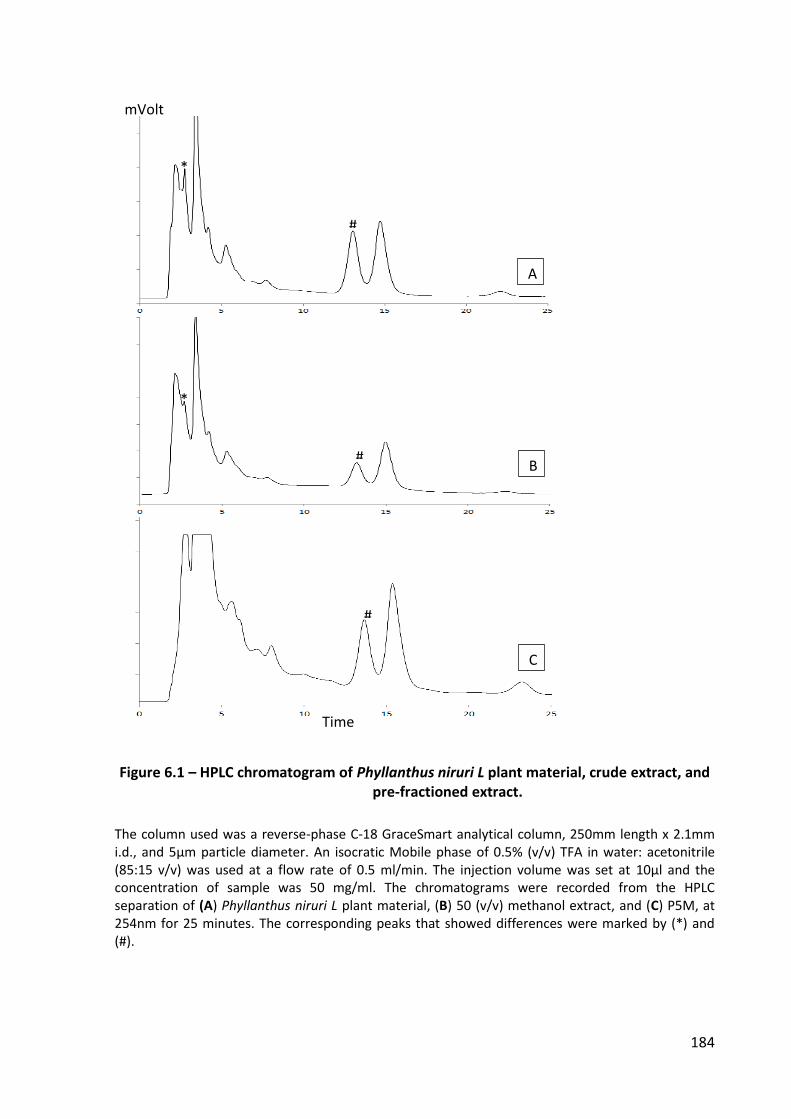
184
Figure 6.1 – HPLC chromatogram of Phyllanthus niruri L plant material, crude extract, and pre-fractioned extract.
The column used was a reverse-phase C-18 GraceSmart analytical column, 250mm length x 2.1mm i.d., and 5µm particle diameter. An isocratic Mobile phase of 0.5% (v/v) TFA in water: acetonitrile (85:15 v/v) was used at a flow rate of 0.5 ml/min. The injection volume was set at 10µl and the concentration of sample was 50 mg/ml. The chromatograms were recorded from the HPLC separation of (A) Phyllanthus niruri L plant material, (B) 50 (v/v) methanol extract, and (C) P5M, at 254nm for 25 minutes. The corresponding peaks that showed differences were marked by (*) and (#).
mVolt
Time
A
B
C
*
*
#
#
#

185
Figure 6.2 – HPLC chromatogram of water, P5M, and 100% methanol fractions
The HPLC column was a reverse-phase C-18 GraceSmart analytical column, 250mm length x 2.1mm i.d., and 5µm particle diameter. An isocratic Mobile phase of 0.5% (v/v)TFA in water: acetonitrile (85:15 v/v) at a flow rate of 0.5 ml/min was used. The injection volume was set at 10µl and the concentration of sample was 10 mg/ml. The chromatograms were recorded from the analytical HPLC separation of (A) Water fraction, (B) P5M, and (C) 100% Methanol fraction, at 254nm for 25 minutes.
mVolts
C
B
A
Time (min)
C

186
The next step was the optimisation of the HPLC parameters for the separation of P5M. As a
guideline, a previous solvents system described by Iizuka et al. (2007) was used. In this
study, three HPLC solvent systems were used to elute P5M off from the analytical column.
The elution was read in 254 nm UV detector and recorder for 90 minutes. The first system is
an isocratic elution using a mobile phase of 0.5%(v/v) TFA in water:acetonitrile (88:12 (v/v) ,
the second is a gradient HPLC run using 0.5% (v/v)TFA in water:acetonitrile with a ratio of
85:15 to 88:12 (v/v) in 90 minutes , and the last solvent system is an isocratic HPLC elution
using a 85:15 (v/v) ratio of water: acetonitrile containing 0.5%(v/v) TFA.
From the chromatograms displayed in Figure 6.3, HPLC separations of P5M using 0.5% (v/v)
TFA in water:acetonitrile (88:12 (v/v) resulted in longer elution time. The chromatogram
contained well-separated peaks, however it demonstrated the tendency of peak
broadening. The use of gradient HPLC run with increasing acetonitrile concentration (from
12% to 15% (v/v)) brought about faster elution time, however, resulted partial separation of
the adjacent peaks and peak broadening, which was more obvious with peaks at longer
retention times. As a consequence, it reduces the selectivity of the HPLC analysis and
produces a poorer separation.
The last HPLC system using isocratic run (85:15 (v/v) ratio of water: acetonitrile) produced a
better separation with sharp symmetrical peaks, in addition to a relatively fast elution time.
Therefore, the latter solvent system was chosen for larger scale preparative HPLC in this
study.

187
Figure 6.3 – HPLC chromatogram of P5M separation using different solvent system
The HPLC column was a reverse-phase C-18 GraceSmart analytical column, 250 mm length x 2.1mm i.d., and 5µm particle diameter. The solvent systems were: (A) an isocratic Mobile phase of 0.5% (v/v) TFA in water: acetonitrile (85:15 v/v), (B) a gradient of 0.5% (v/v) TFA in water:acetonitrile from a ratio of 85:15 to 88:12 (v/v) for 90 minutes, and (C) an isocratic mobile phase of 0.5% (v/v) TFA in water:acetonitrile (85:15 v/v). The injection volume was set at 10µl and the concentration of sample was 10 mg/ml. The chromatograms were recorded at 254 nm for 90 minutes.
10 20 30 40 50 60 70 80
0 100
200 300 400 mVolts
0 100 200 300 400 mVolts
0
100
200 300
400 mVolts
A
B
C
Time

188
6.2.2 Preparative HPLC for the separation of P5M
Following the analytical HPLC experiment, a preparative scale reverse-phase
chromatography was performed using a C-18 column, 250 mm in length, 21.1 mm internal
diameter, and 5µm particle size. The HPLC elution used was an isocratic mobile phase
consisted of 0.5% TFA in water:acetonitrile (85:15 v/v), at a flow rate of 8ml/ min for the
period of 90 minutes. As a result, 11 fractions, named as G1-G11, were collected and pooled
together according to their retention time as shown in Figure 6.4. All fractions were
evaporated and freeze dried. The yield weights, relative to the amount of P5M injected into
the column, and the physical appearance of each fraction are shown in Table 6.1. Each
group represented a candidate for the active compound isolated from Phyllanthus niruri L.
From Figure 6.4, G1, G2, and G3 are the major component peaks showing retention times of
2, 15, and 17 minutes, respectively. The yields were higher when compared with the other
minor peaks in the chromatogram. The smallest peak was found at the end of the
chromatogram, at a retention time of 85 minutes, but yielded a dried material with a
relative weight percentage of 0.6%.

189
Figure 6.4 – HPLC chromatogram of P5M separated with preparative column
The preparative HPLC of P5M was performed using a reverse-phase C-18 Hyperclone column, 250 x 21.1 mm (length x i.d.), 5µm particle size, and an isocratic mobile phase composed of 0.5% (v/v) TFA in water:acetonitrile (85:15 v/v), at a flow rate of 8 ml/ min for the period of 90 minutes. The injection volume was set at 1 ml and the concentration of the sample was 100 mg/ml. The chromatogram was recorded at 254 nm.
12
3
4
56
7
8 9
10
11
0
2
4
6
8
10
0 10 20 30 40 50 60 70 80 90
Ab
sorb
ance
(A
23
2n
m)
Time (min)

190
Table 6.1 – The weight, retention time, and physical appearance fractions from P5M
Group of fractions Retention time (min) Yield % (w/w) Dried fractions
1 (G1) 2 4.4%
2 (G2) 15 6.8%
3 (G3) 17 3.8%
4 (G4) 20 1.6%
5 (G5) 25 1.9%
6 (G6) 29 1.8%
7 (G7) 33 1.5%
8 (G8) 36 0.8%

191
Group of fractions Retention time (min) Yield % (w/w) Dried fractions
9 (G9) 41 0.9%
10 (G10) 46 2.3%
11 (G11) 85 0.1%
6.2.3 Identification of the most active fraction
The next step was performing the bioassay test on all fractions obtained from preparative
HPLC separation to identify the peaks which contained antiplatelet activity. The aggregation
test was performed by monitoring the inhibitory effect on ADP-induced platelet aggregation
with the addition of each of the isolated fraction (G1-G11) at a concentration of 100 µg/ml.
The results from this antiplatelet bioassay revealed that out of the 11 groups of fractions,
only four exhibited inhibitory effects towards platelet aggregate formation. As presented in
Figure 6.5, the fractions that showed antiplatelet activity were G1, G2, G3, and G6.
According to their aggregation traces, the inhibitory potency from the highest to the lowest
order was G2 > G6 > G3 > G1. Furthermore, their antiplatelet efficacy compared to
adenosine is shown in Figure 6.6. The data indicated that G2 and G6 displayed high
inhibitory potency towards platelet aggregation with inhibition potency of 80 ± 3.4% for G2
and 628 ± 7.2% for G6, supported by the fact that their antiplatelet efficacy surpass the
aggregation inhibition demonstrated by adenosine.

192
Figure 6.5 – Aggregation traces of the ADP-induced platelet aggregation with the presence of the active compounds
The traces of platelet aggregation were monitored for 10 minutes after the addition of ADP at a final concentration of 15 µM, with the addition of 100 µg/ml of the isolated fractions: G1, G2, G3, and G6. Each data point was the percentage of the maximum response calculated by comparing it with the maximum response showed by ADP-induced platelet aggregation with the absence of the isolated compounds.
0.00
0.05
0.10
0.15
0.20
0.25
0.30
0.35
0 1 2 3 4 5 6 7 8 9 10
Ab
sorb
ance
at
40
5n
m
Time (min)
ADP only
G1
G2
G3
G6

193
Figure 6.6 – The inhibition potency towards ADP-induced platelet aggregation
Platelet aggregation was monitored for 10 minutes after the addition of ADP at a final concentration of 15 µM, following the addition of 50 µM of adenosine, at 100 µg/ml G1, G2, G3, and G6 into the platelet suspension. Each data point on the graph represents the mean ± SEM of the inhibition percentage from three replicates of the experiment (n=4).
65
51
80
71 62
0
10
20
30
40
50
60
70
80
90
ADENOSINE 50uM G-1 G-2 G-3 G-6
Agg
rega
tio
n in
hib
itio
n (
%)
HPLC Fractions

194
6.3 Discussion
Latif (2005) described the HPLC technique as a robust, versatile, and usually rapid technique
by which compounds from complex mixture can be purified. Accordingly, the use of HPLC, in
analytical and preparative scale, has become a mainstay in the isolation of most classes of
natural products derived from plants. The main differences between HPLC and other kinds
of low-pressure column chromatographic systems are the consistency and size of the
particles in the stationary phase. These factors play a crucial factor in the separation of two
or more natural compounds, which often have closely-related similar properties (Sarker et
al., 2006, Latif, 2005). HPLC is also used for the separation of those classes of natural
products that are non-volatile (e.g. higher terpenoids, phenolics, alkaloids, lipids and sugars
(Harborne, 1998).
The selection of the stationary and mobile phases used in the isolation of natural products
by HPLC usually depends upon the type of compound to be purified. However, the solvent
used in the initial extraction of material from plant are the best guidance for the method
selection and, as such, the polarity of the compound mixture is a major deciding factor as to
which the HPLC method is used (Latif, 2005). The previous data presented in section 5.2
showed that methanolic fraction (P5M) was the most active extract which demonstrated
the antiplatelet activity. The finding indicates that the compounds contained in it, that are
responsible for the antiplatelet activity, might be of polar substances. Solvent extraction is
usually follow the rule of like-dissolve-like, where the solubility of salute-solvents of similar
polarity can be high (Reichardt and Welton, 2011). This information was used as the
baseline for the selection of HPLC separation employed in this study.

195
Between the two HPLC systems, the reverse-phase system is superior in separating a
relatively-polar substances such as, carbohydrates, amino acids, alkaloids, and tannins.
Whereas the application of normal phase HPLC is limited to the separation of water-
insoluble fractions, such as aromatic compounds. Because reverse phase HPLC lends itself
well to the purification of most classes of natural product, it became the technique of choice
when analysing and attempting to purify the complex mixture obtained from plants,
especially when the identity of the compounds of interest is unknown (Latif, 2005).
Moreover, within the natural product research, the reverse-phase octadecyl-bonded silica
(C-18) columns are still widely used for compound isolation and purification (Bucar et al.,
2013).
From the period of 2000-2007, Sticher (2008) reported that methanol-water mixtures were
the most commonly used reverse-phase HPLC mobile phase for the isolation of natural
compounds. Recently, the solvent choice has shifted to mixtures of water-acetonitrile which
are now widely employed in HPLC-based natural products isolation (Bucar et al., 2013).
From the period of 2008-2012, Bucar and co-workers have summarized that more than 50%
of natural products isolation by HPLC separation, published within that period of time, used
an acetonitrile-water mixture instead of methanol-water mixture. The authors reported that
water-acetonitrile mixture, from a ratio range of 75:25 to 0:100 (v/v), has successfully
separated several classes of natural products, including glycosides, lignans, flavonoids,
triterpenes, saponins, and terpenoids, and it is also applicable in the isolation of some
classes of fatty acids (Bucar et al., 2013). Acetonitrile is superior compared to other alcoholic
solvents for HPLC due to its characteristics; low UV cut off point which is an advantage for
UV detection, lower viscosity thus reduces back pressure and often results in slightly better

196
peak shape, and finally stronger elution strength attributed to a low polarity relative to
other alcoholic solvents.
The ionic state of the compounds and the stationary phases are critical for producing
efficient and reproducible chromatography. It is important to supress compound ionization
and to control the degree of ionisation of the free unreacted silanol groups on the outer
surface of the stationary phase. For this purpose, the addition of a small amount of acid can
be a great help in achieving good chromatography separation (ion-pair reagent). Later, the
acid can be easily removed from the collected fraction by freeze drying (Latif, 2005). In this
study, the acid used was triflouroacetic acid at a concentration of 0.5% (v/v).
For the isolation of natural products, analytical and preparative chromatography can be
found in many publication (Sticher, 2008). Analytical HPLC is commonly used at the earlier
stages, prior to the isolation and purification of the active compounds using the preparative
scale. Analytical HPLC produces a chromatographic profile of the extract, which provides
valuable information on the mixture complexity, as well as the estimation of the quantity of
each major peak within the sample. In term of the quantity of the isolated compounds
obtained, the aim of the semi- or preparative HPLC is to produce milligrams of yields for
each species of mixture. Preparative HPLC might be able to isolate micrograms to grams
quantity of compounds, which is necessary for performing biological activity tests (Latif,
2005).
From data presented in this chapter, the analytical HPLC chromatograms has provided an
evidence for the hypothesis described in section 5.3, that several compounds were
selectively extracted and enriched in the 50% (v/v) methanol extract, some of which might
be responsible for the antiplatelet activity. Previous phytochemical studies on Phyllanthus

197
species revealed that the alcoholic extracts are rich in tannins, flavonoids, alkaloids,
reducing sugar, and glycosides (Tripathi et al., 2006, Khatoon et al., 2006). These findings
also correspond to Phyllanthus niruri L phytochemical analysis results produced in this study
(section 3.2.3). Claeson and co-workers (1998) reported that plant extracts yielded from
50% alcoholic solvent extraction are usually rich in ubiquitous polyphenols. In 2007,
Markom and co-workers studied the solvent effect for the extraction and purification
hydrolysable tannins from Phyllanthus niruri L. These authors reported that gallic acid and
ellagic acid concentrations were higher in the water extract, whilst corilagin concentration
decreased with the addition of ethanol in water as the extraction solvents used (Markom et
al., 2007). From the results of analytical HPLC separation of water and ethanolic extracts,
using a reverse-phase C18 colomn and a mixture of acid in water: acetonitrile (8:22 v/v), the
researchers recorded that the hydrolysable tannins eluted from Phyllanthus niruri L extracts,
from the earlier to the last eluted in a following order were gallic acid-corilagin-ellagic acid
(Markom et al., 2007). The elution times of the compounds is mainly determined by their
preference to interact with the solvent used. For example, components containing
carboxylic acid and hydroxyl groups (such as gallic acid) prefer to be eluted by water due to
hydrogen binding between solvent and salute, whilst the presence of ketone and ester
groups within the compounds provides an ability to react with both water and alcohols. The
pre-fractionating step conducted in this study is important for separating the containing
substances in a few fractions of similar properties, in order to reveal the most active fraction
expressing antiplatelet activities. The findings in this study suggested that pre-functionated
step has concentrated the active compounds in P5M, an 80 % (v/v) methanol fraction of the
50%(v/v) extract, and has eliminated some of the inactive substances, which probably
consist of some classes of carbohydrate or aromatic hydrocarbon groups.

198
The optimisation of the solvent system from an HPLC method, as reported by Iizuka and co-
workers (2007), suggested that the isocratic reverse-phase HPLC separation employing a
solvent system containing 0.5%(v/v) TFA in water:acetonitrile (at a ratio of 85:15 v/v)
provides a good separation of Phyllanthus niruri L pre-fractioned extract. The separation
showed fast elution times and sharp- and relatively-symmetrical peaks, using the solvent
system as described above. As the function of separation, rapid elution time and good peaks
resolution are of crucial factors in developing an HPLC system (Snyder et al., 2012).
When the separation is scaled up to preparative HPLC, P5M was resolved into at least 11
distinct groups of fractions according to the peaks showed in the chromatogram, these were
named as G1-G11. Amongst all fractions, G1-3 and G6 demonstrated an ability to inhibit
platelet aggregation and, moreover, G2 and G6 appear to be the most active fractions
expressing antiplatelet effect. Finally, given that every single peak represents the
occurrence of individual compound separated from P5M, the finding has provided a strong
indication of the existence of more than one compound, contained in Phyllanthus niruri L
plant that is responsible for the antiplatelet activity.

Chapter 7Identification of the Active
Compounds

200
7.1 Introduction
The separation of the 50% (v/v) methanolic extract of Phyllanthus niruri L resulted in the
isolation of four compounds, which are able to inhibit in-vitro platelet aggregation. The
isolated compounds, named as G1, G2, G3, and G4, might be the final active compounds
responsible for the antiplatelet activity of Phyllanthus niruri L when the purity level is
sufficient to identify their molecular structure. The evaluation of a substance purity level can
be accomplished by analytical HPLC using a similar column by which the compound was first
separated from the crude extract, with a variable concentration of solvent to separate the
target compound from the possible disconcerting contaminants according to the difference
in column retention. Obtaining the appropriate level of purity is essential for assuring the
biological activity of the potential candidates of the active compounds, as well as for a high
success rate of the molecular structure elucidation. In this chapter, the resulting
chromatogram from analytical HPLC of G1, G2, G3, and G6 will be presented and discussed
accordingly. The data will be accompanied by a series of spectroscopy experiments,
including IR, NMR and MS spectra, aiming at the identification of the compounds
responsible for the antiplatelet activity.
Prior to the determination of their molecular structure, additional assessment is needed to
measure the efficacy of antiplatelet activity, as well as to provide preliminary information on
the possible mode of action of their antiplatelet effects.

201
7.2 Result
7.2.1 Determination of the IC50 of the isolated compounds
The initial antiplatelet bioassays conducted on the isolated compounds has identified G1,
G2, G3, and G6 as the active compounds isolated from Phyllanthus niruri L, which exerted
inhibitory effects on platelet aggregation. Based on the data presented in section 7.2.3,
platelet demonstrated various aggregation response upon ADP stimulation in the presence
of each compound at a dose of 100 µg/ml. This finding has provided a qualitative range of
the antiplatelet activities of the isolated compounds, and their inhibitory potency was
further quantified to show their efficacies as antiplatelet compounds. Additional platelet
aggregation tests were conducted using the same dose of ADP (25 µM) to stimulate the
platelets, in the presence of a series of dose of each compound, which were added into the
platelet suspension prior to ADP stimulation. Subsequently, platelet aggregation was
recorded under continuous agitation for 10 minutes and data recorded at intervals of 1
minute.
The resulting data from platelet aggregation response curves, presented in Figure 7.1 -
Figure 7.4, indicated that the lowest dose expressing the maximum inhibitory response is
shown by the G2 fraction, which completely abolished the ADP-induced aggregation at a
dose of 62.5 µg/ml. At the same dose, G6 also exhibited a prominent inhibitory activity by
halting 77± 14.43% of the aggregation response. Finally, the G3 and G1 expressed a lower
inhibition effects, by inhibiting total platelet aggregation at a dose of 125 and 250 µg/ml,
respectively.
Furthermore, the above data was used to calculate the half maximum inhibitory dose (IC50)
of each compound. The calculated IC50 values are presented in Table 7.1. The data showed a

202
remarkably low IC50 values of G2 (31.91±1.86 µg/ml) and G6 (43.35±6.44 µg/ml), which
confirmed their strength in altering platelet aggregate formation. Among all compounds,
the efficacy of G3 is relatively moderate with an IC50 of 77.68±6.44 µg/ml, whereas the
lowest inhibitory activity was expressed by G1 with an IC50 value of 179.9±2.67 µg/ml.
Considering the complexity of Phyllanthus niruri L constituents which resulted in distinct
separated fractions, it is interesting to re-evaluate the effect of the other fractions towards
platelet aggregation, in order to compare the overall results and obtain the general figures
of their antiplatelet properties. The results are displayed in Figure 7.5, which showed a
range of platelet aggregation responses when 100 µg/ml of each dried fraction were added.
Among all fractions tested, G5 and G7 showed partial inhibitory responses, with a lower
potency compared with that shown by the active compounds (G1, G2, G3, and G6). In the
presence of 100 µg/ml of dried fraction, maximum platelet aggregation responses were
78.57 ± 14.29 % and 92.86 ± 18.90 % for G5 and G7, respectively. Their activity can be due
to the effects of active compounds which present in a lower concentration within these
fractions. Interestingly, the addition of G9 fraction caused an increase on ADP-induced
platelet aggregation formation. In the presence of 100 µg/ml of G2 fraction, the maximum
aggregation response was 150 ± 12.37%. The pro-aggregation effect shown by G9 might be
due to the synergism effects of its containing compounds with ADP. The other fractions (G4,
G8, and G10) showed no inhibitory activity towards ADP stimulation. At the same dose
given, platelet aggregation responses were relatively unaffected by the presence of G4, G8,
and G10.

203
Figure 7.1 – Dose response of G1
Platelet aggregation was induced by addition of 25 µM ADP. The aggregation traces (A) were recorded for 10 minutes to observe the response to G1. The extent of aggregation Inhibition response (B) showed by each given dose was compared with ADP as the positive control. Each data point on the graph represents the mean ± SEM of three replicates of the experiment (n=3).
Figure 7.2 – Dose response of G2
Platelet aggregation was induced by addition of 25 µM ADP. The aggregation traces (A) were recorded for 10 minutes to observe the response to G2. The extent of aggregation Inhibition response (B) showed by each given dose was compared with ADP as the positive control. Each data point on the graph represents the mean ± SEM of three replicates of the experiment (n=3).
0
20
40
60
80
100
Inh
ibit
ion
(%
)
Dose
G1
-0.05
0.00
0.05
0.10
0.15
0.20
0.25
0.30
0.35
0 0.5 1 2 3 4 5 6 7 8 9 10
Ab
sorb
ance
at
40
5n
m
Time (min)
G1
ADP only
7.8 µg/ml
15.6 µg/ml
31.3 µg/ml
62.5 µg/ml
125 µg/ml
250 µg/ml
0
20
40
60
80
100
Inh
ibit
ion
(%
)
Dose
G2
-0.05
0.00
0.05
0.10
0.15
0.20
0.25
0.30
0.35
0 0.5 1 2 3 4 5 6 7 8 9 10
Ab
sorb
ance
at
40
5n
m
Time (min)
G2
ADP only
7.8 µg/ml
15.6 µg/ml
31.3 µg/ml
62.5 µg/ml
125 µg/ml

204
Figure 7.3 – Dose response of G3
Platelet aggregation was induced by addition of 25 µM ADP. The aggregation traces (A) were recorded for 10 minutes to observe the response to G3. The extent of aggregation Inhibition response (B) showed by each given dose was compared with ADP as the positive control. Each data point on the graph represents the mean ± SEM of three replicates of the experiment (n=3).
Figure 7.4 – Dose response of G6
Platelet aggregation was induced by addition of 25 µM ADP. The aggregation traces (A) were recorded for 10 minutes to observe the response to G6. The extent of aggregation Inhibition response (B) showed by each given dose was compared with ADP as the positive control. Each data point on the graph represents the mean ± SEM of three replicates of the experiment (n=3).
0
20
40
60
80
100
Inhi
biti
on (%
)
Dose
G3
0.00
0.05
0.10
0.15
0.20
0.25
0.30
0.35
0 0.5 1 2 3 4 5 6 7 8 9 10
Ab
sorb
ance
at
40
5n
m
Time (min)
G3
ADP only
7.8 µg/ml
15.6 µg/ml
62.5 µg/ml
125 µg/ml
0.00
0.05
0.10
0.15
0.20
0.25
0.30
0.35
0 0.5 1 2 3 4 5 6 7 8 9 10
Ab
sorb
ance
at
40
5n
m
Time (min)
G6
ADP only
7.8 µg/ml
15.6 µg/ml
31.3 µg/ml
62.5 µg/ml
125 µg/ml 0
20
40
60
80
100
Inh
ibit
ion
(%
)
Dose
G6

205
Table 7.1 – Compounds concentration required to inhibit 50% of human platelet aggregation induced by ADP
Fraction
G1 179.90 ± 2.67
G2 31.91 ± 1.86
G3 77.68 ± 6.44
G6 43.35 ± 5.13
IC50 ± SEM (µg/ml)

206
Figure 7.5 – Platelet aggregation response in the presence of the less-active isolated compounds
Platelet aggregation was induced by addition of 25 µM ADP. The traces of aggregation (A) were recorded for 10 minutes to observe the responses to a series of isolated compounds (G4, G5, G7, G8, G9, G10). The maximum aggregation response (B) showed by each given dose was compared with ADP as the positive control. Each data point on the graph represents the mean ± SEM of three replicates of the experiment (n=3).
-0.001
0
0.001
0.002
0.003
0.004
0.005
0.006
0.007
0.008
0 0.5 1 2 3 4 5 6 7 8 9 10
Ab
sorb
ance
at
40
5n
m
Time (min)
ADP
Control -
G4
G5
G7
G8
G9
G10
0
20
40
60
80
100
120
140
160
180
ADP G4 G5 G7 G8 G9 G10
Max
imu
m r
esp
on
se (
%)
Control
A
B

207
7.2.2 Microscopic analysis of platelet aggregates
In order to monitor platelet activation and aggregation responses with and without the
presence of the antiplatelet agents, we observed the occurrence of platelet aggregates
upon a given stimulation, by microscopic observation of aggregating platelets in a giemsa-
stained thin blood film. The blood slide was prepared from a sample of whole blood, before
and after platelet aggregation stimulation. This conventional method provided strong
evidence of discernible platelet activation and aggregation, in addition to being able to show
the quantity of platelet aggregates generated. As a haemostasis surveillance agent, platelets
are highly responsive to even a slight stimulation, hence early platelet aggregation might
occur upon blood withdrawal procedures (e.g. venipuncture and anticoagulant used). Based
on the microscopic observation of fresh platelet preparation as illustrated in Figure 7.6,
untreated platelets might show some signs of platelet activation, which causes platelets to
have irregular shapes with the protrusion of several pseudopodia. However, platelet
population in resting state should be solitary without any sign of platelet aggregates. On the
contrary, after ADP-activation, there was no single platelet can be seen in the blood film,
because all of the platelet populations had attached to each other resulting in the
accumulation of platelet aggregates, as seen in Figure 7.6.
The microscopic observation of whole blood aggregation induced by addition of 25 µM ADP,
after the incubation with each of the isolated compounds, is summarized in Table 7.2. The
result indicated that the presence of G2, G3, and G6 demonstrated a significant alteration of
platelet aggregation, which was evident from the appearance of solitary-inactivated
platelets (> 10 solitary platelets per field of view), within the population of dendritic-form
and activated platelets (as illustrated in Figure 7.7). It was also shown by the decrease in

208
platelet aggregate formation, relative to the ADP-activated as the positive control. Amongst
the compounds tested, G2 was found to strongly inhibit platelet activation in this assay, due
to the relatively high amount of round-shaped platelets seen on the slides. This indicated
that most of the platelets remained in their initial inactive state. The findings confirmed the
previous results from the 96-well plate aggregation assay that G2, G3, and G6 are able to
inhibit platelets from being activated by ADP. This microscopic observation might provide an
indication of the point within the platelet aggregation pathway, by which these active
compounds initiate their inhibitory activity towards platelet aggregation.
In line with the results from the aggregation assays, G1 showed a partial inhibitory effect on
ADP-induced platelet aggregation, as seen in the results in Table 7.2. In the presence of G1,
the formation of platelet aggregate was reduced, however all platelets were still activated
by the addition of ADP, causing the platelets to transform in to dendritic appearance with
long pseudopodia. The latter result suggested that G1 is not effective in the early inhibition
of platelet activation, however it might work on the inhibition of the later events of platelet
aggregation. Nevertheless, the overall data presented in Table 7.2 indicated the treatment
of platelet with the isolated compounds prior to ADP-induced platelet activation shows a
discernible inhibitory effect on platelet aggregation.

209
Figure 7.6 – Thin blood smear of resting and aggregated platelets
Blood slides were prepared before (resting platelets) and after the addition of 25 µM ADP to stimulate whole blood platelet aggregation (aggregated platelets). Platelet populations amongst the resident red blood cells were shown by arrows. Single round platelets were seen in the resting platelets slide. The clumping platelets forming a mass of platelet aggregate was shown in the second slide.

210
Table 7.2 – Microscopic observation of the whole blood platelet aggregation
Platelet morphology Solitary platelet population Platelet aggregates
Untreated All or the platelets have a round shape, some appear with cytoplasmic protrusion
Solitary platelets > 10 platelets per field of view
(-)
ADP Activated Round platelets (-), all of the platelets have the dendritic appearance with long pseudopodia
Clumping as a mass of platelet aggregate, no solitary platelet
All platelets form aggregates
G1-pretreated ADP-activated
All of the platelets appeared in a dendritic appearance, round platelet with cytoplasmic protrusion were not seen (-)
Solitary platelets 1-5 platelets per field of view
(+++)
G2-pretreated ADP-activated
Most of the platelet showed a dendritic appearance with long pseudopodia. Round platelet with cytoplasmic appearance (+++).
Solitary platelets > 10 platelets per field of view
(++)
G3-pretreated ADP-activated
Most of the platelets show a dendritic appearance with long pseudopodia. Round platelet with cytoplasmic appearance (++).
Solitary platelets > 10 platelets per field of view
(++)
G6-pretreated ADP-activated
Most of the platelets show a dendritic appearance with long pseudopodia. Round platelet with cytoplasmic appearance (++).
Solitary platelets > 10 platelets per field of view
(++)
The blood smears were prepared from an untreated whole blood sample which showed the appearance of resting platelet and ADP activated whole blood sample (at a concentration of 25µM) to describe the platelet condition upon activation. For the treated group, a dose of 100 µg/ml of each compound was added into the blood sample prior to the activation with ADP. Continuous agitation was given at 1000 rpm for 10 minutes to ensure that the maximum aggregation level was achieved. The platelet morphology, solitary platelet population, and level of platelet aggregates were observed and compared with the condition of resting and activated platelets.

211
Aggregate size measurement is beneficial in the observation of small platelet clumps,
particularly when a weak agonist such as ADP is employed to induce platelet activation. In
the evaluation of the efficacy of antiplatelet agent, platelet aggregate size might provide
useful information in monitoring their inhibitory effect, for example the ability to alter the
proportion of the aggregates before and after the treatment with the antiplatelet drug. In
this study, the aggregate size evaluation was performed by manually counting all formed
platelet clumps. The platelet aggregate sizes were divided into three categories as described
by Ozaki et al. (1994), which separate them according to the diameter and or the relative
number of the platelets accretion forming the aggregate mass.
The resulting data, presented in Figure 7.7, demonstrated that the medium-sized aggregates
(76±3%) were found to be dominant between the other platelet aggregate population
(15±3% and 9±1% for small- and large-sized platelet aggregates, respectively) generated
upon ADP stimulation. After the treatment with the isolated compounds, the composition of
aggregate population were shifted towards the small-sized aggregates with a slight change
in medium- and large-sized aggregate percentage. The incubation with G2, G3, and G6 has
evidently increased the small-sized aggregate population more than two-times fold to
30±2%, 33±2%, and 40±3%, respectively. Moreover, the decrease of medium-sized
aggregate population is seen, accompanied by the decline of large-sized aggregate
population (Figure 7.7).
This data suggested that the compounds might act in preventing the development of
platelet aggregation and further platelets recruitment after platelet activation, which leads
to the arrest of platelet clumps in the early stage of aggregating.

212
Interestingly, the response to the treatment with G1 was found to have a greater effect
which was shown by a significant decline of medium- and large-sized aggregates,
accompanied by more than threefold rise of small-sized population (49±1%), relative to the
ADP-activated platelets. This finding, in accordance with the previous data, indicates that
the accumulation of aggregate population might be a result from the activation of platelets
by ADP which then failed to proceed to the complete aggregate formation due to the
inhibitory action of G1.

213
Figure 7.7 – The composition of platelet aggregates size after the treatment with the isolated compounds
Platelet aggregation was induced by 25 µM ADP with a continuous shaking at 1000 rpm for 10 minutes. The inhibition was by the treatment of blood sample with 100 µg/ml of G1, G2, G3, or G6. In the graph (above), platelet aggregates were measured and divided into three categories (Ozaki et al., 1994). Each data points represents a mean and SEM of three replicates of samples (n=3). As illustrated in the diagrams of platelet aggregation (below), small-sized aggregates (A) are platelet clumps with diameter less than 20 µm or consist of 3-10 platelets; medium-sized (B) is diameter between 20-100 µm or consist of 10-100 platelets; large-sized aggregates (C) were platelet clumps with diameter larger than 100 µm or consists of more than 100 platelets. The significant difference of each data point from every single group was compared with ADP (*p < 0.001, #p < 0.05).
A B C
15 20 25
0
10
20
30
40
50
60
70
80
90
ADP G1 G2 G3 G6
Agg
rega
tes
size
(%
)
Small
Medium
Large
*
*
*
*
*
*
*
#
*

214
7.2.3 Purity analysis of the isolated compounds
Assessing the purity of a medicinal compound is important in the discovery phase, especially
when one biological effect is claimed as its therapeutic property. After undertaken several
bioassay tests at each stage of extraction, fractionation, and separation procedures, the
efficacy of G1, G2, G3, and G6 are evident in inhibiting platelet aggregation. However, as it
has always been a big challenge to isolate pure substances from a mixture of crude plant
extracts. The purity of the isolated compounds needs to be evaluated before moving
forward in the elucidation of molecular structure and further biological activity tests.
Indeed, the process of identification and characterisation of the molecular structure is
highly influenced by the purity level. To address this, an analysis was performed by
analytical HPLC using the similar parameters by which the compounds were initially isolated,
using an isocratic mobile phase containing 0.5% (v/v) TFA in water:acetonitrile at a ratio of
85:15 (solvent A). For the second analysis, the composition of solvent used was 0.5% (v/v)
TFA in water:acetonitrile at a ratio of 88:12 (solvent B). The resulting HPLC chromatograms
of each compound are shown in Figure 7.8.
The G1 HPLC chromatogram using solvent A showed unresolved peaks with retention times
of 4.02 min (peak 1) and 4.71 min (peak 2). When G1 was eluted with solvent B, two major
peaks were eluted at 5.28 min and 5.71 min. Further peaks analysis using IGOR Pro software
(Wavemetrics, Lake Oswego, OR, USA) indicated that G1 might contain more than one
substance (Figure 7.9), and the major peak purity level was 84.71 to 87.36%. The HPLC
chromatogram of G3 and G6 presented in Figure 7.8 (A) showed that there was one single
peak on each chromatogram, from HPLC elution using solvent A. The finding might have
given a false indication of the purity of G3 and G6, however, when they were analysed using

215
solvent B, the peaks are shown to split into two major peaks. The G3 peaks eluted at 7.1 and
8.76 min, whereas G6 HPLC analysis showed two peaks seen at 6.93 and 7.96 min.
Furthermore, the analysis data in Figure 7.11 and Figure 7.12 suggested that, similar to G1,
the latter compounds might consist of two or more substances, whose separation were
improved when using a lower percentage of acetonitrile. Moreover, amongst other
compounds, the purity of G3 was the poorest as shown by two adjacent peaks that appear
to have a relatively similar abundance (41.68% and 39.52%).
The HPLC analysis of G2 was shown to produce a consistent result. As shown in the
chromatogram in Figure 7.8 (A), one major peak was eluted at 4.81 min preceded by a
smaller contaminant peak. The peak produced by the HPLC analysis was sharp and narrow
when solvent A was used. From the second chromatogram of G2 HPLC analysis using solvent
B, the peak was eluted at 6.43 min, with one small peak at a retention time of 4.71 min. The
separation was found to be improved with the latter solvent system and yielded a slight
increase on the purity of the major peak from 90.21 to 93.03% (Figure 7.10). However the
occurrence of peak broadening might affect the separation result, especially when the
solvent system is to be used for the preparative scale. Finally, the overall data from the
HPLC chromatogram analysis (Figure 7.8-Figure 7.12) showed the occurrence of peak 0 with
considerable variation on its abundance within the isolated compounds. When they were
separated by using solvent A, as shown In G1 chromatogram, the relative amount of peak 0
was 15.29%, in G2 the percentage was 9.79%, while in G6 the relative abundance was
8.23%. The lowest amount of peak 0 was found in G3 which show only 2.45% abundance,
when separated using solvent A. The above data indicated peak 0 as the common
contaminant present within all of the isolated compounds.

216
Figure 7.8 – HPLC chromatograms for of the isolated compounds using different solvent composition
The HPLC column was a reverse-phase C-18 GraceSmart analytical column, 250 mm length x 2.1mm i.d., and 5µm particle diameter. The solvent systems were: (A) an isocratic mobile phase of 0.5%TFA: acetonitrile (88:15), (B) an isocratic mobile phase of 0.5%TFA: acetonitrile (88:12). The flow rate was 0.5ml/min. The chromatograms were recorded at 254 nm for 20 minutes.
5.28
5.71
4.71
4.02
4.81
5.63
6.32
6.43
4.71
7.10
8.76
6.93
7.96
A B
mVolt mVolt

217
Figure 7.9 – G1 HPLC chromatogram analysis
The chromatogram was analysed by IGOR Pro (Gomez et al., 2002) by calculating the best-fit average of each peak (top) for measuring the peak area (bottom). The percentage of each peak area is relative to the total peak is shown in the graph (bottom). The solvent systems were: (A) an isocratic mobile phase of 0.5%TFA: acetonitrile (88:15), (B) an isocratic mobile phase of 0.5%TFA: acetonitrile (88:12).
G1 (Solvent B)
Peak 0 : 5.9%
Peak 1: 6.75%
Peak 2: 87.36%
G1 (Solvent A)
Peak 0: 15.29%
Peak 1: 84.71%

218
Figure 7.10 – G2 HPLC chromatogram analysis
The chromatogram was analysed by IGOR Pro (Gomez et al., 2002) by calculating the best-fit average of each peak (top) for measuring the peak area (bottom). The percentage of each peak area is relative to the total peak are shown in the graph (bottom). The solvent systems were: (A) an isocratic mobile phase of 0.5%TFA: acetonitrile (88:15), (B) an isocratic mobile phase of 0.5%TFA: acetonitrile (88:12).
G2 (Solvent A)
Peak 0 : 9.79%
Peak 1: 90.21%
G2 (Solvent B)
Peak 0 : 6.97%
Peak 1 : 93.03%

219
Figure 7.11 – G3 HPLC chromatogram analysis
The chromatogram was analysed by IGOR Pro (Gomez et al., 2002) by calculating the best-fit average of each peak (top) for measuring the peak area (bottom). The percentage of each peak area is relative to the total peak are shown in the graph (bottom). The solvent systems were: (A) an isocratic mobile phase of 0.5%TFA: acetonitrile (88:15), (B) an isocratic mobile phase of 0.5%TFA: acetonitrile (88:12).
G3 (Solvent A)
Peak 0: 2.45%
Peak 1: 97.55%
G3 (Solvent B)
Peak 0: 6.08%
Peak 1: 4.6%
Peak 2: 41.68%
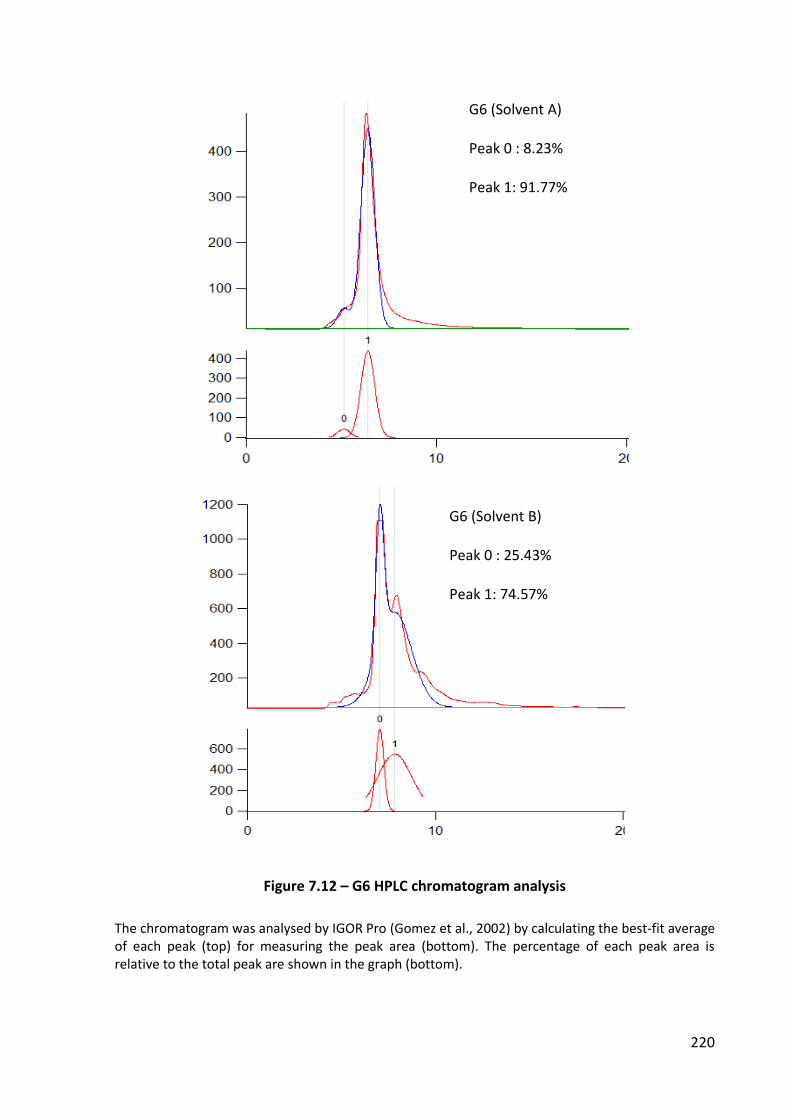
220
Figure 7.12 – G6 HPLC chromatogram analysis
The chromatogram was analysed by IGOR Pro (Gomez et al., 2002) by calculating the best-fit average of each peak (top) for measuring the peak area (bottom). The percentage of each peak area is relative to the total peak are shown in the graph (bottom).
G6 (Solvent A)
Peak 0 : 8.23%
Peak 1: 91.77%
G6 (Solvent B)
Peak 0 : 25.43%
Peak 1: 74.57%

221
7.2.4 Identification of the molecular structure
The structure of the compounds was initially identified by NMR analysis and confirmed by
comparison with spectral data available in the literature. However, due to the low purity
level of G1, G3, and G6, the NMR spectra were difficult to analyse. Hence, making it difficult
to identify the target compounds.
The identification of the molecular structure of G2 was possible, the purity was displayed in
Figure 7.10, and assignment of resonances was based on 1H and 13C 1D and 2D NMR. Based
on the 1D 1H NMR and13C NMR spectra, as well as 2D COSY and HMQC spectra, the
molecular structure of G2 is assigned as [3,5-dihydroxy-2- (3,4,5-trihydroxybenzoyl)oxy-6-[
(3,4,5-trihydroxybenzoyl) oxymethyl] oxan-4-yl] 3,4,5-trihydroxybenzoate, also known as
Corilagin. And its structure is presented in Figure 7.13 . The spectral details and their
assignments on the molecular structure are shown in Figure 7.14 and Figure 7.17. The NMR
data was confirmed by comparison with spectral data available in the literature (Colombo et
al., 2009). The data produced in this study is identical with several reported spectra on
corilagin structural identification. The melting point of G2 was not determined as it did not
reach the melting stage when the temperature given has reached 200 ˚C, which is similar to
what has been stated in several documentations of corilagin’s physical properties. From
mass spectrometry spectra (available in the appendices), the most intense peak recorded at
m/z 634 matches the molecular weight of C27H22O18, thus suggested the compound present
in G2 as corilagin (Nawwar et al., 1994). Finally, as a final confirmation, commercial corilagin
was purchased and used as standard in the analytical HPLC analysis. The comparison
between G2 and the corilagin analytical curve, as presented in Figure 7.18, showed the
identical retention time between the two eluted peaks; 4.79 for G2 and 4.78 for corilagin

222
standard. The linearity of the analytical HPLC result served as a strong evidence of an
identical characteristic of the samples, thus gives a strong validation data for the assignment
of G2 as corilagin.
Figure 7.13 – Structure of corilagin isolated from 50% (v/v) methanol extract of Phyllanthus niruri L
Corilagin molecular structure is C27H22O18 with molecular weight of 634.45 g/mol.

223
Figure 7.14 – Molecular structure identification of G2 based on 1D 1H NMR data
Region on 1H NMR spectrum of G2 is displayed in (A) and the list of the spectra is presented in (B). The assignment of the spectra is shown in (C) (Golotvin et al., 2006)
B
No. Atom Exp. Shift (ppm) Multiplet
1 3 3.86 M12
2 14<''> 3.94 M11
3 23 4.2 M10
4 14<'> 4.25 M09
5 13 4.35 M08
6 4 4.59 M07
7 27 5.77 M06
8 36 5.83 M05
9 2 6.2 M04
10 22 6.49 M03
11 12 6.56 M02
12 42 7.01 M01
13 38 7.01 M01
C
A
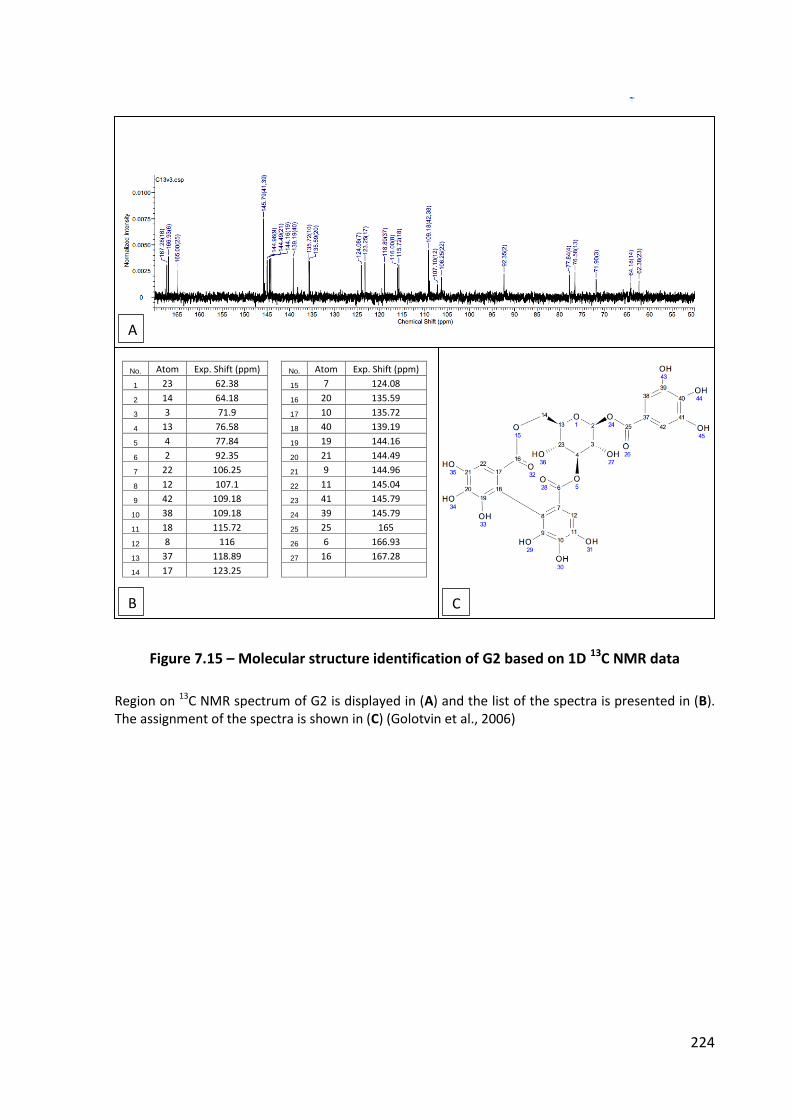
224
Figure 7.15 – Molecular structure identification of G2 based on 1D 13C NMR data
Region on 13C NMR spectrum of G2 is displayed in (A) and the list of the spectra is presented in (B). The assignment of the spectra is shown in (C) (Golotvin et al., 2006)
C
No. Atom Exp. Shift (ppm) No. Atom Exp. Shift (ppm)
1 23 62.38 15 7 124.08
2 14 64.18 16 20 135.59
3 3 71.9 17 10 135.72
4 13 76.58 18 40 139.19
5 4 77.84 19 19 144.16
6 2 92.35 20 21 144.49
7 22 106.25 21 9 144.96
8 12 107.1 22 11 145.04
9 42 109.18 23 41 145.79
10 38 109.18 24 39 145.79
11 18 115.72 25 25 165
12 8 116 26 6 166.93
13 37 118.89 27 16 167.28
14 17 123.25
B
A
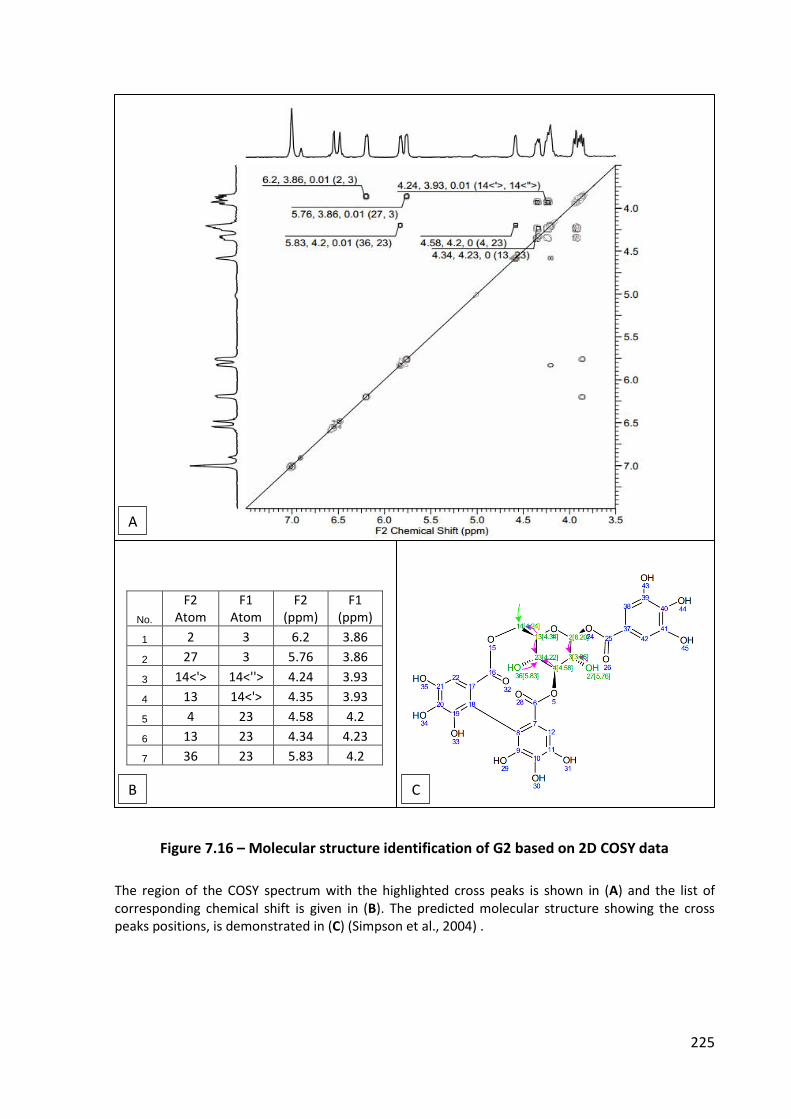
225
Figure 7.16 – Molecular structure identification of G2 based on 2D COSY data
The region of the COSY spectrum with the highlighted cross peaks is shown in (A) and the list of corresponding chemical shift is given in (B). The predicted molecular structure showing the cross peaks positions, is demonstrated in (C) (Simpson et al., 2004) .
No.
F2 Atom
F1 Atom
F2 (ppm)
F1 (ppm)
1 2 3 6.2 3.86
2 27 3 5.76 3.86
3 14<'> 14<''> 4.24 3.93
4 13 14<'> 4.35 3.93
5 4 23 4.58 4.2
6 13 23 4.34 4.23
7 36 23 5.83 4.2
B C
A

226
Figure 7.17 – Molecular structure identification of G2 based on 2D HMQC data
The region of the HMQC spectrum with the highlighted cross peaks are shown in (A) and the list of corresponding chemical shift are given in (B). The predicted molecular structure showing the cross peaks positions, is demonstrated in (C) (Simpson et al., 2004) .
No.
F2 Atom
F1 Atom
F2 (ppm)
F1 (ppm)
1 2 2 6.21 91.91
2 3 3 3.89 70.84
3 4 4 4.6 77.18
4 12 12 6.57 105.73
5 13 13 4.36 75.83
6 14<"> 14 3.95 63.37
7 14<'> 14 4.25 63.59
8 22 22 6.5 105.73
9 23 23 4.22 61.78
10 38 42 7.02 108.67
C B
A
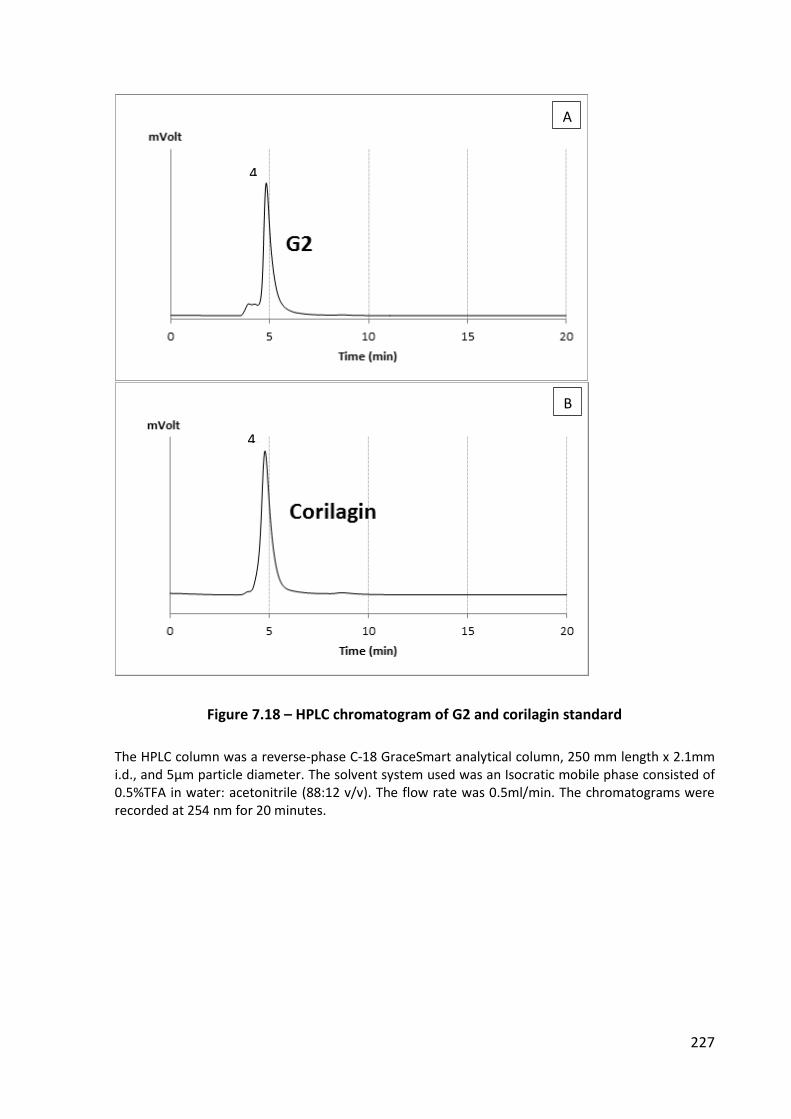
227
Figure 7.18 – HPLC chromatogram of G2 and corilagin standard
The HPLC column was a reverse-phase C-18 GraceSmart analytical column, 250 mm length x 2.1mm i.d., and 5µm particle diameter. The solvent system used was an Isocratic mobile phase consisted of 0.5%TFA in water: acetonitrile (88:12 v/v). The flow rate was 0.5ml/min. The chromatograms were recorded at 254 nm for 20 minutes.
4.
4.
A
B

228
7.3 Discussion
Four fractions were isolated from 50% (v/v) methanol extract of Phyllanthus niruri L, namely
G1,G2, G3 and G6, which showed a profound inhibitory effects on in-vitro platelet
aggregation. The nature of their isolation protocol has indicated the relative high polarity
and hydrophilicity of the compounds. Following an extensive literature review, we have
found several published papers that have mentioned a number of secondary metabolites,
isolated from Phyllanthus niruri L, with demonstrated biological activities that are related to
platelet functions.
One of the main constituents of Phyllanthus niruri L extract are phenolics compounds, which
cover a wide range of plant substances including flavonoids, phenolic acids, and tannins
(Harborne, 1998, De Souza et al., 2002). Phenolic compounds have one or more hydroxyl
groups attached directly to an aromatic ring. Their molecular structures exhibit some
similarities with several key biological effectors and signal molecules, which correspond to
their ability to modulate cellular physiology at the biochemical and molecular levels (Vattem
and Shetty, 2005).
One of the phenolic constituents that ubiquitously occurs in this plant are flavonoid
(Bagalkotkar et al., 2006, Calixto et al., 1998). Flavonoids have been reported to show
inhibitory effect on platelet aggregation, which is suggested to be dependent on the
inhibition of the cyclooxygenase pathway, involving their antioxidant activities that have
previously been extensively studied (Sheu et al., 2004, Pignatelli et al., 2000, Pignatelli et al.,
2006).
Rutin, a flavonol glycoside is a common phenolic secondary metabolites that is known as a
constituent of Phyllanthus niruri L (Bagalkotkar et al., 2006). Rutin has shown the ability to

229
inhibit platelet aggregation induced by collagen, thrombin, and arachidonic acid. In
accordance with collagen-induced platelet aggregation, the inhibitory effect is suggested to
be initiated by inactivation of phospholipase C, leading to the inhibition of protein kinase C
activation and thromboxane A2 formation. Furthermore, rutin also inhibited the
phosphorylation of P47, a major substrate for protein kinase C in platelets, and intracellular
ca2+ mobilisation in collagen-activated platelets (Sheu et al., 2004).
Figure 7.19 –Chemical structure of flavonoids from Phyllanthus niruri L.
Furthermore, catechin and quercetin were also reported as antiplatelet flavonoids, which
were able to inhibit collagen-induced platelet aggregation and platelet adhesion to collagen.
Their effect was significantly greater when they were administrated together as a
combination therapy, thus suggesting the synergism effect among flavonoids. Such
combinations strongly suppressed collagen-induced hydrogen peroxide production, calcium
Rutin
Quercetin
Catechin

230
mobilisation, and 1,2,3-inositol triphosphate formation (Pignatelli et al., 2000). Hydrogen
peroxide is generated during platelet activation induced by collagen which, in turn, may
stimulate platelet aggregation via Ca2+ mobilization (Del Principe et al., 1991). The above
finding indicated that quercetin and catechin inhibited platelet function by virtue of their
antioxidant activity, which was evident from the fact that the inhibition of hydrogen
peroxide production is more significant than its direct inhibition of platelet aggregation.
However, it is postulated that flavonoid inhibitory effect on platelet aggregation is partial, as
it cannot completely inhibit platelet aggregation (Pignatelli et al., 2000). The synergism
effect of quercetin and catechin also effectively reduced platelet recruitment via inhibition
of PKC-dependant NADPH oxidase activation, leading NO-mediated platelet glycoprotein
GPIIb/IIIa down-regulation (Pignatelli et al., 2006). NO produced by stimulated platelet,
modestly inhibited platelet activation but markedly inhibits additional platelet recruitment,
thus explaining its function in the regulation of platelet recruitment into a growing
thrombus. Within the intact blood vessel, NO is produced by vascular endothelial cells and
plays a role in preventing platelet adhesion to the vessel wall, which take place via collagen
receptors (Freedman et al., 1997). Moreover, NO also prevent platelet activation by
selectively inhibiting the expression of platelet surface glycoproteins; P-selectin (alpha-
granule protein), CD63 (lysosomal protein), and the GPIIb-IIIa complex (fibrinogen receptor)
(Michelson et al., 1996) .
However, studies on flavonoid single therapy for preventing platelet aggregation were
found to be contradictory. One study conducted by Janssen et al. (1998) concluded that
quercetin had no effect on ADP-induced platelet aggregation, based on an in-vitro test on
human platelet aggregation. The aggregatory effect shown was dose-dependent and
seemed to show no significant effect in-vivo, when given alone, towards haemostatic

231
parameters upon treatment of animal subject with quercetin (Janssen et al., 1998). In
another study, catechin exhibited a potent inhibitory effect on platelet aggregation
stimulated with ADP, epinephrine, and arachidonic acid, with a dose-dependent manner.
The inhibitory activity was believed to be attributed to catechins ability to protect platelets
from peroxidative stress (Neiva et al., 1999).
Terpenes are also present in Phyllanthus niruri L. The term ‘terpenoid’ covers a range of
plant substances that have common biosynthetic origin, based on the isoprene molecule,
and generally are lipid soluble. Limonene is a known as natural cyclic terpene, and as one of
the aromatic compounds found as a Phyllanthus niruri L constituents. Limonene exhibited
the ability to directly bind to A2A receptor in a selective manner, thus suggested its role as a
ligand and agonist for adenosine A2A receptors. In addition, limonene was found to elicit
concurrent metabolic changes after the activation of a signalling pathway mediated A2A
receptor, including the upsurge of cytosolic cAMP concentration, protein kinase A
activation, and the rise of cytosolic calcium concentration (Park et al., 2011). The platelet
surface is rich in adenosine A2A receptors and their activation results in the accumulation of
cAMP, which is responsible for preventing excessive platelet activation, in response to
various stimuli, including ADP and collagen (Haskó et al., 2008). In addition, p-cymene,
another terpene occurring in Phyllanthus niruri L has been reported to express some
cardiovascular effects based on an in-vivo animal study, although it produced no significant
inhibition of ADP-induced platelet-aggregation (EH et al., 2003). Lupeol, showed anti-
arthritic activity and also maintenance of platelet count number in arthritic rat, which
suggested its protective effect on platelets (Saratha and Subramanian, 2012).

232
Figure 7.20 – Chemical structure of terpenenes from Phylanthus niruri L.
Recently, methyl brevifolincarboxylate, a coumarin derivative isolated from the leaves of
Phyllanthus niruri L, was the first active compounds derived from Phyllanthus niruri L, which
has been reported to show an inhibitory effect on ADP-induced platelet aggregation. The
activity was stated to be attributable to a decrease in Ca2+ concentration in platelets,
however the absolute mode of action is remain unclear (Iizuka et al., 2007). Based on the
above study, this compound has been listed on the database of Chemical Entities of
Biological Interest (ChEBI) as one of the chemical entities act as platelet aggregation
inhibitor (Hastings et al., 2013).
Some lignans from Phyllanthus niruri L were reported to act as an antagonist for platelet
activating factor (PAF), which has been considered as the mode of action by which they
exhibit the anti-inflammatory response (Bagalkotkar et al., 2006). Niranthin, isolated from
this plant, showed a significant inhibitory effect on PAF-induced paw enema formation in
mice and selectively reduced PAF binding to its receptors (Kassuya et al., 2006). Platelet
activating factor (PAF) is a lipid mediator that is known for its ability to cause platelet
aggregation through its binding with the specific receptors, platelet activating factor
receptor (PAFR), which abundantly present on the surface of platelets. To aid its aggregation
inducer effects, the administration of PAF antagonist has shown a specific inhibition effect
Limonene p-Cymene Lupeol

233
on PAF-induced platelet aggregation in rabbit platelet suspension (Terashita et al., 1983).
Therefore, providing evidence that niranthin might alter PAF binding to its receptors on the
platelet surface, this might also be one of the possible compounds responsible for
Phyllanthus niruri L antiplatelet activity.
Figure 7.21 – Chemical structure of niranthin and methyl brevifolincarboxylate
To conclude, some of phenolics and terpenes which naturally occur as secondary
metabolites of Phyllanthus niruri L have demonstrated activity in inhibiting platelet
aggregation, based on a number of previously published reports. Before the final elucidation
of the definite molecular structures, we may speculate that the isolated compounds
possessing the antiplatelet effect presented in this study, might fall into one or both classes
of phytochemicals. However, according to the nature of their extraction and isolation
procedure, it is more likely that G1, G2, G3, and G6 are one of the phenolic compounds
which are relatively water-soluble and hydrophilic.
Surprisingly, we found that in the presence of G9, platelet aggregation responses surpassed
the effect of that seen when ADP is administrated alone. This finding is parallel to one study
by Cliffton et al. (1965) that reported ellagic acid, as one of a well-known constituents of
Niranthin Methyl brevifolincarboxylate

234
Phyllanthus niruri L, which showed a disparate influence towards platelet aggregation.
Ellagic acid expressed thrombogenic effects, presumably by activating coagulation factor XII
which is also known as Hageman factor, leading to the activation of the coagulation cascade
via the intrinsic pathway (Cliffton et al., 1965). Intravenous administration of ellagic acid was
reported to induce in-vivo platelet stimulation, eliciting a decline in the level of plasma
fibrinogen, reduction in platelet numbers, and an increase of the activated partial
thromboplastin time (Damas and Remacle-Volon, 1987). In addition, several phenolic
compounds, including geraniin, corilagin, and gallic acid, exhibited the ability of NO
scavenging activity which is mainly due to the presence of free hydroxyl group. As
mentioned earlier, NO has weak antiplatelet activity through the modulation of platelet
recruitment and alteration of platelets adhesion. Therefore, such may be the underlying
mechanism of platelet aggregation stimulation caused by phenolic compounds. Although
the present preliminary screening did not provide additional information on all possible
modes of action, the finding might indicate that G9 can be the platelet-agonist naturally
present in Phyllanthus niruri L, which is most likely to be of the phenolic family of
compounds.
Antiplatelet activity of plant derived natural compounds is defined as being of high potency
when the maximal inhibitory response is achieved at a relatively low concentration.
Moriyama and co-workers (2009) stipulated that when an isolated fraction of plant extract
expressed maximal inhibitory effect at a dose range of 70-130 µg/ml, it can be considered as
an effective antiplatelet compound. This present study exposed that G2 and G6 elicited their
maximal response at a dose of 62.5 µg/ml that, according to Moriyama et al. (2009), can be
classified as highly potent inhibitory effect. The G3, which showed its maximal response at a
dose of 125 µg/ml, is considered as an effective agent for inhibiting platelet aggregation.

235
Finally, G1 demonstrated maximal inhibitory effect at a higher dose, 250 µg/ml, hence
suggested G1 as a weak antiplatelet compound.
Figure 7.22 – Chemical structure of geraniin, ellagic acid, and gallic acid.
The inhibitory patterns of each fraction are shown in Table and Figure 7.7. Manual
macroscopic observation recorded that, in common, all treated ADP-activated platelet
demonstrated a decrease on total platelet clumps deposit, which clearly verified the
inhibitory effect. In accordance with the potency of each compound, G2 was perceived to
greatly prevent platelet activation and further platelet aggregation, evident from the
abundance of solitary activated-platelets, in addition to the frequent number of residing
resting platelets. Moreover, G3 and G6 treatments demonstrated comparable inhibitory
effect, however the majority singled-populated platelet were already being activated rather
than remain in the resting state. Furthermore, the weak effects of G1 could be seen from
Gallic acid
Geraniin
Ellagic acid

236
the occurrence of highly activated platelets displaying dendritic shape with extensive
pseudopodia, in addition to the absence of solitary platelets.
Following platelet stimulation, the development of platelet aggregates is largely influenced
by the recruitment of neighbouring platelets onto the activated and primarily-aggregated
platelets, linked together via fibrinogen bridging through the activation of GPIIb/IIIa as the
main receptor of fibrinogen. This event can be inhibited by such mechanism where the
receptor affinity towards fibrinogen is affected or the expression of the receptors on the
platelet surface upon platelet activation is reduced. The data presented on Figure 7.7
showed that, macroscopically, G2, G3, and G6 inhibited platelet aggregate development,
after platelet aggregation stimulation by ADP. This finding is marked by the high number of
solitary activated-platelets, relative to resting platelet, in addition to the decrease of
medium- and large-sized platelet aggregates formation. Accordingly, the effect might
indicate that the alteration of GPIIb/IIIa function to recruit and link the platelets together is
affected by the presence of the compounds. One early assumption can be made that the
effect might correspond to the inhibition of cyclooxygenase pathway as demonstrated by a
number of plant-derived natural flavonoids, which is as one of the main constituent of
Phyllanthus niruri L secondary metabolites. It has been proposed that rutin, quercetin, and
catechin serve their antiplatelet activity through the inhibition of thromboxane A2 synthesis
resulting from the inactivation of PKC enzyme, leading to NO-mediated GPIIb/IIIa down-
regulation (Sheu et al., 2004, Pignatelli et al., 2000, Pignatelli et al., 2006). The overall events
hamper ADP-activated platelets recruitment and inhibit the development of larger platelet
clumps.

237
Moreover, the synergy effect of flavonoid combinations that effectively reduce platelet
recruitment, but are partially effective in inhibiting platelet aggregation is reported by
Pignatelli et al. (2000). This might provide an explanation of the antiplatelet activity shown
by impure fractions; G1, G3, and G6. The effect of G1 on platelet aggregate demonstrated
that small-sized and medium-sized aggregates were significantly decreased, indicated that
the modest inhibitory effect is most likely due to the inhibition of platelet aggregation
without significant alteration of platelet activation by ADP.
The Isolation and purification of pure natural substances are problematic and has been the
bottleneck of the overall process of the discovery of medicinal active compounds, attributed
to the complexity of the naturally-occurring secondary metabolites in plants. Very often in
small-scale natural product isolation, an exhausting and time-consuming separation and
purification process occurs that, at the end, yields a small amount of compound with
relatively low levels of purity. Jaki and co-workers (2008) investigated the purity-activity
relationships of natural products and suggested that at a purity level above 90%, the
biological activity is relatively constant without significant interference effect from the
disconcerting contaminants. The presented analytical HPLC data showed that amongst all of
the active compounds, G2 purity range was 90.21 to 93.03% , thus indicated that the
antiplatelet effect was probably solely due to the compound’s ability to suppress platelet
activation and aggregation. When purity is less than 90%, there is a reasonable possibility of
the interactions between one or more existing component. In this case we might not be able
to conclude whether the final antiplatelet effects demonstrated by G1, G3, and G6 arose
from synergism or the antagonism effect of the containing materials.

238
The structure of G2 was identified on the basis of its NMR and MS spectra, in comparison
with data available in the literature (Jikai et al., 2002). From the 1H NMR spectrum, 13
proton resonances were assigned, which consisted of four aromatic protons (6.5-7.1 ppm)
and nine aliphatic protons (3.5-6.5 ppm). The 13C NMR spectrum exhibited 27 carbon
resonances, including six aliphatic carbons in the region from 60 to 95 ppm and 18 aromatic
carbons in the region from 100-150 ppm. This data indicated that G2 contained three
aromatic rings, one glucose moiety and a highly oxygenated carbon skeleton. By taking the
connectivity of 2D COSY and HMQC spectra into account, in addition to the MS spectra that
showed molecular ions at m/z 657[M+Na]+ and 633[M-H]- inferring to molecular weight of
634, the identity of G2 was corilagin, with the molecular formula of C27H22O18 was proven
(Jikai et al., 2002). According to HPLC analysis, the compound present in a purity > 93%
compared to the standard compound.
Corilagin, also known as beta-1-O-galloyl-3,6- (R)-hexahydroxydiphenoyl-D-glucose, is one of
the novel hydrolysable tannins, which has been found in a number of medicinal plants,
including in Phyllanthus niruri L (Markom et al., 2007, Colombo et al., 2009, Ishimaru et al.,
1992). The biological activities of the corilagin isolated from a diversity of medicinal plants,
has been reported in many literatures. Its pharmacological properties encompass a range of
therapeutic effects including anti-inflammatory (Okabe et al., 2001, Dong et al., 2010, Zhao
et al., 2008, Gambari et al., 2012), anti-oxidative (Kinoshita et al., 2007), anti-cancer (LU et
al., 2005, Hau et al., 2010, Ming et al., 2013), and hepatoprotective (Kinoshita et al., 2007).
With regards to its activity on cardiovascular system, there is only a limited published report
available to date, particularly in accordance with its inhibitory effect on platelet aggregation.
In 1995, Cheng and co-workers reported the antihypertensive effect of corilagin in the
spontaneous hypertensive rat. They suggested the role of the reduction of noradrenalin

239
release or direct vasorelaxation, as its mode of action in lowering rat blood pressure. Years
later, in the investigation for anti-thrombotic agents, Chinese traditional medicine
researchers were the first to investigate corilagin activity on rat carotid artery patency
status. The result indicated that corilagin, in dose-dependent manner, inhibited type 1
plasminogen activator inhibitor (PAI-1) in rat plasma or platelet related substances, and also
increase tissue-type plasminogen activator (tPA) (Shen et al., 2003) . One year later, the
same research group tested a fraction, containing 60% corilagin from Phyllanthus urinaria,
towards thrombosis and coagulation system in rat. The result showed that the fraction
reduced the relative weight of thrombus generated in the rat vena cava, which was
suggested owing to the suppression of activated platelets binding to neutrophils (Shen et
al., 2004). Although the antithrombotic activity might not be merely from corilagin, due to
the level of impurity it contains. Corilagin’s role in hampering platelets-leukocytes adhesion
were further reported by (Hongxiang et al., 2009), in addition to its anti-oxidant properties
(Zhao et al., 2008), which has been discussed as the underlying mechanisms for corilagin in
preventing the progress of atherosclerosis (Duan et al., 2005). Recently, from a study in rat
arterial thrombosis, Hongxiang et al. (2009) was the first to disclose corilagin activity in
inhibiting ADP- or PAF-induced platelet aggregation in a concentration dependant manner,
with the IC50 of 115.6 and 264.8 µM, respectively. Although, a contradictive result was
reported previously by Shen et al. (2003) that corilagin had no influence on rabbit platelet
aggregation.
Altogether, the above findings have given an indication of corilagin as cardiovascular
protective agent by the antihypertensive, anti-thrombotic, as well as the antiplatelet effects
(WeiGang et al., 2008). Nevertheless, the above evidences still have some restraints as,
firstly, all experiments were based on animal-studies without further verification on human-

240
based laboratory tests and, secondly, the natural sources from which the corilagin was
isolated, were not clearly stated. Consequently, the variations on the subject of the
experiments and the source of the tested compounds might result in the deviation of the
end result. For example, the conflicting effect of corilagin towards platelet aggregation.
In this present study, corilagin was isolated from the separation of methanolic extract of
Phyllanthus niruri L, through a multistep extraction procedure of fractionation and
separation procedures, guided by platelet aggregation test using human platelet. As the
result, corilagin, with the purity level of 93.03%, have shown a strong potency in inhibiting
in-vitro ADP-induced human-platelet aggregation with the IC50 of 31.91 µg/ml (or 50 µM). In
comparison with the previously reported data, our results have demonstrated a coherent
finding by the virtue of bioassay-guided isolation protocols, and verified the antiplatelet
effect of corilagin. Therefore, to our knowledge, this present study was the first to discover
the activity of corilagin isolated from Phyllanthus niruri L activity as a potent antiplatelet
agent, based on an in-vitro human platelet aggregation test.

Chapter 8Elucidation of the Mechanism
of Action of Corilagin as Antiplatelet Agent
242
8.1 Introduction
Corilagin, an ellagitanin isolated from the methanolic extract of Phyllanthus niruri L, has
demonstrated a significant inhibitory activity towards human platelet aggregation, which
was verified by a series of data presented in the previous chapters. The finding has provided
a strong indication of the efficacy of this natural compound as a new source of antiplatelet
agents. Furthermore, it is essential to uncover the fundamental basis of the inhibitory
mechanism, by which corilagin affects the platelet function. Accordingly, further
experimental tests were conducted, aiming at the elucidation of the mechanism of action of
corilagin in inhibiting ADP-induced platelet aggregation. The study in this chapter is
essentially in two parts: first, the evaluation of the involvement of platelet membrane
receptors and, secondly, the proteomics study to observe platelet proteins alteration during
platelet aggregation activation/inhibition events.
Platelet surface receptors cover a number of membrane glycoproteins, which are crucial in
the platelet activation cascade, leading to platelet aggregation to form the primary platelet
plug (George, 2000). Glycoprotein IIIa, also known as CD61, is one of the major platelet
membrane receptors that ubiquitously presents in resting platelet. Accordingly, it has been
widely used as platelet marker in flow-cytometry based platelet studies. CD61 is a 90-110
kDa member of the beta integrin family, which binds non-covalently with the alpha integrin
CD41, to form GPIIb/IIIa (CD41/CD61) upon platelet activation. In this study, the observation
of GPIIIa was made by capturing this membrane protein using a CD61 monoclonal antibody.
Furthermore, to evaluate the involvement of platelet membrane receptor in the inhibitory
mechanism of corilagin towards platelet activation, PAC-1 and CD62P were used. PAC-1
specifically recognises the GPIIb/IIIa complex on the activated platelet, which appears at an

243
approximate number of 45,000 to 50,000 receptors on the surface upon activation. The
alteration of PAC-1 expression on the activated-platelet surface provides an indication of
the involvement of GPIIb/IIIa inhibition during platelet activation. The analysis of CD62P
expression was conducted to identify corilagin’s effect on platelet granule secretion. CD62P
monoclonal antibody reacts with 140 kDa platelet adhesion membrane glycoprotein
receptor, P-selectin, which is stored in the platelets alpha-granules and rapidly transported
to the plasma membrane following platelet activation (Stenberg et al., 1985a).
Platelet activation and the aggregation cascade encompass a wide range of platelet proteins
alterations. This study comprehensively describes the proteins involved in the platelet
functions, which are affected by the addition of corilagin upon ADP-induced platelet
aggregation. To do so, a proteomics approach was used including 2D gel electrophoresis and
label-free LC MS/MS platelet proteins analysis. The 2D electrophoresis was performed to
visually separate platelet proteins, in order to gain a comparison of protein level between
the samples. The LC MS/MS quantitative analysis was conducted using a free-label protein
quantification method, followed by platelet signalling pathway analysis using a web-based
PANTHER and REACTOME pathway analysis tools. Finally, the ultimate goal of this chapter is
aiming at identifying the potential target proteins for corilagin in inhibiting platelet
aggregation, which is required to strengthen the corilagin pharmacological activity as a
natural-sourced antiplatelet agent.

244
8.2 Result
8.2.1 Inhibitory response towards different platelet stimulation
In the previous section, corilagin was shown to have a strong potency as an inhibitor ADP-
induced platelet stimulation. As a result, the evaluation of corilagin’s inhibitory effects on
platelet aggregation following different agonist stimulation is necessary in order to further
determine the mechanism of action of the inhibitory response. Platelet aggregation tests,
induced by difference agonists, were conducted with and without the presence of corilagin
at dose of 100 µg/ml. The doses of each agonist were 62.5 µg/ml collagen, 1 NIH U/ml
thrombin, 250 µg/ml arachidonic acid (AA), and 5µM epinephrine. Figure 8.1 shows the
corilagin effects on platelet aggregation induced by various agonists. The result
demonstrated that corilagin exhibited inhibitory effects on platelet aggregate formation,
regardless the agonist used to induce platelet aggregation. The inhibitory potency of
corilagin, from the strongest to the weakest, in the following order AA – thrombin –
epinephrine – collagen.

245
Figure 8.1 – Inhibition effect of corilagin on of platelet aggregation induced by various agonists
The bars in the graph shows the maximum platelet aggregation response stimulated by agonists only (A) or in the presence of corilagin at a concentration of 100ug/ml (B). The agonists used for inducing platelet aggregation were in a concentration of 62.5 µg/ml collagen, 1 NIH U/ml thrombin, 250 µg/ml arachidonic acid, and 5µM epinephrine. Each data point on the graph represents the mean ± SEM of three replicates of the experiment (n=3). The significant difference between each group and the corresponding control group is shown by (*) for p < 0.05 and (**) p < 0.01.
8.2.2 Analysis of CD61 expression in the presence of corilagin
Prior to the analysis, a gating strategy was employed to determine the platelet population in
the samples, as shown in Figure 60. Initially, unstained resting platelets from whole blood
sample were analysed using flow cytometry, to visualise the area where platelet population
was located within the cytograms (Figure 8.2-A). A similar approach of was used for purified
platelets used, as shown in Figure 8.2-B.
To observe the ubiquitous platelet surface marker expression in the event of the inhibition
of ADP-induced platelet aggregation by corilagin, a simultaneous analysis of CD61
expression in the isolated platelet samples obtained from resting, ADP-activated, and
corilagin-treated ADP-activated platelets was performed. As presented in Figure 8.3 (A), the
result demonstrated a significant difference between CD61 expression on resting and ADP-
activated platelets. In resting conditions, the platelet population tends to express a high
A B
Arachidonic Acid
**
0
10
20
30
40
50
60
A B
Max
imu
m r
esp
on
se (
%)
Thrombin
*
A B
Collagen
A B
Epinephrine

246
quantity of the CD61 positive platelets (91.4 ± 2.1%), whereas ADP-activated platelets
demonstrated a deterioration of the receptor expression (33.6 ± 6.1%) with more than half
of platelet population devoid of all measurable CD61 expression. CD61, also known as
integrin β3 (GPIIIa), is a 105 kDa transmembrane platelet glycoprotein. GPIIIa foms a
GPIIb/IIIa complex, in association with GPIIb, which facilitates platelet adhesion and
aggregation following platelet activation by ADP. GPIIb/IIIa complex reacts with fibrinogen,
vWF and thrombospondin, thus play a crucial role for the development of platelet
aggregate. The reduction in CD61 expression on the activated platelets is associated with
the formation and activation of GPIIb/IIIa complex on the surface of stimulated platelets,
which is dependant to the extracellular calcium concentration (Shattil et al., 1985). The
presence of corilagin halted the loss of platelet surface CD61 expression following ADP-
induced platelet activation (the percentage of platelets with CD61 (+) is 51.5 ± 9.5%), as
shown in the graph presented in Figure 8.3 (B).

247
Figure 8.2 – An illustration of gating strategy to show platelets population in flow cytometry
Resting platelets analysis in flow cytometry using forward (FSC) and side (SSC) scatter approach. Unstained whole blood (Top figure) showing platelet population (A), by employing logarithmic scale on FSC and SSC, is used to separate platelets and RBC/WBC populations (2). For the analysis of platelet membrane glycoproteins upon ADP activation with/without the presence of Corilagin, isolated platelets are used. The gating strategy is presented in the second figure (B) which shows a relatively pure platelet population (3).
FSC-log
3
1
2
A
B

248
Figure 8.3 – Surface antigen CD61 expression
The expression of platelet marker CD61 in resting platelet is illustrated in figure (A) showing two populations of platelets with a negative and positive CD61 expression, noted as population 1 and 2 respectively. Figure (B) presents the changes of the proportion of cells with CD61 expression upon platelet activation induced by ADP with and without the presence of Corilagin. The statistical analysis is performed by two-way ANOVA test with Bonferroni’s correction to compare the treated samples to resting platelets. The P value for (**) is < 0.001, and for (*) is <0.01.
FSC
-lo
g
CD61 PEA
1 2
CD61
(-)
CD61
(+)
0
20
40
60
80
100
RestingADPCorilagin-ADP
**
**
**
Pla
tele
t p
op
ula
tio
n (
%)
A
B

249
8.2.3 Analysis of platelet activation markers in the presence of corilagin
PAC-1 and CD62P expressions on platelets surface were analysed to evaluate corilagin’s
effects on ADP-activated platelets. PAC-1 specifically recognises the activated GPIIb/IIIa
complex on the surface of stimulated platelet. CD62P is known as platelet P-selectin, a
platelet surface protein that is released from platelet granules following platelet activation
and aggregation. Flow cytometry analysis on these platelet activation markers are shown in
Figure 8.4 and Figure 8.5. The results showed that resting platelets lack the expression of
these activation markers, evident from a platelet population showing PAC1 (-) and CD62P (-)
expression of 91.8 ± 1.6%. Following ADP-activation, a significant rise in PAC-1 and CD62P
expression occurred, from only 1.0 ± 0.8% on resting platelets to 29.6 ± 8.1% on ADP-
activated platelets. As shown in data from Figure 8.5, platelet population expressing PAC-1
(+) and CD62P (+) was halted by the presence of corilagin, which reduced the percentage to
13.0 ±7.6%. This the finding provides an initial indication of the possible involvement of
GPIIb/IIIa inhibition in the overall mechanism of antiplatelet effects attributed to corilagin.
Interestingly, when the analysis is expanded towards CD62P expression, an aberrant effect
caused by corilagin was observed. In the presence of corilagin, ADP-activated platelets tend
to express high population of platelets with PAC-1(+) and CD62P (-) as shown in region LR
and a lower percentage of PAC-1 (-) and CD62P (+) as shown in region UL (Figure 8.5). The
data presented here demonstrated that corilagin diminished CD62P expression on ADP-
activated platelets. Given that CD62P on the platelet surface is present as a result of the
secretion of platelet granules, it is suggested that corilagin inhibits the increase of CD62P by
the inhibition of the release of granule contents, particularly the dense granules in which a
majority of the P-selectin is stored.

250
Upon platelet activation by ADP stimulation, the expression of CD61 as the marker for β
subunit of GPIIb/IIIa receptors in platelet surfaces was diminished, accompanied by a
significant increase of the total PAC-1 (GPIIb/IIIa complex) expression (the percentage of
CD61 and total PAC-1 expression are 33.6 ± 6.1% and 49.7 ± 6.7%, respectively). The
addition of corilagin prior to ADP activation caused an increase in CD61 expression up to
51.5 ± 9.5%. However, the flow cytometry analysis showed total PAC-1 expression on ADP-
activated platelet surface was not affected by corilagin (44.8 ± 7.8%). In overall, the results
indicated that corilagin has no significant inhibitory effects on the initial activation of
GPIIb/IIIa complex. Nevertheles, from the resulted data, corilagin activities on ADP-activated
platelet probably involve the inhibition of platelet release reaction and platelet aggregation
amplification that, in turn, prevents further development of platelet aggregate.

251
Figure 8.4 – Two parameter flow cytometry analysis of PAC-1 and CD62P expression
The gating strategy is employed to determine the expression of platelet activation markers PAC-1 and CD62P. Four quadrant regions are displayed; (UL) is the region of platelets with PAC-1 (-) and CD62P (+), (LL) representing platelet population with PAC-1 (-) and CD62P (-), (LR) is the region of platelet population with PAC-1 (+) and CD62 (-), and (UR) representing platelet population with PAC-1 (+) and CD62P (+).
PAC-1 FITC
PAC-1 FITC
PAC-1 FITC
CD
62
P A
PC
Resting
ADP
Corilagin-ADP

252
Figure 8.5 – The comparison of the expression of PAC-1 and CD62P.
The statistical analysis is performed by two-way ANOVA test with Bonferroni’s correction to compare the treated samples with resting platelets. The P value for (**) is < 0.001, and for (*) is <0.01.
PAC-1
(-),
CD62
P (+)
PAC-1
(+),
CD62
P (+
)
PAC-1
(-),
CD62
P (-)
PAC-1
(+),
CD62
P (-
)
0
20
40
60
80
100
RestingADPCorilagin-ADP
**
**
**
*
Pla
tele
t p
op
ula
tio
n (
%)

253
8.2.4 Analysis of platelet proteome by 2D gel electrophoresis
Following the initial observations of corilagin activity on the platelet membrane
glycoproteins, the study was further expanded towards the analysis of the platelet
proteome to reveal proteomics alteration during the inhibitory mechanism. The initial
mechanistic observations were made from 2D SDS PAGE gel (pI 3-10 region) analysis of the
platelet proteome under three different condition ; resting, ADP-activated, and ADP-
activated in the presence of corilagin. The experiment produced nine gels of three replicate
for each group of platelet protein samples as illustrated in Figure 8.6.
All spots showed in the 2D gels were identified and analysed by imageJ software, according
to a procedure described by Natale (2011). All scanned gels images were aligned and
normalised using bUnwarpJ plugin to solve the problem of spatial distortion and due to run-
time differences and dye-front deformation. The detection of the spots was performed by
the Watershed plugin provided in imageJ software, on the inverted grayscale gel images
which contained bright particles on dark background. To prevent over-segmentation, due to
the noise, the images were filtered by using 3.0 radius Gaussian blurring. The parameters
used for the watershed were 4 directions diagonal connectivity, and a range of grayscale
value from 0 to 230, with object/background binary display. The analysis detected 462 spots
that were labelled as presented in Figure 8.7 (top figure). The volume of each spot was
analysed and measured as a function of spot density, which then normalised by dividing by
the total volume of all spots on the corresponding image.
The results of 2D gel analysis demonstrated that, in the presence of corilagin upon ADP-
activation, 24 protein spots showed a lower density compared with that seen in ADP-
activated platelet protein samples (the differential spots are shown as red spots in the

254
bottom image on Figure 8.7 ). Furthermore, the result showed three protein spots that
expressed a higher density, on ADP-activated platelet proteome in the presence of corilagin
(shown as green spots on Figure 8.7). Among all of these differential proteins, most of them
were found within the pI range of 4 to 7, this is the typical range of where platelet proteins
have been identified so far (García et al., 2004)

255
Figure 8.6 – Image of 2D SDS PAGE electrophoresis of platelet proteins in different condition; resting, ADP-activated, and corilagin-treated ADP activated.
pH
Mo
lecu
lar
wei
ght
(kD
a)
Resting
ADP
Corilagin-ADP

256
Figure 8.7 – 2D gel electrophoresis analysis
2D gel figures shows the identified spots. The red and green marked spots related to the proteins which shows a decrease and increase of intensities visualised on the 2D gels, when the platelets are treated with Corilagin before ADP stimulation. The analysis was performed using imageJ software according to the protocol described by Natale (2011). Quantitative comparison of spot intensities was calculated by ANOVA test with p value < 0.05. Expression profile as a function of spot density volume and their standard deviations for (A) resting platelets, (B) ADP-activated platelets, and (C) ADP-activated platelets with the presence of Corilagin, are illustrated on the inset figures. Gel areas containing the same spot from each group are shown below the density volume values.
pH
Mo
lecu
lar
wei
ght
(kD
a)
1
2
3
4
5
6 7
8
9 10
11 12
13
14 15
16 17 18
19
20
21
22 23
24 25 26
A B C
Spot 15
A B C
Spot 3

257
The identification of the differential spots was performed according to the procedure
described by Lemkin and Thornwall (1999). The molecular weight (MW) and pI of each spot
were matched with the 2D electrophoretic gels reference map of human proteome from
SWISS-2DPAGE. From the analysis, 21 differential proteins were tentatively identified as
listed in Appendix 4. The identified proteins were next used as the data input for pathway
analysis using Reactome pathway database to discover the pathways in which the proteins
are most likely involved. Rectome pathway analysis of the identified differential proteins
showed four proteins, out of 21 proteins, were explicitly involved in platelet activation and
aggregation pathway. Interestingly, the pathway analysis results suggested that corilagin’s
action in inhibiting platelet signalling includes the alteration of the platelet degranulation
pathway and the inhibition of cytoplasmic Ca2+ intake. This finding provides a hint to the
possible route of corilagin activity in inhibiting platelet aggregation, which possibly
correlates with the inhibition of platelet secretion and calcium pathway, as illustrated in
Figure 8.8.
Table 8.1 – Pathway analysis 2D gels
Pathway name Total protein
Protein population
P value
FDR
Platelet activation, signalling and aggregation
4 2% < 0.001
2 %
Platelet degranulation 4 5% < 0.001
< 1 %
Response to elevated platelet cytosolic Ca2+
4 5% < 0.001
< 1 %

258
Figure 8.8 – Response to elevated platelet cytosolic Ca2+
Platelets activation lead to the release of platelet granule contents including the alpha granules and secretory granule components. This overall events take place in response to elevated platelet cytosolic Ca2+ concentration. Reactome pathway analysis shows that Corilagin suppresses the expression of several proteins involved in the platelet degranulation process (indicated by yellow boxes). Platelet granules proteins found to be less-abundance are P02787, P00747, P04075, and P02679. The result suggested that Corilagin may act in the inhibition of platelet degranulation.

259
8.2.5 Label-free platelet protein quantification
8.2.5.1 Platelet proteome classification
Separation of platelet protein in two-dimension gel electrophoresis has provided general
figures on the alteration of platelet proteome, as the effects of corilagin on platelet
activation induced by ADP. However, although 2D-gel electrophoresis were able to visualise
the separation of platelet proteins, which were separated according to their isoelectric
points and molecular weight, this protein separation method still has several constraints,
particularly when sensitivity and accuracy of protein identification, as well as protein
quantification, is needed for more accurate platelet pathway analysis. The most common
drawback of 2-D gel electrophoresis is that it usually only shows the most abundant
proteins. Consequently, the low-abundance proteins that might be of importance in the
platelet aggregation events might not be identified. Moreover, 2D-PAGE separation is
limited by gel concentration and protein size, which means basic and membrane bound
proteins cannot be well separated by 2D-PAGE.
Consequently, we conducted mass spectrometry platelet proteins analysis using a SYNAPT
G2-S HDMS mass spectrometer (Waters, Manchester UK) in order to obtain a broader
picture of platelet proteome changes during corilagin inhibition of ADP-induced platelet
aggregation events. The complex peptide mixture, upon tryptic digestion, was analysed in
mass spectrometry using data-independent acquisition approach. The produced MS spectra
was further analysed using PROGENESIS QI software, which performed the peak
identification, followed by protein identification and protein quantification by searching
SWISSPROT human database. Three different conditions of platelet total proteome were
analysed; resting, ADP-activated, and ADP-activated in the presence of corilagin. Analysis of

260
the MS data identified 83132 distinct features within the data, which representing the peaks
on the MS spectra. A total of 33714 peptides were identified, which related to 2468
quantifiable proteins were identified. Principal component analysis (PCA), was performed to
obtain a simplified data visualisation, in order to observe the variation between sample
groups. The PCA results, shown in Figure 8.10, showed a clear differentiation between three
groups of sample; resting, ADP-activated, and ADP-activated in the presence of corilagin; at
the feature and protein levels of the data sets.
Furthermore, in order to obtain a general figure of the whole platelet proteome identified in
this study, gene ontology analysis was undertaken through PANTHER classification systems
(Mi et al., 2013), using the list of all identified proteins as data input (2468 proteins). The
analysis identified 2307 proteins, which were classified into several categories according to
the protein and gene database available in PANTHER classification system. Figure 8.10
showed the functional classification of the identified platelet protein. The molecular
function classification according to the PANTHER database (Figure 8.10 A) showed that the
majority of the identified platelet proteins are categorised as enzyme-related proteins
(43%), which are related to platelet signalling processes, i.e. G-protein modulators, small
GTPases, guanyl-nucleotide exchange factors, phosphatases, and kinases. Binding proteins
have a total share of 30% of all of the identified proteins, which include calcium ion binding,
receptor binding, and cytoskeletal binding proteins. A closer look at the proteins cellular
process (Figure 8.10 B) showed 23% of the identified proteins were related to platelet
metabolism process, which is intimately coupled to platelet activation response, one
example was the proteins related to ATP turnover in platelet cytoplasm (Holmsen, 1985). A
total of 11% and 10% were related to cellular movement/organization and cell
communication process, respectively. The rest of the identified proteins were distributed to

261
other platelet biological functions, including transport (10%), response to stimulus (4%), and
adhesion process (3%).
The distribution of proteins localisation (Figure 8.10 C) showed that the majority of the
identified platelet proteins were located in platelet cytoplasm (33%). The cytoplasmic
proteins mainly contribute to platelet metabolism, signalling, and vesicular transport.
Interestingly, 21% of the total proteins were located in platelet cytoskeleton structures,
which cover actins and microtubules, tubulins, cytoplasmic filaments, and pseudopodia
protrusions. Moreover, platelet proteins specifically related to platelet activation process
are found in platelet macromolecular complex (14%), plasma membrane (13%), or as
content of platelet granules secretions (6%). The latter platelet proteins groups, together
with those related to platelet signalling pathway, are of the greatest interest in the context
of platelet activation event and, therefore, might be affected by a given antiplatelet agent
to prevent the formation of platelet aggregates.

262
Figure 8.9 – PCA analysis of platelet proteome HDMSE data sets at the feature and protein levels
The PCA biplot showing the differentiation of the resting (blue), ADP-activated (purple), and Corilagin-treated ADP-activated platelet at the regulated feature and peptide levels.
Feature level
Protein level

263
Figure 8.10 – Functional classification of platelet proteome
Pie chart representing the 2307 platelet proteins identified in this study distributed into the following categories: (A) molecular function, (B) cellular process, (C) sub-cellular localization.
Cell junction 3%
Cytoplasm33%
Cytoskeleton21%
Macromolecular complex
14%
Mitochondria2%
Nucleus2%
Others5%
Plasma membrane13%
Pseudopodi1%
Secreted6%
A B
C

264
8.2.5.2 Quantitative proteomics analysis
The analysis was started by the analysis of all quantifiable proteins using PROGENESIS QI
software. The parameters used were p value < 0.05 for determining the significant
difference, and maximum fold ≥2 of the increase/decrease in protein levels. From the
analysis, 659 differential proteins were identified (noted as group A). Next, the data was
divided into two groups of proteins; the first category was the proteins which were more
abundant in the ADP-activated proteome (noted as group B), and the latter group was the
proteins that were more abundant in the ADP-activated platelet with the presence of
corilagin (noted as group C). For the ease of further data classifications and analysis, the
differential platelet proteins is noted as group A, while group B and group C represented the
proteins which are more abundant in ADP-activated platelet, in the absence and in the
presence of corilagin, respectively. The quantitative analysis returned with a total number of
338 of group B proteins and 321 of group C proteins.
Furthermore, protein subset data was enriched by conducting an over-representation
analysis using PANTHER statistical over-representation test, to compare platelet proteome
during ADP-activation with and without the presence of corilagin, relative to platelet
proteome in resting state. The enrichment analysis used a threshold value of 5% maximum
false discovery rate (FDR) and p value < 0.05 for selection of proteins. Based on the analysis
result as shown in Figure 8.11, it was seen that the signalling, adhesion, and junctional
proteins were over-represented in group B. The finding indicated that corilagin contributed
to the alteration of the expression profile of platelet proteins, which are related to signalling
and adhesion processes during the ADP-activation event, i.e. G-protein coupled receptors
and G-protein modulators, platelet glycoproteins (including integrin alpha-IIb/beta-3 and P-

265
selectin), and Ras/Rho-related proteins. On the other hand, the proteins related to platelet
cellular movement and organisation, metabolism, and cellular transport appeared to be less
important during platelet aggregation inhibition by corilagin. The data presented in Figure
8.11 showed that protein over-representations of group C were relatively comparable to
group A, as the standard figure of total platelet proteome.
Moreover, although the proteins representation of group C was found to be less significant
compare to group B proteins, plasma membrane-origin proteins were over-represented in
group C. This finding suggested the influence of corilagin to the over-representation of
plasma membrane proteins, for example voltage-gated and ligand-gated ion channels,
which are of crucial factors in the platelet activation pathway.

266
Figure 8.11 – Over-representation analysis of platelet proteome
The chart shows each category of the functional classification of the proteins found in platelet proteome (group A). The other bars on the chart represent the proteins that is abundance in platelet proteome of ADP-activated alone (group B) or in the presence of Corilagin (group C). The cut-off value of the up- and down-regulated proteins are the maximum fold of ≥ 2 with a p value < 0.05. The relative over-representation of platelet proteins, relative to the resting state, is marked as (+) when the total number proteins found in a group is higher that the resting state, and (-) when the value is lower.
Protein function
Cellular process
Sub-cellular localization
A B C

267
8.2.6 Platelet signalling pathway analysis
The earlier analysis has revealed several possible routes for the inhibitory mechanism of
corilagin towards platelet activation and aggregation. The experimental data generated
from membrane glycoprotein analysis, 2D-gel electrophoresis platelet proteins expression,
and the quantitative analysis of platelet proteome using a label-free proteomics approach
have shown an enriched subset of proteins, whose expressions were increase/decrease in
the presence of corilagin in ADP-activated platelet. All of the identified proteins might be
involved in corilagin inhibitory action during platelet activation and aggregation events. A
comprehensive analysis of the protein functions was performed using pathway analysis
software to gain a deeper insight into the mechanism of inhibition. This was done by
employing the qualitative and quantitative information generated from Progenesis QI as
data input for the freely available Panther and Reactome software (The flow chart of the
analysis is available in the appendix section).
Initially, subset data of protein lists, obtained from quantitative proteomic analysis in
section 8.2.5.2; group A (659 proteins), group B (338 proteins), and group C (321 proteins)
were used as the data input for Panther pathway analysis tools. The analysis was performed
by uploading the protein list to PANTHER gene analysis tools, which automatically searched
for the matched protein IDs within the PANTHER protein library (more detailed on PANTHER
infrastructure and protocol is available in the appendix). The search resumed a total number
of 587(group A), 303 (group B), and 284 (group C) protein hits. Next, each identified
proteins were automatically annotated according to the pathways they are involved in. The
respective pathways were then statistically analysed for their over-representation, resulted
in a list of the possible pathways involved for corilagin to inhibit platelet aggregation.

268
Moreover, the resulted pathway list were filtered by using a minimum of 3 fold enrichment
and p value < 0.05 for the enrichment of data output (Huang et al., 2009). When subset data
group A were used as data input, the PANTHER pathway analysis results demonstrated 46
proteins are registered as the components of one of more signalling pathways. Out of the
total number above, 28 proteins are listed in the subset data group B, while the other 18
proteins came from data subset C (complete protein list is available in the appendix). The
enriched pathways list is shown in Table 8.2, which demonstrated the possible pathways
involved in corilagin mechanism of action.
Moreover, pathway analysis using subset data B showed 5 pathways significantly involved in
corilagin mode of action. The analysis using subset data C did not show any significant result
from PANTHER pathway analysis. Group B showed the differential proteins which were
more abundant in ADP-activated, compare with that seen in protein samples from ADP-
activated platelet in the presence of corilagin, thus represented the proteins which were
down-regulated by corilagin during ADP-activation events (Table 8.2). Group C, on the
contrary, represented platelet proteins that were up-regulated in the presence of corilagin,
upon platelet activation by the addition of ADP. Therefore, the finding suggested corilagin
activities in inhibiting platelet aggregation involve the alteration of ADP-activated platelet
protein expressions. The inhibitory effects shown by corilagin are probably due to in the
inhibition of protein expression caused by ADP-activation.
Based on PANTHER pathway analysis results, integrin and G-protein signalling pathways
appeared as the main routes for corilagin in inhibiting ADP-induced platelet aggregation.
This involves several platelet proteins including the G-proteins, membrane integrin alpha,
and phosphatases, which were down-regulated in the presence of corilagin. A closer look at

269
each of the proteins involved revealed that the expression of a number of platelet-
activation proteins was also suppressed when corilagin was present during ADP-stimulation.
The proteins involved including Guanine nucleotide-binding protein (G-protein) subunit
alpha and subunit beta, phospholipase C, protein kinases, and 1-phosphatidylinositol 4,5-
bisphosphate phosphodiesterase, which are known to hold a key role in platelet activation
and signalling mediated by G-protein-coupled receptors or GPCRs. Among all of the
subfamilies of G-proteins, platelets express Gq, G12/G13, Gi/Gz, and Gs that, apart from the
latter protein, are coupled to the receptors for agonists that induce platelet activation. ADP,
the agonist used in this study, activates platelet via its receptors on platelet surface, such as
P2Y12 and P2Y1. These receptors are known as GPCRs that stimulate platelet activation via
Gq-coupled (P2Yi) and Gi-coupled (P2Y12). Gq activation transmits the downstream signals
by its interaction and stimulation of platelet phospholipase C (PLC) which, in turn, lead to
GPCR-stimulated platelet granule secretion, activation of platelet integrins, and platelet
aggregation (Li et al., 2010). Given that the level of these proteins were lower following
corilagin treatment of ADP activated platelet, this finding suggested that platelet activation
via G-protein signalling route might be impaired in the presence of corilagin.

270
Table 8.2 – Pathway over-representation test of ADP-activated proteins with the presence of corilagin
Pathway Total Protein
Population %
Fold Enrichment
P-value
EGF receptor signalling pathway 13 2.2 3.39 < 0.01
Integrin signalling pathway 15 2.6 3.18 < 0.05
VEGF signalling pathway 8 1.4 > 5 < 0.05
Oxytocin receptor mediated signalling pathway
7 2.3 > 5 < 0.01
Histamine H1 receptor mediated signalling pathway
6 2.0 > 5 < 0.01
5HT2 type receptor mediated signalling pathway
7 2.3 > 5 < 0.01
Heterotrimeric G-protein signalling pathway-Gq alpha and Go alpha mediated pathway
9 3.0 > 5 < 0.01
Thyrotropin-releasing hormone receptor signalling pathway
6 2.0 > 5 < 0.01
Muscarinic acetylcholine receptor 1 and 3 signalling pathway
6 2.0 > 5 < 0.01
Gonadotropin releasing hormone receptor pathway
12 4.0 3.79 < 0.05
Endothelin signalling pathway 7 2.3 > 5 < 0.05
Parkinson disease 7 2.3 > 5 < 0.05
Pathway enrichment analysis was conducted using PANTHER pathway analysis tool using subset data A from qualitative and quantitative proteomics analysis. Fold enrichment measures the magnitude of enrichment compare to human genome. Fold enrichment > 3 was considered as significant. The population percentage is the total number of proteins involved in a given term divided by the total number of input proteins. P-values examine the significance of gene-term enrichment. P value <0.05 was considered significant. The diagram of each pathway is available in the appendices.

271
PANTHER proteome analysis has given an insight into the platelet signalling pathways that
might be impaired by corilagin treatment upon ADP-induced platelet aggregation events.
However, the scope of pathways shown by PANTHER pathway analysis is usually well
defined in metabolic pathway, but much less in regulatory pathways. For example, PANTHER
was able to categorise the down-regulated proteins, as the effect of corilagin on ADP-
activated platelet, into the possible corresponding pathways. However PANTHER pathway
tool did not show explicitly the influence of the proteins or the pathways they involved in on
platelet activation and subsequent aggregation cascade. To address this issue, a second
pathway analysis was conducted using REACTOME pathway analysis tool. This approach
provides a direct link with the protein expression in the platelet activation pathways, serves
as an additional tool to verify the previous pathway analysis results.
To perform the analysis, subset data group A, showing 659 differential proteins generated
from Progenesis QI quantitative analysis, was used as a data input for Reactome expression
analysis tool. The output was filtered by searching for platelet-related pathways with an
entities p value < 0.05. The result demostrated 25 pathways and sub-pathways, showing the
haemostasis pathway as the top leading platelet regulatory hierarchy (as presented in Table
8.3). Furthermore, as seen in Figure 8.12, corilagin actions included regulation of protein
expression in ADP-induced platelet activation, signaling and aggregation pathways, which
probably involve thrombin signalling trough PARs receptor, signal amplification, platelet
aggregation, PIP2 hydrolysis and response to elevated platelet cytosolic Ca2+.
REACTOME pathway analysis results showed that corilagin demonstrated a direct inhibition
towards ADP signalling through P2Y1 and P2Y12 receptors, thrombin signalling through
PARs, and G-protein signalling cascade (as shown in diagrams in Figure 8.13). With regard to

272
the involvement of G-protein signalling in corilagin mode action, as previously indicated in
PANTHER pathway analysis result, REACTOME analysis output showed corilagin activities
involve the down-regulation of G alpha (z), G alpha (12/13), and G alpa (q) signalling events.
As previously mentioned, these sub-families of G-proteins are expressed on platelets and
crucial in platelet activation events. Moreover, corilagin also affected platelet PIPs
metabolism, which is a key factor in platelet aggregation cascade.
Within the pathways related to platelet internal milieu, corilagin was found to prevent the
increase of platelet intracellular calcium, potentially attributed to the inhibition of SNARE
formation in ADP-activated platelets. As described in Figure 8.14, the rise of platelet
cytosolic Ca2+ levels following platelet activation resulted in platelet degranulation, which in
turn allows the release of platelet granules and cytosolic contents. Therefore, the result of
this study demonstrated that protein involved in platelet alpha granules release and overall
cytosolic proteins expression was down-regulated, thus suggesting that corilagin specifically
influences platelet calcium homeostasis during platelet activation and aggregation events.
In the previous section, our result has demonstrated that corilagin reduced the level of
platelet transformation from spherical shape into irregular and long-psedoposi shapes,
following ADP activation. In line with this finding, REACTOME pathway analysis results
showed that corilagin interfered with protein expression involved in PINCH ILK parvin
complex signalling cascade, which controls platelet cytoskeletal rearrangement. Therefore,
this finding might explain corilagin possible mode of action in the regulation of platelet
cytoskeletal remodelling upon ADP activation.

273
Table 8.3 – Pathway list from REACTOME pathway analysis
Pathway name Protein population
P value FDR
Disinhibition of SNARE formation 40% < 0.01 < 10%
Regulation of cytoskeletal remodelling and cell spreading by IPP complex components
25% < 0.01 < 10%
Localization of the PINCH-ILK-PARVIN complex to focal adhesions
25% < 0.05 < 20%
ADP signalling through P2Y purinoceptor 1 16% < 0.01 < 1%
Thromboxane signalling through TP receptor 13% < 0.01 < 10%
Thrombin signalling through proteinase activated receptors (PARs)
13% < 0.01 < 1%
G alpha (z) signalling events 11% < 0.01 < 1%
Prostacyclin signalling through prostacyclin receptor
11% < 0.01 < 10%
ERK/MAPK targets 10% < 0.01 < 10%
ADP signalling through P2Y purinoceptor 12 9% < 0.01 < 10%
Synthesis of IP3 and IP4 in the cytosol 8% < 0.05 < 10%
G-protein activation 7% < 0.05 < 10%
Prolonged ERK activation events 7% < 0.05 < 10%
Synthesis of PIPs at the plasma membrane 6% < 0.05 < 20%
Ca2+ pathway 5% < 0.01 < 10%
Platelet homeostasis 5% < 0.01 < 10%
Cell surface interactions at the vascular wall 5% < 0.01 < 10%
G-protein mediated events 5% < 0.05 < 20%
Platelet activation, signalling and aggregation 4% < 0.01 < 1%
G beta:gamma signalling through PI3Kgamma 4% < 0.05 < 20%
G alpha (12/13) signalling events 4% < 0.05 < 10%
G-protein beta:gamma signalling 4% < 0.05 < 20%
GPVI-mediated activation cascade 4% < 0.05 < 20%
G alpha (q) signalling events 3% < 0.01 < 10%
Haemostasis 3% < 0.01 < 1% All enriched proteins were used as the input data for pathway analysis using Reactome pathway analysis. Protein population represents the relative entities of proteins that are common between the submitted data set and the corresponding pathway. The p value is the result of the statistical test for over-representation of the proteins found in the corresponding pathway. False discovery rate (FDR) is the corrected over-representation probability.

274
Figure 8.12 – Haemostasis pathway
The diagram highlighting the proteins found to be down regulated in haemostatic pathway (bottom figure) and the sub-pathway of platelet activation (top figure). The level of protein expression was shown by a coloured-standard bar on the left side of the figure, showing a range from dark blue (for the down-regulated) to light yellow (up-regulated). Within the platelet activation and aggregation pathway showed in the top figure, platelet proteins of five sub-pathways are found to be down-regulated in the presence of Corilagin; thrombin signalling trough PARs receptor, signal amplification, platelet aggregation, PIP2 hydrolysis and response to elevated platelet cytosolic Ca2+.
Hemostasis Pathway
Platelet activation, signalling and aggregation

275
Figure 8.13 – ADP and thrombin activation pathway
Protein expression analysis highlighting the proteins which are down-regulated by the ADP-activation in the presence of Corilagin (A). The similar effect are observed on thrombin activation pathway that also involving the activation of G-proteins for transmitting the activation stimulus into platelet’s internal milieu.
A
B

276
Figure 8.14 – Response to elevated platelet cytosolic calcium
The process begins with the activation of Phospholipase C (PLC) on platelet membrane that stimulates the second messengers of the phosphatidylinositol pathway that, in turn, results in a rise of intracellular calcium and activation of Protein Kinase C (PKC). The diagram shows down-regulated proteins (in blue-highlight boxes) upon platelet aggregation in the presence of Corilagin. The finding suggested the inactivation of PLC enzyme thus prevents the cleavage of PIP2 to form the second messenger, PIP3 and DAG, which regulates calcium channels.

277
8.3 Discussion
Various agonists stimulate initiation of platelet aggregation via their specific receptors on
the surface of the platelet membrane. The intracellular signalling messages mediated by the
agonist-receptor binding leads to platelet cytoskeleton rearrangement, cytoplasmic ion
exchange, and the release of granule contents. From data presented in the previous
chapters, this current study has revealed the profound inhibitory activity of corilagin in
platelets aggregation, which was measurable in a dose dependent manner. This inhibitory
activity was based on the in-vitro platelet aggregation assay and microscopic observation of
the platelets morphology upon ADP-stimulation. In the presence of corilagin, the
aggregation response was significantly impeded with the evident of the occurrence of
round-shaped solitary platelets, which lack of platelet population with dendritic appearance
with long pseudopodia.
Platelet activation is macroscopically marked by the dramatic transformation of platelet
morphology from discoid to irregular spherical shape, and is an immediate response to the
signalling cascade transmitted from the activation of various platelet membrane proteins.
Alpha and beta integrin subunits are important members of platelet membrane proteins,
and are expressed on the platelet surface as heterodimers. The extracellular domains of
these protein are larger than the intracellular parts (known as cytoplasmic tail), with a single
transmembrane segment connecting the inner and outer part of the integrins. The main
function of these proteins is to connect the extracellular matrix (ECM) to actin and
cytoskeleton in platelet cytoplasm, as well as transmitting biochemical signals across the
plasma membrane (outside-inside signalling). Moreover, the cytoskeletal linkages enable
the integrin to regulate platelet shape and mediate adhesion. Upon platelet activation,

278
Integrin beta subunit directly binds to specific actin-binding proteins, i.e. talin, vanculin, and
actin, which act as adaptor proteins for the cytoplasmic cytoskeleton filaments. Flow
cytometry analysis of platelet membrane proteins in this current study showed that
corilagin increased the expression of integrin beta-3 (CD61) on the surface of ADP-activated
platelets, suggesting the alteration of integrin beta-3 binding to its related adaptor proteins
and further signal transmission. The cytoplasmic tail of the integrin alpha, although not
directly linked to the adapter proteins, binds the signalling adapter proteins, i.e. paxillin, and
such binding is important in regulating spreading and stress fibre formation (Calderwood et
al., 2000). It has been reported that the lack of integrin alpha expression appears to increase
direct interaction of the cytoplasmic tail of integrin beta with cytoskeleton. In this study,
platelet proteome analysis showed that the treatment of platelets with corilagin increased
the expression of integrin alpha-6 and alpha-3, suggesting a high level of unbound-integrin
alpha that might contribute to the inhibition of platelet cytoskeletal reorganisation.
Moreover, the finding demonstrated the increase in the expression of filamin B, an adaptor
protein anchoring the heterodimer alpha/beta integrin to actin-cytoskeleton (Xu et al.,
1998), which indicates the presence of free adhesive proteins without any interactions with
the activated integrins. Filamin is known as one of central elements in the platelet
membrane skeleton, presents in platelet as filamin A and B and links with the free N-
terminal of integrin cytoplasmic tail. Each of filamin A and B has two binding sites for the
GPIb chain of the VWF receptor (GPIb-IX-V complex) and their interaction is of great
importance in strengthening the linkages of the membrane cytoskeleton to the plasma
membrane. Filamin attaches to F-actin and takes part in building up the platelet actin
filament system, involving several small GTPases and various signalling molecules.
Therefore, the reduction of filamin binding has a strong correlation with the inhibition of

279
integrin-mediated platelet signalling, as well as platelet cytoskeletal rearrangement,
pseudopodia protrusion, and shape changes (Cranmer and Jackson, 2003). Finally, the
finding is coherent with the low level of cytoskeletal proteins expressed on the corilagin-
treated platelet proteome, including Crk-like protein, tubulin alpha-1C chain, LIM and
senescent cell antigen-like-containing domain protein 1, and alpha-parvin. The later protein
has been reported to interact with other platelet proteins to form the PINCH-ILK-PARVIN
complex which functions in signal transduction from ECM, to regulate cytoskeletal
remodelling and cell spreading (Wu, 2004).
One of the central receptors in platelet aggregation is the GPIIb/IIIa (αIIbβ3-integrin), which is
abundantly expressed on the platelet surface and is immediately activated following platelet
activation. On resting platelets, this integrin is in its non-active state, with a low affinity
towards ligands such as fibrinogen, VWF, or vibronectin (George, 2000). Interaction
between platelet agonists and their receptors initiates the so-called inside-out signalling
cascade that initiate the conversion of GPIIb/IIIa from a low-affinity to a high-affinity for
ligands binding (Shattil et al., 1998). The data presented here shows that corilagin has no
measurable activity towards GPIIb/IIIa activation, suggesting that this integrin receptor has
undergone a conformational change and activated in a way that further impeded platelets
aggregation. Therefore, it might be postulated that corilagin works on the alteration of the
avidity modulation of GPIIb/IIIa, this implies activity role in the interaction between the
activated integrin and the related ligands (Shattil et al., 1998) and, in turn, prevents platelet
aggregation. Figure 8.15 illustrates the possible route on the platelet integrin-signalling
cascade that are affected by addition of corilagin. In accordance with the presented data,
the figure shows corilagin’s role in the alteration of the inside-out signalling mechanism

280
during platelet activation events, which may be attributed to the inhibition of platelet
cytoskeletal and conformational modifications.
Figure 8.15 – Corilagin role in platelet inside-out signalling mechanism
Binding of ADP and its receptors (P2Y12 and P2Y1) initiates the activation of complex signalling cascade. The commencement of the active GPIIb/IIIa on platelet surface occurs through the structural changes in the integrins (affinity modulation), thus exposes the binding sites for the soluble ligands and turns GPIIb/IIIa into a high-affinity state. The signals form the agonists also induce platelet cytoskeletal rearrangement which causes the clustering of the activated GPIIb/IIIa. The latter event greatly enhances the ligand-binding affinity of GPIIb/IIIa. This study reveals that corilagin demonstrates a modest inhibition activity on GPIIb/IIIa affinity modulation, however it significantly prevents cytoskeletal modification and platelet conformational changes upon ADP-activation.
Platelet inside-out signalling is triggered by a number of excitatory agonists via linkages with
two types of platelet membrane receptors; adhesion molecules and G-protein coupled
receptors. ADP, epinephrine, thrombin, and TxA2 interact with the later membrane
receptors, whereas the other agonist, i.e. Collagen and VWF, which is normally exposed on
the surface of wounded vascular endothelial cells, induced platelet activation reactions via
adhesion molecular complexes; i.e. GPIa-IIa and GPIb-IX-V complex. Collagen, and other
platelet adhesion molecules, induce platelet signal transmission through Src family kinases
(SFKs), phosphoinositide 3-kinases (PI3Ks), and immunoreceptor tyrosine-based activation
motif (ITAM) signalling pathway (Li et al., 2010). Platelet aggregation cascade initiated

281
through agonists binding to G-protein coupled receptors (GPCRs) involves three distinct G
protein-mediated signalling mechanisms that are stimulated by the activation of three types
of G-proteins; Gi, Gq, and G13. ADP initiates platelet aggregation through its receptors
P2Y12 and P2Y1, each of which binds to Gi and Gq types of platelet GPCRs, respectively
(Offermanns, 2006a). Thrombin and TxA2 mainly activates Gq and G12/13 to induce full
platelet aggregation via their specific GPCRs; protease-activated receptors PAR1/PAR4 and
TxA2 receptor (TP), respectively. Epinephrine, although its activity is mainly in amplifying the
effect of other agonists or stimuli, induces platelet reactions by its binding to the α2A-
adrenergic receptor (Offermanns, 2006a). Although various membrane receptors initiate
platelet activation via different receptor-binding mechanisms, at a downstream level they all
share common intracellular signalling events. Based on the data presented in the previous
chapter, corilagin showed a significant inhibitory effect towards platelet aggregation
induced by various agonists. This implies that it not only prevents the formation of final
platelet aggregates but also suggests that corilagin might act by disrupting a common
intracellular cascade
Based on the reactome pathway analysis, inhibition of G-protein pathways were suggested
as one of the possible mechanism of the corilagin inhibitory mechanism towards platelet
aggregation. The results showed a significant decrease in G-proteins and G-protein
regulatory molecules expression, including Guanine nucleotide-binding proteins, G-protein
coupled receptor kinase 4, and Regulator of G-protein signalling-18. ADP activation, which
was used as platelet agonist in this study, and subsequent platelet aggregation is initiated
via GPCR. Corilagin prevented the further G-protein signalling cascade, which was proven by
the low-expression of proteins involved in the signal transmission. Moreover, other platelet
agonists will also activate G-protein signalling cascades because all mediators can, in turn,

282
release or generate GPCRs ligands such as TxA2, ADP, and thrombin. Therefore, this finding
might explain the great potency shown by corilagin in inhibiting platelet aggregation,
irrespective to platelet agonists used to initiate the platelet activation.
Agonists binding to Gq-coupled receptors results in the activation of phospholipase C (PLC),
which in turn catalyses the generation of a second messenger through the hydrolysis of
phosphatidylinositol 4,5-bisphosphate (PIP2) via the cleavage of phosphodiester bond to
release inositol trisphosphate (IP3) and diacylglycerol (DAG) (Li et al., 2010). In common, the
majority of platelet agonists share the latter route in initiating complete platelet
aggregation. IP3 is responsible for the release Ca2+ from platelet dense tubular system and
the increase of intracellular Ca2+ level, while DAG activates platelet protein kinase C (PKC).
The data presented here demonstrated a decrease in the expression of 1-
phosphatidylinositol 4,5-bisphosphate phosphodiesterase beta (PLCβ) on corilagin-treated
platelet proteome, thus indicating the inhibition of PLC activity during ADP-stimulation in
the presence of corilagin. The finding is consistent with another result that shows the low
level of PKCs expression, as the consequence of the alteration of the production of DAG and
IP3. The above result has provided evidence of corilagin activity to impair the Gq-mediated
signalling cascade upon platelet activation. Gq has been suggested to play a crucial role in
ADP-induced platelet shape change by stimulating calcium contractile signalling (Li et al.,
2010) and, accordingly, it is possible that IP3 production is also hampered as corilagin has
shown the activity to impair platelet conformational changes upon ADP-activation.
In the case of other platelet G-proteins, Gi-mediated signalling brings about the activation of
phosphoinositide 3-kinases (PI3Ks) and subsequent regulation Rap1b, a small GTPase
responsible for mediating integrin activation (Li et al., 2010). Proteome analysis results

283
demonstrated that corilagin has no significant activity towards the expression of Gi-
signalling proteins. Given that GPIIb/IIIa, the main integrin responsible for platelet
aggregation, has not been affected by corilagin, it is unlikely that Gi-mediated GPCR
signalling is involved in the mechanism of action of corilagin. Likewise, G13-mediated GPCR
signalling activates the small G-protein RhoA, which, upon activation, enhances platelet
cytoskeletal contraction leading to platelet shape change and granule secretion (Aslan et al.,
2013). The expression of RhoA-related proteins, Rho GTPase-activating protein 26, is
decreased with the presence of corilagin. However, it is found that Rho-related GTP-binding
protein RhoB expression is increased, thus indicating a counteracting effect in Rho-mediated
cytoskeletal regulation. Although human cells express a number of Rho GTPase proteins,
RhoA is the most highly expressed Rho isoform in platelets which is directly activated by
GPCRs (Aslan and McCarty, 2013). RhoB, which is also related with platelet function, mainly
exerts an activity in PDGF-mediated membrane trafficking. Taken together, G13-mediated
signalling might be partially affected by corilagin.
Platelet responses to all agonists, at a downstream level, result in the secretion of granule
contents. This reaction is seen as the key factor for the amplification and further
development of platelet aggregates. Among all platelet secretory granules, α-granules
contain the major adhesion proteins, i.e. fibrinogen, VWF, and TSP1. This secretory granule
also contains the mitogenic factors (PDGF, VEGF, TGFβ), coagulation factors, and protease
inhibitors proteins (protein C, PAI-1, TFPI). Moreover, various glycoproteins, P-selectin and
GPIIb/IIIa are exclusively localised on alpha-granule membrane (Stenberg et al., 1985a).
Dense granules mostly store platelet secondary agonists pool, such as ADP and serotonin,
and platelet membrane receptors, including P-selectin (Israels et al., 1992). The contents of
the later granule enhance the initial agonist stimulation and generate the activation of the

284
whole pathways of platelet activation and aggregation cascade. From the results of the
analysis of platelet membrane receptors (section 8.2.3), the presence of corilagin during
platelet stimulation by ADP significantly halted the expression of P-selectin, which
suggesting the inhibition of platelet degranulation reaction. This finding is further supported
by platelet proteome analysis results, which demonstrated a low level of platelet-secreted
protein expression, particularly alpha granule contents, including coagulation factor VIII,
platelet basic proteins, and septin-5, as the effect of corilagin treatment. The finding
suggests that corilagin might counteract the ADP stimulation effects to induce further
platelet aggregation, by interrupting the platelet degranulation process.
One of the major components in platelet aggregation is the increase in the intracellular Ca2+
concentration, as the downstream effects of platelet activation stimulation by agonists. The
calcium pathway is central to the cytoskeletal rearrangement and platelet degranulation
that, as discussed earlier, generate the growing platelet plug and further coagulation. The
rise of cytoplasmic Ca2+ level is primarily initiated by the activation of PLC and the
generation of second messenger, IP3 and DAG. In ADP-induced platelet aggregation, this
reaction is regulated by the activation of PLCβ via P2Y1-mediated Gq activation, although it
has also been reported that ADP binding to P2Y12 receptor might lead to PLCγ activation
(Varga-Szabo et al., 2009). In the earlier section, It has been discussed that corilagin
decreases PLCβ expression, thereby resulting in the inhibition of IP3 and DAG production,
which causes further alteration of the downstream effects. The main source of platelet free
cytoplasmic Ca2+ arises from the organelle release of the stored Ca2+ pool and Ca2+ entry
from extracellular compartment. Endoplasmic reticulum (ER) is known as the major source
among all platelet intracellular stores. IP3 mediates calcium release from ER through its
binding to IP3 receptors (IP3Rs) on the ER membrane surface, which themselves are Ca2+

285
permeable ion channels, allowing free calcium release from ER inner compartment. The
elevation of Ca2+ concentration, in turn, causes the opening of Ca2+ channels on the platelet
membrane, known as store-operated calcium (SOC) channel, to allow Ca2+ influx (Varga-
Szabo et al., 2009). In addition to the SOC entry, further Ca2+ entry is mediated by DAG via
the activation of the so-called non-store-operated calcium (non-SOC) channel, which is
known as transient receptor potential channel 6 (TRPC6) (Berridge et al., 2003). In summary,
while IP3 is known to evoke Ca2+ release from intracellular stores and regulate indirect Ca2+
entry, DAG is known to directly activate Ca2+ channels in the plasma membrane, although it
has been argued that DAG might also mediate SOC entry in platelet (Varga-Szabo et al.,
2009). Although the elevation of Ca2+ is related to various steps in platelet activation, at the
end, it contributes in regulating platelet shape change and degranulation, which are
inhibited by corilagin as demonstrated from the results in this study. Accordingly, as
corilagin decreases the level of protein involved in the upstream and downstream events of
platelet Ca2+ pathway, the overall result suggested that inhibition of intracellular Ca2+ rise
might be one of the possible mechanisms of the antiplatelet effect of corilagin.
In summary, this current study has revealed several important clues in explaining the mode
of action by which corilagin exert its inhibitory activity towards in-vitro platelet aggregation,
as is illustrated in Figure 8.16. One important finding demonstrated that corilagin altered G-
protein signalling pathway in a selective manner by impeding Gq-protein cascade. Corilagin
might act through G13-mediated signalling, however it shows no significant effect on Gi-
mediated signalling pathway. Eventually, corilagin inhibits platelet shape changes and
granule secretion, which is suggested to take place by the inhibition of the rise of
intracellular Ca2+ level due to the inactivation of PLC. Although corilagin shows no inhibitory
effect on the initial activation of platelet glycoprotein, GPIIb/IIIa, the findings suggest that

286
the interaction between activated integrin and the related ligands is affected, which results
in the inhibition of further amplification of platelet aggregation. Taken together, this study
has confirmed the antiplatelet activity of corilagin and explained its coherent mode of
actions, which support the application of corilagin as a natural-sourced antiplatelet agent.

287
Figure 8.16 – Proposed mechanism of corilagin action
ADP stimulation initiates a multistep signalling cascade of G-protein coupled receptors. In
the present of Corilagin, the overall downstream signal leading to platelet aggregation is
affected. Inactivation of phospholipase Cβ (PLCβ) causes the inhibition of inositol-3-
phosphate (IP3) and diacylglycerol (DAG) production, leading to the suppression of Ca2+
release from endoplasmic reticulum (ER) and Ca2+ influx from extracellular compartment.
Intracellular free Ca2+ depletion prevent the subsequent reactions upon platelet activation,
platelet shape change and granule secretion. Consequently, Corilagin treatment causes
platelet aggregation to take place. Given that the glycoprotein receptors and integrin
cascade are less affected by Corilagin, it is suggested that the inhibition of calcium pathway
might be the possible mechanism of Corilagin in inhibiting platelet aggregation
(Discontinuous boxes shows proteins/events which are affected by Corilagin; orange
coloured represents the inhibition effect, while green coloured represents possible
inhibition effect).

Chapter 9Conclusion

289
In the field of drugs discovery and development, natural products have proven to be a rich
source of therapeutic compounds. Over the last 30 years, there is a great number natural-
derived new drug discovered, mainly as a result of intense studies conducted by
pharmaceutical company and academia. Higher plants have been the most-explored natural
source, which is mainly attributed to their abundance and ethnopharmacological use all
over the world. However, despite great interest in the investigation of plants as new
candidates of natural products, many plant sources and their constituents remain
untouched. In addition, the number of plant-derived secondary metabolites discovered to
date are still far from exhausted.
Phyllanthus niruri L is one of the most well-known medicinal plants and has been widely
used in many countries as a traditional medicine remedy. Its medicinal properties cover
various symptoms and diseases, including respiratory and abdominal disturbance, renal
stone elixir, infection, and bleeding disorder. Consequently, a number of research projects
has been conducted in order to reveal the pharmacological activities of Phyllanthus niruri L,
and have produced a considerable number of reports that mentioned its pharmacological
effect. Nevertheless, the rich constituents of this plant are yet to be comprehensively
studied, particularly with regard to the nature of the biological activities that the
compounds have.
To address the above issues, the main focus of this study is on the exploration of
Phyllanthus niruri L to pursue the search for new candidate of natural compound. This was
done through a bioassay-guided isolation protocol. Initially, the plant was extracted using
maceration technique to obtain soluble containing materials, as the main constituents of
the crude extracts. The plant extracts were tested against plasmodium, cancer cell lines, and

290
platelet aggregation. Upon the initial screening, further isolation procedures were
performed using advance chromatography technique, in order to purify the most-active
substances that represent the final candidate natural product. This study also conducted
further bioassay and proteomics studies, in an effort to identify the fundamental principles
of the mechanism of action of the isolated compounds.
Initial bioassay tests conducted on the Phyllanthus niruri L extracts indicated its potency as
antiplasmodial, anti-cancer, as well as anti-platelet agent. Water and methanol extracts
were proven to express the highest potency in inhibiting plasmodium growth, by lowering
the rate of parasites multiplication, which lead to the failure to enter the later stages of
parasites life cycle. This activity might be related to anti-malarial substances, such as
catechin, terpenes, and securinine. With regards to its anti-cancer effect, Phyllanthus niruri L
extracts showed a significant cytotoxic effect on human Caucasian lung large cell carcinoma
(COR-L23), human acute T lymphoblastic leukaemia (MOLT-4), and human Caucasian chronic
myelogenous leukaemia (K562). This biological effect is thought to be attributed to
methanol-soluble compounds, possibly including classes of flavonoids and terpenes, by
interfering cancer cells progression from G1 to S and from G2 to M phase during cell cycle.
Accordingly, the anticancer effect might be attributed to the alteration of DNA synthesis and
further protein synthesis within the cancer cells. Although Phyllanthus niruri L extracts
demonstrated a strong activity in inhibiting plasmodium and cell cancer growth, the extracts
are proven to have no cytotoxic effect on normal fibroblast cell line.
The screening for antiplatelet activity has demonstrated that Phyllanthus niruri L extracts
exert a strong potency in inhibiting in-vitro platelet aggregation. The water extract was
found to show the highest potency, followed by methanol and ethanol extracts. When

291
platelet aggregation is induced by ADP, Phyllanthus niruri L extracts suppress the second
wave of platelet aggregation response, thus indicating a capability to prevent platelet
granule release reaction and further amplification of platelet aggregation. Stimulation of
platelets by different agonists has further confirmed the antiplatelet activity of this plant.
Platelet aggregation induced by collagen, epinephrine, arachidonic acid, and thrombin was
significantly inhibited, in the presence of the 50 % (v/v) methanol extract of Phyllanthus
niruri L. Having found the remarkable potency of this plant in inhibiting platelet aggregation,
this study is funnelled towards exploring the antiplatelet activity in order to discover the
new antiplatelet compound.
From the methanolic extract, the multistep platelet bioassay-guided isolation protocol
resulted in the isolation of corilagin, or beta-1-O-galloyl-3,6- (R)-hexahydroxydiphenoyl-D-
glucose from the plant. Corilagin is known as one of the novel hydrolysable tannins, which is
found in a number of medicinal plants. Until recently, only a few studies have reported its
antiplatelet properties and little progress has been made with regards to the exploration of
corilagin activity on human platelets. Moreover, all the past studies are limited to animal-
study based platelet test. Therefore, to our knowledge, this present study was the first to
discover the activity of corilagin isolated from Phyllanthus niruri L with activity as a potent
antiplatelet agent, based on an in-vitro human platelet aggregation test. In addition to this,
the isolation process also discovered at least three other candidates for the new active
compounds, which possess antiplatelet property. However, due to the low purity level, this
study could not elucidate their molecular structure at this time.
The investigation of the mechanism of action of corilagin suggests that upon ADP activation,
platelet aggregates formation is greatly impaired. The inhibitory effect was initiated by the

292
inactivation of PLCβ, leading to the inhibition of the production of IP3 and DAG. The low
levels of IP3 and DAG in the platelets cytoplasm results in the inhibition of Ca2+ release from
endoplasmic reticulum and Ca2+ intake from extracellular environment. Calcium signalling is
an important pathway in platelet activation, secretion, and aggregation. The low level of
intracellular Ca2+ concentration, in turn, prevents platelet granule secretion and platelet
cytoskeletal reorganization. Because most of platelet agonists are located in platelet dense
granules and release to the extracellular matrix amplifies the aggregation response, the
inhibition of granule secretion leads to the inhibition of platelet aggregation. In summary,
the corilagin inhibitory mechanism is suggested to work through the inhibition of platelet
degranulation, which is likely to be related to the regulation of platelet cytosolic Ca2+
concentration.
In summary, this study has investigated scientific evidence for corilagin activity as anti-
platelet. To our knowledge, this study is the first to demonstrate the antiplatelet activity of
corilagin, isolated from Phyllanthus niruri L. Moreover, the mechanism of action of corilagin
was also elucidated, by using proteomics analysis of platelet proteome, which was never
been reported elsewhere. Finally, the result produced in this study might be additional
reference in natural product research and will contribute to the further study of anti-
platelet drug discovery.

293
List of References
ABDALLA, S. H. & PASVOL, G. 2004. Malaria: A Hematological Perspective, Imperial College Press.
ABDIN, M., ISRAR, M., REHMAN, R. & JAIN, S. 2003. Artemisinin, a novel antimalarial drug: biochemical and molecular approaches for enhanced production. Planta medica, 69, 289-299.
AGARWAL, C., TYAGI, A. & AGARWAL, R. 2006. Gallic acid causes inactivating phosphorylation of cdc25A/cdc25C-cdc2 via ATM-Chk2 activation, leading to cell cycle arrest, and induces apoptosis in human prostate carcinoma DU145 cells. Mol Cancer Ther, 5, 3294-302.
AGUDA, B. D. 2014. Chapter 12 - The Significance of the Feedback Loops between Kras and Ink4a in Pancreatic Cancer. In: AZMI, A. S. (ed.) Molecular Diagnostics and Treatment of Pancreatic Cancer. Oxford: Academic Press.
ALLEN, A., GILL, K., HOEHN, D., SULIS, M., BHAGAT, G. & ALOBEID, B. 2014. C-myc protein expression in B-cell acute lymphoblastic leukemia, prognostic significance? Leukemia Research, 38, 1061-1066.
ALVAREZ, R. A., GHALAYINI, A. J., XU, P., HARDCASTLE, A., BHATTACHARYA, S., RAO, P. N., PETTENATI, M. J., ANDERSON, R. E. & BAEHR, W. 1995. cDNA sequence and gene locus of the human retinal phosphoinositide-specific phospholipase-C beta 4 (PLCB4). Genomics, 29, 53-61.
ARCARO, A., VOLINIA, S., ZVELEBIL, M. J., STEIN, R., WATTON, S. J., LAYTON, M. J., GOUT, I., AHMADI, K., DOWNWARD, J. & WATERFIELD, M. D. 1998. Human phosphoinositide 3-kinase C2β, the role of calcium and the C2 domain in enzyme activity. Journal of Biological Chemistry, 273, 33082-33090.
ARMANIA, N., YAZAN, L. S., MUSA, S. N., ISMAIL, I. S., FOO, J. B., CHAN, K. W., NOREEN, H., HISYAM, A. H., ZULFAHMI, S. & ISMAIL, M. 2013. Dillenia suffruticosa exhibited antioxidant and cytotoxic activity through induction of apoptosis and G2/M cell cycle arrest. Journal of Ethnopharmacology, 146, 525-535.
ASLAN, J. E., BAKER, S. M., LOREN, C. P., HALEY, K. M., ITAKURA, A., PANG, J., GREENBERG, D. L., DAVID, L. L., MANSER, E., CHERNOFF, J. & MCCARTY, O. J. 2013. The PAK system links Rho GTPase signaling to thrombin-mediated platelet activation. Am J Physiol Cell Physiol, 305, C519-28.
ASLAN, J. E. & MCCARTY, O. J. 2013. Rho GTPases in platelet function. Journal of Thrombosis and Haemostasis, 11, 35-46.
ASMIS, L., TANNER, F. C., SUDANO, I., LÜSCHER, T. F. & CAMICI, G. G. 2010. DMSO inhibits human platelet activation through cyclooxygenase-1 inhibition. A novel agent for drug eluting stents? Biochemical and biophysical research communications, 391, 1629-1633.
BAGALKOTKAR, G., SAGINEEDU, S., SAAD, M. & STANSLAS, J. 2006. Phytochemicals from Phyllanthus niruri Linn. and their pharmacological properties: a review. Journal of pharmacy and pharmacology, 58, 1559-1570.
BALLESTER, R., MARCHUK, D., BOGUSKI, M., SAULINO, A., LETCHER, R., WIGLER, M. & COLLINS, F. 1990. The NF1 locus encodes a protein functionally related to mammalian GAP and yeast IRA proteins. Cell, 63, 851-859.

294
BASCO, L. K., MITAKU, S., SKALTSOUNIS, A.-L., RAVELOMANANTSOA, N., TILLEQUIN, F., KOCH, M. & LE BRAS, J. 1994. In vitro activities of furoquinoline and acridone alkaloids against Plasmodium falciparum. Antimicrobial agents and chemotherapy, 38, 1169-1171.
BASTOS-AMADOR, P., ROYO, F., GONZALEZ, E., CONDE-VANCELLS, J., PALOMO-DIEZ, L., BORRAS, F. E. & FALCON-PEREZ, J. M. 2012. Proteomic analysis of microvesicles from plasma of healthy donors reveals high individual variability. Journal of proteomics, 75, 3574-3584.
BATISTA, R., DE JESUS SILVA JÚNIOR, A. & DE OLIVEIRA, A. B. 2009. Plant-derived antimalarial agents: new leads and efficient phytomedicines. Part II. Non-alkaloidal natural products. Molecules, 14, 3037-3072.
BECKER, W. M., KLEINSMITH, L. J. & HARDIN, J. 2003. The World of the Cell, Benjamin/Cummings Publishing Company.
BEDNAR, B., CONDRA, C., GOULD, R. J. & CONNOLLY, T. M. 1995. Platelet aggregation monitored in a 96 well microplate reader is useful for evaluation of platelet agonists and antagonists. Thrombosis research, 77, 453-463.
BENNETT, J., BERGER, B. & BILLINGS, P. 2009. The structure and function of platelet integrins. Journal of Thrombosis and Haemostasis, 7, 200-205.
BERGER, J. M., GAMBLIN, S. J., HARRISON, S. C. & WANG, J. C. 1996. Structure and mechanism of DNA topoisomerase II. Nature, 379, 225-232.
BERRIDGE, M. J., BOOTMAN, M. D. & RODERICK, H. L. 2003. Calcium signalling: dynamics, homeostasis and remodelling. Nat Rev Mol Cell Biol, 4, 517-29.
BEST, D., PASQUET, S., LITTLEWOOD, T. J., BRUNSKILL, S. J., PALLISTER, C. J. & WATSON, S. P. 2001. Platelet activation via the collagen receptor GPVI is not altered in platelets from chronic myeloid leukaemia patients despite the presence of the constitutively phosphorylated adapter protein CrkL. Br J Haematol, 112, 609-15.
BHATTACHARJEE, R. & SIL, P. C. 2006. The protein fraction of Phyllanthus niruri plays a protective role against acetaminophen induced hepatic disorder via its antioxidant properties. Phytotherapy Research, 20, 595-601.
BLASCO, M. A., LEE, H.-W., HANDE, M. P., SAMPER, E., LANSDORP, P. M., DEPINHO, R. A. & GREIDER, C. W. 1997. Telomere Shortening and Tumor Formation by Mouse Cells Lacking Telomerase RNA. Cell, 91, 25-34.
BOBZIN, S. C., YANG, S. & KASTEN, T. P. 2000. Application of liquid chromatography–nuclear magnetic resonance spectroscopy to the identification of natural products. Journal of Chromatography B: Biomedical Sciences and Applications, 748, 259-267.
BOLEN, J., ROWLEY, R., SPANA, C. & TSYGANKOV, A. 1992. The Src family of tyrosine protein kinases in hemopoietic signal transduction. The FASEB Journal, 6, 3403-3409.
BORN, G. & CROSS, M. 1963. The aggregation of blood platelets. The Journal of physiology, 168, 178-195.
BORN, G. & PATRONO, C. 2006. Antiplatelet drugs. British Journal of Pharmacology, 147, S241-S251.
BRASS, L., SHALLER, C. & BELMONTE, E. 1987. Inositol 1, 4, 5-triphosphate-induced granule secretion in platelets. Evidence that the activation of phospholipase C mediated by platelet thromboxane receptors involves a guanine nucleotide binding protein-dependent mechanism distinct from that of thrombin. Journal of Clinical Investigation, 79, 1269.
BRASS, L. F. 2003. Thrombin and Platelet Activation*. Chest, 124, 18S-25S.

295
BUCAR, F., WUBE, A. & SCHMID, M. 2013. Natural product isolation–how to get from biological material to pure compounds. Natural product reports, 30, 525-545.
CALDERWOOD, D. A., SHATTIL, S. J. & GINSBERG, M. H. 2000. Integrins and actin filaments: reciprocal regulation of cell adhesion and signaling. Journal of Biological Chemistry, 275, 22607-22610.
CALIXTO, J. B., SANTOS, A., CECHINEL, F. V. & YUNES, R. A. 1998. A review of the plants of the genus Phyllanthus: their chemistry, pharmacology, and therapeutic potential. Medicinal research reviews, 18, 225.
CAMPOS, A. H. & SCHOR, N. 1999. Phyllanthus niruri inhibits calcium oxalate endocytosis by renal tubular cells: its role in urolithiasis. Nephron, 81, 393-397.
CASTEDO, M., PERFETTINI, J., ROUMIER, T. & KROEMER, G. 2002. Cyclin-dependent kinase-1: linking apoptosis to cell cycle and mitotic catastrophe. Cell death and differentiation, 9, 1287-1293.
CATIMEL, B., PARMENTIER, S., LEUNG, L. L. & MCGREGOR, J. L. 1991. Separation of important new platelet glycoproteins (GPIa, GPIc, GPIc*, GPIIa and GMP-140) by f.p.l.c. Characterization by monoclonal antibodies and gas-phase sequencing. Biochem J, 279 ( Pt 2), 419-25.
CATTANEO, M. & GACHET, C. 1999. ADP receptors and clinical bleeding disorders. Arteriosclerosis, thrombosis, and vascular biology, 19, 2281-2285.
CHARO, I. F., FEINMAN, R. D. & DETWILER, T. C. 1977. Interrelations of platelet aggregation and secretion. Journal of Clinical Investigation, 60, 866.
CHEN, K., RONDINA, M. T. & WEYRICH, A. S. 2013. A Sticky Story for Signal Transducer and Activator of Transcription 3 in Platelets. Circulation, 127, 421-423.
CHEN, Z., HU, M. & SHIVDASANI, R. A. 2007. Expression analysis of primary mouse megakaryocyte differentiation and its application in identifying stage-specific molecular markers and a novel transcriptional target of NF-E2. Blood, 109, 1451-9.
CIMANGA, R. K., TONA, L., LUYINDULA, N., MESIA, K., LUSAKIBANZA, M., MUSUAMBA, C. T., APERS, S., BRUYNE, T. D., MIERT, S. V., HERMANS, N., TOTTÉ, J., PIETERS, L. & VLIETINCK, A. J. 2004. In vitro antiplasmodial activity of callus culture extracts and fractions from fresh apical stems of Phyllanthus niruri L. (Euphorbiaceae): part 2. Journal of Ethnopharmacology, 95, 399-404.
CLAESON, P., GÖRANSSON, U., JOHANSSON, S., LUIJENDIJK, T. & BOHLIN, L. 1998. Fractionation protocol for the isolation of polypeptides from plant biomass. Journal of natural products, 61, 77-81.
CLARK, I. & COWDEN, W. 1999. Why is the pathology of falciparum worse than that of vivax malaria? Parasitology Today, 15, 458-461.
CLARK, I. A. & SCHOFIELD, L. 2000. Pathogenesis of Malaria. Parasitology Today, 16, 451-454.
CLIFFTON, E., AGOSTINO, D. & GIROLAMI, A. 1965. Prevention of traumatic bleeding by ellagic acid in rats. Experimental Biology and Medicine, 120, 179-180.
COATES, J. 2000. Interpretation of infrared spectra, a practical approach. Encyclopedia of analytical chemistry.
COLLINS, K., JACKS, T. & PAVLETICH, N. P. 1997. The cell cycle and cancer. Proceedings of the National Academy of Sciences, 94, 2776-2778.
COLOGNATO, H. & YURCHENCO, P. D. 2000. Form and function: the laminin family of heterotrimers. Dev Dyn, 218, 213-34.
COLOMBO, R., DE L BATISTA, A. N., TELES, H. L., SILVA, G. H., BOMFIM, G. C. C., BURGOS, R. C. R., CAVALHEIRO, A. J., DA SILVA BOLZANI, V., SILVA, D. H. S. & PELÍCIA, C. R. 2009. Validated

296
HPLC method for the standardization of Phyllanthus niruri (herb and commercial extracts) using corilagin as a phytochemical marker. Biomedical Chromatography, 23, 573-580.
COPPINGER, J. A., CAGNEY, G., TOOMEY, S., KISLINGER, T., BELTON, O., MCREDMOND, J. P., CAHILL, D. J., EMILI, A., FITZGERALD, D. J. & MAGUIRE, P. B. 2004. Characterization of the proteins released from activated platelets leads to localization of novel platelet proteins in human atherosclerotic lesions. Blood, 103, 2096-2104.
CORY, S. & ADAMS, J. M. 2002. The Bcl2 family: regulators of the cellular life-or-death switch. Nat Rev Cancer, 2, 647-656.
CRAGG, G. M., NEWMAN, D. J. & SNADER, K. M. 1997. Natural products in drug discovery and development. Journal of natural products, 60, 52-60.
CRANMER, S. L. & JACKSON, S. P. 2003. GPIb, filamin, and platelet activation: a view from within. Blood, 102, 1937-1937.
CROWELL, P. L., CHANG, R. R., REN, Z., ELSON, C. E. & GOULD, M. N. 1991. Selective inhibition of isoprenylation of 21-26-kDa proteins by the anticarcinogen d-limonene and its metabolites. Journal of Biological Chemistry, 266, 17679-17685.
DA VIOLANTE, G., ZERROUK, N., RICHARD, I., PROVOT, G., CHAUMEIL, J. C. & ARNAUD, P. 2002. Evaluation of the cytotoxicity effect of dimethyl sulfoxide (DMSO) on Caco2/TC7 colon tumor cell cultures. Biological and pharmaceutical bulletin, 25, 1600-1603.
DAMAS, J. & REMACLE-VOLON, G. 1987. The thrombopenic effect of ellagic acid in the rat. another model of platelet stimulation “in vivo”. Thrombosis Research, 45, 153-163.
DARZYNKIEWICZ, Z., BRUNO, S., DEL BINO, G., GORCZYCA, W., HOTZ, M., LASSOTA, P. & TRAGANOS, F. 1992. Features of apoptotic cells measured by flow cytometry. Cytometry, 13, 795-808.
DE ARAÚJO JÚNIOR, R. F., DE SOUZA, T. P., PIRES, J. G. L., SOARES, L. A. L., DE ARAÚJO, A. A., PETROVICK, P. R., MÂCEDO, H. D. O., DE SÁ LEITÃO, A. L. C. & GUERRA, G. C. B. 2012. A dry extract of Phyllanthus niruri protects normal cells and induces apoptosis in human liver carcinoma cells. Experimental Biology and Medicine, 237, 1281-1288.
DE SOUZA, T. P., HOLZSCHUH, M. H., LIONÇO, M. I., GONZÁLEZ ORTEGA, G. & PETROVICK, P. R. 2002. Validation of a LC method for the analysis of phenolic compounds from aqueous extract of Phyllanthus niruri aerial parts. Journal of Pharmaceutical and Biomedical Analysis, 30, 351-356.
DEL PRINCIPE, D., MENICHELLI, A., DE MATTEIS, W., DI GIULIO, S., GIORDANI, M., SAVINI, I. & AGRO, A. F. 1991. Hydrogen peroxide is an intermediate in the platelet activation cascade triggered by collagen, but not by thrombin. Thromb Res, 62, 365-75.
DENT, J., KATO, K., PENG, X. R., MARTINEZ, C., CATTANEO, M., POUJOL, C., NURDEN, P., NURDEN, A., TRIMBLE, W. S. & WARE, J. 2002. A prototypic platelet septin and its participation in secretion. Proc Natl Acad Sci U S A, 99, 3064-9.
DEVITA, V. T. L. T. S. R. S. A. 2011. Cancer : principles & practice of oncology : primer of the molecular biology of cancer, Philadelphia, Wolters Kluwer Health/Lippincott Williams & Wilkins.
DIAS, D. A., URBAN, S. & ROESSNER, U. 2012. A historical overview of natural products in drug discovery. Metabolites, 2, 303-336.
DITTRICH, M., BIRSCHMANN, I., MIETNER, S., SICKMANN, A., WALTER, U. & DANDEKAR, T. 2008. Platelet Protein Interactions Map, Signaling Components, and Phosphorylation Groundstate. Arteriosclerosis, thrombosis, and vascular biology, 28, 1326-1331.

297
DONG, X.-R., LUO, M., FAN, L., ZHANG, T., LIU, L., DONG, J.-H. & WU, G. 2010. Corilagin inhibits the double strand break-triggered NF-κB pathway in irradiated microglial cells. International journal of molecular medicine, 25, 531.
DOOLAN, D. L. 2002. Malaria methods and protocols, Springer.
DORSAM, R. T. & KUNAPULI, S. P. 2004. Central role of the P2Y 12 receptor in platelet activation. Journal of Clinical Investigation, 113, 340-345.
DOYLE, V. M. & RÜEGG, U. T. 1985. Lack of evidence for voltage dependent calcium channels on platelets. Biochemical and Biophysical Research Communications, 127, 161-167.
DUAN, W., YU, Y. & ZHANG, L. 2005. Antiatherogenic effects of phyllanthus emblica associated with corilagin and its analogue. Yakugaku Zasshi, 125, 587-591.
EH, E. K., AL-AJMI, M. & AL-BEKAIRI, A. 2003. Some Cardiovascular Effects Of The Dethymoquinonated Nigella Sativa Volatile Oil And Its Major Components Α-Pinene And P-Cymene In Rats. Saudi Pharmaceutical Journal, 11.
ELFAHMI, S. B., KOULMAN, A., HACKL, T., BOS, R., KAYSER, O., WOERDENBAG, H. & QUAX, W. 2006. Lignans from cell suspension cultures of Phyllanthus niruri, an Indonesian medicinal plant. J. Nat. Prod, 69, 55-58.
EPSTEIN, E. 2001. Chapter 1 Silicon in plants: Facts vs. concepts. In: L.E. DATNOFF, G. H. S. & KORNDÖRFER, G. H. (eds.) Studies in Plant Science. Elsevier.
EVANS, W. C., EVANS, D. & TREASE, G. E. 2009. Trease and Evans Pharmacognosy, Saunders/Elsevier.
EZUMI, Y., SHINDOH, K., TSUJI, M. & TAKAYAMA, H. 1998. Physical and functional association of the Src family kinases Fyn and Lyn with the collagen receptor glycoprotein VI-Fc receptor γ chain complex on human platelets. The Journal of experimental medicine, 188, 267-276.
FABRICANT, D. S. & FARNSWORTH, N. R. 2001. The value of plants used in traditional medicine for drug discovery. Environmental health perspectives, 109, 69.
FLEVARIS, P., LI, Z., ZHANG, G., ZHENG, Y., LIU, J. & DU, X. 2009. Two distinct roles of mitogen-activated protein kinases in platelets and a novel Rac1-MAPK-dependent integrin outside-in retractile signaling pathway. Blood, 113, 893-901.
FREEDMAN, J. E., LOSCALZO, J., BARNARD, M. R., ALPERT, C., KEANEY, J. & MICHELSON, A. D. 1997. Nitric oxide released from activated platelets inhibits platelet recruitment. Journal of Clinical Investigation, 100, 350.
FREITAS, A., SCHOR, N. & BOIM, M. 2002. The effect of Phyllanthus niruri on urinary inhibitors of calcium oxalate crystallization and other factors associated with renal stone formation. BJU international, 89, 829-834.
FÜLLBECK, M., MICHALSKY, E., DUNKEL, M. & PREISSNER, R. 2006. Natural products: sources and databases. Natural product reports, 23, 347-356.
GAGNON, A. W., MURRAY, D. L. & LEADLEY, R. J. 2002. Cloning and characterization of a novel regulator of G protein signalling in human platelets. Cell Signal, 14, 595-606.
GAMBARI, R., BORGATTI, M., LAMPRONTI, I., FABBRI, E., BROGNARA, E., BIANCHI, N., PICCAGLI, L., YUEN, M. C.-W., KAN, C.-W. & HAU, D. K.-P. 2012. Corilagin is a potent inhibitor of NF-kappaB activity and downregulates TNF-alpha induced expression of IL-8 gene in cystic fibrosis IB3-1 cells. International immunopharmacology, 13, 308-315.
GARCÍA, A., PRABHAKAR, S., BROCK, C. J., PEARCE, A. C., DWEK, R. A., WATSON, S. P., HEBESTREIT, H. F. & ZITZMANN, N. 2004. Extensive analysis of the human platelet proteome by two‐dimensional gel electrophoresis and mass spectrometry. Proteomics, 4, 656-668.

298
GAUR, D. & CHITNIS, C. E. 2011. Molecular interactions and signaling mechanisms during erythrocyte invasion by malaria parasites. Current Opinion in Microbiology, 14, 422-428.
GAUR, D., MAYER, D. C. & MILLER, L. H. 2004. Parasite ligand-host receptor interactions during invasion of erythrocytes by Plasmodium merozoites. Int J Parasitol, 34, 1413-29.
GEAR, A. R., SIMON, C. G. & POLANOWSKA-GRABOWSKA, R. 1997. Platelet adhesion to collagen activates a phosphoprotein complex of heat-shock proteins and protein phosphatase 1. J Neural Transm, 104, 1037-47.
GEORGE, J. N. 2000. Platelet. The Lancet, 355, 1531-39.
GESCHER, A., PASTORINO, U., PLUMMER, S. M. & MANSON, M. M. 1998. Suppression of tumour development by substances derived from the diet—mechanisms and clinical implications. British Journal of Clinical Pharmacology, 45, 1-12.
GIACINTI, C. & GIORDANO, A. 2006. RB and cell cycle progression. Oncogene, 25, 5220-7.
GOLOTVIN, S. S., VODOPIANOV, E., LEFEBVRE, B. A., WILLIAMS, A. J. & SPITZER, T. D. 2006. Automated structure verification based on 1H NMR prediction. Magnetic Resonance in Chemistry, 44, 524-538.
GOMEZ, J. F., BRIOSO, M. A., MACHADO, J. D., SANCHEZ, J. L. & BORGES, R. 2002. New approaches for analysis of amperometrical recordings. Ann N Y Acad Sci, 971, 647-54.
HADFIELD, J. A., DUCKI, S., HIRST, N. & MCGOWN, A. T. 2003. Tubulin and microtubules as targets for anticancer drugs. Progress in cell cycle research, 5, 309-325.
HAJEK, A. S. & JOIST, J. H. 1992. Platelet insulin receptor. Methods in enzymology, 215, 398-403.
HANAHAN, D. & WEINBERG, R. A. 2011. Hallmarks of cancer: the next generation. Cell, 144, 646-674.
HANDA, S. 2008. An Overview of Extraction Techniques for Medicinal and Aromatic Plants. In: HANDA, S. S., KHANUJA, S. P. S., LONGO, G. & RAKESH, D. D. (eds.) Extraction Technologies for Medicinal and Aromatic Plants. Trieste: International Centre for Science and High Technology.
HANDE, K. 1998. Etoposide: four decades of development of a topoisomerase II inhibitor. European Journal of Cancer, 34, 1514-1521.
HANDE, K. R. 2008. Topoisomerase II inhibitors. Update on Cancer Therapeutics, 3, 13-26.
HARBORNE, J. 1998. Phytochemical Methods, A guide to modern Techniques of plant analysis. Science.
HARIKUMAR, K. B., KUTTAN, G. & KUTTAN, R. 2009. Phyllanthus amarus inhibits cell growth and induces apoptosis in Dalton's lymphoma ascites cells through activation of caspase-3 and downregulation of Bcl-2. Integr Cancer Ther, 8, 190-4.
HARTWELL, L. H. & WEINERT, T. A. 1989. Checkpoints: controls that ensure the order of cell cycle events. Science, 246, 629-634.
HASKÓ, G., LINDEN, J., CRONSTEIN, B. & PACHER, P. 2008. Adenosine receptors: therapeutic aspects for inflammatory and immune diseases. Nature Reviews Drug Discovery, 7, 759-770.
HASTINGS, J., DE MATOS, P., DEKKER, A., ENNIS, M., HARSHA, B., KALE, N., MUTHUKRISHNAN, V., OWEN, G., TURNER, S. & WILLIAMS, M. 2013. The ChEBI reference database and ontology for biologically relevant chemistry: enhancements for 2013. Nucleic acids research, 41, D456-D463.

299
HAU, D. K.-P., ZHU, G.-Y., LEUNG, A. K.-M., WONG, R. S.-M., CHENG, G. Y.-M., LAI, P. B.-S., TONG, S.-W., LAU, F.-Y., CHAN, K.-W. & WONG, W.-Y. 2010. In vivo anti-tumour activity of corilagin on Hep3B hepatocellular carcinoma. Phytomedicine, 18, 11-15.
HAYASHI, A., SEKI, N., HATTORI, A., KOZUMA, S. & SAITO, T. 1999. PKCν, a new member of the protein kinase C family, composes a fourth subfamily with PKCμ1. Biochimica et Biophysica Acta (BBA) - Molecular Cell Research, 1450, 99-106.
HEGDE, U. 1992. Platelet antibodies in immune thrombocytopenia. Blood reviews, 6, 34-42.
HEIJNEN, H. F., SCHIEL, A. E., FIJNHEER, R., GEUZE, H. J. & SIXMA, J. J. 1999. Activated Platelets Release Two Types of Membrane Vesicles: Microvesicles by Surface Shedding and Exosomes Derived From Exocytosis of Multivesicular Bodies and α-Granules. Blood, 94, 3791-3799.
HOFFBRAND, A. V. & MOSS, P. 2011. Essential haematology, Wiley-Blackwell.
HOLMSEN, H. 1985. Platelet metabolism and activation. Semin Hematol, 22, 219-40.
HONDA, S., SHIROTANI-IKEJIMA, H., TADOKORO, S., TOMIYAMA, Y. & MIYATA, T. 2013. The integrin-linked kinase-PINCH-parvin complex supports integrin αIIbβ3 activation. PloS one, 8, e85498.
HONGXIANG, W., YUEWEI, D., YI, L., YUGAO, P., LI, W. & ZHIQIANG, S. 2009. Effects of corilagin on platelet-neutrophil interaction. Pharmacology and Clinics of Chinese Materia Medica, 4, 010.
HOSTETTMANN, K., HOSTETTMANN, M. & MARSTON, A. 1986. Preparative Chromatography Technique, Berlin, Springer-Verlag.
HOWARD, A. & PELC, S. 1951. Nuclear incorporation of P32 as demonstrated by autoradiographs. Experimental Cell Research, 2, 178-187.
HU, H., FORSLUND, M. & LI, N. 2005. Influence of extracellular calcium on single platelet activation as measured by whole blood flow cytometry. Thrombosis research, 116, 241-247.
HUANG, D. W., SHERMAN, B. T. & LEMPICKI, R. A. 2009. Bioinformatics enrichment tools: paths toward the comprehensive functional analysis of large gene lists. Nucleic acids research, 37, 1-13.
HUANG, M. M., BOLEN, J. B., BARNWELL, J. W., SHATTIL, S. J. & BRUGGE, J. S. 1991. Membrane glycoprotein IV (CD36) is physically associated with the Fyn, Lyn, and Yes protein-tyrosine kinases in human platelets. Proc Natl Acad Sci U S A, 88, 7844-8.
HUANG, R. L., HUANG, Y. L., OU, J. C., CHEN, C. C., HSU, F. L. & CHANG, C. 2003. Screening of 25 compounds isolated from Phyllanthus species for anti‐human hepatitis B virus in vitro. Phytotherapy Research, 17, 449-453.
HUANG, S.-T., YANG, R.-C., CHEN, M.-Y. & PANG, J.-H. S. 2004. Phyllanthus urinaria induces the Fas receptor/ligand expression and ceramide-mediated apoptosis in HL-60 cells. Life Sciences, 75, 339-351.
HUIPING, C., SIGURGEIRSDOTTIR, J., JONASSON, J., EIRIKSDOTTIR, G., JOHANNSDOTTIR, J., EGILSSON, V. & INGVARSSON, S. 1999. Chromosome alterations and E-cadherin gene mutations in human lobular breast cancer. British journal of cancer, 81, 1103.
HWANG, H. C. & CLURMAN, B. E. 2005. Cyclin E in normal and neoplastic cell cycles. Oncogene, 24, 2776-2786.
HWANG, J. I., OH, Y. S., SHIN, K. J., KIM, H., RYU, S. H. & SUH, P. G. 2005. Molecular cloning and characterization of a novel phospholipase C, PLC-eta. Biochem J, 389, 181-6.
HYDE, J. E. 1993. Protocols in molecular parasitology, Springer.

300
IIZUKA, T., MORIYAMA, H. & NAGAI, M. 2006. Vasorelaxant effects of methyl brevifolincarboxylate from the leaves of Phyllanthus niruri. Biological & pharmaceutical bulletin, 29, 177-179.
IIZUKA, T., NAGAI, M., TANIGUCHI, A., MORIYAMA, H. & HOSHI, K. 2007. Inhibitory effects of methyl brevifolincarboxylate isolated from Phyllanthus niruri L. on platelet aggregation. Biological & pharmaceutical bulletin, 30, 382-384.
IKEDA, Y. & STEINER, M. 1979. Phosphylation and protein kinase activity of platelet tubulin. Journal of Biological Chemistry, 254, 66-74.
INOUE, O., SUZUKI-INOUE, K., MCCARTY, O. J., MOROI, M., RUGGERI, Z. M., KUNICKI, T. J., OZAKI, Y. & WATSON, S. P. 2006. Laminin stimulates spreading of platelets through integrin alpha6beta1-dependent activation of GPVI. Blood, 107, 1405-12.
ISHIMARU, K., YOSHIMATSU, K., YAMAKAWA, T., KAMADA, H. & SHIMOMURA, K. 1992. Phenolic constituents in tissue cultures of Phyllanthus niruri. Phytochemistry, 31, 2015-2018.
ISRAELS, S. J., GERRARD, J. M., JACQUES, Y. V., MCNICOL, A., CHAM, B., NISHIBORI, M. & BAINTON, D. F. 1992. Platelet dense granule membranes contain both granulophysin and P-selectin (GMP-140). Blood, 80, 143-52.
ITOH, T. J. & HOTANI, H. 1994. Microtubule-stabilizing activity of microtubule-associated proteins (MAPs) is due to increase in frequency of rescue in dynamic instability: shortening length decreases with binding of MAPs onto microtubules. Cell structure and function, 19, 279-290.
JAKI, B. U., FRANZBLAU, S. G., CHADWICK, L. R., LANKIN, D. C., ZHANG, F., WANG, Y. & PAULI, G. F. 2008. Purity−Activity Relationships of Natural Products: The Case of Anti-TB Active Ursolic Acid. Journal of Natural Products, 71, 1742-1748.
JANBAZ, K. H., SAEED, S. A. & GILANI, A. H. 2002. Protective effect of rutin on paracetamol-and CCl-4-induced hepatotoxicity in rodents. Fitoterapia, 73, 557-563.
JANSSEN, K., MENSINK, R. P., COX, F., HARRYVAN, J. L., HOVENIER, R., HOLLMAN, P. & KATAN, M. B. 1998. Effects of the flavonoids quercetin and apigenin on hemostasis in healthy volunteers: results from an in vitro and a dietary supplement study. The American journal of clinical nutrition, 67, 255-262.
JENNINGS, L. K. 2009. Mechanisms of platelet activation: need for new strategies to protect against platelet-mediated atherothrombosis. Thromb Haemost, 102, 248-257.
JIKAI, L., YUE, H., HENKEL, T. & WEBER, K. 2002. One Step Purification of Corilagin and Ellagic Acid from Phyllanthus urinaria using High-Speed Countercurrent Chromatography. Phytochemical Analysis, 13, 1-3.
JIN, J., DANIEL, J. L. & KUNAPULI, S. P. 1998. Molecular basis for ADP-induced platelet activation. Journal of Biological Chemistry, 273, 2030-2034.
JORDAN, M. A. & WILSON, L. 2004. Microtubules as a target for anticancer drugs. Nature Reviews Cancer, 4, 253-265.
JOSHI, B. S., GAWAD, D. H., PELLETIER, S. W., KARTHA, G. & BHANDARY, K. 1986. Isolation and structure (X-ray analysis) of ent-norsecurinine, an alkaloid from Phyllanthus niruri. Journal of natural products, 49, 614-620.
JURK, K. & KEHREL, B. E. Platelets: physiology and biochemistry. 2005. New York: Stratton Intercontinental Medical Book Corporation, c1974-, 381-392.
KALE KUMUD, U., PARAG, D. & VIVEK, C. 2001. Isolation and estimation of an Antihepatotoxic compound Phyllanthin from Phyllanthus niruri by HPLC. Indian Drugs-Bombay, 38, 303-306.

301
KANG, S. W., WAHL, M. I., CHU, J., KITAURA, J., KAWAKAMI, Y., KATO, R. M., TABUCHI, R., TARAKHOVSKY, A., KAWAKAMI, T., TURCK, C. W., WITTE, O. N. & RAWLINGS, D. J. 2001. PKCbeta modulates antigen receptor signaling via regulation of Btk membrane localization. Embo j, 20, 5692-702.
KARL, S., WONG, R. P., ST PIERRE, T. G. & DAVIS, T. M. 2009. A comparative study of a flow-cytometry-based assessment of in vitro Plasmodium falciparum drug sensitivity. Malaria journal, 8, 294.
KASSUYA, C. A. L., SILVESTRE, A., MENEZES-DE-LIMA JR, O., MAROTTA, D. M., REHDER, V. L. G. & CALIXTO, J. B. 2006. Antiinflammatory and antiallodynic actions of the lignan niranthin isolated from Phyllanthus amarus: Evidence for interaction with platelet activating factor receptor. European Journal of Pharmacology, 546, 182-188.
KASTAN, M. B. & BARTEK, J. 2004. Cell-cycle checkpoints and cancer. Nature, 432, 316-323.
KELTON, J. G., SHERIDAN, D., SANTOS, A., SMITH, J., STEEVES, K., SMITH, C., BROWN, C. & MURPHY, W. G. 1988. Heparin-induced thrombocytopenia: laboratory studies. Blood, 72, 925-930.
KHANNA, A., RIZVI, F. & CHANDER, R. 2002. Lipid lowering activity of Phyllanthus niruri in hyperlipemic rats. Journal of ethnopharmacology, 82, 19-22.
KHATOON, S., RAI, V., RAWAT, A. K. S. & MEHROTRA, S. 2006. Comparative pharmacognostic studies of three Phyllanthus species. Journal of ethnopharmacology, 104, 79-86.
KINOSHITA, S., INOUE, Y., NAKAMA, S., ICHIBA, T. & ANIYA, Y. 2007. Antioxidant and hepatoprotective actions of medicinal herb, Terminalia catappa L. from Okinawa Island and its tannin corilagin. Phytomedicine, 14, 755-62.
KOLB, N. 1999. Microbiological status of untreated herbal materials [Online]. Hamburg, Germany: The European Herbal Infusions Association. Available: http://www.ehia-online.org/fileadmin/EHIA/publications/Microbiological_Status_of_Untreated_Herbal_Materials.pdf.
KRAMER, R. M., ROBERTS, E. F., UM, S. L., BÖRSCH-HAUBOLD, A. G., WATSON, S. P., FISHER, M. J. & JAKUBOWSKI, J. A. 1996. p38 mitogen-activated protein kinase phosphorylates cytosolic phospholipase A2 (cPLA2) in thrombin-stimulated platelets Evidence that proline-directed phosphorylation is not required for mobilization of arachidonic acid by cPLA2. Journal of Biological Chemistry, 271, 27723-27729.
LARSEN, J. E., GOVINDAN, R. & MINNA, J. D. 2015. Molecular Basis of Lung Cancer. In: MENDELSOHN, J., HOWLEY, P. M., ISRAEL, M. A., GRAY, J. W. & THOMPSON, C. B. (eds.) The Molecular Basis of Cancer Philadelphia: Elsevier Health Sciences.
LATIF, Z. 2005. Isolation by Preparative High-Performance Liquid Chromatography. Natural Products Isolation. Springer.
LEE, H. K., YEO, S., KIM, J. S., LEE, J. G., BAE, Y. S., LEE, C. & BAEK, S. H. 2010. Protein kinase C-eta and phospholipase D2 pathway regulates foam cell formation via regulator of G protein signaling 2. Mol Pharmacol, 78, 478-85.
LEE, S. H., JAGANATH, I. B., WANG, S. M. & SEKARAN, S. D. 2011. Antimetastatic effects of Phyllanthus on human lung (A549) and breast (MCF-7) cancer cell lines. PloS one, 6, e20994.
LEE, T.-J., KIM, O. H., KIM, Y. H., LIM, J. H., KIM, S., PARK, J.-W. & KWON, T. K. 2006. Quercetin arrests G2/M phase and induces caspase-dependent cell death in U937 cells. Cancer Letters, 240, 234-242.
LEGATE, K. R., MONTANEZ, E., KUDLACEK, O. & FUSSLER, R. 2006. ILK, PINCH and parvin: the tIPP of integrin signalling. Nat Rev Mol Cell Biol, 7, 20-31.

302
LEHNE, G. 2000. P-glycoprotein as a drug target in the treatment of multidrug resistant cancer. Curr Drug Targets, 1, 85-99.
LEITE, D. F., KASSUYA, C. A., MAZZUCO, T. L., SILVESTRE, A., DE MELO, L. V., REHDER, V. L., RUMJANEK, V. M. & CALIXTO, J. B. 2006. The cytotoxic effect and the multidrug resistance reversing action of lignans from Phyllanthus amarus. Planta Med, 72, 1353-8.
LEMKIN, P. F. & THORNWALL, G. 1999. Flicker image comparison of 2-D gel images for putative protein identification using the 2DWG meta-database. Mol Biotechnol, 12, 159-72.
LEMMON, M. & FERGUSON, K. 2000. Signal-dependent membrane targeting by pleckstrin homology (PH) domains. Biochem. J, 350, 1-18.
LEVIN, Y., SCHWARZ, E., WANG, L., LEWEKE, F. M. & BAHN, S. 2007. Label‐free LC‐MS/MS quantitative proteomics for large‐scale biomarker discovery in complex samples. Journal of separation science, 30, 2198-2203.
LEWANDROWSKI, U., MOEBIUS, J., WALTER, U. & SICKMANN, A. 2006. Elucidation of N-glycosylation sites on human platelet proteins: a glycoproteomic approach. Mol Cell Proteomics, 5, 226-33.
LI, H., WANG, Z. & LIU, Y. 2003. Review in the studies on tannins activity of cancer prevention and anticancer. Journal of Chinese medicinal materials, 26, 444-448.
LI, Z., DELANEY, M. K., O'BRIEN, K. A. & DU, X. 2010. Signaling during platelet adhesion and activation. Arteriosclerosis, thrombosis, and vascular biology, 30, 2341-2349.
LIU, X. & CHU, K. M. 2014. E-cadherin and gastric cancer: cause, consequence, and applications. Biomed Res Int, 2014, 637308.
LODISH, H. 2008. Molecular Cell Biology, W. H. Freeman.
LU, H., ZHANG, Z.-B. & FU, X.-G. 2005. The Primary Study on the Inhibition Effect of Corilagin on Human Pancreatic Cancer Cell Line Bxpc-3 Cells. Journal of Jinzhou Medical College, 3, 011.
LU, J.-J., BAO, J.-L., CHEN, X.-P., HUANG, M. & WANG, Y.-T. 2012. Alkaloids isolated from natural herbs as the anticancer agents. Evidence-Based Complementary and Alternative Medicine, 2012.
MACLEOD, K. G. & LANDON, S. P. 2004. Essential techniques of cancer cell culture. In: LANDON, S. P. (ed.) Cancer cell culture: Methods and Protocols. New Jersey: Humana Press Inc.
MÁJEK, P., REICHELTOVÁ, Z., ŠTIKAROVÁ, J., SUTTNAR, J., SOBOTKOVÁ, A. & DYR, J. E. 2010. Proteome changes in platelets activated by arachidonic acid, collagen, and thrombin. Proteome Science, 8, 56.
MALMBERG, C. & MARYOTT, A. 1956. Dielectric Constant of Water from 00 to 1000 C.
MANJREKAR, A., JISHA, V., BAG, P., ADHIKARY, B., PAI, M., HEGDE, A. & NANDINI, M. 2008. Effect of Phyllanthus niruri Linn. treatment on liver, kidney and testes in CCl4 induced hepatotoxic rats. Indian J Exp Biol, 46, 514-20.
MARKOM, M., HASAN, M., DAUD, W. R. W., SINGH, H. & JAHIM, J. M. 2007. Extraction of hydrolysable tannins from Phyllanthus niruri Linn.: Effects of solvents and extraction methods. Separation and purification technology, 52, 487-496.
MARKOVIC, O. & MARKOVIC, N. 1998. Cell cross-contamination in cell cultures: the silent and neglected danger. In Vitro Cell Dev Biol Anim, 34, 1-8.
MATEI, D. E. & SCHILLER, G. Immune-Mediated Thrombocytopenia. 2002. ACVIM.

303
MAZER, B. D., SAWAMI, H., TORDAI, A. & GELFAND, E. W. 1992. Platelet-activating factor-mediated transmembrane signaling in human B lymphocytes is regulated through a pertussis-and cholera toxin-sensitive pathway. Journal of Clinical Investigation, 90, 759.
MCEVER, R. P., MOORE, K. L. & CUMMINGS, R. D. 1995. Leukocyte trafficking mediated by selectin-carbohydrate interactions. Journal of Biological Chemistry, 270, 11025-11028.
MELLINGER, C. G., CARBONERO, E. R., NOLETO, G. R., CIPRIANI, T. R., OLIVEIRA, M. B. M., GORIN, P. A. J. & IACOMINI, M. 2005. Chemical and Biological Properties of an Arabinogalactan from Phyllanthus n iruri. Journal of natural products, 68, 1479-1483.
MELLWIG, K. P. & JAKOBS, K. H. 1980. Inhibition of platelet adenylate cyclase by ADP. Thrombosis research, 18, 7-17.
MERTENS-TALCOTT, S. U., TALCOTT, S. T. & PERCIVAL, S. S. 2003. Low Concentrations of Quercetin and Ellagic Acid Synergistically Influence Proliferation, Cytotoxicity and Apoptosis in MOLT-4 Human Leukemia Cells–. The Journal of nutrition, 133, 2669-2674.
MI, H., MURUGANUJAN, A., CASAGRANDE, J. T. & THOMAS, P. D. 2013. Large-scale gene function analysis with the PANTHER classification system. Nat. Protocols, 8, 1551-1566.
MICHELSON, A. D., BENOIT, S. E., FURMAN, M. I., BRECKWOLDT, W. L., ROHRER, M. J., BARNARD, M. R. & LOSCALZO, J. 1996. Effects of nitric oxide/EDRF on platelet surface glycoproteins.
MILLER, L. H., BARUCH, D. I., MARSH, K. & DOUMBO, O. K. 2002. The pathogenic basis of malaria. Nature, 415, 673-679.
MILLS, J. J., CHARI, R. S., BOYER, I. J., GOULD, M. N. & JIRTLE, R. L. 1995. Induction of apoptosis in liver tumors by the monoterpene perillyl alcohol. Cancer research, 55, 979-983.
MING, Y., ZHENG, Z., CHEN, L., ZHENG, G., LIU, S., YU, Y. & TONG, Q. 2013. Corilagin inhibits hepatocellular carcinoma cell proliferation by inducing G2/M phase arrest. Cell biology international.
MIRVISH, S. S. 1975. BLOCKING THE FORMATION OF N-NITROSO COMPOUNDS WITH ASCORBIC ACID IN VITRO AND IN VIVO*. Annals of the New York Academy of Sciences, 258, 175-180.
MOON, S. Y. & ZHENG, Y. 2003. Rho GTPase-activating proteins in cell regulation. Trends in Cell Biology, 13, 13-22.
MORAN, N., KIERNAN, A., DUNNE, E., EDWARDS, R. J., SHIELDS, D. & KENNY, D. 2006. Monitoring modulators of platelet aggregation in a microtiter plate assay. Analytical biochemistry, 357, 77-84.
MORIYAMA, H., HOSOE, T., WAKANA, D., ITABASHI, T., KAWAI, K., IIZUKA, T., HOSHI, K., FUKUSHIMA, K. & LAU, F. C. 2009. Assay-guided Informatory Screening Method for Antiplatelet Effect of Adenosine Isolated from Malbranchea filamentosa IFM 41300: Inhibitory Behaviors of Adenosine in Different Solvents. Journal of health science, 55, 103-108.
MORIYAMA, H., IIZUKA, T., NAGAI, M., TERAZONO, M. & HOSHI, K. 2002. Antiplatelet Aggregating Activity of Extracts of Indonesian Medicinal Plants I. Natural Medicine, 56, 178-183.
MOSER, B. A. & RUSSELL, P. 2000. Cell cycle regulation in Schizosaccharomyces pombe. Curr Opin Microbiol, 3, 631-6.
MOSMANN, T. 1983. Rapid colorimetric assay for cellular growth and survival: Application to proliferation and cytotoxicity assays. Journal of Immunological Methods, 65, 55-63.
MULCHANDANI, N. & HASSARAJANI, S. 1984. 4-Methoxy-nor-Securinine, a New Alkaloid from Phyllanthus niruri. Planta medica, 50, 104-105.

304
MURAMBIWA, P., MASOLA, B., GOVENDER, T., MUKARATIRWA, S. & MUSABAYANE, C. T. 2011. Anti-malarial drug formulations and novel delivery systems: A review. Acta Tropica, 118, 71-79.
MURUGAIYAH, V. & CHAN, K. L. 2009. Mechanisms of antihyperuricemic effect of Phyllanthus niruri and its lignan constituents. Journal of ethnopharmacology, 124, 233-9.
MUSTOFA, SHOLIKHAH, E. N. & WAHYUONO, S. 2007. Antiplasmodial Activity of Fractions Isolated from Methanolic Extrac of Meniran Herb (Phyllanthus niruri L) traditionally Used to Treat Malaria. Berkala Ilmu Kedokteran, 39.
NAKAMURA, M., HONDA, Z., IZUMI, T., SAKANAKA, C., MUTOH, H., MINAMI, M., BITO, H., SEYAMA, Y., MATSUMOTO, T., NOMA, M. & ET AL. 1991. Molecular cloning and expression of platelet-activating factor receptor from human leukocytes. J Biol Chem, 266, 20400-5.
NAKWETI, R. K., NDIKU, S. L., DOUMAS, P., NKUNG, H. S., BAISSAC, Y., KANYANGA, R. C., NDOFUNSU, A. D., OTONO, F. B. & JAY-ALLEM, C. 2013. Phytochemical analysis of Phyllanthus niruri L.(Phyllanthaceae) extracts collected in four geographical areas in the Democratic Republic of the Congo. African Journal of Plant Science, 7, 9-20.
NATALE, M. 2011. Image analysis workflow for 2-D electrophoresis gels based on ImageJ. Proteomics Insights, 4, 37-49.
NAWWAR, M. A. M., HUSSEIN, S. A. M. & MERFORT, I. 1994. NMR spectral analysis of polyphenols from Punica granatum. Phytochemistry, 36, 793-798.
NEIVA, T., MORAIS, L., POLACK, M., SIMOES, C. & D’AMICO, E. 1999. Effects of catechins on human blood platelet aggregation and lipid peroxidation. Phytotherapy research, 13, 597-600.
NELSON, M., PATLAK, J., WORLEY, J. & STANDEN, N. 1990. Calcium channels, potassium channels, and voltage dependence of arterial smooth muscle tone. American Journal of Physiology-Cell Physiology, 259, C3-C18.
NEWMAN, D. J. & CRAGG, G. M. 2007. Natural Products as Sources of New Drugs over the Last 25 Years⊥. Journal of natural products, 70, 461-477.
NEWMAN, D. J. & CRAGG, G. M. 2012. Natural Products As Sources of New Drugs over the 30 Years from 1981 to 2010. Journal of Natural Products, 75, 311-335.
NISHIURA, J., CAMPOS, A., BOIM, M., HEILBERG, I. & SCHOR, N. 2004. Phyllanthus niruri normalizes elevated urinary calcium levels in calcium stone forming (CSF) patients. Urological research, 32, 362-366.
NOBILI, S., LIPPI, D., WITORT, E., DONNINI, M., BAUSI, L., MINI, E. & CAPACCIOLI, S. 2009. Natural compounds for cancer treatment and prevention. Pharmacological Research, 59, 365-378.
ODA, A., MIYAKAWA, Y., DRUKER, B. J., ISHIDA, A., OZAKI, K., OHASHI, H., WAKUI, M., HANDA, M., WATANABE, K., OKAMOTO, S. & IKEDA, Y. 1996. Crkl is constitutively tyrosine phosphorylated in platelets from chronic myelogenous leukemia patients and inducibly phosphorylated in normal platelets stimulated by thrombopoietin. Blood, 88, 4304-13.
OFFERMANNS, S. 2006a. Activation of platelet function through G protein-coupled receptors. Circ Res, 99, 1293-304.
OFFERMANNS, S. 2006b. Activation of platelet function through G protein–coupled receptors. Circulation research, 99, 1293-1304.
OGATA, T., HIGUCHI, H., MOCHIDA, S., MATSUMOTO, H., KATO, A., ENDO, T., KAJI, A. & KAJI, H. 1992. HIV-1 reverse transcriptase inhibitor from Phyllanthus niruri. AIDS research and human retroviruses, 8, 1937-1944.

305
OISHI, K., MUKAI, H., SHIBATA, H., TAKAHASHI, M. & ONA, Y. 1999. Identification and characterization of PKNbeta, a novel isoform of protein kinase PKN: expression and arachidonic acid dependency are different from those of PKNalpha. Biochem Biophys Res Commun, 261, 808-14.
OKABE, S., SUGANUMA, M., IMAYOSHI, Y., TANIGUCHI, S., YOSHIDA, T. & FUJIKI, H. 2001. New TNF-α releasing inhibitors, geraniin and corilagin, in leaves of Acer nikoense, Megusurino-ki. Biological and Pharmaceutical Bulletin, 24, 1145-1148.
OKOLI, C., EZIKE, A., AKAH, P., UDEGBUNAM, S., OKOYE, T., MBANU, T. & UGWU, E. 2009. Studies on Wound Healing and Antiulcer Activities of Extract of Aerial Parts of Phyllanthus niruri L. (Euphorbiaceae). American Journal of Pharmacology and Toxicology, 4, 118.
OKOLI, C., IBIAM, A., EZIKE, A., AKAH, P. & OKOYE, T. 2010. Evaluation of antidiabetic potentials of Phyllanthus niruri in alloxan diabetic rats. African Journal of Biotechnology, 9, 248-259.
OZAKI, Y., SATOH, K., YATOMI, Y., YAMAMOTO, T., SHIRASAWA, Y. & KUME, S. 1994. Detection of platelet aggregates with a particle counting method using light scattering. Analytical biochemistry, 218, 284-294.
PADUCH, R., KANDEFER-SZERSZEŃ, M., TRYTEK, M. & FIEDUREK, J. 2007. Terpenes: substances useful in human healthcare. Archivum immunologiae et therapiae experimentalis, 55, 315-327.
PAGANO, M., PEPPERKOK, R., VERDE, F., ANSORGE, W. & DRAETTA, G. 1992. Cyclin A is required at two points in the human cell cycle. EMBO J, 11, 961-71.
PARISE, L. V., VENTON, D. L. & LE BRETON, G. C. 1984. Arachidonic acid-induced platelet aggregation is mediated by a thromboxane A2/prostaglandin H2 receptor interaction. J Pharmacol Exp Ther, 228, 240-4.
PARK, H. M., LEE, J. H., YAOYAO, J., JUN, H. J. & LEE, S. J. 2011. Limonene, a natural cyclic terpene, is an agonistic ligand for adenosine A2A receptors. Biochemical and Biophysical Research Communications, 404, 345-348.
PAUL, S., FEOKTISTOV, I., HOLLISTER, A. S., ROBERTSON, D. & BIAGGIONI, I. 1990. Adenosine inhibits the rise in intracellular calcium and platelet aggregation produced by thrombin: evidence that both effects are coupled to adenylate cyclase. Mol Pharmacol, 37, 870-5.
PEERSCHKE, E. 1995. Regulation of platelet aggregation by post-fibrinogen binding events. Insights provided by dithiothreitol-treated platelets. Thrombosis and haemostasis, 73, 862-867.
PESTINA, T. I., STENBERG, P. E., DRUKER, B. J., STEWARD, S. A., HUTSON, N. K., BARRIE, R. J. & JACKSON, C. W. 1997. Identification of the Src family kinases, Lck and Fgr in platelets. Their tyrosine phosphorylation status and subcellular distribution compared with other Src family members. Arterioscler Thromb Vasc Biol, 17, 3278-85.
PETCHNAREE, P., BUNYAPRAPHATSARA, N., CORDELL, G. A., COWE, H. J., COX, P. J., HOWIE, R. A. & PATT, S. L. 1986. X-Ray crystal and molecular structure of nirurine, a novel alkaloid related to the securinega alkaloid skeleton, from Phyllanthus niruri (Euphorbiaceae). Journal of the Chemical Society, Perkin Transactions 1, 1551-1556.
PETER, K., STRAUB, A., KOHLER, B., VOLKMANN, M., SCHWARZ, M., KÜBLER, W. & BODE, C. 1999. Platelet activation as a potential mechanism of GP IIb/IIIa inhibitor-induced thrombocytopenia. The American journal of cardiology, 84, 519-524.
PETERS, G. 1994. The D-type cyclins and their role in tumorigenesis. J Cell Sci Suppl, 18, 89-96.
PHARMACOPOEIA, E. 2002. European Pharmacopoeia [Online]. Strasbourg, France: Council of Europe. Available: http://lib.njutcm.edu.cn/yaodian/ep/EP5.0/index.html [Accessed 13 December 2014].

306
PICCARDONI, P., EVANGELISTA, V., PICCOLI, A., DE GAETANO, G., WALZ, A. & CERLETTI, C. 1996. Thrombin-activated human platelets release two NAP-2 variants that stimulate polymorphonuclear leukocytes. Thromb Haemost, 76, 780-5.
PIERCE, M. W., REMOLD-O'DONNELL, E., TODD, R. F., 3RD & ARNAOUT, M. A. 1986. N-terminal sequence of human leukocyte glycoprotein Mo1: conservation across species and homology to platelet IIb/IIIa. Biochim Biophys Acta, 874, 368-71.
PIGNATELLI, P., DI SANTO, S., BUCHETTI, B., SANGUIGNI, V., BRUNELLI, A. & VIOLI, F. 2006. Polyphenols enhance platelet nitric oxide by inhibiting protein kinase C-dependent NADPH oxidase activation: effect on platelet recruitment. The FASEB journal, 20, 1082-1089.
PIGNATELLI, P., PULCINELLI, F. M., CELESTINI, A., LENTI, L., GHISELLI, A., GAZZANIGA, P. P. & VIOLI, F. 2000. The flavonoids quercetin and catechin synergistically inhibit platelet function by antagonizing the intracellular production of hydrogen peroxide. The American journal of clinical nutrition, 72, 1150-1155.
PINMAI, K., CHUNLARATTHANABHORN, S., NGAMKITIDECHAKUL, C., SOONTHORNCHAREON, N. & HAHNVAJANAWONG, C. 2008. Synergistic growth inhibitory effects of Phyllanthus emblica and Terminalia bellerica extracts with conventional cytotoxic agents: doxorubicin and cisplatin against human hepatocellular carcinoma and lung cancer cells. World journal of gastroenterology: WJG, 14, 1491.
PITOT, H. C. 1993. The molecular biology of carcinogenesis. Cancer, 72, 962-970.
POCALY, M., LAGARDE, V., ETIENNE, G., DUPOUY, M., LAPAILLERIE, D., CLAVEROL, S., VILAIN, S., BONNEU, M., TURCQ, B., MAHON, F. X. & PASQUET, J. M. 2008. Proteomic analysis of an imatinib-resistant K562 cell line highlights opposing roles of heat shock cognate 70 and heat shock 70 proteins in resistance. Proteomics, 8, 2394-406.
PORCELIJN, L. & KR VON DEM BORNE, A. E. G. 1998. 4 Immune-mediated thrombocytopenias: basic and immunological aspects. Baillière's clinical haematology, 11, 331-341.
QIAN-CUTRONE, J., HUANG, S., TRIMBLE, J., LI, H., LIN, P. F., ALAM, M., KLOHR, S. E. & KADOW, K. F. 1996. Niruriside, a new HIV REV/RRE binding inhibitor from Phyllanthus niruri. Journal of natural products, 59, 196-199.
RAK, J. & YU, J. L. 2004. Oncogenes and tumor angiogenesis: The question of vascular ‘supply’ and vascular ‘demand’. Seminars in Cancer Biology, 14, 93-104.
RASHID, R., MUKHTAR, F. & KHAN, A. 2014. Antifungal And Cytotoxic Activities Of Nannorrhops Ritchiana Roots Extract. Acta Poloniae Pharmaceutica, 71, 789.
RATNAYAKE, R., COVELL, D., RANSOM, T. T., GUSTAFSON, K. R. & BEUTLER, J. A. 2008. Englerin A, a selective inhibitor of renal cancer cell growth, from Phyllanthus engleri. Organic letters, 11, 57-60.
REEVE, E. C. R. & BLACK, I. 2001. Encyclopedia of Genetics, Fitzroy Dearborn.
REICHARDT, C. 1988. Solvents and Solvent Effects in Organic Chemistry, John Wiley & Sons.
REICHARDT, C. & WELTON, T. 2011. Solvents and solvent effects in organic chemistry, John Wiley & Sons.
REN, W., QIAO, Z., WANG, H., ZHU, L. & ZHANG, L. 2003. Flavonoids: promising anticancer agents. Medicinal research reviews, 23, 519-534.
RÉVILLION, F., BONNETERRE, J. & PEYRAT, J. P. 1998. ERBB2 oncogene in human breast cancer and its clinical significance. European Journal of Cancer, 34, 791-808.

307
RICCARDI, C. & NICOLETTI, I. 2006. Analysis of apoptosis by propidium iodide staining and flow cytometry. Nature protocols, 1, 1458-1461.
RISINGER, A. L., GILES, F. J. & MOOBERRY, S. L. 2009. Microtubule dynamics as a target in oncology. Cancer Treatment Reviews, 35, 255-261.
RODRIGUEZ-SUAREZ, E., HUGHES, C., GETHINGS, L., GILES, K., WILDGOOSE, J., STAPELS, M., E FADGEN, K., J GEROMANOS, S., PC VISSERS, J. & ELORTZA, F. 2013. An ion mobility assisted data independent LC-MS strategy for the analysis of complex biological samples. Current Analytical Chemistry, 9, 199-211.
ROZYCKA, M., LU, Y. J., BROWN, R. A., LAU, M. R., SHIPLEY, J. M. & FRY, M. J. 1998. cDNA cloning of a third human C2-domain-containing class II phosphoinositide 3-kinase, PI3K-C2gamma, and chromosomal assignment of this gene (PIK3C2G) to 12p12. Genomics, 54, 569-74.
RUMJANEK, V. M., TRINDADE, G. S., WAGNER-SOUZA, K., DE-OLIVEIRA, M. C., MARQUES-SANTOS, L. F., MAIA, R. C. & CAPELLA, M. A. 2001. Multidrug resistance in tumour cells: characterization of the multidrug resistant cell line K562-Lucena 1. An Acad Bras Cienc, 73, 57-69.
RUSSEL, N. J., POWELL, G. M., JONES, J. G., WINTERBURN, P. J. & BASFORD, J. M. 1982. Blood Biochemistry, Croom Helm.
SABIR, S. & ROCHA, J. 2008. Water-extractable phytochemicals from Phyllanthus niruri exhibit distinct in vitro antioxidant and in vivo hepatoprotective activity against paracetamol-induced liver damage in mice. Food Chemistry, 111, 845-851.
SAHNI, S., MAURYA, S., SINGH, U., SINGH, A., SINGH, V. & PANDEY, V. 2005. Antifungal activity of nor-securinine against some phytopathogenic fungi. Mycobiology, 33, 97-103.
SAKKROM, P., POMPIMON, W., MEEPOWPAN, P., NUNTASAEN, N. & LOETCHUTINAT, C. 2010. The effect of phyllanthus taxodiifolius beille extracts and its triterpenoids studying on cellular energetic stage of cancer cells. American Journal of Pharmacology and Toxicology, 5, 139.
SAMALI, A., FLORENCE, D., ODENIRAN, O. & CORDELIA, O. 2012. Evaluation of chemical constituents of Phyllanthus Niruri. African Journal of Pharmacy and Pharmacology, 6, 125-128.
SAMUELS, N. 2005. Herbal remedies and anticoagulant therapy. Thromb Haemost, 93, 3-7.
SANTOSO, S., SACHS, U. J., KROLL, H., LINDER, M., RUF, A., PREISSNER, K. T. & CHAVAKIS, T. 2002. The junctional adhesion molecule 3 (JAM-3) on human platelets is a counterreceptor for the leukocyte integrin Mac-1. J Exp Med, 196, 679-91.
SARATHA, V. & SUBRAMANIAN, S. P. 2012. Lupeol, a triterpenoid isolated from Calotropis gigantea latex ameliorates the primary and secondary complications of FCA induced adjuvant disease in experimental rats. Inflammopharmacology, 20, 27-37.
SARKER, S. D., LATIF, Z. & GRAY, A. I. 2006. Natural Products Isolation. In: SARKER, S. D., LATIF, Z. & GRAY, A. I. (eds.) Natural Products Isolation. New Jersey: Humana Press.
SATYANARAYANA, P., SUBRAHMANYAM, P., VISWANATHAM, K. & WARD, R. 1988. New seco-and hydroxy-lignans from Phyllanthus niruri. Journal of natural products, 51, 44-49.
SAXENA, S., PANT, N., JAIN, D. & BHAKUNI, R. 2003. Antimalarial agents from plant sources. Current Science, 85, 1314-1329.
SEIDEL, V. 2006. Initial and Bulk Extraction. In: SARKER, S. D., LATIF, Z. & GRAY, A. I. (eds.) Natural Products Isolation. New Jersey: Humana Press.
SEVERIN, S., NASH, C. A., MORI, J., ZHAO, Y., ABRAM, C., LOWELL, C. A., SENIS, Y. A. & WATSON, S. P. 2012. Distinct and overlapping functional roles of Src family kinases in mouse platelets. J Thromb Haemost, 10, 1631-45.

308
SHARMA, P., PARMAR, J., VERMA, P., SHARMA, P. & GOYAL, P. 2009. Anti-tumor activity of Phyllanthus niruri (a medicinal plant) on chemical-induced skin carcinogenesis in mice. Asian Pac J Cancer Prev, 10, 1089-94.
SHATTIL, S. J., HOXIE, J., CUNNINGHAM, M. & BRASS, L. 1985. Changes in the platelet membrane glycoprotein IIb. IIIa complex during platelet activation. Journal of Biological Chemistry, 260, 11107-11114.
SHATTIL, S. J., KASHIWAGI, H. & PAMPORI, N. 1998. Integrin signaling: the platelet paradigm. Blood, 91, 2645.
SHATTIL, S. J. & NEWMAN, P. J. 2004. Integrins: dynamic scaffolds for adhesion and signaling in platelets. Blood, 104, 1606-1615.
SHEN, Z.-Q., DONG, Z.-J., PENG, H. & LIU, J.-K. 2003. Modulation of PAI-1 and tPA activity and thrombolytic effects of corilagin. Planta medica, 69, 1109-1112.
SHEN, Z., CHEN, P., DUAN, L., DONG, Z., CHEN, Z. & LIU, J. 2004. Effects of fraction from Phyllanthus urinaria on thrombosis and coagulation system in animals. Journal of Chinese integrative medicine, 2, 106.
SHERR, C. J. & ROBERTS, J. M. 2004. Living with or without cyclins and cyclin-dependent kinases. Genes Dev, 18, 2699-711.
SHEU, J.-R., HSIAO, G., CHOU, P.-H., SHEN, M.-Y. & CHOU, D.-S. 2004. Mechanisms Involved in the Antiplatelet Activity of Rutin, a Glycoside of the Flavonol Quercetin, in Human Platelets. Journal of Agricultural and Food Chemistry, 52, 4414-4418.
SHIMIZU, M., HORIE, S., TERASHIMA, S., UENO, H., HAYASHI, T., ARISAWA, M., SUZUKI, S., YOSHIZAKI, M. & MORITA, N. 1989. Studies on aldose reductase inhibitors from natural products. II. Active components of a Paraguayan crude drug" Para-parai mi," Phyllanthus niruri. Chemical & pharmaceutical bulletin, 37, 2531-2532.
SIMPSON, A. J., LEFEBVRE, B., MOSER, A., WILLIAMS, A., LARIN, N., KVASHA, M., KINGERY, W. L. & KELLEHER, B. 2004. Identifying residues in natural organic matter through spectral prediction and pattern matching of 2D NMR datasets. Magnetic Resonance in Chemistry, 42, 14-22.
SINGH, B., AGRAWAL, P. & THAKUR, R. 1989. Euphane Triterpenoids From Phyllanthus-Niruri. Indian Journal Of Chemistry, 28, 319-321.
SNYDER, L. R., KIRKLAND, J. J. & GLAJCH, J. L. 2012. Practical HPLC method development, John Wiley & Sons.
SPORN, M. B. & SUH, N. 2000. Chemoprevention of cancer. Carcinogenesis, 21, 525-530.
STENBERG, P. E., MCEVER, R. P., SHUMAN, M. A., JACQUES, Y. V. & BAINTON, D. F. 1985a. A platelet alpha-granule membrane protein (GMP-140) is expressed on the plasma membrane after activation. J Cell Biol, 101, 880-6.
STENBERG, P. E., MCEVER, R. P., SHUMAN, M. A., JACQUES, Y. V. & BAINTON, D. F. 1985b. A platelet alpha-granule membrane protein (GMP-140) is expressed on the plasma membrane after activation. The Journal of cell biology, 101, 880-886.
STEPHENS, L., EGUINOA, A., ERDJUMENT-BROMAGE, H., LUI, M., COOKE, F., COADWELL, J., SMRCKA, A., THELEN, M., CADWALLADER, K. & TEMPST, P. 1997. The Gβγ sensitivity of a PI3K is dependent upon a tightly associated adaptor, p101. Cell, 89, 105-114.
STICHER, O. 2008. Natural product isolation. Natural Product Reports, 25, 517-554.
STOREY, R. F. 2008. New developments in antiplatelet therapy. European Heart Journal Supplements, 10, (suppl D): D30-D37.

309
SUBEKI, S., MATSUURA, H., TAKAHASHI, K., YAMASAKI, M., YAMATO, O., MAEDE, Y., KATAKURA, K., KOBAYASHI, S., TRIMURNINGSIH, T. & CHAIRUL, C. 2005. Anti-babesial and anti-plasmodial compounds from Phyllanthus niruri. Journal of natural products, 68, 537.
SUDHA, A. & SRINIVASAN, P. 2014. Bioassay-guided isolation, identification and molecular ligand-target insight of lipoxygenase inhibitors from leaves of Anisomeles malabarica R. Br. Pharmacognosy Magazine, 10, 596.
SUH, D., LEE, E., KIM, H. & KIM, J. 2010. Induction of G1/S phase arrest and apoptosis by quercetin in human osteosarcoma cells. Archives of Pharmacal Research, 33, 781-785.
SURYADINATA, R., SADOWSKI, M. & SARCEVIC, B. 2010. Control of cell cycle progression by phosphorylation of cyclin-dependent kinase (CDK) substrates. Biosci Rep, 30, 243-55.
SYAMASUNDAR, K. V., SINGH, B., SINGH THAKUR, R., HUSAIN, A., YOSHINOBU, K. & HIROSHI, H. 1985. Antihepatotoxic principles of Phyllanthus niruri herbs. Journal of ethnopharmacology, 14, 41-44.
TABUCHI, A., YOSHIOKA, A., HIGASHI, T., SHIRAKAWA, R., NISHIOKA, H., KITA, T. & HORIUCHI, H. 2003. Direct demonstration of involvement of protein kinase Calpha in the Ca2+-induced platelet aggregation. J Biol Chem, 278, 26374-9.
TAKEKAWA, M., POSAS, F. & SAITO, H. 1997. A human homolog of the yeast Ssk2/Ssk22 MAP kinase kinase kinases, MTK1, mediates stress-induced activation of the p38 and JNK pathways. Embo j, 16, 4973-82.
TANG, Y. Q., JAGANATH, I. B. & SEKARAN, S. D. 2010. Phyllanthus spp. induces selective growth inhibition of PC-3 and MeWo human cancer cells through modulation of cell cycle and induction of apoptosis. PloS one, 5, e12644.
TAPON, N. & HALL, A. 1997. Rho, Rac and Cdc42 GTPases regulate the organization of the actin cytoskeleton. Current Opinion in Cell Biology, 9, 86-92.
TERASHITA, Z.-I., TSUSHIMA, S., YOSHIOKA, Y., NOMURA, H., INADA, Y. & NISHIKAWA, K. 1983. CV-3988 - A specific antagonist of platelet activating factor (PAF). Life Sciences, 32, 1975-1982.
THAN, N., FOTSO, S., POEGGELER, B., HARDELAND, R. & LAATSCH, H. 2006. Niruriflavone, a new antioxidant flavone sulfonic acid from Phyllanthus niruri. ZEITSCHRIFT FUR NATURFORSCHUNG B, 61, 57.
THOMPSON, C. B., JAKUBOWSKI, J. A., QUINN, P. G., DEYKIN, D. & VALERI, C. R. 1984. Platelet size and age determine platelet function independently. Blood, 63, 1372-1375.
TIBBLES, H. E., VASSILEV, A., WENDORF, H., SCHONHOFF, D., ZHU, D., LORENZ, D., WAURZYNIAK, B., LIU, X.-P. & UCKUN, F. M. 2001. Role of a JAK3-dependent biochemical signaling pathway in platelet activation and aggregation. Journal of Biological Chemistry, 276, 17815-17822.
TOTTE, J., TONA, L., PIETERS, L., MESIA, K., VLIETINCK, A., NGIMBI, N., CHRIMWAMI, B., CIMANGA, K., DE BRUYNE, T. & APERS, S. 2001. In-vivo antimalarial activity of Cassia occidentalis, Morinda morindoides and Phyllanthus niruri. Annals of tropical medicine and parasitology, 95, 47-57.
TRAMPUZ, A., JEREB, M., MUZLOVIC, I. & PRABHU, R. M. 2003. Clinical review: Severe malaria. Crit Care, 7, 315-23.
TRIPATHI, A. K., VERMA, R. K., GUPTA, A. K., GUPTA, M. M. & KHANUJA, S. P. S. 2006. Quantitative determination of phyllanthin and hypophyllanthin in Phyllanthus species by high performance thin layer chromatography. Phytochemical Analysis, 17, 394-397.

310
UENO, H., HORIE, S., NISHI, Y., SHOGAWA, H., KAWASAKI, M., SUZUKI, S., HAYASHI, T., ARISAWA, M., SHIMIZU, M. & YOSHIZAKI, M. 1988. Chemical and Pharmaceutical Studies on Medicinal Plants in Paraguay, Geraniin, an Angiotensin-Converting Enzyme Inhibitor from" Paraparai Mi," Phyllanthus niruri. Journal of natural products, 51, 357-359.
VARGA-SZABO, D., BRAUN, A. & NIESWANDT, B. 2009. Calcium signaling in platelets. J Thromb Haemost, 7, 1057-66.
VATTEM, D. A. & SHETTY, K. 2005. Biological Functionality Of Ellagic Acid: A Review. Journal of Food Biochemistry, 29, 234-266.
VENKATESWARAN, P., MILLMAN, I. & BLUMBERG, B. 1987. Effects of an extract from Phyllanthus niruri on hepatitis B and woodchuck hepatitis viruses: in vitro and in vivo studies. Proceedings of the National Academy of Sciences, 84, 274.
VENKITARAMAN, A. R. 2002. Cancer Susceptibility and the Functions of BRCA1 and BRCA2. Cell, 108, 171-182.
VILLAR, V. A., JONES, J. E., ARMANDO, I., PALMES-SALOMA, C., YU, P., PASCUA, A. M., KEEVER, L., ARNALDO, F. B., WANG, Z., LUO, Y., FELDER, R. A. & JOSE, P. A. 2009. G protein-coupled receptor kinase 4 (GRK4) regulates the phosphorylation and function of the dopamine D3 receptor. J Biol Chem, 284, 21425-34.
VISENTIN, G. P., NEWMAN, P. J. & ASTER, R. H. 1991. Characteristics of quinine-and quinidine-induced antibodies specific for platelet glycoproteins IIb and IIIa. Blood, 77, 2668-2676.
WAHYUNI S., W. T. 2010. Optimization and Validation High Performance
Liquid Chromatographic Fingerprint of Phyllanthus niruri L. Master Degree, Bogor Agricultural University.
WATTENBERG, L. W. 1985. Chemoprevention of cancer. Cancer research, 45, 1-8.
WEIGANG, D., ZHIQIANG, S., MING, Y., YU, Y., LUYONG, Z., GOVIL, J., SINGH, V. & MISHRA, S. 2008. Corilagin, a promising natural product to treat cardiovascular diseases. Phytopharmacology and therapeutic values II, 163-172.
WHITMARSH, A. J. & DAVIS, R. J. 1996. Transcription factor AP-1 regulation by mitogen-activated protein kinase signal transduction pathways. Journal of Molecular Medicine, 74, 589-607.
WHO 1998. Quality control methods for medicinal plant materials. Geneva: WHO.
WHO 2007. WHO guidelines for assessing quality of herbal medicines with reference to contaminants and residues, Geneva: World Health Organization.
WHO 2013. World Malaria Report 2013. Geneva Switzerland.
WHO. 2014. Malaria [Online]. Available: http://www.who.int/mediacentre/factsheets/fs094/en/ [Accessed April 20 2014].
WINZELER, E. A. 2008. Malaria research in the post-genomic era. Nature, 455, 751-756.
WOOD, A. W., HUANG, M.-T., CHANG, R. L., NEWMARK, H. L., LEHR, R. E., YAGI, H., SAYER, J. M., JERINA, D. M. & CONNEY, A. H. 1982. Inhibition of the mutagenicity of bay-region diol epoxides of polycyclic aromatic hydrocarbons by naturally occurring plant phenols: exceptional activity of ellagic acid. Proceedings of the National Academy of Sciences, 79, 5513-5517.
WU, C. 2004. The PINCH-ILK-parvin complexes: assembly, functions and regulation. Biochim Biophys Acta, 1692, 55-62.

311
WU, Y., SUZUKI-INOUE, K., SATOH, K., ASAZUMA, N., YATOMI, Y., BERNDT, M. C. & OZAKI, Y. 2001. Role of Fc receptor γ-chain in platelet glycoprotein Ib–mediated signaling. Blood, 97, 3836-3845.
XIANG, B., ZHANG, G., STEFANINI, L., BERGMEIER, W., GARTNER, T. K., WHITEHEART, S. W. & LI, Z. 2012. The Src family kinases and protein kinase C synergize to mediate Gq-dependent platelet activation. J Biol Chem, 287, 41277-87.
XU, W.-F., XIE, Z.-W., CHUNG, D. W. & DAVIE, E. W. 1998. A Novel Human Actin-Binding Protein Homologue That Binds to Platelet Glycoprotein Ibα. Blood, 92, 1268-1276.
YADAV, R. D., JAIN, S., ALOK, S., MAHOR, A., BHARTI, J. P. & JAISWAL, M. 2011. Herbal plants used in the treatment of urolithiasis: a review. Int J Pharmaceutical Sci Res, 2, 1412-1420.
YAMADA, M. & SEKIGUCHI, K. 2013. Disease-associated single amino acid mutation in the calf-1 domain of integrin alpha3 leads to defects in its processing and cell surface expression. Biochem Biophys Res Commun, 441, 988-93.
ZAHEDI, R. P., LEWANDROWSKI, U., WIESNER, J., WORTELKAMP, S., MOEBIUS, J., SCHÜTZ, C., WALTER, U., GAMBARYAN, S. & SICKMANN, A. 2007. Phosphoproteome of resting human platelets. Journal of proteome research, 7, 526-534.
ZHAO, J., O'DONNELL, V. B., BALZAR, S., CROIX, C. M. S., TRUDEAU, J. B. & WENZEL, S. E. 2011. 15-Lipoxygenase 1 interacts with phosphatidylethanolamine-binding protein to regulate MAPK signaling in human airway epithelial cells. Proceedings of the National Academy of Sciences, 108, 14246-14251.
ZHAO, L., ZHANG, S. L., TAO, J. Y., PANG, R., JIN, F., GUO, Y. J., DONG, J. H., YE, P., ZHAO, H. Y. & ZHENG, G. H. 2008. Preliminary exploration on anti-inflammatory mechanism of Corilagin (beta-1-O-galloyl-3,6-(R)-hexahydroxydiphenoyl-D-glucose) in vitro. Int Immunopharmacol, 8, 1059-64.
ZHOU, L. & SCHMAIER, A. H. 2005. Platelet aggregation testing in platelet-rich plasma. American journal of clinical pathology, 123, 172.
ZHOU, Z., GUSHIKEN, F. C., BOLGIANO, D., SALSBERY, B. J., AGHAKASIRI, N., JING, N., WU, X., VIJAYAN, K. V., RUMBAUT, R. E., ADACHI, R., LOPEZ, J. A. & DONG, J. F. 2013. Signal transducer and activator of transcription 3 (STAT3) regulates collagen-induced platelet aggregation independently of its transcription factor activity. Circulation, 127, 476-85.
ZIMMERMAN, P. A., WOOLLEY, I., MASINDE, G. L., MILLER, S. M., MCNAMARA, D. T., HAZLETT, F., MGONE, C. S., ALPERS, M. P., GENTON, B. & BOATIN, B. 1999. Emergence of FY* Anull in a Plasmodium vivax-endemic region of Papua New Guinea. Proceedings of the National Academy of Sciences, 96, 13973-13977.
ZSCHAUER, A., VAN BREEMEN, C., BÜHLER, F. & NELSON, M. 1988. Calcium channels in thrombin-activated human platelet membrane.
ZUFFEREY, A., FONTANA, P., RENY, J. L., NOLLI, S. & SANCHEZ, J. C. 2012. Platelet proteomics. Mass spectrometry reviews.

312
Appendices
Appendix 1 – Product specification of Phyllanthus niruri L plant material

313
Appendix 2 – Blood order approval letter

314

315
Appendix 3 - Mass spectrometry spectra from G2 fraction
Nanda 6R.2, HPLC6KPA 19-Dec-2013 14:55:12
LIMS 1115/1116Waters ZQ/Alliance 2695 LC
m/z125 150 175 200 225 250 275 300 325 350 375 400 425 450 475 500 525 550 575 600 625 650 675 700 725 750
%
0
100
%
0
100
KPA2 33 (0.720) Sm (SG, 1x0.70); Cm (30:42-12:16x2.000) 1: Scan ES- 2.81e6633.0291.1
247.1
169.1155.0
125.1205.0
249.1
283.0
316.1
292.1
293.2
480.9
462.8384.8
634.0
634.9
KPA1 33 (0.720) Sm (SG, 1x0.70); Cm (30:46-10:21x2.000) 1: Scan ES+ 3.49e6191.3
186.4
147.4235.4192.3
222.4268.2
250.2372.2
277.1413.1 464.9 656.9
505.0

316
Appendix 4 - Differential platelet proteins during platelet activation induced by ADP in the presence of corilagin, identified from 2D SDS PAGE
Protein Description Accession ID Spot ID * MW (kDa) pI Protein function**
Beta-1B-glycoprotein P02790 9 72 5.59 Regulation of Stat1 protein
Calreticulin P27797 12 58 3.7 Calcium homeostasis Catalase P04040 15 54 7.52 Protects cells from the toxic effects of hydrogen
peroxide 18 49 7.73 CCAAT/enhancer-binding protein zeta Q03701 5 115 4.5 Stimulates transcription from the HSP70 promoter Complement C3 P01024 10 70 6.6 Activation of the PLC, MAPK and AKT signalling
pathways Epidermal growth factor receptor P00533 1 151 5.93 Receptor tyrosine kinase binding ligands Fibrinogen gamma chain P02679 16 48 5.56 The primary components of blood clots
Fructose-bisphosphate aldolase A P04075 22 37 7.8 Plays role in glycolysis Glyceraldehyde-3-phosphate dehydrogenase
P04406 23 37 7.9 Plays role in glycolysis
Guanine nucleotide-binding protein-like 3
Q9BVP2 2 65 6.47 GTP catabolic process
Haptoglobin P00738 21 37 5.8 intercellular tight junction disassembly Hemoglobin subunit alpha P69905 25 10 9.2 Oxygen transport Hemoglobin subunit alpha P69905 26 11 9.4 Oxygen transport Immunoglobulin heavy chain gamma P99006 6 110 6.5 Antigen binding
P99006 19 51 9.02 P99008 3 37.5 7.32
Immunoglobulin heavy chain mu P99009 17 48 6.15 Antigen binding Immunoglobulin light chain P99007 24 25 7.8 Antigen binding
Plasminogen P00747 7 112 6.68 Cleaves fibrin, thrombospondin and VWF factor

317
Protein Description Accession ID Spot ID * MW (kDa) pI Protein function**
Prelamin-A/C P02545 13 60 7.1 Plays role in chromatin organization Protein disulfide-isomerase A3 P30101 14 52 5.66 Play role in signal transduction Serotransferrin P02787 8 80 6.63 Iron binding transport proteins Spectrin beta chain P11277 4 234 6 Major constituent of the cytoskeletal network T-complex protein 1 subunit zeta P40227 11 58 6.21 Folding of actin and tubulin Unknown Unknown 20 45 8.3 Unknown

318
Appendix 5 - PANTHER classification system
The PANTHER (protein annotation trough evolutionary relationship) is a comprehensive
web-based system that combines gene function, ontology, pathways and statistical analysis
tools. PANTHER infrastructure consist of three modules; PANTHER protein library (yellow
box), pathways module (dark green), and tool suite module (blue box). The library system
consists of genes from 82 complete genomes, organised in PANTHER families and
subfamilies, each of which is represented by a phylogenetic tree, a multiple sequence
alignment (MSA) and hidden Markov statistical models (HMMs). Each family or subfamily is
also annotated with ontology term (GO and PANTHER protein class term). PANTHER
pathway module contains 176 expert-curated pathways (curated manually to connect all
pathways to individual proteins in in the protein library). PANTHER website tool suite
included gene analysis tools, which enables users to query data and classify genes and
protein, and also to visualise, analyse and interpret large-scale gene function analysis (Mi et
al., 2013)

319
Pro-Genesis QI
Quantitative Analysis
(p�0.05, minimum fold 2)
All Quantifiable
Proteins
GROUP A
Differential Protein
659 proteins
GROUP B
Abundant in ADP Activated
338 proteins
GROUP C
Abundant in ADP Activated in the
Presence of Corilagin
321 proteins
PANTHER ID
Annotation
GROUP A
587 proteins
GROUP B
303 proteins
GROUP C
284 proteins
GROUP A
46 proteins
GROUP C
18 proteins
GROUP B
28 proteins
PANTHER Enrichment
Analysis (p�0.05)
(minimum fold 3)
PANTHER Pathway
Analysis
GROUP A
12 Pathways
GROUP C
No Significant
Pathways
GROUP B
5 Pathways
GROUP A
659 proteins and their
relative quantity
Filter p�0.05
25 Pathways
Appendix 6 - Pathway analysis flow chart

320
Appendix 7 - Platelet proteins involved in the enriched pathways from Panther pathway over-representation analysis
Protein Description Accession ID
Subset data
Phosphatidylinositol 4-phosphate 3-kinase C2 domain-containing subunit beta
O00750 B
Thyroglobulin P01266 B
Protein kinase C beta type P05771 B
Insulin receptor P06213 B
Tyrosine-protein kinase Yes P07947 B
Heat shock 70 kDa protein 1A/1B P08107 B
Tyrosine-protein kinase Fgr P09769 B
Secretogranin-2 P13521 B
Protein kinase C alpha type P17252 B
Protein kinase C eta type P24723 B
Proteasome subunit alpha type-2 P25787 B
Mitogen-activated protein kinase 3 P27361 B
Guanine nucleotide-binding protein subunit alpha-11 P29992 B
Phosphatidylethanolamine-binding protein 1 P30086 B
G protein-coupled receptor kinase 4 P32298 B
Tyrosine-protein kinase FRK P42685 B
Tyrosine-protein kinase FRK P42685 B
Crk-like protein P46109 B
LIM and senescent cell antigen-like-containing domain protein 1 P48059 B
Guanine nucleotide-binding protein G (I)/G (S)/G (T) subunit beta-2
P62879 B
Voltage-dependent L-type calcium channel subunit alpha-1D Q01668 B
1-phosphatidylinositol 4,5-bisphosphate phosphodiesterase beta-4
Q15147 B
1-phosphatidylinositol 4,5-bisphosphate phosphodiesterase eta-1
Q4KWH8 B
Histone acetyltransferase KAT2B Q92831 B
Septin-5 Q99719 B
Tubulin alpha-1C chain Q9BQE3 B
Guanine nucleotide-binding protein subunit beta-4 Q9HAV0 B
Regulator of G-protein signalling 18 Q9NS28 B
Alpha-parvin Q9NVD7 B
Rho GTPase-activating protein 26 Q9UNA1 B
Filamin-B O75369 C
Phosphatidylinositol 4-phosphate 3-kinase C2 domain-containing subunit gamma
O75747 C
Serine/threonine-protein kinase D3 O94806 C
Tyrosine-protein kinase Lck P06239 C
Laminin subunit beta-1 P07942 C
Integrin alpha-M P11215 C
Neurofibromin P21359 C

321
Protein Description Accession ID
Subset data
Integrin alpha-6 P23229 C
Integrin alpha-3 P26006 C
Signal transducer and activator of transcription 3 P40763 C
Signal transducer and activator of transcription 1-alpha/beta P42224 C
Tyrosine-protein kinase Blk P51451 C
Rho-related GTP-binding protein RhoB P62745 C
Mitogen-activated protein kinase kinase kinase 9 P80192 C
Dynamin-1 Q05193 C
Mitogen-activated protein kinase 14 Q16539 C
Serine/threonine-protein kinase N3 Q6P5Z2 C
Mitogen-activated protein kinase kinase kinase 4 Q9Y6R4 C

322
Appendix 8 - Platelet proteins found in the enriched pathways from REACTOME protein expression analysis
Protein description Uniprot Accession
Up/Down regulated
Protein function Reference
Superoxide dismutase P00441 Down Destroys radicals which are normally produced within the cells and which are toxic to biological systems
Coagulation factor VIII P00451 Down Factor VIII, along with calcium and phospholipid, acts as a cofactor for factor IXa when it converts factor X to the activated form
Phosphatidylinositol 4-phosphate 3-kinase C2 domain-containing subunit beta
O00750 Down Phosphorylates PtdIns and PtdIns4P with a preference for PtdIns. Does not phosphorylate PtdIns (4,5)P2.
(Arcaro et al., 1998)
Platelet basic protein P02775 Down In vitro released from activated platelet alpha-granules, play role in prostaglandin E2 secretion
(Piccardoni et al., 1996)
Protein kinase C beta type P05771 Down Platelet activation, Response to elevated platelet cytosolic Ca2+ (Kang et al., 2001)
Tyrosine-protein kinase Yes P07947 Down Non-receptor protein tyrosine kinase that is involved in cell-cell adhesion and cytoskeleton remodeling
(Huang et al., 1991)
Heat shock 70 kDa protein 1A/1B P08107 Down actively involved in integrin-mediated platelet adhesion (Bastos-Amador et al., 2012) (Gear et al., 1997)
Tyrosine-protein kinase Fgr P09769 Down Contributes to platelet activation through a direct interaction with GPVI
(Pestina et al., 1997) (Severin et al., 2012)
Insulin receptor P06213 Down Receptor tyrosine kinase which mediates the pleiotropic actions of insulin
(Hajek and Joist, 1992)
Secretogranin-2 P13521 Down May contribute to thrombosis formation (Coppinger et al., 2004)
Protein kinase C alpha type P17252 Down Play role in the regulation of calcium-induced platelet aggregation (Tabuchi et al., 2003)
Protein kinase C eta type P24723 Down Play role in platelet activation (reactome) (Lee et al., 2010)
Proteasome subunit alpha type-2 P25787 Down multicatalytic proteinase complex which is characterized by its ability to cleave peptides with Arg, Phe, Tyr, Leu, and Glu adjacent to the leaving group at neutral or slightly basic pH
Mitogen-activated protein kinase 3 P27361 Down play role in platelet granule secretion (Flevaris et al., 2009)
Guanine nucleotide-binding protein subunit alpha-11
P29992 Down Involved as modulators or transducers in various transmembrane signalling systems in G-coupled receptor pathway
(Xiang et al., 2012)

323
Protein description Uniprot Accession
Up/Down regulated
Protein function Reference
Phosphatidylethanolamine-binding protein 1
P30086 Down Play role in MAPK ERK activation (Heijnen et al., 1999) (Zhao et al., 2011)
G protein-coupled receptor kinase 4 P32298 Down Specifically phosphorylates the activated forms of G protein-coupled receptors. Inhibited by heparin
(Villar et al., 2009)
Tyrosine-protein kinase FRK P42685 Down Mediator for MAPK signalling partway (Whitmarsh and Davis, 1996)
Crk-like protein P46109 Down may be involved in the reorganization of the cytoskeleton during normal platelet aggregation
(Oda et al., 1996) (Best et al., 2001)
LIM and senescent cell antigen-like-containing domain protein 1
P48059 Down Adapter protein in a cytoplasmic complex linking beta-integrins to the actin cytoskeleton. Highly expressed in platelet
(Chen et al., 2007) (Dittrich et al., 2008)
Guanine nucleotide-binding protein G (I)/G (S)/G (T) subunit beta-2
P62879 Down G protein involved as a modulator or transducer in plateket transmembrane signalling system.
(Brass et al., 1987)
Voltage-dependent L-type calcium channel subunit alpha-1D
Q01668 Down mediate the entry of calcium ions into excitable cells and are also involved in a variety of calcium-dependent processes
(Doyle and Rüegg, 1985) (Zschauer et al., 1988) (Nelson et al., 1990)
1-phosphatidylinositol 4,5-bisphosphate phosphodiesterase beta-4
Q15147 Down The production of the second messenger molecules diacylglycerol (DAG) and inositol 1,4,5-trisphosphate (IP3). Mostly found in retina
(Alvarez et al., 1995)
1-phosphatidylinositol 4,5-bisphosphate phosphodiesterase eta-1
Q4KWH8 Down The production of the second messenger molecules diacylglycerol (DAG) and inositol 1,4,5-trisphosphate (IP3)
(Hwang et al., 2005)
Histone acetyltransferase KAT2B Q92831 Down
Septin-5 Q99719 Down In platelets, found in areas surrounding alpha-granules. Associated with a complex containing STX4 and may play role in platelet secretion
(Dent et al., 2002) (Zahedi et al., 2007)
Tubulin alpha-1C chain Q9BQE3 Down Tubulin is the major constituent of platelet microtubules. (Ikeda and Steiner, 1979)
Guanine nucleotide-binding protein subunit beta-4
Q9HAV0 Down Involved as modulators or transducers in various transmembrane signalling systems in G-coupled receptor pathway
(Brass et al., 1987)

324
Protein description Uniprot Accession
Up/Down regulated
Protein function Reference
Regulator of G-protein signalling 18 Q9NS28 Down Inhibits signal transduction by increasing the GTPase activity of G protein alpha subunits thereby driving them into their inactive GDP-bound form
(Gagnon et al., 2002)
Alpha-parvin Q9NVD7 Down Plays a role in the reorganization of the actin cytoskeleton and cell adhesion.
(Legate et al., 2006) (Honda et al., 2013)
Rho GTPase-activating protein 26 Q9UNA1 Down GTPase-activating protein for RHOA and CDC42 (Aslan et al., 2013) (Tapon and Hall, 1997) (Moon and Zheng, 2003)
Filamin-B O75369 Up Anchors various transmembrane proteins to the actin cytoskeleton. The intracellular domain of GpIba associates with the platelet cytoskeleton by a direct interaction filamin.
(Xu et al., 1998)
Phosphatidylinositol 4-phosphate 3-kinase C2 domain-containing subunit gamma
O75747 Up Generates phosphatidylinositol 3-phosphate (PtdIns3P) and phosphatidylinositol 3,4-bisphosphate (PtdIns (3,4)P2) that act as second messengers
(Rozycka et al., 1998)
Serine/threonine-protein kinase D3 O94806 Up Converts transient diacylglycerol (DAG) signals into prolonged physiological effects, downstream of PKC
(Hayashi et al., 1999)
Tyrosine-protein kinase Lck P06239 Up Involved in signalling events that drive cytoskeletal reorganization and active endocytosis of plasma proteins by circulating platelets
(Pestina et al., 1997)
Laminin subunit beta-1 P07942 Up Contributes to platelet activation through a direct interaction with GPVI
(Colognato and Yurchenco, 2000) (Inoue et al., 2006)
Integrin alpha-M P11215 Up Platelet adhesion to leucocytes (Pierce et al., 1986) (Santoso et al., 2002)
Neurofibromin P21359 Up Stimulates the GTPase activity of Ras, actin cytoskeleton organization
(Ballester et al., 1990)
Integrin alpha-6 P23229 Up Integrin alpha-6/beta-1 is a receptor for laminin on platelets (Catimel et al., 1991) (Lewandrowski et al., 2006)
Integrin alpha-3 P26006 Up Receptor for laminin and collagen (Yamada and Sekiguchi, 2013)
Signal transducer and activator of transcription 3
P40763 Up Facilitates a crosstalk between proinflammatory cytokine and hemostasis/thrombosis signals in platelets
(Chen et al., 2013) (Zhou et al., 2013) (Tibbles et al., 2001)
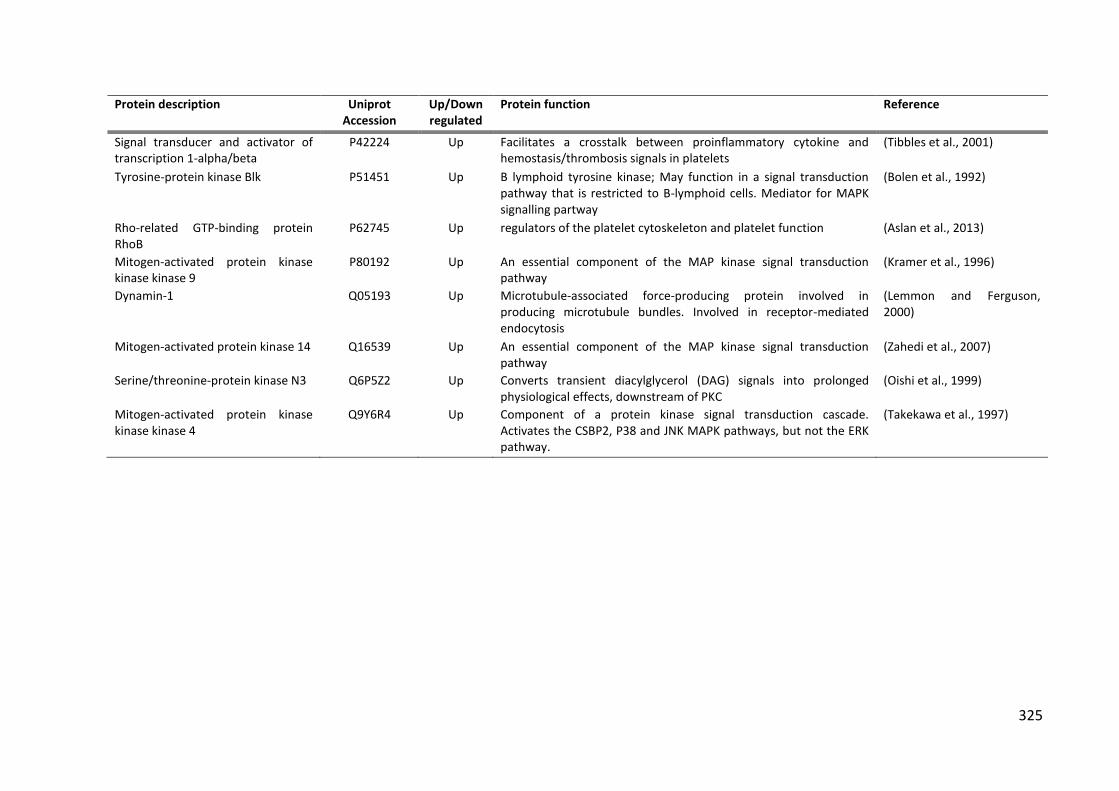
325
Protein description Uniprot Accession
Up/Down regulated
Protein function Reference
Signal transducer and activator of transcription 1-alpha/beta
P42224 Up Facilitates a crosstalk between proinflammatory cytokine and hemostasis/thrombosis signals in platelets
(Tibbles et al., 2001)
Tyrosine-protein kinase Blk P51451 Up B lymphoid tyrosine kinase; May function in a signal transduction pathway that is restricted to B-lymphoid cells. Mediator for MAPK signalling partway
(Bolen et al., 1992)
Rho-related GTP-binding protein RhoB
P62745 Up regulators of the platelet cytoskeleton and platelet function (Aslan et al., 2013)
Mitogen-activated protein kinase kinase kinase 9
P80192 Up An essential component of the MAP kinase signal transduction pathway
(Kramer et al., 1996)
Dynamin-1 Q05193 Up Microtubule-associated force-producing protein involved in producing microtubule bundles. Involved in receptor-mediated endocytosis
(Lemmon and Ferguson, 2000)
Mitogen-activated protein kinase 14 Q16539 Up An essential component of the MAP kinase signal transduction pathway
(Zahedi et al., 2007)
Serine/threonine-protein kinase N3 Q6P5Z2 Up Converts transient diacylglycerol (DAG) signals into prolonged physiological effects, downstream of PKC
(Oishi et al., 1999)
Mitogen-activated protein kinase kinase kinase 4
Q9Y6R4 Up Component of a protein kinase signal transduction cascade. Activates the CSBP2, P38 and JNK MAPK pathways, but not the ERK pathway.
(Takekawa et al., 1997)