isolation and characterization of caffeine from …
TRANSCRIPT

www.ejbps.com
Dipankar et al. European Journal of Biomedical and Pharmaceutical Sciences
330
ISOLATION AND CHARACTERIZATION OF CAFFEINE FROM CAMELLIA
SINESNSIS COLLECTED FROM EASTERN HIMALAYAN REGION OF INDIA
Sulav Bhattarai, Nitu Kumari, Manita Pradhan, Samiksha Pandey, Bibeshna Upreti and Dipankar Nath*
Department of Pharmaceutical Analysis and Quality Assurance. Himalayan Pharmacy Institute, Majhitar, East Sikkim,
India.
Article Received on 26/10/2018 Article Revised on 16/11/2018 Article Accepted on 06/12/2018
INTRODUCTION Alkaloids are a class of organic compound of plant origin
which are basic in nature. They possess one or more nitrogen heterocyclic ring on the structural unit. Most of
them are optically active. Except for few exception
alkaloids are usually colourless, crystalline powder,
insoluble in water but soluble in organic solvents, bitter n
taste and for insoluble precipitates with picric acid,
potassium mercuric iodide, phosphomolybdic acid
reagent etc. Alkaloids are isolated from nearly all parts
of plant chiefly from Apocyanaceae, Papaveraceace,
Rubiaceaeand Papilionaceae family plant. Since they are
basic in nature, they occur largely as salt of malic,
tartaric, citric and aromatic acid etc. They are also known to occur in the form of their glycoside, ester or as acid
amide. Though alkaloids have complex structure but they
exhibit pronounced pharmacological activity which make
them medicinally very important for e.g. quinine is an
important antimalarial agent and morphine is powerful
analgesic.[1] Caffeine is a known as 1, 3, 7-trimethyl
xanthine or 3, 7dihydro-1, 3, 7-trimethyl-1Hpurine-2, 6-
Dione. Caffeine is a purine base present along with other
bases like theophylline and theobromine in coffee, tea
etc. Tea leaves contains 1-40% of caffeine whereas
coffee seeds contain 1-2% caffeine. Caffeine is extracted
from the plant coffee Arabica. It is a CNS stimulant ad comes under the category of xanthine alkaloids.[2]
Too much caffeine can result in caffeine intoxication,
which is characterised by nervousness, irritability,
anxiety, tremulousness, muscle twitching, insomnia, headache, respiratory alkalosis and heart palpitations.
Caffeine act as a CNS stimulant, mild diuretic, it
increases the heart rate and blood pressure and stimulate
gastric secretion. It also acts as natural pesticides that
paralyzes and kill certain insects feeding on the plant.
Caffeine with UV can kill some kinds of algae and there
are evidences that it enhances mutation in bacteria n
viruses and also induce the chromosome damage.
Caffeine is an ingredient of several dozen proprietary
products, for most part, these combinations with acetyl
salicylic acid, ascorbic acid, codeine, paracetamol, and other analgesics and anti-pyretic. Tea leaves contain 1-
4% caffeine, while coffee 1-2% yet a cup of brewed
coffee contain about 100-150 mg caffeine while a cup tea
contain 60-75 mg. Soft drink typically contain 10-15mg
of caffeine per serving. Many analytical methods have
been developed for the determination of caffeine and the
quality control of products containing caffeine. For the
determination of caffeine in beverages, various analytical
techniques including titrimetry, spectrophotometers;
polarography, GC and HPLC have been reported.[3]
Caffeine is common organic molecule found in many beverages such as coffee, tea, energy and cola which
make the drinks addictive. It used in both recreationally
and medically to reduce physical fatigue and restore
SJIF Impact Factor 4.918 Research Article
ejbps, 2019, Volume 6, Issue 1, 330-342.
European Journal of Biomedical AND Pharmaceutical sciences
http://www.ejbps.com
ISSN 2349-8870
Volume: 6
Issue: 1
330-342
Year: 2019
*Corresponding Author: Dr. Dipankar Nath
Department of Pharmaceutical Analysis and Quality Assurance. Himalayan Pharmacy Institute, Majhitar, East Sikkim, India.
ABSTRACT
Caffeine (3,7-dihydro-1,3,7-trimethyl-1H-purine-2,6-dione or1,3,7-trimethyl xanthine) is a well-known compound
that occurs in nature in coffee, tea, cola nuts, mate leaves and other related natural products. Caffeine at sub milli
molar concentrations exerts a wide variety of pharmacological effects on different organisms and has long been
known to have numerous actions, including inhibition of phosphodiesterase’s, thereby increasing intracellular
cAMP, direct effects on intracellular calcium concentrations, indirect effects on intracellular calcium
concentrations via membrane hyperpolarization. Our study mainly focused on to isolate caffeine from Tea
Leaves/Powder collected from different Eastern Himalayan Region of India and characterized by different Physicochemical, Chromatographic and Spectroscopical technique by comparing them with a standard caffeine
which was available commercially.
KEYWORDS: Caffeine, Isolation, Chromatography, Infrared spectroscopy, Retention factor.

www.ejbps.com
Dipankar et al. European Journal of Biomedical and Pharmaceutical Sciences
331
mental alertness when unusual weakness or drowsiness
occurs.
Caffeine Content in Various Beverages
Table 1: Range of caffeine in various beverages.[4]
Approximate Caffeine Content of Various Beverages Range (Mg) of Caffeine
Coffee(5 oz. Cup) 40-170
Soft drink (12 oz. Can) 10-50
Black tea(one tea bag) 25-110
Oolong tea (one tea bag) 12-55
Green tea(one tea bag) 8-30
Decaffeinated tea(one tea bag) 1-4
Energy drinks (12 oz. Can) 75-90
Sources of caffeine Coffee beans, kola nuts, cocoa pods and dried leaves of
Camellia sinensis. Other botanicals that contain caffeine
are dry herb Yerba mata and Guarana.[5]
Properties Molecular formula & weight: C8H10N4O – 194.19
(anhydrous), C8H10N4O2.H2O-212.21 (monohydrous)
Category: CNS stimulant Dose: 300-600 mg
Description: Caffeine occurs as a colourless, odourless
white powder, silky glistening needles with bitter taste.
Solubility: freely soluble in chloroform and in boiling
water, sparingly soluble in water and ethanol (95%),
slightly soluble in ether.
Storage: Stored in tightly closed container.[6]
Characteristics of Caffeine
Table no. 2: Characteristics of caffeine.[7]
Appearance White Crystal White Crystalline Powder
MOLECULAR FORMULA C8H10N4O2 C8H10N4O2
MOLECULAR WEIGHT 194.19 194.19
DENSITY AT 20⁰C 1.23 1.23
MELTING POINT 237.7⁰C 238⁰ C
PH OF 1% SOLUTION 5.91 6.9
WATER AT 80⁰C 0.41% NOT MORE THAN 0.5%
HEAVY METAL 0.00089% NOT MORE THAN 0.001%
Caffeine-Chemistry behind more Popular Drug[8]
Fig. 1: Structure of Caffeine and Adenosine.
Caffeine and adenosine have similar structures, which
allows it to affect the brain. Adenosine is a molecule
produced by all humans, and has various functions
throughout the body. In the brain, adenosine acts as an
inhibitory neurotransmitter, or CNS depressant. Caffeine
acts as an “antagonist” molecule; it binds to adenosine
receptors on cell surfaces without activating them. In this
way, the molecule is a competitive inhibitor for
adenosine.

www.ejbps.com
Dipankar et al. European Journal of Biomedical and Pharmaceutical Sciences
332
Fig. 2: Degradation of Caffeine.
Caffeine is broken down into Paraxanthine, theobromine,
and theophylline. When caffeine gets to the liver, it is
broken down into three molecules: paraxanthine,
theobromine, and theophylline. These three molecules
are structural isomers of each other, which means that
they have the same chemical formula. Most of the
caffeine (84%) is metabolized into paraxanthine, which
is also a CNS stimulant. The next most-produced
metabolic product of caffeine (about 12%) is
theobromine, which can increase the flow of oxygen and nutrients to the brain. Finally, about 4% of the caffeine is
metabolized into theophylline, which increases heart rate
and the force of heart contraction.[9]
Deepak Pradhan et.al in 2017 carried out qualitative and
quantitative analysis of caffeine in some commercial
brands of tea consumed in India. Caffeine is a common
organic molecule found in many beverages such as
coffee, tea, energy drinks and cola, which make the
drinks addictive. Caffeine has drawn more attention due
to its physiological effects beyond its stimulatory effect on central nervous system, hence it is used both
recreationally and medically to reduce fatigue and
restored mental alertness when unusual weakness or
drowsiness occurs.[11] Akinbile Babatunde et.al in 2017
worked on the determination and characterisation of
caffeine in tea and soft drinks by derivative
spectrophotometry and HPLC. Isolation of caffeine from
samples was carried out by liquid-liquid extraction using
dichloromethane as an extracting solvent. The caffeine
extracts were analysed using PG T80UV/Visible
spectrophotometer series. The results also indicated that
caffeine can be extracted more at the boiling temperature
(100⁰C).[12]
MATERIALS AND METHODS
Sample Collection and Processing Samples were collected from Fancy Bazaar Guwahati,
Assam (Green Tea leaves), Siliguri Market, West Bengal
(Darjeeling Tea leaves) and Singtam Market, Sikkim
(Temi Tea Powder) and grinded Properly.
Extraction and Isolation[20]
50 gm of finely powdered tea leaves were placed in
a 400ml beaker and distilled water was added to it
and placed it on a heating mantle. Sodium carbonate
was added to this mixture and boiled for 20 minutes.
Water is occasionally added to keep the volume of
the solution constant.
The hot solution was then filtered through a muslin
cloth by simple filtration method.
The filtrate contains caffeine and tannin salt.
The filtrate was then placed in a separating funnel
and DCM was added to it. (1:1)
The two phase layer was formed i.e. organic and
aqueous layer.
The organic lower layer is separated, and the
aqueous layer is extracted twice with DCM.
Organic layer was collected and the solvent layer
was distilled off.
Crude caffeine is crystallised from a very small
quantity of hot acetone or water.
Reaction Involved
ArOH +Na2CO3→ArO-Na
++ Na
+HCO3
-
(Tannin is soluble in Water and DCM) (Tannin salts
Soluble in water but insoluble in DCM).
Chemical Tests
1. Warm a few milligram of caffeine with K [Fe (CN)
6] and HNO3, a Prussian blue colour must be
obtained.[21]
2. Murexide Test: Pinch of sample with concentrated
HNO3 and heat to dryness then add NH4 (OH) solution, light yellow / purple colour must be
observed.[22]
3. To a saturated solution of caffeine, add a few drops
of tannic acid solution; a white precipitate must be
produced which will be soluble in excess of the
reagent.[23]

www.ejbps.com
Dipankar et al. European Journal of Biomedical and Pharmaceutical Sciences
333
Determination of pH[24]
Instrument: Digital pH Meter (Labtech Instruments).
Principle: pH is a scale of acidity from 0 to 14. It tells
how acidic or alkaline a substance is. More acidic
solutions have lower pH. More alkaline solutions have higher pH. The pH of the Caffeine samples were
determined by Using Digital pH meter.
Calibration of pH meter: Instrument was calibrated by
using standard buffer solution of pH 4, pH 7 and pH 9.2
and then pH of test samples was determined.
1% solution of powdered caffeine was prepared in water
and subjected for pH study.
Thin Layer Chromatography[25]
Principle: TLC is an important analytical tool for the
separation, identification and estimation of different classes of compound. This method is based on the
principle of adsorption. When a mixture of compound
dissolved in a mobile phase move through a column of
stationary phase compound which has more affinity
towards the stationary phase travels slower and the
compound with lower affinity travels faster.
Fig. 3: Reaction of Caffeine with Spray reagent.
Procedure 1. Glass plates of a various sizes were washed properly
and allowed to dry for few minutes.
2. A slurry of silica gel G was prepared by mixing
adsorbent with sufficient quantity of water.
3. The consistency of slurry must be optimum to prepare a good TLC plate.
4. The slurry was poured over a glass plate uniformly
so that the thickness of the plate remains over same
throughout the plate.
5. The plates were allowed to dry at room temperature
for 5 minutes to avoid cracks during activation.
6. The plates were kept in a hot air oven at a
temperature of 105-1200C for 30 minutes. Activation
removes moisture from the plate so that separation
efficiency improves.
Preparation of mobile phase Three mobile phase was prepared:
Mobile phase I: It was prepared by mixing Ethyl
acetate and acetic acid (19:1)
Mobile phase II: It was prepared by mixing
chloroform, ethyl acetate and formic acid (10:8:2)
Mobile phase III: It was prepared by mixing
petroleum ether, methylene chloride and ethyl
acetate (5:5:10)
Sample application Draw an origin line with a height of 1cm from the
base of the TLC plate.
Apply the sample as spot equidistant from each
other.
Use capillary tube for marking the spot.
Development of spot Transfer these sample loaded TLC plates inside the
saturated development chamber for separation of
sample.
While putting the TLC plate into the chamber care
should be taken that the sample should not get
immersed in the mobile phase.
Allow the plate to develop until the height of the
solvent reaches 3/4th of the plate. Mark the solvent
front
Detection of spots Remove the plate from the chamber. Dry it in oven
for few minutes.
Spray the plate uniformly with iodine potassium
iodide and HCL solution. (Reagent A and Reagent
B)
Put the sprayed plate in hot air oven at a temperature
of about 105-1100C for 5 minutes for the
development of spots.
Preparation of iodine potassium iodide and HCl
reagent Weigh and dissolve 1gm of KI and 1gm of iodine in
100ml of ethanol-label as reagent A.
Prepare 25ml of 25% HCL and mixed with 25ml of
ethanol- label as reagent B.
www.ejbps.com
Dipankar et al. European Journal of Biomedical and Pharmaceutical Sciences
334
The plates are first sprayed with reagent A followed
by reagent B.
High Performance Liquid Chromatography[26]
Principle: It is based on the principle of adsorption.
When a mixture of compound is introduced in the HPLC column they travel according to their relative affinity
towards stationary phase. Component which have more
affinity towards stationary phase travel faster and the
component which have less affinity travels slower. Since
no components have no same affinity towards stationary
phase, the components can be separated.
Normal phase mode –as stationary phase is polar and
mobile phase is non-polar in nature in this technique
non-polar component travel faster and are eluted first.
This is due to the less affinity between the solute and
stationary phase. Polar component are retained for longer time in column and travel more time to be eluted due to
its affinity.
Reverse phase mode- Here non-polar stationary phase
and polar mobile phase is used. Polar components are
eluted first and non-polar component retained for longer
time.
Instrument: Uhplc ‘Dionex’
Model Number: Ultimate 3000
Chromatographic Condition Column-Reverse Phase C18
Flow rate-1ml/min
Injection Volume-20µl
Mobile Phase- Water: Methanol: Formic Acid
(50:50:0.1)
Detection-272nm
Procedure Preparation of standard solution: 10mg of standard caffeine was dissolved in mobile phase (water: methanol:
formic acid in the ratio 50:50:0.1) in a 100 ml volumetric
flask finally the volume was made up to the mark.
Preparation of sample solution: 10mg of sample
(isolated caffeine) was dissolved in mobile phase (water:
methanol: formic acid in the ratio 50:50:0.1) in a 100 ml
volumetric flask finally the volume was made up to the
mark.
Infrared Spectroscopy of Caffeine[27]
In this method, the powdered sample of caffeine was taken and placed on FTIR for study.
Instrument: Cary 630 FTIR (Agilent technologies)
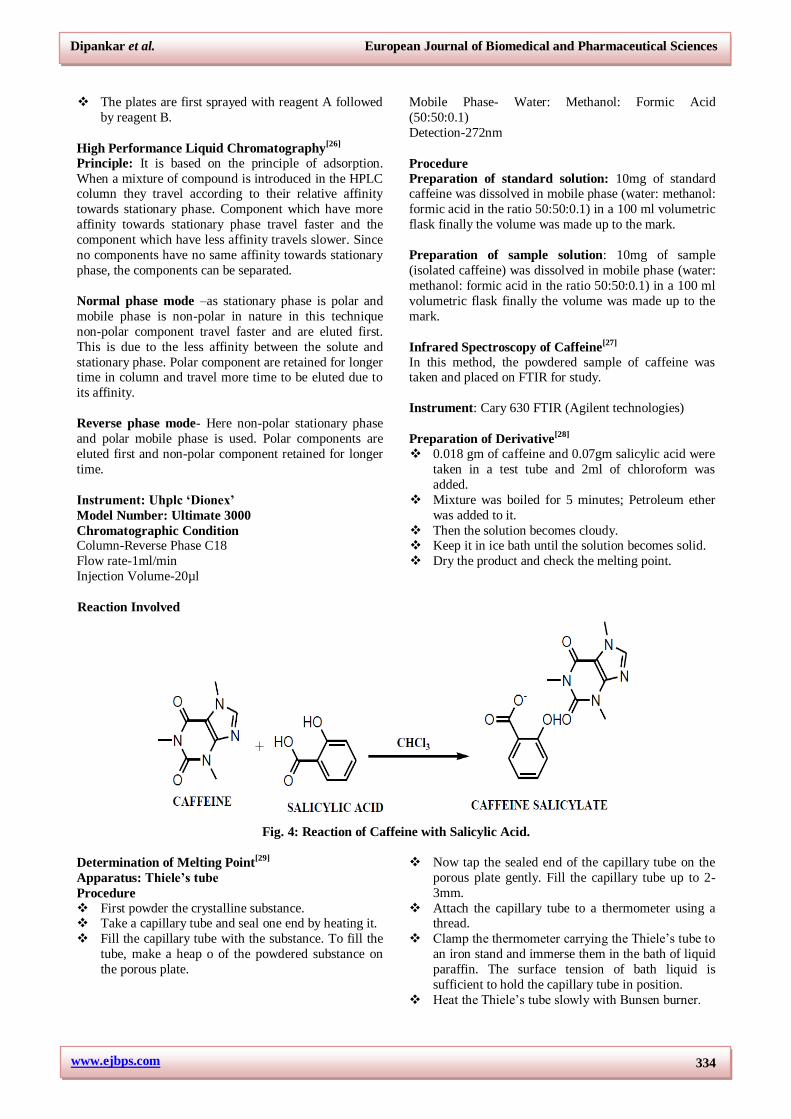
Preparation of Derivative[28]
0.018 gm of caffeine and 0.07gm salicylic acid were
taken in a test tube and 2ml of chloroform was
added.
Mixture was boiled for 5 minutes; Petroleum ether
was added to it.
Then the solution becomes cloudy.
Keep it in ice bath until the solution becomes solid.
Dry the product and check the melting point.
Reaction Involved
Fig. 4: Reaction of Caffeine with Salicylic Acid.
Determination of Melting Point[29]
Apparatus: Thiele’s tube
Procedure First powder the crystalline substance.
Take a capillary tube and seal one end by heating it.
Fill the capillary tube with the substance. To fill the
tube, make a heap o of the powdered substance on
the porous plate.
Now tap the sealed end of the capillary tube on the
porous plate gently. Fill the capillary tube up to 2-
3mm.
Attach the capillary tube to a thermometer using a thread.
Clamp the thermometer carrying the Thiele’s tube to
an iron stand and immerse them in the bath of liquid
paraffin. The surface tension of bath liquid is
sufficient to hold the capillary tube in position.
Heat the Thiele’s tube slowly with Bunsen burner.

www.ejbps.com
Dipankar et al. European Journal of Biomedical and Pharmaceutical Sciences
335
When the temperature is within 15 of melting point
of pure substance, the flame is reducing. Then the
temperature rose slowly.
Noted the temperature when the substance has
completely melted.
RESULTS AND DISCUSSION
Yield Percentage yield of caffeine Isolated from different variety of tea:
Table no. 3: Percentage Yield of Isolated Caffeine.
Tea Brands % Yield of Caffeine
Darjeeling Tea 0.67%
Temi Tea 0.72%
Green Tea 0.65%
Chemical Test
TEST: 1
Table no. 4: Chemical test of Caffeine with Potassium Ferro cyanide.
Sl. No Sample (Caffeine) Observation Inference
1 Standard Dark bluish color was obtained. Caffeine Present.
2 Darjeeling tea Dark bluish color was obtained. Caffeine Present
3 Temi tea Dark bluish color was obtained. Caffeine Present
4 Green tea Dark bluish color was obtained. Caffeine Present
Murexide Test
TEST: 2
Table no. 5: Murexide Test for Caffeine.
Sl.No Sample (Caffeine) Observation Inference
1 Standard Light yellow color is observed. Caffeine Present
2 Darjeeling tea Light yellow color is observed. Caffeine Present
3 Temi tea Light yellow color is observed. Caffeine Present
4 Green tea Light yellow color is observed. Caffeine Present
TEST: 3
Tannic acid test
Table no. 6: Tannic acid test for Caffeine.
Sl.no. Sample(Caffeine) Observation Inference
1 Standard A white precipitate was produced soluble in excess of the reagent.
Caffeine Present
2 Darjeeling tea A white precipitate was produced
soluble in excess of the reagent. Caffeine Present
3 Green tea A white precipitate was produced
soluble in excess of the reagent. Caffeine Present
4 Temi tea A white precipitate was produced
soluble in excess of the reagent. Caffeine Present
Determination of pH
Table no. 7: pH of Caffeine standard and Sample. Sl. No Sample (Caffeine) pH VALUE
1 Standard 6.240
2 Darjeeling tea 6.264
3 Green tea 6.663
4 Temi tea 6.714
Thin Layer Chromatography
Table no. 8: TLC of Caffeine by using Mobile Phase (1) Ethyl acetate: Acetic acid (19: 1).
Sl. No Sample (Caffeine) Distance Travelled by Solvent Distance Travelled by Solute Rf VALUE
1 Standard 4.5cm 2.5cm 0.55
2 Darjeeling tea 4.5cm 2.5cm 0.55
3 Temi tea 4.5cm 2.5cm 0.55
4 Green tea 4.5cm 2.5cm 0.55

www.ejbps.com
Dipankar et al. European Journal of Biomedical and Pharmaceutical Sciences
336
Table no. 9: TLC of Caffeine by using Mobile Phase: (2) Chloroform: Ethyl acetate: Formic acid (5:4:1).
SL. NO Sample
(Caffeine)
Distance Travelled
by Solvent
Distance Travelled
by Solute Rf VALUE
1 Standard 4.88cm 2.7cm 0.56
2 Darjeeling tea 4.88cm 2.7cm 0.56
3 Temi tea 4.88cm 2.7cm 0.56
4 Green tea 4.88cm 2.9cm 0.60
Table no. 10: TLC of Caffeine by using Mobile Phase (3) Petroleum ether: Methyl chloride: ethyl acetate (1:1:2).
SL. NO Sample
(Caffeine)
Distance Travelled
by Solvent
Distance Travelled
by Solute Rf VALUE
1 Standard 4.9cm 3.5cm 0.67
2 Darjeeling tea 4.9cm 3.5cm 0.67
3 Temi tea 4.9cm 3.5cm 0.67
4 Green tea 4.9cm 3.5cm 0.67
High Performance Liquid Chromatography
Fig: 10: HPLC Chromatogram for Standard Caffeine.

www.ejbps.com
Dipankar et al. European Journal of Biomedical and Pharmaceutical Sciences
337
Fig: 11- HPLC Chromatogram for Darjeeling Tea Caffeine.

www.ejbps.com
Dipankar et al. European Journal of Biomedical and Pharmaceutical Sciences
338
Fig: 12- HPLC Chromatogram for Temi Tea Caffeine.
www.ejbps.com
Dipankar et al. European Journal of Biomedical and Pharmaceutical Sciences
339
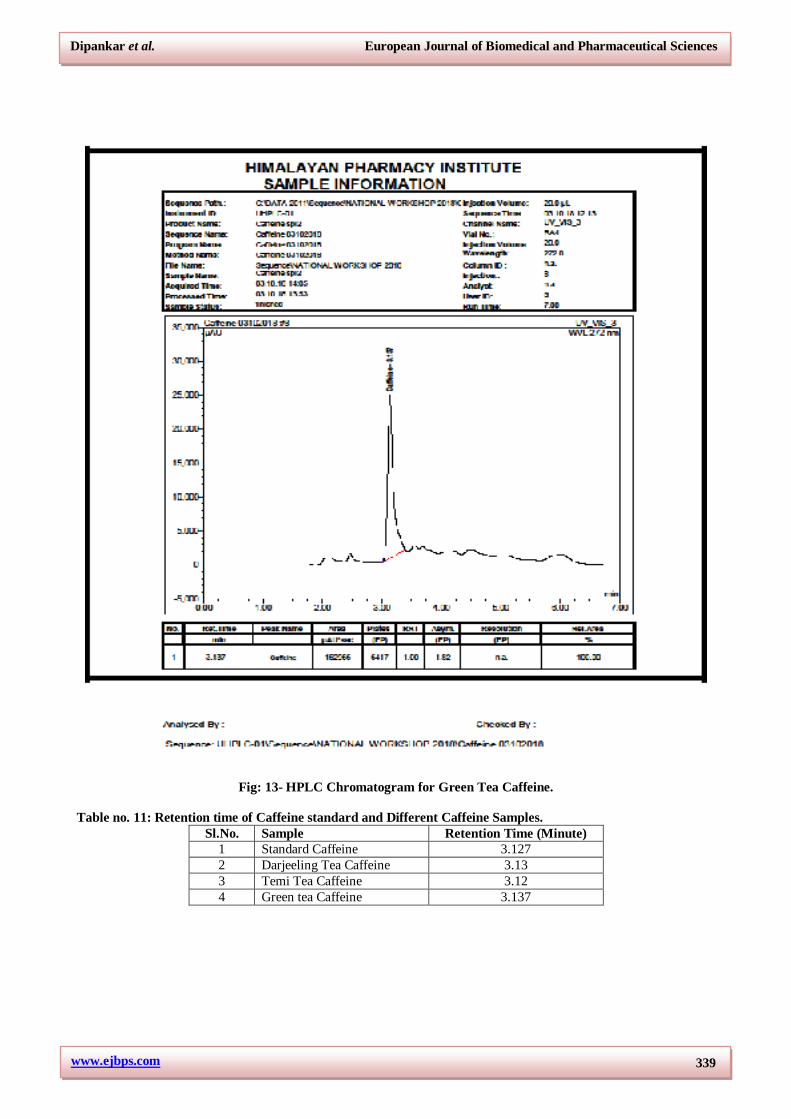
Fig: 13- HPLC Chromatogram for Green Tea Caffeine.
Table no. 11: Retention time of Caffeine standard and Different Caffeine Samples.
Sl.No. Sample Retention Time (Minute)
1 Standard Caffeine 3.127
2 Darjeeling Tea Caffeine 3.13
3 Temi Tea Caffeine 3.12
4 Green tea Caffeine 3.137

www.ejbps.com
Dipankar et al. European Journal of Biomedical and Pharmaceutical Sciences
340
Infrared Spectroscopy
Fig: 14- IR Spectra of Standard Caffeine.
Fig: 15- IR Spectra of Darjelling Tea Caffeine.
Fig: 16- IR Spectra of Temi Tea Caffeine.
www.ejbps.com
Dipankar et al. European Journal of Biomedical and Pharmaceutical Sciences
341
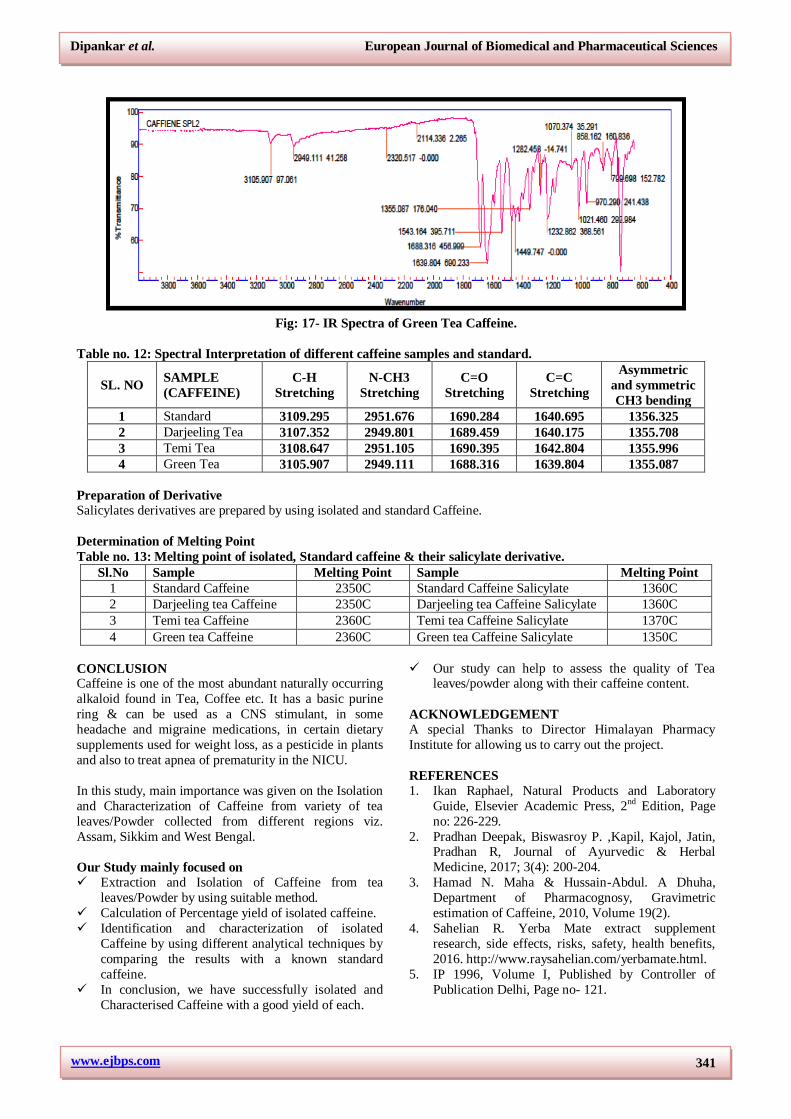
Fig: 17- IR Spectra of Green Tea Caffeine.
Table no. 12: Spectral Interpretation of different caffeine samples and standard.
SL. NO SAMPLE
(CAFFEINE)
C-H
Stretching
N-CH3
Stretching
C=O
Stretching
C=C
Stretching
Asymmetric
and symmetric
CH3 bending
1 Standard 3109.295 2951.676 1690.284 1640.695 1356.325
2 Darjeeling Tea 3107.352 2949.801 1689.459 1640.175 1355.708
3 Temi Tea 3108.647 2951.105 1690.395 1642.804 1355.996
4 Green Tea 3105.907 2949.111 1688.316 1639.804 1355.087
Preparation of Derivative Salicylates derivatives are prepared by using isolated and standard Caffeine.
Determination of Melting Point
Table no. 13: Melting point of isolated, Standard caffeine & their salicylate derivative.
Sl.No Sample Melting Point Sample Melting Point
1 Standard Caffeine 2350C Standard Caffeine Salicylate 1360C
2 Darjeeling tea Caffeine 2350C Darjeeling tea Caffeine Salicylate 1360C
3 Temi tea Caffeine 2360C Temi tea Caffeine Salicylate 1370C
4 Green tea Caffeine 2360C Green tea Caffeine Salicylate 1350C
CONCLUSION Caffeine is one of the most abundant naturally occurring
alkaloid found in Tea, Coffee etc. It has a basic purine
ring & can be used as a CNS stimulant, in some
headache and migraine medications, in certain dietary
supplements used for weight loss, as a pesticide in plants
and also to treat apnea of prematurity in the NICU.
In this study, main importance was given on the Isolation
and Characterization of Caffeine from variety of tea
leaves/Powder collected from different regions viz.
Assam, Sikkim and West Bengal.
Our Study mainly focused on
Extraction and Isolation of Caffeine from tea
leaves/Powder by using suitable method.
Calculation of Percentage yield of isolated caffeine.
Identification and characterization of isolated
Caffeine by using different analytical techniques by
comparing the results with a known standard
caffeine.
In conclusion, we have successfully isolated and
Characterised Caffeine with a good yield of each.
Our study can help to assess the quality of Tea leaves/powder along with their caffeine content.
ACKNOWLEDGEMENT
A special Thanks to Director Himalayan Pharmacy
Institute for allowing us to carry out the project.
REFERENCES 1. Ikan Raphael, Natural Products and Laboratory
Guide, Elsevier Academic Press, 2nd Edition, Page
no: 226-229.
2. Pradhan Deepak, Biswasroy P. ,Kapil, Kajol, Jatin, Pradhan R, Journal of Ayurvedic & Herbal
Medicine, 2017; 3(4): 200-204.
3. Hamad N. Maha & Hussain-Abdul. A Dhuha,
Department of Pharmacognosy, Gravimetric
estimation of Caffeine, 2010, Volume 19(2).
4. Sahelian R. Yerba Mate extract supplement
research, side effects, risks, safety, health benefits,
2016. http://www.raysahelian.com/yerbamate.html.
5. IP 1996, Volume I, Published by Controller of
Publication Delhi, Page no- 121.

www.ejbps.com
Dipankar et al. European Journal of Biomedical and Pharmaceutical Sciences
342
6. IP, 2007, Volume I; Controller of Publication, New
Delhi.
7. Tariq AL, Reyax AL. Phytochemical analysis of
Camellia sinensis leaves. Int.J. drug Dev. & Res.,
2012; 4(4): 311-316.
8. Weinberg, B. A. Caffeine & Neurotransmitters http://worldofcaffeine.com/caffeineand-
neurotransmitters (accessed Nov 19, 2017), Brain,
M. Caffeine and Adenosine
https://science.howstuffworks.com/caffeine4.htm
(accessed Nov 19, 2017).
9. Sitzman,
B.http://www.acs.org/content/acs/en/education/resou
rces/highschool/chemmatters/past-issues/archive-
2013-2014/caffeine.html (accessed Nov 19, 2017).
10. Pradhan Deepak, BiswasRoy -P, Kapil, Jotin Kajol,
Pradhan. R Qualitative & Quantitative analysis of
caffeine in some commercial brand of tea consumed in India. Journal of Ayurvedic & Herbal Medicine,
2017; 3(4): 200-204.
11. Babatunde A., Temilola Olyseyi, Olayin Kakehinde,
Ofudje Andrew, Determination and characterisation
of Tea, Coffee and Soft drinks by Derivative
Spectrophotometry and HPLC, 2013; 92-100.
12. Bansal K Raj, Laboratory Manual of O.C 5th edition,
page no: 238.
13. Ikan Raphael, Natural Products and Laboratory
Guide, Elsevier Academic Press, 2nd Edition, page
no: 232. 14. Siddiqui K & Semi Siddiqui, Experimental
Pharmaceutical Chemistry, CBS Publishers, 2nd
edition, 163-164.
15. Pradhan Deepak, Biswasroy P., Kapil, Kajol, Jatin,
Pradhan R, Journal of Ayurvedic & Herbal
Medicine, 2017; 3(4): 201.
16. Siddiqui K & Semi Siddiqui, Experimental
Pharmaceutical Chemistry, CBS Publishers, 2nd
edition, 163-164.
17. IP 2007, 1 Controller of publication, New Delhi.
18. J Muthanna, Firas A. AL-Bayati, Isolation,
identification & purification of caffeine from Coffea arabica L. and sinensis L. A combination
antibacterial study, IJGP, 2008; 3(4): 52-57.
19. Adullah Shakir. Z & Mehdi. H Kawthar, Study the
biological activity of caffeine salicylate &
theoretical investigation, Journal of Babylon
University/ pure and applied sciences, 2013; 5(21):
1666-1673.
20. The United States Pharmacopoeial Convention
12601, Twinbrook Parkway, Rockville, MD 20852,
USP NF 2008 Volume II, Page no- 1590.
21. Abdul Mumin Md, Kazi Farida Akhtar, Md Zainal Abedin, & Md. Zakir Hossain (2006). Determination
& Characterisation of caffeine in tea, coffee & soft
drink by solid phase extraction & HPLC. Malaysian
J. Chem., 45-51.