isolation and characterization of microbes for plant
TRANSCRIPT

- 1 -
ISOLATION AND CHARACTERIZATION OF
MICROBES FOR PLANT GROWTH-PROMOTION AND
BIOCONTROL PROPERTIES
A THESIS
Submitted
in the partial fulfillment of the requirements for
the award of the degree of
DOCTOR OF PHILOSOPHY
in
FACULTY OF BIOTECHNOLOGY
By
M SREEVIDYA
[Reg. No. 1103PH0235]
RESEARCH AND DEVELOPMENT CELL
JAWAHARLAL NEHRU TECHNOLOGICAL UNIVERSITY HYDERABAD
KUKATPALLY, HYDERABAD-500 085
INDIA
NOVEMBER 2015

- 2 -
ISOLATION AND CHARACTERIZATION OF
MICROBES FOR PLANT GROWTH-PROMOTION AND
BIOCONTROL PROPERTIES
A THESIS
Submitted
in the partial fulfillment of the requirements for
the award of the degree of
DOCTOR OF PHILOSOPHY
in
FACULTY OF BIOTECHNOLOGY
By
M SREEVIDYA
[Reg. No. 1103PH0235]
RESEARCH AND DEVELOPMENT CELL
JAWAHARLAL NEHRU TECHNOLOGICAL UNIVERSITY HYDERABAD
KUKATPALLY, HYDERABAD-500 085
INDIA
NOVEMBER 2015

- 3 -
DECLARATION
I hereby declare that the work described in this thesis, entitled “ISOLATION AND
CHARACTERIZATION OF MICROBES FOR PLANT GROWTH-PROMOTION
AND BIOCONTROL PROPERTIES” which is being submitted by me in partial
fulfillment for the award of Doctor of Philosophy (Ph.D.) in the Dept. of
BIOTECHNOLOGY to the Jawaharlal Nehru Technological University Hyderabad,
Kukatpally, Hyderabad (A.P.) -500 085, is the result of investigations carried out by me
under the Guidance of Dr. S. Gopalakrishnan.
The work is original and has not been submitted for any Degree/Diploma of this or any
other university.
Place: Hyderabad
Date: Signature
M. SREEVIDYA
1103PH0235

- 4 -
CERTIFICATE
This is to certify that the thesis / dissertation entitled “ISOLATION AND
CHARACTERIZATION OF MICROBES FOR PLANT GROWTH-PROMOTION
AND BIOCONTROL PROPERTIES” that is being submitted by Sri. M. SREEVIDYA
in partial fulfillment for the award of Ph.D. in BIOTECHNOLOGY to the Jawaharlal
Nehru Technological University is a record of bonafide work carried out by her under our
guidance and supervision.
The results embodied in this thesis have not been submitted to any other University or
Institute for the award of any degree or diploma.
Signature of Co-Supervisor Signature of Supervisor
Dr. S. Gopalakrishnan
Senior Scientist, Grain Legumes,
ICRISAT, Patancheru,
India.

- 5 -
CERTIFICATE
This is to certify that the thesis / dissertation entitled “ISOLATION AND
CHARACTERIZATION OF MICROBES FOR PLANT GROWTH-PROMOTION
AND BIOCONTROL PROPERTIES” that is being submitted by Sri. M. SREEVIDYA
in partial fulfillment for the award of Ph.D. in BIOTECHNOLOGY to the Jawaharlal
Nehru Technological University is a record of bonafide work carried out by her at our
organization/institution
Head/Director of Organization/Institution
Name and Designation

- 6 -
Acknowledgement
The completion of this research project would not have been possible without the support
of many peoples and institutions.
First I would like to express my profound gratitude to my supervisor
Dr. S. Gopalakrishnan, Senior scientist, Grain legumes, ICRISAT, for his valuable
advice and strong support throughout the course of this research and for his constructive
suggestions in the preparation of scientific papers for journals, and this manuscript. I
would also thankful to Dr. Mamta Sharma for helping in carrying out pathology
experiments. I would also thankful to Dr. Rajeev Kumar Varshney, Director, Grain
Legumes, ICRISAT and Dr. Hima Bindu Kudapa, Scientist, Applied Genomics
Laborotary, ICRISAT for providing me facility in carrying out molecular work.
I am also greatly thankful to Dr. Lakshmi Narasu, Dr. Archana Giri and Dr.
Uma and the review committee members in faculty of Biotechnology, JNTUH for their
excellent teaching and guidance which enabled me to complete my course work and
review process. I sincerely thank The Director, Research and Development Cell and all
other staffs of Research and Development Cell, JNTUH for their great support on the
time to time administration processes.
I would like to express my thanks to Knowledge Sharing and Innovation (KSI)
and Learning System Unit (LSU), ICRISAT, for permitting me to avail the research
facilities at ICRISAT, Patancheru.
I am so thankful to staff of the ICRISAT-Library for their kind support in
sharing research articles and books throughout the study period. I greatly thank the
day-to-day help and technical support from PVS. Prasad, P. Manohar, A. Jabbar, B.
Nagappa and D. Bharath from biocontrol lab.
I appreciate the friendship, guidance of all my seniors, labmates and friends
especially to G. Alekhya, V. Srinivas, Dr. A. Satya and Dr. R. Vijaya Bharathi for
their generous help during my research work.
I am thankful to Jawaharlal Nehru Technological University Hyderabad for
providing opportunities to study Doctoral degree and ICRISAT for research facilities

- 7 -
and financial assistance in the form of research scholar during course of my PhD research
work.
Finally, I would like to thank my family and almighty power for providing
enough strength to complete my research and thesis work.
M. SREEVIDYA

- 8 -
ABSTRACT
Chickpea and sorghum are the two important crops grown in semi-arid tropics; several
biotic factors were influencing the growth and yield of these crops. Chemical control is
generally used to control the damage, but the indiscriminate use of chemicals lead to
negative impacts on nature. Biological control is the safe and alternative method to
control the pathogens as well as to promote plant growth, in which plant growth-
promoting (PGP) microbes were used. In the present study, a total of 89 actinomycetes,
74 bacteria and 48 fungi were isolated from chickpea rhizosphere soil and vermicompost.
The isolates were tested for their antagonistic potential against important fungal
pathogens of chickpea and sorghum by dual culture, metabolite production assays. Based
on the results of dual culture and metabolite production assays, four actinomycetes (viz.
SAI-13, SAI-29, VAI-7 and VAI-40), four bacteria (viz. SBI-23, VBI-4, VBI-19 and
VBI-23) and one fungal isolate (VFI-51) were selected for further studies. All the
selected isolates possess plant growth-promotion (PGP) traits such as production of
indole acetic acid (IAA), siderophore, protease, lipase, chitinase, cellulase and β,1-3
glucanase. All the selected isolate were able to tolerate harsh growth conditions such as
high temperature (upto 40°C), pH (upto 11), salinity (upto 10 % NaCl) and resistant to
fungicides such as Thiram, Bavistin, Benlate, Ridomil and Captan. The molecular
identification studies revealed that all actinomycetes isolates belong to Streptomyces sp.,
all bacterial isolates belong to Bacillus sp. and the fungal isolate was identified as
Penicillium citrinum. When the selected isolates were tested for their PGP ability under
greenhouse (GH) and field conditions, all the isolates increased the growth and yield
traits of chickpea and sorghum. The fungal isolate VFI-51 effectively controlled the
pathogen M. phaseolina causing charcoal rot in sorghum under light chamber and GH
conditions. All the selected isolates were able to colonize on root surface of chickpea and
sorghum without causing damage to root surface. In qRT-PCR studies, there was an up-
regulation of siderophore, IAA and β,1-3 glucanase genes. The active secondary
metabolite from culture filtrates of Penicillium citrinum (VFI-51) was identified as
‘citrinin’ by NMR-MS studies and proved its efficacy in controlling the pathogen Botyrtis

- 9 -
cinerea under GH conditions. Hence, the selected isolates can be exploited for their PGP
and biocontrol properties.

- 10 -
CONTENTS
Chapter Title
I INTRODUCTION
II REVIEW OF LITERATURE
III MATERIALS AND METHODS
IV RESULTS
V DISCUSSION
VI REFERENCES

- 11 -
Introduction Legumes are important because of their importance in atmospheric nitrogen fixation to
ammonia, for readily availability of nitrogen to plants. They are rich in protein content,
minerals and vitamins, hence legumes are important in animal and human nutrition.
Chickpea, pea and lentil are the three cool season legumes grown in the semi-arid tropics
(Varshney et al., 2009). Cereals can be defined as grasses of family Poaceae, and the
grains are collected for food. Cereals are important crops in world in terms of area under
cultivation, and also contribution to the diet to man and his livestock. Wheat, rice and
maize are the top most cultivated cereals. Sorghum, barley, oats, millets and rye are
cultivated next and important for semi-arid areas, where water is scarce (Lazzeri et al.,
1998). Semi-arid tropics are the regions with climate in between temperate and tropical
climates mainly support the growth of grasses and shrubs. Chickpea and sorghum are
important legume and cereal crops in semi-arid tropics contributing major role in human
and animal nutrition.
Chickpea
Chickpea (Cicer arietinum L.) belong to order Fabales, family Fabaceae and genus
Cicer, is most widely grown legume crop in world after common bean, with an annual
production of 13.8 m tons (FAOSTAT, 2014). Chickpea mainly used as food for humans
because of its nutritional values such as high protein (12─31%) and carbohydrate
(52─71%) contents (Awasthi et al., 1991). Chickpea is cholesterol free and is a good
source of dietary fiber, vitamins such folic acid, tocopherols (γ and α) riboflavin (B2),
pantothenic acid (B5) and pyridoxine (B6) and minerals like calcium, phosphorus,

- 12 -
copper, iron, zinc, manganese and magnesium (Jukanti et al., 2012). Chickpea is mainly
divided into two types, ‘Desi’ (microsperma) and ‘Kabuli’ (macrosperma). Desi
chickpeas are light brown in color and small in size, while Kabuli seeds are light creamy
in color and much larger than Desi variety. Kabuli seeds are thin layered and a popular
around the world. Chickpea mainly grown and consumed in South-East Asia to India and
in the Middle East and Mediterranean countries. It is in second place in area and third in
production worldwide in pulses. Globally, more than 90 % of chickpea production occurs
in the semi-arid tropics of Asia and Africa. Asia accounts for 88 % of global chickpea
production whereas India is the largest producer accounting for 75 % of Asia’s chickpea
production (Rao et al., 2010). There is a growing international demand for chickpea and
chickpea importing countries also increased from about 60 (1989) to over 140 (2009).
This is partially due to increased awareness about the health benefits of pulses, including
chickpea. The favorable conditions for growing chickpea are low temperatures, less
rainfall and soils with neutral pH. Chickpea is relatively drought tolerant when compared
with other pulses. However, it is sensitive to high moisture and high temperatures (Clarke
and Siddique 2004).
Production constraints of chickpea
Number of abiotic and biotic factors influencing crop and yield of chickpea. Abiotic
factors include high temperature, cold, drought, stress conditions such as salinity and pH.
Biotic factors include diseases caused by fungi, bacteria, nematodes, mycoplasma and
insect pests. Nearly 172 pathogens have been reported to infect chickpea in different parts
of the world (Nene et al., 1996), but only a few of them are having economic importance.

- 13 -
Insect pests are the major group affecting chickpea crop, they include Liriomyza cicerina,
Chromatomyia horticola, Agrotis ipsilon, Helicoverpa armigera and Spodoptera litura.
Though both insect pests and pathogens are major constraints for producing chickpea, in
the present study, we are concentrating only on pathogens. Fungi are the largest group
affecting stems, roots, leaves, flowers and pods. Chickpea crop is mainly affected by
Fusarium wilt, dry root rot, collar rot, Ascochyta blight and Botrytis gray mold (BGM)
caused by Fusarium oxysporum f. sp. ciceri (FOC), Rhizoctonia bataticola, Sclerotium
rolfsii, Ascochyta rabiei and Botrytis cinerea, respectively resulting in reduced crop yield
(Akhtar and Siddiqui, 2010; Sharma et al., 2010). Fungal diseases in chickpea are more
important because of losses caused by them. Fungal pathogens in soil are mainly
controlled by conventional methods such as solarization, fumigation methods. Chemicals
are generally used to control the fungal pathogens. Although there are 172 pathogens of
chickpea the most economic important ones are listed below.
Fusarium wilt
Fusarium wilt disease caused by FOC is now widely spread in most chickpea growing
areas of Asia, Africa, southern Europe and the Americas. Yearly yield losses are
estimated at 10-15 % in India and Spain, with losses of 70-100 % in years of severe
outbreaks of the disease. Wilt is a seed and soil borne disease. Wilt incidence is generally
higher when chickpea is grown in warm and dry climates (> 25°C) and when crop
rotations are not followed. The field symptoms of wilt appear as patches with dead
seedlings or adult plants. Chickpea crop can be affected by Fusarium wilt any stage.
Affected seedlings do not rot on the stem or root surface. The affected plants show

- 14 -
typical wilting, i.e, drooping of the petioles, rachis and leaflets. When the stem is split
vertically, internal discoloration can be seen. Around the collar region, above and below,
the xylem in the central inner portion (pith and part of the wood) is discolored dark
brown or black. In the initial stage of wilting, the discoloration may not be continuous.
Dry root rot
Dry root rot caused by R. bataticola is now major threat to chickpea cultivation in semi-
arid regions because the crop subject to infection due to moisture, stress and high
temperatures in the flowering and maturation stage (Sharma et al., 2010). The pathogen is
a facultative sporophyte and is both seed borne and soil borne. Maximum ambient
temperatures above 30°C, minimum above 20°C, and moisture stress (dry conditions) at
the reproductive stages favor disease development. The disease generally appears around
flowering and podding time in the form of scattered dried plants. The seedlings can also
get infected. The susceptibility of the plant to the disease increases with age. The leaves
and stem turns to straw colored and the tap root becomes dark and is devoid of most of its
lateral and finer roots.
Collar rot
Collar rot caused by S. rolfsii, occurs in every region where chickpea is cultivated. It is a
widely prevalent disease and can cause considerable loss to the plant stand when soil
moisture is high and temperatures are warm (30°C) at sowing time. Most often, collar rot
is seen at the seedling stage (up to 6 weeks after sowing), particularly if the soil is wet.

- 15 -
Affected seedlings turn yellow. Young seedlings may collapse, but older seedlings may
dry without collapsing.
Botrytis gray mold (BGM)
BGM caused by B. cinerea is a serious disease in Asian countries such as Bangladesh,
India, Nepal, Pakistan, Australia, Argentina and it has also been reported from Canada,
the USA and Vietnam. It can cause yield losses up to 100%. BGM is a seed borne
disease, usually seen at flowering stage when the crop canopy is fully developed.
Excessive vegetative growth due to too much irrigation or rain, close spacing, and
varieties that have a spreading habit favor disease development. Temperatures between
20 and 25°C and excessive humidity around flowering and podding stages favor disease
development.
Sorghum
Sorghum (Sorghum bicolor (L.) is a self-pollinated, C4 grass belong to order Poales,
family Poaceae, sub family Panicoideae and tribe Andropogoneae. It is fifth most
important cereal grain worldwide. Sorghum is a cultivated tropical cereal grass. Sorghum
is produced throughout the tropical, semi-tropical and arid regions of the world. Sorghum
came to the Americas via trade routes in the 1700’s. USA is producing more grain
sorghum after India, Nigeria, and Mexico. It is important cereal grain in Africa and India.
Main exporting countries are the United States, Australia and Argentina. Now, sorghum
is cultivated all over the world in the semi-arid areas. It tolerates higher temperatures
when compared with soybeans, wheat, corn and other crops. There are no defined reasons

- 16 -
for sorghum’s environmental tolerance, sorghum has very long penetrating roots.
Sorghum mainly conserves moisture by minimizing transpiration when stress occurs by
leaf rolling and closing stomata; epicuticular wax present in higher amounts seems to
have more importance in this respect, sorghum also have a high capacity for osmotic
adjustment to stress to maintain turgor pressure in cells. Sorghum crop does not need
high level chemical treatment and pesticide application. It has the potential to adapt itself
to the given natural environment. It can be called “Nature-cared Crop” as it requires little
artificial care such as irrigation and insect removal. World annual sorghum production is
over 60 m tons, of which Africa produces about 20 m tons.
In sorghum there are different varieties,
a) Grain Sorghum: Mainly used as a principal food in tropical areas and often used as raw
materials for alcoholic beverages, sweets and glucose.
b) Sweet Sorghum: Used as a material for sweetener syrup.
c) Broom Sorghum: Used as a material to make brooms.
d) Grass Sorghum: Grown for green feed and forage use.
Production constraints of sorghum
Sorghum crop is affected by number of insect pests and pathogens. causing diseases like
charcoal rot, Fusarium rot, stalk rot, rough leaf spot, grey leaf spot, downy mildew,
sorghum red stripe and anthracnose.
Charcoal rot

- 17 -
Charcoal rot, caused by Macrophomina phaseolina (Tassi) Goid, is the most common
and important disease of sorghum affecting root and stalk regions. This disease
sometimes appears and sometimes absent. In India the disease is widespread in all areas
growing sorghum. Symptoms such as premature drying of stalks, lodging of plants, soft
stalks, root rot, poorly developed panicles with low quality grain formation. The most
common indication is lodging of plants by reaching maturity. M. phaseolina may also
causes seedling blight or damping-off, under high temperatures and moist conditions
(Uppal et al., 1936).
Anthracnose
Anthracnose in sorghum, caused by Colletotrichum graminicola, one of the most
destructive diseases, is seed and soil-borne (Cardwell et al., 1989; Casela and
Frederiksen, 1993) and occurs world-wide. The pathogen affects fodder quality and
causes grain yield loss above 50 % (Thakur and Mathur, 2000). The disease is prevalent
in the tropical or sub-tropical environments experiencing frequent rainfall, high relative
humidity and warm temperature (Thakur and Mathur, 2000; Valério et al., 2005).
Grain molds
Grain molds caused by Fusarium species may be a limiting factor in grain sorghum
production. The disease is mainly characterized by spoiling of several to all florets in
seed heads. Under severe conditions entire panicle maybe covered with copious cream to
pinkish-tan fungal growth. If the panicle is split lengthwise, a red-brown-black

- 18 -
discoloration is evident in the upper portion of the peduncle and extends into the branches
of the head. Sometimes the discoloration may extend throughout the peduncle and into
the upper internodes of the stalk, in which case the rind also may be discolored. In severe
cases, extensive breakover of peduncles may occur. Patterns of penetration and infection
by the fungus have not been elucidated fully. Mycelium of the fungus could grow up
along the outside of the stalk on waxy bloom or the fungus could arrive in the head as
airborne conidia. Penetration probably occurs through cracks or insect wounds in the rind
of the peduncle, rachis, or panicle branches.
Plant growth-promoting microorganisms (PGPM)
The use of chemicals to control the diseases caused by phytopathogens is increasing day
to day and thus leading to accumulation of chemicals in to the environment thus resulting
in adverse effects. Globally approximately 2.5 million tons of pesticides were used
annually which in return lead to accumulation of harmful pesticides in to environment
(Rao et al., 2015). In order to avoid the damage caused by chemicals biological methods
are followed they are called biological control methods, where group of microorganisms
are used to control phytopathogens. The bacteria living in soil rhizosphere helps in plant
growth-promotion (PGP) by direct and indirect mechanisms, enhance plant growth, yield,
protect plant from pathogen infection, as well as help plant to combat from biotic or
abiotic stress, without causing any loss (Lugtenberg and Kamilova, 2009). The other
sources of PGPM are vermicompost, oceans and microbes occurring as endophytes.
Composting has been defined as intense microbial activity leading to decomposition of
most biodegradable materials (Weltzien 1991; Adani et al., 1997). In this process,

- 19 -
complete or partial degradation of a variety of chemical and biological compounds by a
consortium of microorganisms (Whitney & Lynch, 1996). A variety of microorganisms
are involved composting and it is important to have diverse microbes for a satisfactory
composting process (Beffa et al., 1996). Identification and characterization of dominant
microorganisms may result in an improved understanding of the mechanisms by which
composts induce suppression of plant pathogens. Suppression of several plant diseases by
the activity of microorganisms isolated from compost has been reported (Hoitink & Fahy
1986). Applying compost to the soil not only confers to PGP, but also controls the
phytopathogens.
PGPM enhances plant growth by two methods, directly by producing
phytohormones such as auxins (indole acetic acid (IAA), gibberillins etc. and
siderophores making Fe available for growth and indirectly by producing lytic enymes,
antibiotic compounds and volatile compounds such as HCN. PGPM include a number of
bacterial, actinomycetes and fungal species. PGPM controls phytopathogens by
producing different compounds such as siderophores, antibiotics, volatile compounds and
a group of lytic enzymes (El-Tarbily and Sivasithamparam, 2006). They compete with
the pathogen, by inducing systemic resistance of plant, by producing siderophores,
volatile compounds and lytic enzymes to prevent the growth of pathogens (Compant et
al., 2010). This group of microbes includes bacteria, actinomycetes and fungi. The
actinomycetes, mainly those belonging to Streptomyces sp. make up an important group
of soil microbes. Streptomyces are abundant in soil and help in the degradation of
complex molecules to simple molecules for plant growth and development and control
plant pathogens (Petrosyan et al., 2003; Ding et al., 2004; Nassar et al., 2003). The fungi

- 20 -
mainly include Trichoderma spp. and Gliocladium etc. Similarly a number of bacterial
species include Bacillus spp., Serratia spp., Pseudomonas spp., Paenibacillus spp. etc.
Direct and indirect mechanisms of plant growth and biocontrol by PGPM
PGPM controls the phytopathogens by producing secondary metabolites such as
siderophores, antibiotics, lytic enzymes, volatile compounds
Production of siderophores
Iron is generally present in ferric state in nature and sparingly soluble, so the amount of
available iron in the soil available for microbes is very less. PGPM present in soil
produce low molecular weight molecules known as siderophores which can bind iron
(Fe+3
) with high affinity (Castignetti and Smarrelli, 1986) and transport to the microbial
cell through specific receptors (Neilands and Leong, 1986; Briat, 1992). PGPM prevent
the proliferation of phytopathogens by limiting Fe availability, and thereby facilitate plant
growth by secretion of siderophores (O'Sullivan and O'Gara, 1992). Fungal
phytopathogens also synthesize siderophores which generally have a lower affinity to
bind Fe than biocontrol PGPM siderophores (Schippers et al., 1987). Plants generally
grow at very low concentrations of Fe than needed for microbial growth, so they were un-
affected by the action of PGPM siderophores (O'Sullivan and O'Gara, 1992).
Production of Antibiotics
Production of antibiotics by PGPM is another most important mechanism by which
pathogen growth is controlled. The antibiotics synthesized by biocontrol Pseudomonads
spp. include agrocin 84, agrocin 434, 2,4-diacetylphloroglucinol, herbicolin, pyrrolnitrin,

- 21 -
oomycin, pyoluteorin and phenazines. The biocontrol activity of a number antagonistic
microorganisms is directly related to the ability of the microbe to produce antibiotics.
However, an antibiotic that is specific for the pathogen strain and may not prevent the
disease caused by other strains of the pathogen to the plant and sometimes it may not be
as effective as in laboratory under more variable field conditions.
Production of hydrolytic enzymes
Plants produce pathogenesis related (PR) proteins, which include hydrolytic enzymes
when attacked by pathogens that can hydrolyze the fungal cell walls (Mauch et al., 1988).
PGPM strains found to produce lytic enzymes such as protease, lipase, chitinase,
cellulase and β-1,3-glucanase that can lyse fungal cells, helps in biocontrol of
phytopathogens (Chet and Inbar,1994). The non-pathogenic strains of PGPM acts as
inducers in plants to produce these lytic enzymes.
Production of volatile compounds
Microbial volatile compounds formed as intermediate products in several metabolic
pathways and belong to different classes such as mono- and sesquiterpenes, esters,
alcohols, lactones and ketones (Korpi et al., 2009). These volatile compounds have been
shown to be involve in biocontrol and can protect plant from pathogen attacks
(Sivasithamparam and Ghisalberti, 1998). Volatile compounds produced by Trichoderma
act against plant pathogenic moulds and facilitates plant growth (Vinale et al., 2008).
Competition for nutrients

- 22 -
In addition to the above mentioned mechanisms competition for nutrients and space for
colonization on the root surface is also an important mechanism by which some
biocontrol PGPM may protect plants from phytopathogens (Kloepper et al., 1988;
O'Sullivan and O'Gara, 1992). Phylosphere saprophytic bacteria that compete
successfully with pathogens for these sites can often reduce disease incidence.
Objectives of the study
The main objectives of the present study are;
1. To isolate actinomycetes, bacteria and fungi from chickpea rhizosphere soil and
vermicomposts, characterization for their PGP and biocontrol traits under in vitro
conditions.
2. Evaluation of selected isolates for their PGP potential under in vivo conditions.
3. Evaluation of selected isolates for their biocontrol potential under in vivo
conditions.
4. Isolation and purification of secondary metabolites from selected isolates.

- 23 -
Materials and methods
Preparation of herbal vermicompost
Foliages of five different botanicals (Jatropha curcas, Annona squamosa, Parthenium
hysterophorus, Gliricidia sepium and Azadirachta indica) were collected from ICRISAT-
Patancheru, air-dried at room temperature (30 ± 2 oC) and composted in 200 L plastic
barrel, a metal grill was placed 10 cm from the bottom and the air dried herbal foliages
were arranged as bed and earthworms (Eisenia foetida). The bed was moistened and then
covered with a lid and layers of foliages were added once in week. This was left until all
the foliages were digested when the herbal compost was ready, about 100 g of the sample
was collected and used for the isolation of microorganisms.
Collection of chickpea rhizosphere soil
Rhizosphere soil samples were collected from the organic fields of chickpea. Soils were
collected from depth of 0 to 15 cm with the help of an iron gun and the soil samples used
for isolation of microorganisms.

- 24 -
Isolation of bacteria, actinomycetes and fungi
Bacteria, actinomycetes and fungi were isolated from herbal vermicompost (Jatropha
curcas, Annona squamosa, Parthenium hysterophorus, Gliricidia sepium and
Azadirachta indica) and chickpea rhizosphere soils. Ten grams of each vermicompost
and rhizosphere soils were suspended in 90 mL of sterile physiological saline (0.85 %
NaCl in distilled water) in a bottle and kept for shaking on an orbital shaker (at 100 rpm)
at 28 ± 2 °C for 1 h and the samples were serially diluted up to 105 dilutions and samples
from 104 and 10
5 dilutions were spread plated (0.1 mL) on Luria-Bertaini (LB) agar (Hi
Media) for bacteria, actinomycetes isolation (AI) agar (Hi Media) for actinomycetes and
102 and 10
3 dilutions were spread plated on potato dextrose (PD) agar (Hi Media) for
isolation of fungi. All the plates were incubated at 28 ± 2 °C. Bacterial colonies were
picked from LB agar plates after 47 h incubation. Actinomycetes were picked from AI
agar plates after 7 days and fungal colonies were isolated from and stored on AI agar
slants.
Preservation of bacteria, actinomycetes and fungi
Isolated cultures were preserved for further use by agar slants, bacteria on LB agar slants,
actinomycetes on AI agar slants and fungi by PD agar slants. For long time preservation
cultures were stored by lyophilization.

- 25 -
Screening of isolated bacteria, actinomycetes and fungi against fungal pathogens of
chickpea and sorghum
The isolated bacteria, actinomycetes and fungi were screened for their antagonistic
activity against pathogens of chickpea such as S. rolfsii, R. bataticola (three strains viz.
RB-6, RB-24 and RB-115), Botrytis cinerea, FOC (acquired from legumes pathology,
ICRISAT, Patancheru) and sorghum such as Fusarium proliferatum (FM-242), Fusarium
andyazii (FM-943) and Macrophomina phaseolina.
Screening by dual culture assay (DCA)
Initial screening was done by dual culture assay by using Glucose casaminoacid yeast
extract (GCY) agar plates were divided in to two equal halves at one end pathogen was
placed, on the other end antagonist was placed and in control plates only pathogens were
placed. Plates were incubated at 28 ± 2 oC until the pathogen in control plates covered
completely. The inhibition of pathogen were recorded as 0, 1, 2, 3 and 4 reporting as no
inhibition, slight inhibition, moderate inhibition, good inhibition and excellent inhibition
respectively.
Secondary metabolite production assay of selected isolates
Promising isolates were selected based on the dual culture assay results, the culture
filtrates of the isolates were extracted by growing bacteria in LB broth, actinomycetes
and fungi in starch casein broth (SCB). Bacteria were harvested after 48 h of incubation,

- 26 -
actinomycetes and fungi were harvested after 5 days incubation. The culture filtrates
were collected by centrifugation at 10,000 rpm for 20 minutes. The collected culture
filtrates were partitioned for three times with equal volumes of ethyl acetate (EtOAc) and
the resultant organic (EtOAc) fractions were added with anhydrous sodium sulphate,
clear solvent fraction was collected. Both organic and aqueous fractions were evaporated
on a rotary evaporator and collected in a minimal volume of methanol (MeOH). Both the
aqueous and organic fractions were evaluated for their antagonistic potential against the
fungal pathogens of chickpea and sorghum. For bioassay, a fungal disc of 6 mm
diameter was bored and kept at center of the potato dextrose agar plate amended with
either organic or aqueous fractions (at a concentration of 0.5 %). Control plates were
added with MeOH. The plates were incubated at 28 ± 2 oC for 5 days and inhibition of
the pathogen was recorded for both dual culture and metabolite production assays on a
scale of 0, 1, 2, 3 and 4 as no inhibition, slight inhibition, moderate inhibition, good
inhibition and excellent inhibition respectively.
Evaluation of bacteria, actinomycetes and fungi for their PGP and biocontrol traits
The most promising isolates were evaluated for production of biocontrol and PGP traits
such as protease, chitinase, lipase, siderophore, cellulase, hydrocyanic acid (HCN),
indole acetic acid (IAA) and β-1, 3-glucanase.
Production of IAA

- 27 -
IAA production was estimated as per the protocols of Patten and Glick (1996). The
actinomycetes and fungi were grown in starch casein broth supplemented with L-
tryptophan (1 μg ml-1) for four days. Bacteria were grown in LB broth supplemented
with L- tryptophan for 48 h. At the end of the incubation, the cultures were centrifuged at
10,000g for 10 min and the supernatants collected. One ml of this culture filtrate was
allowed to react with 2 ml of Salkowsky’s reagent (1 ml of 0.5 M FeCl3 in 50 ml of 35%
HClO4) at 28 ± 2 °C for 30 min. At the end of the incubation, development of pink color
indicated the presence of IAA. Quantification of IAA was done my measuring the
absorbance in a spectrophotometer at 530 nm. A standard curve was plotted to quantify
the IAA (μg ml-1
) present in the culture filtrate. Observations were recorded on a 0−4
rating scale as follows: 0= no IAA production, 1=0−5 μg ml-1, 2=6−10 μg ml-1,
3=11−15 μg ml-1, 4=16−20 μg ml-1.
Production of siderophores
Siderophore production was determined according to the methodology described by
Schwyn and Neilands (1987). The bacteria and actinomycetes cultures were inoculated
on to sterile paper discs placed on chrome azurol S (CAS) agar and incubated at 28 ± 2
°C. For fungus fungal discs were bored and kept on chrome azurol S (CAS) agar plates.
Bacterial cultures were incubated for 48 h, actinomycetes and fungus were incubated for
four days. When the microbes consume iron, present in the blue-colored CAS media,
orange zones are produced around the colonies, which indicate the presence of
siderophores. At the end of the incubation, the plates were observed for orange zone
around the colonies. Observations were recorded on a 0−4 rating scale as follows: 0 = no
- 28 -
zone; 1 = orange zone less than 1 mm; 2 = orange zone of 1−3 mm; 3 = orange zone of
4−6 mm and 4 = orange zone of 7 mm and above.
Production of protease
Production of protease by selected bacteria, actinomycetes and fungi done as per the
protocols of Bhattacharya et al., (2009). Casein agar plates were prepared, the bacteria
and actinomycetes cultures were inoculated on sterile paper discs and incubated at 28 ± 2
°C. For fungus fungal discs were bored and kept on casein agar plates. Bacterial cultures
were incubated for 48 h, actinomycetes and fungus were incubated for four days. At the
end of the incubation, the plates were observed for halo zone around the colonies, which
indicates the presence of protease. Observations were recorded on a 0−4 rating scale as
follows: 0 = no zone; 1 = zone less than 1 mm; 2 = halo zone of 1−3 mm; 3 = halo zone
of 4−6 mm and 4 = halo zone of 7 mm and above.
Production of lipase
Lipase production was estimated as per the protocols of Bhattacharya et al., 2009. Tween
80 was added to the medium. The bacteria and actinomycetes cultures were inoculated on
to sterile paper discs placed on Tween 80 agar and incubated at 28 ± 2 °C. For fungus
fungal discs were bored and kept on Tween 80 agar plates. Bacterial cultures were
incubated for 48 h, actinomycetes and fungus were incubated for four days. At the end of
the incubation, the plates were observed for halo zone around the colonies, which
indicates the presence of lipase. Observations were recorded on a 0−4 rating scale as

- 29 -
follows: 0 = no zone; 1 = zone less than 1 mm; 2 = halo zone of 1−3 mm; 3 = halo zone
of 4−6 mm and 4 = halo zone of 7 mm and above.
Production of chitinase
Chitinase production was estimated by growing selected bacteria, actinomycetes and
fungi on chitin agar. Colloidal chitin was prepared freshly and used in the chitin agar as
per the standard protocols of Hirano and Nagao (1988). The bacteria and actinomycetes
cultures were inoculated on to sterile paper discs placed on chitin agar and incubated at
28 ± 2 °C. For fungus fungal discs were bored and kept on chitin agar plates. Bacterial
cultures were incubated for 48 h, actinomycetes and fungus were incubated for four days.
At the end of the incubation, the plates were observed for halo zone around the colonies,
which indicates the presence of chitinase. Observations were recorded on a 0−4 rating
scale as follows: 0 = no zone; 1 = zone less than 1 mm; 2 = halo zone of 1−3 mm; 3 =
halo zone of 4−6 mm and 4 = halo zone of 7 mm and above.
Production of β-1, 3-glucanase
Production of β-1,3-glucanase was determined as per the protocols of Singh et al.,
(1999). The selected cultures were grown in Tryptic soy broth, supplemented with 1 %
colloidal chitin (weight/volume), at 28 ± 2 °C. Bacterial cultures were incubated for 48 h,
actinomycetes and fungus were incubated for four days. At the end of incubation, the
cultures were centrifuged at 10,000g for 12 min and the supernatants collected. One ml of
the culture filtrate was allowed to react with 0.1 ml of laminarin solution (2 %,
weight/volume) in 0.2 M acetate buffer (pH 5.4) at 40 °C for 1 h. The reaction was

- 30 -
arrested by adding 3 ml of dinitrosalicylic acid to the mixture and kept at boiling for 10
min. The development of dark red color indicated the presence of reducing sugar, and the
concentration of the reducing sugar was determined by measuring the absorbance at 530
nm in a spectrophotometer. Calibration standards were prepared using glucose at 0−1 mg
mL-1 at the interval of 0.2 mg mL-1. One unit of β-1,3-glucanase activity was defined as
the amount of enzyme that liberated 1 μmol of glucose hour-1 at defined conditions.
Treatments were replicated three times and the experiment was conducted three times.
Observations were recorded on a 0−4 rating scale as follows: 0= no glucose produced,
1=0.1−0.2 mg mL-1, 2=0.2−0.3 mg mL-1, 3=0.3−0.4 mg mL-1, 4=0.4−0.5 mg mL-1.
Production of cellulase
Production of cellulase was determined by the standardized protocols of Hendricks et al.,
(1995) were used to evaluate the cellulase production. The bacteria and actinomycetes
cultures were inoculated on to sterile paper discs placed on cellulose congo red agar and
incubated at 28 ± 2 °C. For fungus fungal discs were bored and kept on chitin agar plates.
Bacterial cultures were incubated for 48 h, actinomycetes and fungus were incubated for
four days. At the end of the incubation, the plates were observed for halo zone around the
colonies, which indicates the presence of cellulase. Observations were recorded on a 0−4
rating scale as follows: 0 = no zone; 1 = zone less than 1 mm; 2 = halo zone of 1−3 mm;
3 = halo zone of 4−6 mm and 4 = halo zone of 7 mm and above.
Production of HCN

- 31 -
Volatile compound HCN production was estimated qualitatively by the sulfocyanate
colorimetric method (Lorck, 1948). The actinomycetes and fungi were grown in
Bennett’s agar, similarly bacteria were grown on LB agar amended with glycine (4.4 g l-
1). One sheet of sterile Whatman filter paper no. 1 (8 cm diameter) was soaked in 1 %
picric acid and 10 % sodium carbonate was added onto the filter paper and carefully
placed on to the Petri dish lids and the plates were sealed with Parafilm and incubated at
28 ± 2 °C for four days. Development of reddish brown color on the filter paper indicated
positive for HCN production. Observations were recorded on a 0−3 rating scale based on
the intensity of the reddish brown color as follows: 0 = no reddish brown color; 1 = light
reddish brown; 2 = medium reddish brown and 3 = dark reddish brown.
Evaluation of bacteria, actinomycetes and fungi for their physiological traits
The selected isolates were evaluated for their physiological traits including tolerance to
salinity, pH, temperature and fungicides.
pH tolerance
For pH tolerance, Bennett’s agar and LB agar plates were prepared with different pHs 5,
7, 9, 11 and 13. The bacteria and actinomycetes cultures were streaked and fungal discs
were placed and incubated at 28 ± 2 °C. The bacterial cultures were incubated for 48 h
and actinomycetes and fungal cultures were incubated for four days. At the end of
incubation the growth was measured on a rating scale of 0 to 4 as follows; 0 is no growth,
1 is slight growth, 2 is moderate growth, 3 is good growth and 4 is excellent growth.

- 32 -
Salinity tolerance
For pH tolerance, Bennett’s agar and LB agar plates were prepared with different
concentrations of NaCl ranging from 0 to 14 % at an interval of 2 %. The bacteria and
actinomycetes cultures were streaked and fungal discs were placed and incubated at 28 ±
2 °C. The bacterial cultures were incubated for 48 h and actinomycetes and fungal
cultures were incubated for four days. At the end of incubation the growth was measured
on a rating scale of 0 to 4 as follows; 0 is no growth, 1 is slight growth, 2 is moderate
growth, 3 is good growth and 4 is excellent growth.
Temperature tolerance
For temperature, the actinomycetes were streaked on Bennett’s agar, bacteria were
streaked on LB agar, actinomycetes and fungus was inoculated on Bennett’s agar and
incubated at 20, 30 and 40 °C. The bacterial cultures were incubated for 48 h and
actinomycetes and fungal cultures were incubated for four days. At the end of incubation
the growth was measured on a rating scale of 0 to 4 as follows; 0 is no growth, 1 is slight
growth, 2 is moderate growth, 3 is good growth and 4 is excellent growth.
While for 50 °C, the cultures were inoculated into broth and incubated, after incubation,
the intensity of growth was measured at 600 nm in a spectrophotometer.
Fungicide tolerance
The selected cultures were also evaluated for their tolerance to fungicides at field
application levels and half of its concentrations. The fungicides such as Thiram (dimethyl
carbamothioyl sulfanyl N, N-dimethyl carbamodithioate), Bavistin (carbendazim 50%;

- 33 -
methyl benzimidazol-2-ylcarbamate), Ridomil (N-(2,6-dimethylphenyl)-N-
(methoxyacetyl) alanine methyl ester), Captan (captan 50%; N-trichloromethylthio-4-
cyclohexene-1, 2-dicarboximide), and Benlate (methyl [1-[(butylamino)carbonyl]-1H-
benzimidazol-2-yl] carbamate) were tested at FALs of 2500, 3000, 3000, 3000 and 4000
ppm concentrations respectively. Similarly half of their concentrations 1250, 1500, 1500,
1500 and 2000 ppm concentrations respectively. The required quantities of fungicides
were dissolved in sterilized Milli-Q water and mixed into Bennett’s agar just before
pouring into the Petri plates. The plates were incubated at 28 °C for five days and the
intensity of growth was measured. At the end of incubation the growth was measured on
a rating scale of 0 to 4 as follows; 0 is no growth, 1 is slight growth, 2 is moderate
growth, 3 is good growth and 4 is excellent growth.
Molecular identification of the selected isolates
The selected bacteria, actinomycetes and fungi were sent to Macrogen Inc. Seoul, Korea
and the contig sequences of 16S rDNA of bacteria, actinomycetes and 18S rDNA of
fungal isolate were obtained and compared with similar sequences were obtained from
GenBank, compared using the BLAST program (Altschul et al., 1990). Aligned using the
Clustal W software (Thompson et al., 1997) and the dendrogram inferred by neighbor-
joining method (Saitou and Nei, 1987). Bootstrap analysis was performed using the
MEGA version 4 program to estimate the statistical stability of the branches in cluster
with 1000 replications.

- 34 -
Submission of sequences to NCBI
The sequences of actinomycetes 1460 bp for SAI-13, 1474 bp for SAI-29,1475 bp for
VAI-7 and 1472 bp for VAI-40, for bacteria 1490 bp for SBI-23, 1492 bp for VBI-4,
1526 bp for VBI-19, 1494 for VBI-23 and 836 bp for VFI-51 submitted to NCBI and
accession numbers were obtained.
Evaluation of bacteria, actinomycetes and fungi for their PGP potential on chickpea
and sorghum under greenhouse conditions
The selected isolates were tested for their PGP of chickpea and sorghum under
greenhouse conditions.
PGP potential of bacteria, actinomycetes and fungi on chickpea
For greenhouse studies, pot mixture (black soil, sand and farm yard manure; 3:2:2) were
filled in 8″ pots. Chickpea seeds (variety ICCV 2) were sterilized (with 2.5 % sodium
hypochlorite and rinsed with sterile water) and soaked in bacteria grown in LB broth for
48 h, actinomycetes and fungal cultures grown in SCB for five days for 50 min (108 CFU
ml−1
). A total of ten treatments
(Four bacterial cultures VBI-4, VBI-19, VBI-23, SBI-23, four actinomycetes cultures
VAI-7, VAI-40, SAI-13, SAI-29, a fungal culture VFI-51 and control) were maintained
and the experiment was carried out with six replications for each treatment. Six seeds
were sown in the pots, after germination three plants were maintained. The microbial
cultures (108 CFU ml
−1) were applied once in two weeks until flowering stage as booster
dose. Irrigation and pest management were done as and when required. Growth
parameters such as nodule number, nodule dry weight, plant height, leaf area, leaf weight,

- 35 -
shoot weight, root length and root volume were recorded at 30 days after sowing (DAS)
and stem weight, pod weight and pod number were recorded at harvesting stage.
PGP potential of bacteria, actinomycetes and fungi on sorghum
Similar to chickpea greenhouse experiment, pot mixture (black soil, sand and farm yard
manure; 3:2:2) was filled in 8″ pots. Sorghum seeds (variety ICSV 112) were sterilized
(with 2.5 % sodium hypochlorite and rinsed with sterile water) and soaked in bacteria
grown in LB broth for 48 h, actinomycetes and fungal cultures grown in SCB for five
days for 50 min (108 CFU ml
−1). A total of ten treatments (four bacterial cultures VBI-4,
VBI-19, VBI-23, SBI-23, four actinomycetes cultures VAI-7, VAI-40, SAI-13, SAI-29,
fungal culture VFI-51 and control) were maintained and the experiment was carried out
with six replications for each treatment. Six seeds were sown in the pots, after
germination three plants were maintained. The microbial cultures (108 CFU ml
−1) were
applied once in two weeks until flowering stage as booster dose. Irrigation and pest
management were done as and when required. Growth parameters such as plant height,
leaf area, leaf weight, shoot weight, root length and root volume were recorded at 30 days
after sowing (DAS) and stem weight, plant length, panicle length and panicle weight
were recorded at harvesting stage.
Evaluation of bacteria, actinomycetes and fungi for their PGP potential on chickpea
and sorghum under on-station field conditions
All the selected isolates were studied for their PGP abilities under on-station field
conditions on both chickpea and sorghum under different seasons.

- 36 -
PGP potential of bacteria, actinomycetes and fungi on chickpea
The selected cultures were evaluated for PGP potential on chickpea under on-station field
conditions in 2013−14 post-rainy season at ICRISAT, Patancheru (17°30ꞌN; 78°16ꞌE;
altitude = 549 m), Hyderabad, Telangana, India. Chickpea variety ICCV-2 was used for
field trials. Soils at the experimental site (Vertisol) contain 25 % sand, 21 % silt and 52 %
clay with alkaline pH of 7.5−8.5. The organic C content of this field was 0.56 %.The
rhizosphere soil (top 15 cm) contains 642 ppm of total N and 9.03 ppm of available P.
The experiment was laid out in a randomized complete block design with three replicates
with a plot size of 4 m × 3 ridges. The actinomycete cultures were grown in SCB at 28 oC
for five days. Chickpea seed was treated with the microbial cultures (108
CFU ml-1
) for
50 min and sown on 2nd
November 2013 at a row-to row spacing of 60 cm and a plant-to-
plant spacing of 10 cm. The microbial cultures (1000 ml; 108
CFU ml-1
) were also applied
once in 15 days to the soil close to the plant until flowering stage. The control plots
contained no microbial strains. No serious phytopathogens or insect pest attacks were
observed during the cropping period. Irrigation was done on 23 days after sowing (DAS)
and 51 DAS whereas weeding on 22 DAS and 49 DAS. At 60 DAS, the nodule number,
stem weight, pod number, pod weight, leaf weight and leaf area were noted and compared
with un-inoculated control. The crop was harvested manually on 4th
Feb 2014 and at
harvest, stover yield, grain yield and total dry matter were noted.
Analysis for the rhizosphere soil mineral properties
Rhizosphere soil samples were collected from a depth of 0 to 15 cm at both flowering (60
DAS) and crop maturity stages and analyzed for total N (ppm), available phosphorus

- 37 -
(ppm) and organic carbon % according to the protocols of Novozamsky and others
(1983), Olsen and Sommers (1983) and Nelson and Sommers (1982), respectively and
soil biological properties including microbial biomass carbon, microbial biomass nitrogen
and dehydrogenase activities as per the protocols of Anderson and Domsch (1989),
Brooks and others (1985) and Casida (1977), respectively.
PGP potential of bacteria, actinomycetes and fungi on sorghum
The selected cultures were evaluated for PGP potential on sorghum under on-station field
conditions in 2013 rainy season at ICRISAT, Patancheru (17°30ꞌN; 78°16ꞌE; altitude =
549 m), Hyderabad, Telangana, India. Sorghum variety PVK 801 was used for field trials.
Soils at the experimental site (Vertisol) contain 25 % sand, 21 % silt and 52 % clay with
alkaline pH of 7.5−8.5. The organic C content of this field was xx %.The rhizosphere soil
(top 15 cm) contains xxx ppm of total N and xx ppm of available P. The experiment was
laid out in a randomized complete block design with three replicates with a plot size of 4
m × 3 ridges. The actinomycete cultures were grown in SCB at 28 oC for five days.
Sorghum seeds were treated with the microbial cultures (108
CFU ml-1
) for 50 min and
sowing was done with the help of tractor on 27th
June, 2013, on 28th
June peat formulated
culture was application was done to the soil. On 5th
July, neem oil and biowash prepared
from five herbal vermicompost mixtures was applied and on 8th
July, cypermethrin spray
was done to control shoot fly. The microbial cultures (1000 ml; 108
CFU ml-1
) were also
applied once in 15 days to the soil close to the plant until flowering stage and after
reaching flowering stage cultures were sprinkled on the plant with the help of sprayers.
The control plots contained no actinomycetes strains.

- 38 -
Analysis for the rhizosphere soil mineral properties
Rhizosphere soil samples were collected from a depth of 0 to 15 cm at both flowering (60
DAS) and crop maturity stages and analyzed for total N (ppm), available phosphorus
(ppm) and organic carbon % according to the protocols of Novozamsky and others
(1983), Olsen and Sommers (1983) and Nelson and Sommers (1982), respectively and
soil biological properties including microbial biomass carbon, microbial biomass nitrogen
and dehydrogenase activities as per the protocols of Anderson and Domsch (1989),
Brooks and others (1985) and Casida (1977), respectively.
Evaluation of selected isolates for their antagonistic potential against M. phaseolina
under light chamber and greenhouse conditions
All the selected isolates were tested for their efficacy to control M. phaseolina, the
causative agent of charcoal rot in sorghum.
Under light chamber conditions by blotter paper assay (BPA)
Evaluation of the selected actinomycetes, bacteria and fungus for their antifungal activity
against M. phaseolina was done by modified BPA method (Nene et al., 1981;
Gopalakrishnan et al., 2011). The sorghum seeds susceptible to charcoal rot (variety
R16) were surface sterilized as mentioned in the above section (xx) and sown in pots (12
cm) filled with sterilized vermiculite. The seedlings were collected after two weeks and
the roots washed with sterilized water. The pathogen inoculum was prepared by growing
M. phaseolina in PDB at 28±2°C for five days and tissumized using tissumizer (Techmar
type T 25, Japan). The roots of the sorghum seedlings were soaked in M. phaseolina

- 39 -
inoculum for 30 min and arranged on blotter paper (45 × 25 cm with one fold) placed in a
plastic tray, making sure only roots were present in the tray. The selected test isolates
were grown separately in broth, (four actinomycetes, four bacteria and one fungus in
Bennet’s broth, LB broth and PD broth respectively) were counter applied to the sorghum
roots (10-8
CFU/ml, 1ml/plant), ten plants were maintained per replication and three
replications were maintained for each treatment. Positive and negative controls were
made by inoculating the plants only with M. phaseolina and sterile water, respectively.
The blotter paper was kept moist all the time with sterilized water and incubated at 28 ±
2°C for 8 days with a 12-h day length provided by fluorescent lights (120 μ mol m-2 s-1).
At the end of the incubation, the rotting of roots that indicates disease symptoms of the
charcoal-rot were recorded on a 0 to 5 rating scale (0 represents no visible rotting of
roots, while 5 represents highest rotting of roots), and the percentage of infected roots in
treatments was calculated by comparing with the control.
Under greenhouse conditions
The antifungal activity of selected isolates against charcoal rot of sorghum was done
using by tooth pick method. For this, pots (8") were filled with pot mixture containing
black soil, sand and farm yard manure (3:2:1). Sorghum seeds (variety B 296) susceptible
to charcoal rot were surface sterilized as mentioned earlier and soaked in selected test
isolates grown separately in broth, (four actinomycetes, four bacteria and one fungus in
Bennet’s broth, LB broth and PD broth respectively). Three treated seeds were sown per
pot but after germination only one plant per pot was maintained. A total of 11 treatments
were maintained, which include four actinomycetes, four bacteria, one fungus, a positive

- 40 -
control infected with M. phaseolina and negative control without any inoculation with 10
replications were maintained. Booster dozes of test isolates were added on 0, 15, 30, 45
and 60 DAS by soil application. For preparing the pathogen to infect the plant, the M.
phaseolina was grown on PDA for five days at 28± 2 °C. The fungal spores were scraped
and transferred in to a sterilized honey peptone broth. Tooth picks were sterilized by
keeping in a glass bottle, the above prepared fungal inoculum was poured in to this bottle
up to one fourth of the bottle and incubated until the tooth picks were completely covered
by the fungal growth. When the plants reach to flowering stage the plant was infected
with the inoculated toothpick at second node from the ground level. After infecting the
plants were grown in stress and drought conditions, irrigation was given to maintain plant
viability.
Determination of colonization of chickpea and sorghum by selected cultures by
scanning electron microscope (SEM) studies
Chickpea and sorghum roots were examined for colonization by actinomycetes, bacterial
and fungal cultures by SEM studies as per the protocols of Bozzola and Russell (1999).
Seeds of chickpea (variety ICCV 2) and sorghum (variety ICSV112) were surface
sterilized and allowed to sprout overnight. The sprouted seeds were soaked in bacteria,
actinomycetes and fungal cultures individually for 50 min and transferred carefully into
sand tubes containing sterilized coarse sand (50 g). Booster dose (1ml; 108
CFU ml-1
) was
applied after seven days. The tubes were incubated at 24 ± 2 °C in light chamber with an
average illumination of 9600 lux and photosynthetic photon flux of 350 µE m-2
s -1
. After
two weeks of incubation, chickpea and sorghum seedlings were taken out and the roots

- 41 -
were washed in 0.1 M phosphate buffer. Root tips of 4─5 mm length were cut and fixed
in glutaraldehyde (2.5 %) in phosphate buffer for 24 h at 4 oC. At the end of 24 h
incubation, the root samples were again washed with phosphate buffer, post fixed in
osmium tetraoxide (2 %) for 4 h and dehydrated using a graded series of ethanol. The
dehydrated samples were dried, with a critical-point liquid carbon dioxide as a transition
fluid, and adhered onto aluminum specimen mounts with double stick adhesive tape. The
mounted samples were coated with gold-palladium in an automated sputter coater (JEOL
JFC-1600) and examined under SEM (JOEL-JSM 5600) as per the standardized protocols
at RUSKA lab, College of Veterinary Science, Rajendranagar, Hyderabad, Telangana,
India.
Gene expression studies
The four actinomycetes (SAI-13, SAI-29, VAI-7 and VAI-40) were grown in Bennett’s
broth for 72 h, the four selected bacterial strains (VBI-4, VBI-19, VBI-23 and SBI-23)
were grown in LB broth for 24 h and RNA was extracted from bacteria by using
conventional TRIzol method (Chomczynski P and Mackey K. 1995). The quality and
quantity of RNA was estimated by Nanodrop (Thermo Scientific, USA) and RNA
integrity by 2100 Bioanalyzer (Agilent, USA). By using RNA cDNA was constructed by
reverse transcription using Invitrogen kit. The bacterial gene sequences for IAA,
siderophore and β-1, 3-glucanase were retrieved from EMBL-EBI, specific primers were
synthesized by using Primer3 software (Rosen and Skaletsky 2000). Quantitative real-
time polymerase chain reaction (qRT-PCR) was performed as per the manufacturer’s
instructions using Applied Biosystems 7500 Real Time PCR System with the SYBR
green chemistry (Applied Biosystems, USA). For actinomycetes, gene specific primers

- 42 -
for IAA, siderophore and β-1,3-glucanase were designed using Primer3 software (Rosen
and Skaletsky 2000). Well characterized genes (Spaepen et al. 2007) relating to IAA
production from IAM/IPyA/TAM were collected from UniprotKB database
(http://www.uniprot.org/uniprot). The siderophore related genes were manually collected
from the MetaCyc pathway database (http://metacyc.org) considering siderophore
biosynthesis pathways excluding the plant related siderophore biosynthesis pathways.
RNA polymerase principal sigma factor Hrd B (SCO5820) was used as the endogenous
control. Specific primer sequences of Hrd B (F: GGTCGAGGTCATCAACAAGC; R:
CTCGATGAGGTCACCGAACT), siderophore (F: ATCCTCAACACCCTGGTCTG; R:
TCCTTGTACTGGTACGGGACTT) and IAA (F: 8 GTCACCGGGATCTTCTTCAAC;
R: GATGTCGGTGTTCTTGTCCAG) has been used for the analysis. Similarly for
bacteria principal sigma factor Rpo B was used, for siderophore primer sequences (F:
TGGCGGAAAAGCTAATATAGTAAAGTA; R:
CCACATATCGAATCTCCTGTCTAAAA), for IAA (F:
ACGTATGGTGTTTCAAGATTCATG; R: ATTTTCGTCTCATTCTACCTCACC) and
for β 1,3 glucanase (F: GAGAAAGATGAGTAAAAAACAACAA; R:
CATTTGTGCTTTGAATGCTAG) were used. PCR reactions were carried out in 10 μl
reaction containing 30 ng of first strand cDNA, 1X PCR buffer, 125 mM dNTPs, 1.5 mM
MgCl2, 0.2 mM primers and 1U Taq polymerase. PCR program is as follows: 50 °C for 2
min and denaturation at 95 ºC for 10 min followed by 40 cycles of denaturation at 95 ºC
for 15 sec and annealing and extension at 60 ºC for 1 min. The data from different PCR
runs or cDNA samples was compared by using the mean of the CT values of the three
biological replicates that were normalized to the mean CT values of the endogenous gene.

- 43 -
The expression ratios were calculated using the 2_ΔΔCt method. Relative transcription
levels are presented graphically.
Isolation, purification and identification of active metabolite from fungal culture
filtrates
Purification of the active metabolite
Culture filtrates (10 L) of the most promising fungus against B. cinerea were partitioned
against EtOAc as described previously and the resultant organic (EtOAc) fractions were
evaporated and collected in MeOH (10 ml). To the collected MeOH fraction 3 g of silica
gel was added and evaporated with the help of rotary evaporator, so that all the
metabolites present in the organic fraction were coated on to the silica gel. This coated
silica gel was added onto a flash chromatography column packed with 30g of silica gel.
The column was eluted with 500 ml of n-hexane followed by 500 ml each of 10 %, 20 %,
30 %.... 100 % EtOAc in n-hexane. Each eluted fractions were evaporated on a rotary
evaporator and collected separately in a minimal volume of acetone (10 ml) and further
assayed for their antagonistic potential against B. cinerea as described in section 3.3.2.
The left over active fraction in the bioassay was evaporated and sent to NMR and MS
analysis for structural elucidation.
NMR and MS analysis
NMR data were recorded using a Bruker Avance 600 spectrometer operating at a proton
frequency of 600.18 MHz with a 5 mm triple-resonance cryo probe equipped with a z-
gradient. The samples containing a solution of 10 mg of substance in CDCl3 were
measured at 298 K, using solvent signal as a reference. Following 1D and 2D pulse

- 44 -
sequences from the Bruker user library were used for the NMR experiments: 1H 1D (600
MHz), 13
C 1D (150 MHz), HSQC (600/150 MHz), HSQC–TOCSY (600/150 MHz),
HMBC (600/150 MHz), DQF–COSY (600 MHz) and NOESY 2D (600 MHz).
LC-MS analysis was performed on a Waters Acquity UPLC system connected to a
Waters Synapt G2-S High definition QTOF mass spectrometer. The QTOF was operated
in positive ESI mode using leucine enkephaline as lock mass compound. Both crude and
purified extracts were separated on an Acquity UPLC BEH C18 1.7 mm 2.1x50 mm
column using water with 0.01% formic acid as mobile phase A and acetonitrile with
0.01% formic acid as mobile phase B. The following gradient was used: 0─0.3 min:
100% A, 0.3─6 min: linear gradient from 100% to 5 5A, 6─6.1: back to 100% A, end
after 8 min. One µl of the sample was injected and a mobile phase flow rate of 0.4
ml/min was used.
Effect of the purified compound for its antagonistic potential against B. cinerea
Seedlings of the BGM susceptible chickpea genotype ICC 4954 were grown in plastic
pots filled with sterilized vermiculite and sand mixture (10:1) in a greenhouse,
maintained at 25±2ºC for 10 days. The greenhouse trial was carried out in a completely
randomized design with three replications and repeated once. A total of eight treatments
were made which include: 1. Control; 2. Only B. cinerea spray at 0h; 3. Only purified
compound spray at 0h; 4. B. cinerea and purified compound spray at 0h; 5. Purified
compound and B. cinerea spray at 0h; 6. B. cinerea spray at 0h while purified compound
spray at 24h; 7. B. cinerea spray at 0h while purified compound spray at 48h; and 8. B.
cinerea spray at 0h while purified compound spray at 72h. Autoclaved flowers of Tagetes

- 45 -
erecta (marigold) was used for mass multiplication of B. cinerea at 15 ±1ºC for 8 days
with 12 h photoperiod. At the end of incubation, conidia of B. cinerea were collected into
sterile distilled water and this conidial suspension (3 x 10⁵
per ml) was used as inoculum.
Ten day-old seedlings of chickpea were transferred into a plant growth-chamber
maintained at 15 ±1ºC with a 12 h photoperiod of 2500─3000 lux intensity and 95─100%
relative humidity for 24 h for acclimatization. At the end of 24h incubation in the growth
chamber, the seedlings were inoculated by spraying the inoculum of B. cinerea / purified
compound, depending upon the treatment, on the foliage until run-off using a hand-
operated atomizer. The plants were kept in the growth chamber for 20 more days. At the
end of incubation, the severity of the disease was recorded using a 1─6 rating scale
where, 1 is no infection on any part of the plant and 6 is extensive soft rotting, fungal
growth on more than 70 % of the leaves, branches and stems (Pande et al., 2012).
Isolation, purification and identification of active metabolite from actinomycetes
Among the selected four actinomycetes cultures, the promising isolate inhibiting the
pathogen S. rolfsii, was further studied for the isolation and purification of active
compound present in the culture filtrates.
Evaluation of efficacy of promising isolate in controlling S. rolfsii under greenhouse
conditions
The experiment was carried out in 6 inches pots, the pot mixture contains black soil, sand
and farm yard manure (3:2:2).The pathogen culture was prepared by growing S. rolfsii on
sterilized sorghum seeds for 15 days and antagonist culture was prepared by growing

- 46 -
SAI-13 on Bennett’s agar plates for 7 days. Four treatments were maintained; 1) negative
control in which pot mixture does not contain pathogen or antagonist (SAI-13), 2)
positive control in which 1 % sick soil was prepared by mixing 10 g of infested sorghum
seeds with 1 kg of pot mixture, 3) Treatment 1; in which the pot mixture was mixed with
the spores of SAI-13 (approximately 1 g) and incubated for one week by covering the
pots with plastic covers. At the end of one week, the pathogen was mixed to get 1% sick
soil. 4) Treatment 2; in which the pot mixture was inoculated with the antagonist and
pathogen simultaneously. Each treatment was maintained with three replications, and
each replication contained 15 plants. Chickpea seed variety “Annegiri” was used for the
experiment. Surface sterilized seeds were sown at a rate of 15 seeds per pot. After 15
days, the disease incidence in both positive control and treatments were noted.
Colonization studies
From the above experiment (3.11.1) plants of all four treatments small sections of stem
collar region, above and below collar regions were cut and stored in gluteraldehyde and
processed for SEM studies as described earlier in section 3.8 to check the colonization of
actinomycetes isolate in collar region in plants survived from disease.
Isolation and purification of compound from actinomycetes culture filtrates
Culture filtrates (10 L) of the most promising actinomycetes against S. rolfsii were
partitioned against EtOAc as described previously and the resultant organic (EtOAc)
fractions were evaporated and collected in MeOH (10 ml). To the collected MeOH
fraction 3 g of silica gel was added and evaporated with the help of rotary evaporator, so

- 47 -
that all the metabolites present in the organic fraction were coated on to the silica gel.
This coated silica gel was added onto a flash chromatography column packed with 30g of
silica gel. The column was eluted with 500 ml of n-hexane followed by 500 ml each of
10 %, 20 %, 30 %.... 100 % EtOAc in n-hexane. Each eluted fractions were evaporated
on a rotary evaporator and collected separately in a minimal volume of acetone (10 ml)
and further tested for their antagonistic potential against S. rolfsii. The left over active
fraction in the bioassay was evaporated and sent to NMR, MS and IR analysis for
structural elucidation.
NMR, MS and IR analysis
Statistical analysis
Data were analysed by using analysis of variance (ANOVA) technique, by SAS GLM
(General Linear Model) procedure (SAS Institute 2002-08, SAS version 9.3) considering
isolates and replication as fixed in randomized complete block design. Isolate means
were tested for significance and compared using Fisher’s protected least significant
difference.
3 Results
3.1 Isolation of actinomycetes, bacteria and fungi
Actinomycetes, bacteria and fungi were isolated from chickpea rhizosphere soils and
herbal vermicomposts including A. squamosa, A. indica. G. sepium, P. hysterophorus and
J. curcas. A total of 1.02X10⁻⁸
CFU/ml of actinomycetes with a diversity of 7, 1.18X10⁻⁸
CFU/ml of bacteria with a diversity of 6 and 1.06X10⁻⁷
CFU/ml of fungi with diversity of
5 were observed from the rhizosphere soil whereas 2.3─9.8X10⁻⁷
CFU/ml of

- 48 -
actinomycetes with a diversity of 3─5, 0.5─1.68X10⁻⁷
CFU/ml of bacteria with a
diversity of 5─8 and 4.5─7.2X10⁻⁶
CFU/ml of fungi with diversity 3─6 were isolated
from the five different vermicomposts (Table 1). A total of 89 actinomycetes, 74 bacteria
and 48 fungal isolates were isolated based on their capability to inhibit adjacent colonies
and to produce pigments of which a total of 35 actinomycetes, 34 bacteria and 23 fungi
were isolated from rhizosphere soil, while xxx from the five vermicomposts (Table 2).
The isolates were maintained on AIA, LBA and PDA agar slants for actinomycetes,
bacteria and fungi, respectively, and used for further studies.
3.2 Screening of isolates for their antagonistic potential against the fungal pathogens
of chickpea and sorghum
The isolates (89 actinomycetes, 74 bacteria and 48 fungi) were screened for their
antagonistic potential against important fungal pathogens of chickpea (FOC, R. bataticola
three strains viz, Rb-6, Rb-24 and Rb-115, S. rolfsii and B. cinerea) and sorghum (M.
phaseolina, F. proliferatum and F. andyazii) by dual culture assay (DCA) and metabolite
production assay.
DCA
Of the 89 actinomycete isolates screened for their antagonistic potential, 18 were found to
inhibit at least 5 fungal pathogens (with more than 60%). Similarly, of 74 and 48
bacterial and fungal isolates 20 bacteria and 15 fungal isolates were found inhibit at least
6 fungal pathogens. The selected isolates of actinomycetes, bacteria and fungi are listed
in Table 3 (Fig. x and Annexures x).

- 49 -
Metabolite production assay
All the selected 18 actinomycetes, 20 bacteria and 15 fungal isolates were tested for their
metabolite production capability. When the culture filtrates of these isolates were
partitioned against EtOAc, by solvent extraction method, the aqueous fractions of all
isolates did not exhibit any antagonistic activity. The organic fractions of the isolates
possess antagonistic activity. Based on their ability to inhibit fungal pathogens, among 18
actinomycetes four actinomycetes viz. SAI -13 and SAI-29 (isolated from chickpea
rhizosphere), VAI-7 (from A. squamosa vermicompost) and VAI-40 (from J. curcas
vermicompost) were selected. And among the 20 bacterial isolates four isolates viz. VBI-
4 (from A. squamosa vermicompost), VBI-19 (from G. sepium vermicompost), VBI-23
(from J. curcas vermicompost) and SBI-23 (from chickpea rhizosphere soil) were
selected. And from 15 fungal isolates only one isolate, VFI-51 was selected for further
studies (Fig x).
Among the four isolates, the organic fractions of SAI-13 and SAI-29 were found to
be potential against all the fungal pathogens. Of the four selected isolates, VBI-23 was
found to be more effective in both the assays when compared to the other isolates.
3.4 Evaluation of the selected isolates for their PGP and biocontrol traits
All the selected bacteria, actinomycetes and fungi were tested for their
biochemical and PGP traits under in vitro conditions. These are as follows:
Production of IAA

- 50 -
When the selected four actinomycetes, four bacteria and one fungal isolate VFI-51 were
tested for IAA production, all actinomycetes, bacterial and fungal isolates produced IAA.
Among the actinomycetes, SAI-13 and SAI-29 (rating 3) were found to produce highest
while in the case of bacteria, it was VBI-4 (rating 2) (Table 4; Fig. x; Annexure xx)
Production of siderophores
When the selected four actinomycetes, four bacteria and one fungal isolate VFI tested for
siderophore production, all actinomycetes, bacterial and fungal isolates produced
siderophores. Among actinomycetes, VAI-7 and SAI-29 (rating 2) were found to produce
highest while in the case of bacteria, it was VBI-19 (rating 2) (Table 4; Fig. x; Annexure
xx).
Production of protease
When the selected four actinomycetes, four bacteria and one fungal isolate VFI tested for
protease production, actinomycetes, all bacterial and fungal isolates produced
siderophores. Among actinomycetes, VAI-40, SAI-13 and SAI-29 (rating 6) were found
to produce highest while in the case of bacteria, it was VBI-23 and SBI-23 (rating 4)
(Table 4; Fig. x; Annexure xx).
Production of lipase
When the selected four actinomycetes, four bacteria and one fungal isolate VFI tested for
lipase production, all actinomycetes, bacterial and fungal isolates produced lipase.

- 51 -
Among actinomycetes, SAI-13 (rating 2) found to produce highest while in the case of
bacteria, VBI-4, VBI-23 and SBI-23 (rating 2) (Table 4; Fig. x; Annexure xx).
Production of chitinase
When the selected four actinomycetes, four bacteria and one fungal isolate VFI tested for
chitinase production, all actinomycetes (rating 2) except VAI-40 were found to produce
chitinase whereas all bacteria and fungal isolate VFI-51 didn’t produced chitinase (Table
4; Fig. x; Annexure xx).
Production of β-1,3-glucanase
When the selected four actinomycetes, four bacteria and one fungal isolate VFI tested for
β-1,3-glucanase production, all actinomycetes, bacterial and fungal isolates produced
siderophores. Among actinomycetes, SAI-29 (rating 4) found to produce highest while in
the case of bacteria all produced equally with a rating 2. (Table 4; Fig. x; Annexure xx).
Production of cellulase
When the selected four actinomycetes, four bacteria and one fungal isolate VFI tested for
cellulase production, all actinomycetes, bacterial and fungal isolates produced cellulase
with a rating of 4 except bacterial isolate VBI-19 (rating 3) (Table 4; Fig. x; Annexure
xx).
Production of HCN

- 52 -
All the selected four actinomycetes, four bacteria and one fungal isolate VFI tested for
HCN production. Among actinomycetes SAI-13 (rating 1) and SAI-29 (rating 2)
produced HCN, among bacteria only VBI-4 (rating 1) produced HCN and fungal isolate
VFI-51 (rating 1) produced HCN (Table 4; Fig. x; Annexure xx).
3.5 Evaluation of the selected isolates for their physiological traits
All the selected isolates were evaluated for their physiological traits and fungicide
tolerance under in vitro conditions. These are as follows:
Salinity tolerance
All the selected four actinomycetes, four bacteria and one fungal isolate VFI
tested for salinity tolerance. All actinomycetes tolerated up to 8 % whereas SAI-13
tolerated up to 10 %, all bacteria tolerated up to 8 % whereas VBI-23 tolerated up to
10 % and the fungal isolate VFI-51 was found to grow well up to 15% NaCl
concentration (Table 5).
pH tolerance
All the selected four actinomycetes, four bacteria and one fungal isolate VFI
tested for pH tolerance. All the four actinomycetes grew between pH 7 and 11, but
maximum sporulation was observed at pH 9, the four bacterial isolates were found to
grow well at a pH range between pH 7─11 (except SBI-23 which tolerated up to pH 9)
and the fungal isolate VFI-51 was also found to grow well at a pH range between 7─11.
There is no growth at pH 5 (Table 5).

- 53 -
Temperature tolerance
When the selected four actinomycetes, four bacteria and one fungal isolate VFI
tested for temperature tolerance, all the actinomycetes, bacteria and fungal isolate grew at
a temperature range 20 and 40oC. At 20
oC moderate growth (rating 2) and at 30
oC, 40
oC
good growth (rating 3) was observed. There is no growth at 50 °C (Table 5).
Fungicide tolerance
All the selected four actinomycetes, four bacteria and one fungal isolate VFI
tested for fungicide tolerance. All actinomycetes, bacterial and fungal isolates were
resistant to Bavistin at both FAL and 1250 ppm with a rating of 3. All actinomycetes
were sensitive to Ridomil at 3000 ppm, whereas SAI-13 and SAI-29 were resistant with a
rating scale 1 (at 1500 ppm), among four bacterial isolates VBI-4 and VBI-19 were
sensitive, VBI-23, SBI-23 resistant with a rating scale of 1 at FAL, all bacteria were
resistant with a rating scale 2 at 1500 ppm, and fungus VFI-51 is resistant with a rating
scale 1at FAL and 1500 ppm. Actinomycetes VAI-7 and VAI-40 were sensitive to
Captan, SAI-13, SAI-29 and fungus VFI-51 are resistant at FAL with rating scale 1. All
bacteria were resistant with a rating scale 2, whereas VBI-23 with rating 3 at FAL. All
actinomycetes are resistant to Captan at 1500ppm with rating 2, except VAI-40, and
fungus VFI-51 is also resistant to Captan at 1500ppm with rating 2, all bacteria resistant
to Captan at 1500ppm with rating 3. (Table 6).
3.3 Molecular identification of selected isolates

- 54 -
Actinomycetes were identified using 16s rDNA analysis and in phylogenetic analysis,
sequences of all strains matched 100% with Streptomyces but different spp. (Fig x).
Bacterial isolates matched 100% with Bacillus but different spp. (Fig x). The
identification of the isolate VFI-51 was done by 18S rDNA analysis and the sequences
matched with Penicillium citrinum (with 100% similarity) (Fig. x).
Acquisition of NCBI accession numbers
All the selected isolates’ contig sequences were submitted to NCBI and GenBank
accession numbers were obtained.
Actinomycetes
The sequences of actinomycetes SAI-13 (1460 bp), SAI-29 (1474 bp), VAI-7 (1475 bp)
and VAI-40 (1472 bp) were submitted to NCBI and the GenBank accession numbers
KM220609, KM220608, KM220610 and KM220611 respectively, were obtained.
Bacteria
The sequences of bacteria VBI-4 (1492 bp), VBI-19 (1526 bp), VBI-23 (1494 bp), SBI-
23 (1490 bp) were submitted to NCBI and the GenBank accession numbers KM250376,
KM250377, KM250378 and KM250375 respectively, were obtained.
Fungus
The sequence of VFI-51 (836 bp) submitted to NCBI and GenBank accession number
KM250379 was obtained.

- 55 -
3. PGP potential of selected isolates on chickpea under greenhouse conditions and
on station-field conditions
The selected nine isolates (four actinomycetes, four bacteria and one fungal isolate) were
tested for their PGP ability on chickpea under greenhouse and field conditions.
Under greenhouse conditions
When the selected isolates were tested for their PGP ability under greenhouse conditions,
the isolates exhibited an increase in all the tested plant growth parameters. At 30 DAS,
there was an increase in the plant height up to 13 % (top three isolates were VAI-7, SAI-
13 and SAI-29), nodule number up to 18 % (top three isolates were VFI-51, VAI-40 and
SAI-29), nodule dry weight up to 5 % (only VBI-23), root length up to 6 % (only VBI-
23), leaf area up to 15 % (top three isolates were SBI-23, VAI-7 and SAI-29), leaf weight
up to 21 % (top three are SBI-23, VAI-7 and VBI-23) and shoot weight up to 21 % (only
SBI-23 and VBI-23) (Table x ) and at harvest, there was an increase in the pod weight of
up to 5 % (by SAI-13 and SBI-23) (Table x). It can be concluded that of the nine isolates
studied, four showed broad spectrum of PGP traits. These were SBI-23 (five traits)
followed by VBI-23 (four traits), SAI-29 (three traits) and VAI-7 (three traits).
3. PGP potential of selected isolates on chickpea under on-station field conditions
Under field conditions, a considerable increase in agronomic and soil mineral
properties were observed in plots inoculated with the selected isolates over control plots.
At 30 DAS, there wass an increase in nodule number up to 24 % (top three isolates were

- 56 -
VAI-40, VAI-7 and SAI-29), nodule dry weight up to 24 % (top three isolates were VAI-
40, VFI-51 and VAI-7), plant height up to 10 % ( top three isolates were VBI-23, VAI-7
and SAI-29), number of branches up to 27% (top three isolates were VBI-23, VAI-7, and
VBI-4), root dry weight up to 26 % (top three isolates were SAI-29, VFI-51 and VAI-40),
shoot dry weight up to 25 % (top three isolates were VBI-19, VFI-51 and SAI-29). At 60
DAS there was an increase in leaf area up to 35 % (top three isolates were VBI-23, SBI-
23 and VFI-51), pod number up to 34 % (top three isolates were VAI-7, VBI-23 and VFI-
51), leaf weight up to 36 % (top three isolates were VBI-23, VAI-7 and VFI-51), plant
height up to 11 % (top three isolates were VBI-23, VAI-7 and SAI-29), stem weight up to
33 % (top three isolates were VBI-23, VAI-7 and VFI-51), number of pods up to 34 %
(top three isolates were VAI-7, VBI-23 and VFI-51) and pod weight up to 30 % (top
three isolates were VBI-23, VAI-7 and VBI-19). While at final harvest, these enhanced
the stover yield up to 29 % (top three isolates were SAI-29, VBI-4 and VAI-7), grain
yield up to 25 % (top three isolates were VAI-7, VBI-23 and SAI-29), total dry matter up
to 20 % (top three isolates were SAI-29, VBI-4 and VAI-7), seed weight up to 19 % (top
three isolates were VAI-40, SAI-29 and VBI-4), seed number up to 29 % (top three
isolates were by VAI-40, SAI-29 and VBI-4), pod weight up to 40 % (top three isolates
were SAI-29, VAI-40 and VBI-4) and there is an increase up to 4 % in 1000 seed weight
(top three isolates were by VAI-7, SAI-29 and VBI-23) (Table xx). It can be concluded
that of the nine isolates studied, six showed broad spectrum of PGP traits at different
stages of harvest in field conditions. These are VBI-23 and SAI-29 (seven traits),
followed by VBI-4, VFI-51, VAI-7 (five traits) and VAI-40 (three traits).

- 57 -
At flowering stage, the rhizosphere soil from plots inoculated with the selected
isolates enhanced total N up to 18 % (top three isolates were VBI-23, SAI-13 and VBI-
4), available P up to 42 % (top three isolates were VBI-23, VAI-7 and SBI-23), organic C
up to 9 % (top three isolates were VBI-23, SBI-23 and VBI-4), dehydrogenase activity up
to 50 % (top three isolates were SAI-13, VAI-40 and VBI-23) and microbial biomass C
up to 28 % (top three isolates were VAI-40, VAI-7 and SBI-23) over the un-inoculated
control. At harvest stage, there is an increase in total N up to 11 % (top three isolates are
SBI-23, VBI-4 and VFI-51), available P up to 54 % (top three isolates were VBI-23, SBI-
23 and VAI-7), organic C up to 13 % (top three isolates were VAI-40, SBI-23 and VAI-
7), dehydrogenase activity up to 37 % (top three isolates were SAI-13, VAI-7 and VBI-
4), microbial biomass carbon up to 54 % (top three isolates were VBI-19, SAI-29 and
VBI-23) when compared with the control. (Table xx). It can be concluded that of the nine
isolates studied, three showed broad spectrum activity. These are VBI-23 (four traits)
followed by SBI-23 and VAI-7 (three traits). Of these three isolates, two (VBI-23 and
VAI-7) were also found to have broad spectrum of PGP traits (having more than five
traits including yield parameters).
PGP potential of selected isolates on sorghum under greenhouse conditions and on
station-field conditions
PGP potential of selected isolates on sorghum under greenhouse conditions
All the selected isolates were tested for their PGP effect on sorghum under greenhouse
conditions.

- 58 -
At 60 DAS, the isolates showed significant increase in the plant growth parameters
including the stem weight up to 32% (top three isolates were SAI-29, VAI-40 and VAI-
7), leaf dry weight up to 27 % (top three isolates were SAI-29, VAI-40 and VAI-7), root
dry weight up to 82 % (top three isolates were VBI-19, SBI-23 and VBI-23), plant height
up to 7 % (top three isolates were SAI-29, VAI-40, VBI-19), number of leaves up to 9 %
(top three isolates were SAI-29, VAI-40 and VFI-51) and root length up to 12 % (SAI-13
and SBI-23). And at harvest, there was an increase in the stem weight up to 11 % (top
three isolates were VBI-23, SAI-29 and VBI-19), root dry weight up to 15 % (top three
isolates were VAI-7, VBI-19 and SAI-29), panicle weight up to 13 % (top three isolates
were by VBI-23, SAI-13 and VBI-4), panicle length up to 6 % (top three isolates were
SAI-29, SAI-13 and VAI-7) and plant height up to 13 % (top three isolates were by VBI-
19, VBI-23 and SBI-23) (Table x). It can be concluded that of the nine isolates studied,
four showed broad spectrum of PGP traits of sorghum. These are SAI-29, VAI-40 (four
traits) followed by VBI-19 (three traits) and VBI-23 (three traits).
PGP potential of selected isolates on sorghum on station filed conditions
All the selected isolates were tested for their PGP effect on sorghum (PVK 801) and
sweet sorghum (ICSV 93046) under field conditions. At 60 DAS, there was an increase
in number of leaves in sweet sorghum up to 7 % by VAI-7, leaf weight sweet sorghum up
to 39 % (top three isolates areVAI-7, SBI-23 and VBI-4), leaf area up to 29 % (top three
isolates are VAI-7, VBI-19 and SAI-13), stem weight in sweet sorghum up to 22 % (top
three isolates are VAI-7, VFI-51 and VBI-4), root weight in sweet sorghum up to 51 %
(top three isolates are VAI-7, SAI-13 and VFI-51) and total plant weight in sweet

- 59 -
sorghum up to 28 % (top three isolates are VAI-7, VFI-51 and SBI-23). Whereas in grain
sorghum at 60 DAS, leaf weight up to 14 % (VFI-51 and VAI-7) and, leaf area up to 3 %
by VBI-4, root weight up to 21 % (top three isolates are VBI-4, SAI-29 and SAI-13),
plant weight up to 3 % by VFI-51. And at harvest, there was an increase in stover yield in
sweet sorghum up to 6 % (top isolates are VFI-51 and VBI-23), grain yield in sweet
sorghum up to 57 % (top three isolates are VFI-51, SAI-13 and VBI-4), panicle length in
sweet sorghum up to 1 % by VBI-19, 1000 seed weight in sweet sorghum up to 7 % by
SAI-13. And in grain sorghum, there was an increase in stover yield in up to 22 % (top
isolates are SAI-29 and VAI-7), grain yield in PVK 801up to 21 % (top three isolate are
SAI-29, VFI-51 and VAI-7), panicle length in up to 7 % (top three isolates are VBI-4,
VFI-51 and VBI-19), 1000 seed weight up to 22 % (top three isolates are SAI-13, SBI-23
and VFI-51), and plant height in PVK 801 up to 2 % by (top three isolates are VFI-51,
VBI-4 and VAI-7) (Table x) . In sweet sorghum there is an increase in the volume of
juice up to 37 % (top three isolates are VBI-23, VBI-4 and VAI-40), juice weight up to
39 % (top three isolates are VBI-23, VBI-4 and VAI-40) and brick reading of juice up to
4 % (top three isolates are SBI-23, SAI-29 and VAI-40) at harvest. (Table x). It can be
concluded that of the nine isolates studied, five showed broad spectrum of PGP traits in
two cultivars. In sweet sorghum, the isolates are VAI-7 (seven traits) followed by VFI-
51, VAI-40 and SAI-13 (three traits). Whereas in the case of PVK 801, the isolates are
VFI-51 (four traits) followed by VBI-4 (two traits).
The rhizosphere soil from two sorghum cultivars plots enhanced the soil mineral
properties. In plots of sweet sorghum increase in total N up to 12 % (top three isolates are
VAI-7, SBI-23 and SAI-13), available P up to 73 % (top three isolates are VFI-51, VAI-7

- 60 -
and SAI-13) and organic C up to 12 % (top three isolates are VBI-4, VFI-51 and SAI-13)
at harvest when compared with the control plots. In plots of grain sorghum, there was an
increase in total N up to 4 % (top three isolates are VBI-19, VAI-7 and SAI-13), available
P up to 19 % (top isolates are VAI-7 and VFI-51) and organic C up to 8 % (top three
isolates are VBI-4, SAI-13 and VFI-51) (Table xx). It can be concluded that of the nine
isolates studied, three showed broad spectrum in enhancing soil mineral properties in
both cultivars. These are SAI-13 (two traits), VAI-7 (two traits) and VFI-51 (two traits).
Evaluation of the selected isolates for their antagonistic potential against M.
phaseolina under light chamber and greenhouse conditions
Under light chamber conditions
When the selected actinomycetes, bacteria and one fungal isolates were tested for their
efficacy to control M. phaseolina under light chamber conditions, all the tested isolates
were able to control the infection when compared with the control. In case of
actinomycetes, of the four isolates, SAI-13 showed 70% control of disease whereas for
bacterial isolates, SBI-23 showed maximum control (70%) over the positive control. The
only fungal isolate VFI-51 showed the highest disease control (85%) over the positive
control (Table x).
Under greenhouse conditions
When the selected actinomycetes, bacteria and one fungal isolates were tested for their
efficacy to control M. phaseolina under greenhouse conditions, the length (cm) of
infection was found low in all the test isolates treated plants (2.4─4.5 cm; 30─47 %

- 61 -
infection) when compared with the positive control (9.6 cm; 100% infection). Among
actinomycetes, SAI-13 and VAI-40 showed infection length up to 3.1 cm ( 32 %
infection), followed by VAI-7 with 3.2 cm (33 % infection) and SAI-29 with 3.5 (36 %
infection). Among bacteria, VBI-19 showed good inhibition of M. phaseolina with
infection length up to 2.8 cm in the case of fungal isolate VFI-51, it exhibited only 2.4 cm
(25 % infection) of infection length (Table x).
3. Colonization of the selected isolates on roots of chickpea and sorghum
Colonization of actinomycetes on chickpea and sorghum roots was confirmed by images
of SEM in actinomycetes treated roots. All the isolates exhibited good colonization on
both chickpea and sorghum roots without any damage to root surface. The hyphae of
Streptomyces were also seen to grow and adhere to the surface of the root (Fig xx).
Similarly, all the four bacterial isolates and one fungal isolate VFI-51 were proved to
colonize the roots of chickpea and sorghum in SEM analysis without causing any damage
to the roots (Fig. xx). Roots from the bacterial and fungal isolates inoculated plants
exhibited significant surface colonization. In case of VFI-51, the sporulation of the
fungus on the surface cell layer of chickpea and sorghum roots was also clearly evident.
The hyphae of VFI-51was also found to penetrate the surface cell layer of roots (Fig xx).
3. Gene expression studies
PGP gene expression profile studies were conducted only for actinomycete and bacterial
isolates as no primers were available for fungus. In case of bacterial isolates, it was not
possible to amplify genes with the tested primers and it was not possible to get

- 62 -
appropriate housekeeping genes. The expression profile studies were successful for
actinomycete isolates. Good quality RNA was isolated from all the four actinomycete
strains. qRT-PCR analysis on selected PGP genes of actinomycetes revealed up-
regulation of all the three genes and on all the four actinomycetes. β-1,3-glucanase gene
was highly up-regulated in SAI-29 (5 folds) followed by VAI-7, VAI-40 and SAI-13
while IAA gene was highly up-regulated in SAI-13 (4 folds) followed by VAI-7, VAI-40
and SAI-29. Siderophore gene was highly up-regulated in SAI-13 (1 fold) followed by
SAI-29, VAI-7 and VAI-40 (Fig 4).
3. Isolation of the active metabolites of the fungus
The organic fractions (EtOAc) of the culture filtrates of VFI-51 were found active against
the fungal pathogens. The active organic fraction was further fractionated on flash
chromatography packed with silica gel and eluted with increasing concentration of
EtOAc in n-hexane. Of all the collected fractions, only 20 % EtOAc in n-hexane was
found to be active against the fungal pathogens and this sample was sent for NMR and
MS analysis for structural elucidation.
3. NMR and MS analysis of active fraction
NMR data of the isolated compound from VFI-51 support the structure of “Citrinin” (Fig.
xx). The presence of Citrinin as a dominant compound in the purified extract was also
confirmed by LC-MS. A major peak was observed at 2.7 minute in the LC-MS
chromatogram with a m/z of 251.0919 which is 2 ppm off the theoretical (M+H)+
ion for
Citrinin (251.0914).

- 63 -
3. Effect of the active compound for its antagonistic potential against B. cinerea
The active compound, citrinin, was evaluated for its antagonistic potential against B.
cinerea under greenhouse conditions. When the pathogen, B. cinerea, was sprayed on the
plants, the disease (BGM) occurred within a week indicating the potency of the pathogen
while no toxic effect occurred in citrinin spray treatment indicating the compound is not
phytotoxic. Upon spraying both pathogen and citrinin together (at 0h), irrespective of
whichever is sprayed first, significant reduction of disease incidence was noted (<2.0
rating on 1─6 severity scale). As the application of citrinin was delayed by 24h, 48h and
72h after inoculation of B. cinerea, the efficacy of citrinin on BGM disease incidence
also reduced significantly (Table).
Table 1. List of microbial population enumerated from rhizosphere soil and
vermicomposts
Source Media CFU/ml Diversity
Rhizosphere
soil PDA 1.06X10^7 5
LBA 1.18X10^8 6
AIA 1.02X10^8 7
Vermicompost

- 64 -
A. squamosa PDA 7.2X10^6 4
LBA 1.68X10^8 6
AIA 7.1X10^7 5
P.
hysterophorus PDA 4.7X10^6 6
LBA 1.09X10^8 5
AIA 9.8X10^7 4
G. sepium PDA 6.1X10^6 5
LBA 4.8X10^7 8
AIA 5.8X10^7 6
A. indica PDA 8.5X10^6 5
LBA 1.16X10^8 7
AIA 2.3X10^7 3
J. Curcas PDA 4.5X10^6 3
LBA 1.05X10^8 5
AIA 7.1X10^7 5
Table 2. List of actinomycetes, bacteria and fungi isolated from rhizosphere soil and
vermicomposts
Source Actinomycete Isolates Bacterial Isolates Fungal Isolates
Rhizosphere
soil
SAI-1, SAI-2, SAI-3,
SAI-4, SAI-5, SAI-6,
SAI-7, SAI-8, SAI-9,
SAI-10,SAI-11, SAI-
12, SAI-13, SAI-14,
SAI-15, SAI-16, SAI-
17, SAI-18, SAI-19,
SAI-20, SAI-21, SAI-
22, SAI-23, SAI-24,
SAI-25, SAI-26, SAI-
27, SAI-28, SAI-29,
SAI-30, SAI-31, SAI-
SBI-1, SABI-2, SBI-3,
SBI-4, SBI-5, SBI-6, SBI-
7, SBI-8, SBI-9, SBI-10,
SBI-11, SBI-12, SBI-13,
SBI-14, SBI-15, SBI-16,
SBI-16, SBI-17, SBI-18,
SBI-19, SBI-20, SBI-21,
SABI-22, SBI-23, SBI-24,
SBI-25, SBI-26, SBI-27,
SBI-28, SBI-29, SBI-
30,SBI-31, SABI-32, SBI-
33 and SBI-34
SFI-1, SFI-2,
SFI-3, SFI-4,
SFI-5, SFI-6,
SFI-6, SFI-7,
SFI-8, SFI-9,
SFI-10, SFI-11,
SFI-12, SFI-13,
SFI-14, SFI-15,
SFI-16, SFI-16,
SFI-17, SFI-18,
SFI-19, SFI-
20,SFI-21, SFI-

- 65 -
32, SAI-33, SAI-34 and
SAI-35
22 and SFI-23
A. squamosa
Vermicompost
VAI-1, VAI-2, VAI-3,
VAI-4, VAI-5, VAI-6,
VAI-7, VAI-8 and
VAI-9
VBI-1, VBI-2, VBI-3,
VBI-4, VBI-5, VBI-6,
VBI-7, VBI-8, VBI-9,
VBI-10 and VBI-11
VFI- 1, VFI-8,
VFI-11, VFI-15
and VFI-17
G. sepium
Vermicompost
VAI-10, VAI-11, VAI-
12, VAI-13, VAI-14,
VAI-15, VAI-16, VAI-
17, VAI-18, VAI-19,
VAI-20 and VAI-21
VBI-12, VBI-13, VBI-14,
VBI-15, VBI-16, VBI-17,
VBI-18 and VBI-19
VFI- 19, VFI-
20, VFI-23,
VFI-25 and
VFI-28
P.
hysterophorus
Vermicompost
VAI-22, VAI-23, VAI-
24, VAI-25, VAI-26,
VAI-27, VAI-28, VAI-
29, VAI-30, VAI-31,
VAI-32, VAI-33 and
VAI-34
VBI-20,VBI-21, VBI-22,
VBI-23, VBI-24, VBI-25,
VBI-26 and VBI-27
VFI- 30, VFI-
31, VFI-33,
VFI-35,VFI-36
and VFI-38
J. Curcas
Vermicompost
VAI-35, VAI-36, VAI-
37, VAI-38, VAI-39,
VAI-40, VAI-41, VAI-
42 and VAI-43
VBI-28, VBI-29, VBI-30,
VBI-31 and VBI-32
VFI- 41, VFI-
43, VFI-47 and
VFI-49
A. indica
vermicompost
VAI-44, VAI-45, VAI-
46, VAI-47, VAI-48,
VAI-49, VAI-50, VAI-
51, VAI-52, VAI-52,
VAI-53 and VAI-54
VBI-33, VBI-34, VBI-35,
VBI-36, VBI-37 and VBI-
38
VFI- 51, VFI-
52, VFI-55,
VFI-58 and
VFI-59
Table 3. List of actinomycetes, bacteria and fungi screened from DCA for further
metabolite production assay
Table 4. Biochemical properties of selected isolates

- 66 -
Isolate Sideroph
ore
IA
A
β-1,3-
glucanase
Proteas
e
Lipas
e
Chitinas
e
Cellulas
e
HC
N
VBI-4 1 2 2 3 2 0 4 1
VBI-19 2 1 2 3 0 0 3 0
VBI-23 1 1 2 4 2 0 4 0
SBI-23 1 1 2 4 2 0 4 0
VAI-7 2 2 2 4 2 2 4 0
VAI-40 1 1 2 6 2 0 4 0
SAI-13 1 3 3 6 3 2 4 1
SAI-29 2 3 4 6 2 2 4 2
VFI-51 1 1 2 3 1 0 4 1
Table 5. Physiological properties of selected isolates
Isolate Temperature pH Salinity (% NaCl)
20°C 30°C 40°C 50°C 5 7 9 11 13 2 4 6 8 10 12 14 16 18 20 22
VBI-4 2 3 3 0 0 3 3 1 0 3 3 3 3 3 3 3 2 2 1 1

- 67 -
Table 6. Fungicide tolerance of selected isolates
VBI-19 2 3 3 0 0 3 3 1 0 3 3 3 2 0 0 0 0 0 0 0
VBI-23 2 3 3 0 0 3 3 0 0 3 3 2 2 1 0 0 0 0 0 0
SBI-23 2 3 3 0 0 3 3 0 0 3 3 3 3 0 0 0 0 0 0 0
VAI-7 2 3 3 0 0 3 3 2 0 3 3 3 3 0 0 0 0 0 0 0
VAI-40 2 3 3 0 0 3 3 2 0 3 3 3 3 0 0 0 0 0 0 0
SAI-13 2 3 3 0 0 3 3 2 0 3 3 3 3 2 0 0 0 0 0 0
SAI-29 2 3 3 0 0 3 3 2 0 3 3 3 3 0 0 0 0 0 0 0
VFI-51 2 3 3 0 0 3 3 2 0 3 3 3 3 0 0 0 0 0 0 0
Isolate Bavistin Benlate Captan Thiram Ridomil
1250 2500 2000 4000 1500 3000 1500 3000 1500 3000
VBI-4 3 3 3 3 3 2 3 1 2 0
VBI-19 3 3 3 3 3 2 3 2 2 0
VBI-23 3 3 2 1 3 3 1 0 2 1
SBI-23 3 3 2 1 3 2 1 0 2 1
VAI-7 3 3 0 0 1 0 1 0 0 0
VAI-40 3 3 0 0 0 0 1 0 0 0

- 68 -
Table 7. Evaluation of PGP traits of selected isolates on chickpea under greenhouse
conditions at 30 DAS
SAI-13 3 3 0 0 2 1 2 1 1 0
SAI-29 3 3 0 0 2 1 2 1 1 0
VFI-51 3 3 0 0 2 1 2 2 1 1

- 69 -
Isolate Plant
height
cm
Leaf
area
Leaf
weight
(g)
Nodule
Number
Nodule
dry
weight
Number
of
branches
Stem
weight
(g)
Root
Length
(cm)
Surf
Area
(cm2)
Root
Volume
(cm3)
SAI-13 38.3 316 1.70 40.7 0.08 6.00 1.09 3161 541 7.37
SAI-29 38.3 320 1.57 55.0 0.06 6.33 1.09 2940 437 5.17
SBI-23 36.0 335 2.21 29.7 0.14 4.67 1.46 3121 700 12.45
VAI-40 37.0 305 1.66 55.5 0.11 8.00 1.18 3164 589 8.77
VAI-7 38.7 331 2.09 31.7 0.12 7.00 1.18 2973 529 7.51
VBI-23 36.3 270 1.87 38.7 0.14 6.33 1.32 3697 717 11.08
VBI-19 24.1 14 0.40 21.8 0.01 3.50 0.04 837 124 1.44
VFI-51 36.7 251 1.34 58.7 0.06 6.33 0.75 2625 449 6.12
Control 34.3 292 1.82 49.7 0.14 6.33 1.21 3502 734 12.23
SE± 1.06 18.7*** 0.143*** 5.33** 0.022** 0.661** 0.086*** 57.3*** 22.6*** 0.272***
LSD (5%) 3.19 56.5 0.429 16.15 0.066 1.992 0.259 173.9 68.6 0.824
CV% 5 12 15 22 40 19 14 3 7 6
SE= Standard error; LSD= Least significant differences; CV= Coefficients of variation; **= statistically
significant at 0.01, ***= statistically significant at 0.001
Table 8. Effect of selected isolates on yield parameters of chickpea at final harvest in
greenhouse conditions
Isolate Stem weight
(g) Pod weight (g) Pod number
SAI-13 2.95 4.92 20.0
SAI-29 3.58 3.97 17.0
SBI-23 3.60 4.77 16.7
VAI-40 2.69 4.48 17.3
VAI-7 3.42 4.46 19.3
VBI-19 2.11 3.22 15.7
VBI-23 3.28 4.66 18.7
VBI-4 1.19 2.59 13.2
VFI-51 3.44 4.44 16.7

- 70 -
Control 4.23 4.70 20.3
SE± 0.373** 0.386** 1.00*
LSD (5%) 1.107 1.146 3.00
CV% 21 16 10
SE= Standard error; LSD= Least significant differences; CV= Coefficients of variation; *= statistically
significant at 0.05, **= statistically significant at 0.01
Table 9. Evaluation of PGP traits of selected isolates on chickpea under field conditions at
30 DAS
Isolate
Plant
height
(cm)
No of
branches
(plant-1
)
No of
nodules
(plant-1
)
Nodule dry
weight
(mg plant-1
)
Root dry
weight
(mg plant-1
)
Shoot dry
weight
(g plant-1
)
SAI-13 30 7.9 50 225 173 1.75
SAI-29 31 9.3 59 224 211 2.03
SBI-23 30 7.9 51 238 173 1.85
VAI-40 29 7.9 61 222 179 1.75
VAI-7 31 9.7 60 246 169 2
VBI-19 29 8 50 228 179 2.15
VBI-23 32 10 58 251 173 1.98
VBI-4 30 9.4 56 226 171 1.83
VFI-51 29 8.6 57 248 195 2.1
Control 29 7.9 49 222 168 1.72
SE± 0.54** 0.46** 2.4** 7.1* 7.0** 0.095*
LSD (5%) 1.61 1.35 7 21.1 20.7 0.281
CV% 3 9 7 5 7 9

- 71 -
SE= Standard error; LSD= Least significant differences; CV= Coefficients of variation; *= statistically
significant at 0.05, **= statistically significant at 0.01
Table 10. Evaluation of PGP traits of selected isolates on chickpea under field conditions at
60 DAS
Isolate
Plant
height
(cm)
Shoot
weight
(g plant-
1)
Number
of pods
(plant-1
)
Pod
weightt
(g plant-
1)
Leaf
weight
(g plant-
1)
Leaf area
(m-2
plant-1
)
SAI-13 48 4.17 62 4.4 4.13 660
SAI-29 49 3.99 64 4.41 3.82 665
SBI-23 49 4.03 64 4.25 4.1 699
VAI-40 47 3.97 59 4.28 4.09 855
VAI-7 49 4.69 79 4.53 4.41 692
VBI-19 47 3.96 59 4.53 3.74 649
VBI-23 52 5.27 73 5.46 5.03 842
VBI-4 48 4.03 61 4.32 3.79 637
VFI-51 47 4.41 72 4.32 4.4 699
Control 47 3.96 59 4.21 3.71 626
SE± 0.8* 0.244* 3.3** 0.208* 0.244* 29.7***
LSD
(5%) 2.4 0.725 9.7 0.617 0.726 88.2
CV% 3 10 9 8 10 7
SE= Standard error; LSD= Least significant differences; CV= Coefficients of variation; *= statistically
significant at 0.05, **= statistically significant at 0.01, ***= statistically significant at 0.001

- 72 -
Table 11. Grain yield and morphological observation of chickpea at final harvest under field
conditions
Isolate
Stover yield
(t
ha-1
)
Grain yield (t
ha-1
)
Total Dry
Matter
(t ha-1
)
Pod weight
(g plant-1
)
Seed weight
(g plant-1
)
Seed number
(plant-1
)
1000 seed
weight (g)
SAI-13 1.7 1.67 3.37 18.56 14.07 77 195
SAI-29 2.17 1.85 4.01 23.86 15.82 80 199
SBI-23 1.71 1.66 3.38 17.29 13.46 68 196
VAI-40 1.69 1.82 3.5 21.3 15.84 85 196
VAI-7 1.89 2.09 3.98 19.18 14.25 70 202
VBI-19 1.69 1.77 3.46 18.78 14.29 75 197
VBI-23 1.81 2.05 3.85 18.42 13.79 70 201
VBI-4 2.15 1.86 4.01 20.86 14.86 79 196
VFI-51 1.85 1.78 3.64 18.41 14.28 70 196
Control 1.68 1.67 3.34 17.03 13.31 66 195
SE± 0.111* 0.075** 0.141** 1.193* 0.408** 3.50* 1.4**
LSD (5%) 0.34 0.221 0.418 3.544 1.211 10.4 4.1
CV% 11 7 7 11 5 8 1
SE= Standard error; LSD= Least significant differences; CV= Coefficients of variation; *= statistically
significant at 0.05, **= statistically significant at 0.01
Table 12. Effect of selected isolates on total N, available P, and Organic Carbon % of rhizosphere
soils at flowering and at harvesting of chickpea
Isolate
At flowering stage At harvesting stage
Total N
(ppm)
Available
P (ppm) OC %
Total N
(ppm)
Available
P (ppm) OC %
SAI-13 759 9.6 0.56 722 7 0.56

- 73 -
SAI-29 685 9.3 0.56 724 7.1 0.56
SBI-23 728 10.6 0.57 799 9.9 0.59
VAI-40 726 9.5 0.57 747 7.5 0.62
VAI-7 742 12.6 0.59 736 8.5 0.59
VBI-19 688 9.2 0.56 730 7.1 0.57
VBI-23 797 13.1 0.59 726 10.6 0.57
VBI-4 753 9.4 0.57 767 7.8 0.57
VFI-51 698 9.4 0.54 765 7.1 0.56
Control 675 9.2 0.54 721 6.9 0.55
SE± 14.5** 0.24*** 0.009* 13.4* 0.40*** 0.010*
LSD (5%) 46.3 0.77 0.028 42.7 1.27 0.031
CV% 3 3 2 3 7 2
SE= Standard error; LSD= Least significant differences; CV= Coefficients of variation; *= statistically
significant at 0.05, **= statistically significant at 0.01, ***= statistically significant at 0.001
Table 13. Effect of selected isolates on dehydrogenase activity and microbial carbon of rhizosphere
soils at flowering and at harvesting of chickpea
Treatment
Dehydrogenase activity
(µg TPF g-1
soil 24h-1
)
at flowering
Microbial
Carbon (µg g-1
soil)
at flowering
Dehydrogenase activity
(µg TPF g-1
soil 24h-1
)
at harvest
Microbial
Carbon (µg g-1
soil)
at harvest
SAI-13 61.5 634 76 584
SAI-29 43.5 649 71 778
SBI-23 50 723 62 567
VAI-40 60 782 68 568
VAI-7 50.5 777 74.5 608
VBI-19 46 699 65.5 850
VBI-23 51.5 636 56.5 708

- 74 -
VBI-4 43 636 72 667
VFI-51 43.5 657 68.5 597
Control 41 612 55.5 551
SE± 1.86*** 21.7** 2.06*** 32.8***
LSD (5%) 5.94 69.4 6.58 104.9
CV% 5 5 4 7
SE= Standard error; LSD= Least significant differences; CV= Coefficients of variation; **=
statistically significant at 0.01, ***= statistically significant at 0.001
Table 14. Sorghum Morphological observation at 60 DAS in greenhouse conditions
Isolate Stem dry
weight (g)
Leaf dry
weight (g)
Root dry
weight (g)
Leaf area
(cm2)
Plant
height
(cm)
Number of
leaves
Root
Length
(cm)
Surf Area
(cm2)
Root
Volume
(cm3)
VAI-51 0.80 1.90 0.33 747 98 8.3 23109 3004 31.5
VAI-40 0.86 1.93 0.33 704 99 8.1 19301 2572 27.9
VAI-7 0.81 1.91 0.44 726 95 7.7 21893 2896 31.5
SAI-13 0.57 1.33 0.24 535 81 7.7 16719 2434 28.9
SAI-29 1.00 2.29 0.35 918 103 8.3 16042 2264 26.2
VBI-23 0.78 1.78 0.46 685 94 7.3 20437 2871 32.7
VBI-19 0.77 1.83 0.63 708 97 7.7 18476 2706 32.2
VBI-4 0.53 1.16 0.19 501 87 6.7 15713 2229 26.6
SBI-23 0.77 1.77 0.47 690 93 7.7 17328 2401 26.9
Control 0.76 1.81 0.35 676 96 7.7 20698 2937 34.0
SE± 0.119NS
0.188** 0.070* 59.3** 3.8* 0.33* 1434.4* 174.4* 2.59NS
LSD (5%) 0.353 0.558 0.208 176.1 11.3 0.97 4261.9 518.2 7.69
CV% 27 18 32 15 7 7 13 12 15
SE= Standard error; LSD= Least significant differences; CV= Coefficients of variation;
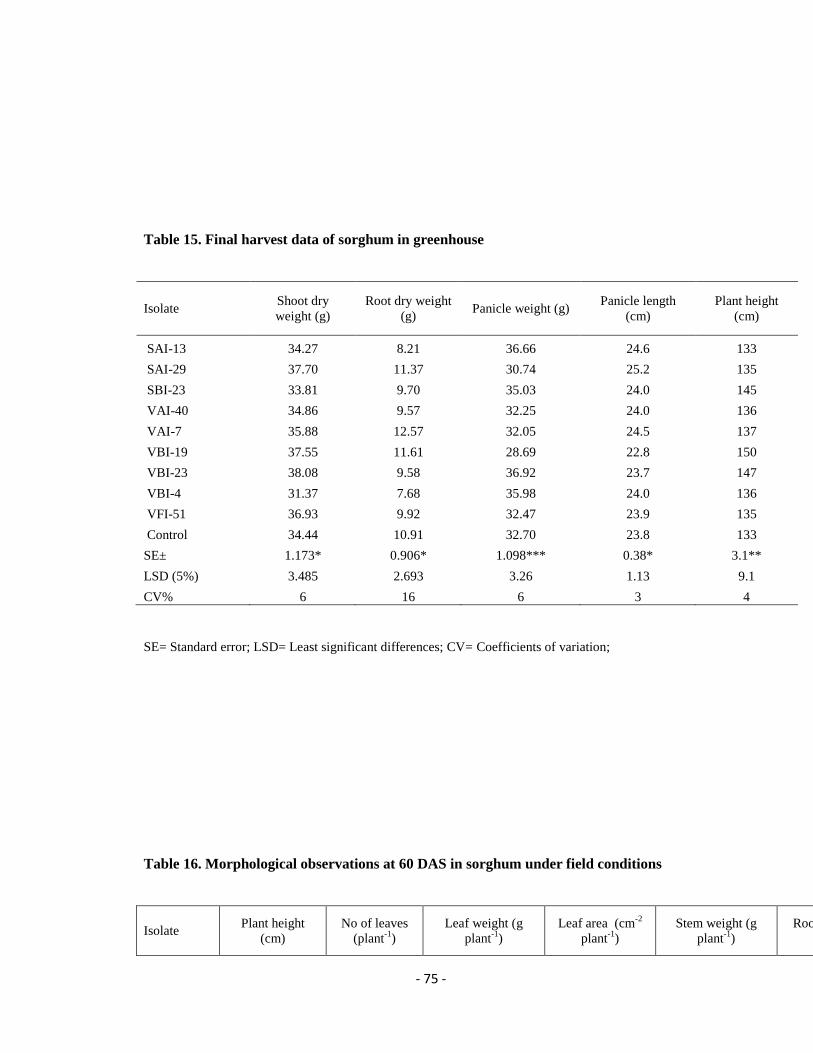
- 75 -
Table 15. Final harvest data of sorghum in greenhouse
Isolate Shoot dry
weight (g)
Root dry weight
(g) Panicle weight (g)
Panicle length
(cm)
Plant height
(cm)
SAI-13 34.27 8.21 36.66 24.6 133
SAI-29 37.70 11.37 30.74 25.2 135
SBI-23 33.81 9.70 35.03 24.0 145
VAI-40 34.86 9.57 32.25 24.0 136
VAI-7 35.88 12.57 32.05 24.5 137
VBI-19 37.55 11.61 28.69 22.8 150
VBI-23 38.08 9.58 36.92 23.7 147
VBI-4 31.37 7.68 35.98 24.0 136
VFI-51 36.93 9.92 32.47 23.9 135
Control 34.44 10.91 32.70 23.8 133
SE± 1.173* 0.906* 1.098*** 0.38* 3.1**
LSD (5%) 3.485 2.693 3.26 1.13 9.1
CV% 6 16 6 3 4
SE= Standard error; LSD= Least significant differences; CV= Coefficients of variation;
Table 16. Morphological observations at 60 DAS in sorghum under field conditions
Isolate Plant height
(cm)
No of leaves
(plant-1
)
Leaf weight (g
plant-1
)
Leaf area (cm-2
plant-1
)
Stem weight (g
plant-1
)
Root weight (g
plant-1
)
Total plant weight
(g)

- 76 -
PVK
801
ICSV
93046
PVK
801
ICSV
93046
PVK
801
ICSV
93046
PVK
801
ICSV
93046
PVK
801
ICSV
93046
PVK
801
ICSV
93046
PVK
801
ICSV
93046
SAI-13 165 206 10 9 22.76 21.48 4214 3837 28.89 28.03 9.11 8.39 51.64 49.50
SAI-29 171 209 10 10 22.18 19.42 3766 3231 29.67 26.65 9.50 7.00 51.85 46.10
SBI-23 161 208 10 10 22.77 22.05 3980 3295 26.78 29.71 8.37 7.01 49.55 51.80
VAI-7 170 222 11 11 23.83 26.79 4267 4411 32.32 37.95 7.15 9.83 56.15 64.70
VAI-40 167 211 11 10 22.03 18.41 3881 2948 30.16 23.99 6.75 6.42 52.19 42.40
VAI-51 172 223 11 10 26.70 21.40 4420 3539 35.52 31.95 6.83 8.05 62.23 53.40
VBI-4 169 212 10 10 23.12 19.75 4562 3365 34.19 31.57 9.13 6.87 57.31 51.30
VBI-19 160 204 10 10 21.04 16.33 4267 3874 29.46 25.93 9.03 8.04 50.49 42.30
VBI-23 166 213 11 10 22.74 19.54 3716 3066 28.03 26.96 6.95 6.25 50.76 46.50
Control 171 219 11 10 23.40 19.34 4410 3426 36.85 31.05 8.11 6.50 60.24 50.40
SE± 167 213 11 10 23.06 20.45 4148 3499 31.19 29.38 8.09 7.44 54.24 49.84
LSD (5%) 2.2** 3.7* 0.3* 0.2* 0.840** 1.178*** 186.7* 235.1** 1.891** 1.974** 0.658* 0.529** 2.386** 2.834***
CV% 6.6 10.9 0.8 0.7 2.496 3.500 554.8 698.6 5.618 5.866 1.954 1.572 7.089 8.422
SE= Standard error; LSD= Least significant differences; CV= Coefficients of variation; *= statistically
significant at 0.05, **= statistically significant at 0.01, ***= statistically significant at 0.001
Table 17. Final harvest and net plot yield of sorghum in field
Isolate
1000 seed weight Plant height (cm) Panicle length (cm) Grain yield (t ha-1
) Stover yield (t ha-1
)
PVK
801
ICSV
93046
PVK
801
ICSV
93046
PVK
801
ICSV
93046
PVK
801
ICSV
93046 PVK 801
ICSV
93046
SAI-13 31 21 183 272 24.7 17.6 1.58 0.85 5.59 9.56
SAI-29 29 19 184 280 24.2 17.3 2.22 0.47 7.00 10.62
SBI-23 30 16 188 289 25.0 17.3 1.55 0.55 4.77 10.82
VAI-7 26 16 189 281 25.2 17.5 1.91 0.35 6.46 10.28
VAI-40 26 17 188 285 25.0 17.0 1.33 0.42 5.60 9.10

- 77 -
VAI-51 29 18 190 297 25.5 16.9 1.93 0.87 5.52 11.80
VBI-4 25 19 190 280 25.8 16.7 1.55 0.62 4.56 9.94
VBI-19 28 16 179 275 25.5 17.9 1.40 0.29 5.05 9.40
VBI-23 29 19 181 267 23.1 15.9 1.43 0.55 5.74 11.29
Control 25 19 187 297 24.2 17.8 1.83 0.55 5.73 11.17
SE± 1.1** 1.0* 2.4* 4.3*** 0.36** 0.28** 0.182* 0.079*** 0.348** 0.473**
LSD (5%) 3.2 3.1 7.1 12.9 1.08 0.83 0.540 0.235 1.035 1.406
CV% 7 10 2 3 3 3 19 25 11 8
SE= Standard error; LSD= Least significant differences; CV= Coefficients of variation; *= statistically
significant at 0.05, **= statistically significant at 0.01, ***= statistically significant at 0.001
Table 18. Sweet sorghum brick analysis at harvest.
Treatment Juice volume (ml
plant-1) Juice weight (g
plant-1) Brick
reading
SAI-13 157 0.194 15.1
SAI-29 232 0.242 15.5
SBI-23 232 0.229 15.7
VAI-40 242 0.220 15.2
VAI-7 237 0.245 15.4
VBI-19 235 0.223 15.2
VBI-23 298 0.302 14.5
VBI-4 257 0.256 15.5
VFI-51 239 0.222 15.6
Control 217 0.218 15.0
SE± 7.4*** 0.013** 0.12***
LSD (5%) 21.9 0.040 0.35
CV% 5 10 1
SE= Standard error; LSD= Least significant differences; CV= Coefficients of variation; **= statistically
significant at 0.01, ***= statistically significant at 0.001

- 78 -
Table 19. Rhizosphere soil mineral properties of sorghum field, at flowering stage.
OC% Total N (ppm) Available P (ppm)
Isolate PVK 801 ICSV 93046 PVK 801 ICSV
93046 PVK 801
ICSV
93046
SAI-13 0.58 0.58 730 729 9.9 12.1
SAI-29 0.53 0.56 650 667 9.2 9.1
SBI-23 0.55 0.58 685 742 8.9 10.6
VAI-7 0.56 0.55 747 767 15.1 14.6
VAI-40 0.52 0.53 615 660 9.6 11.0
VAI-51 0.57 0.59 675 675 15.0 18.7
VBI-4 0.59 0.62 707 729 9.5 8.5
VBI-19 0.56 0.56 752 695 9.5 9.2
VBI-23 0.55 0.55 679 683 6.7 10.7
Control 0.54 0.55 722 683 12.7 10.8
SE± 0.007** 0.010** 17.3** 19.6* 0.86*** 0.93***
LSD (5%) 0.024 0.032 55.5 62.8 2.74 2.96
CV% 2 3 4 4 11 11
SE= Standard error; LSD= Least significant differences; CV= Coefficients of variation; **= statistically
significant at 0.01, ***= statistically significant at 0.001
Table 20. Evaluation of efficacy of selected isolates on M. Phaseolina under light chamber
conditions

- 79 -
Isolate Number of roots
infected*
Percent of roots
infected
Visual
Rating
VBI-4 3.3 33 2
VBI-19 4.3 43 2
VBI-23 2.7 27 2
SBI-23 3.0 30 2
VAI-7 4.0 40 2
VAI-40 6.0 60 3
SAI-13 3.3 33 2
SAI-29 3.0 30 2
VFI-51 1.7 17 1
Control 10.0 100 5
*= Mean of three replications
Table 21. Evaluation of efficacy of selected isolates on M. Phaseolina under greenhouse
conditions
Isolate Length of
infection (cm)
% of infection
VBI-4 4.3 45
VBI-19 2.8 30
VBI-23 3.5 37
SBI-23 4.5 47

- 80 -
VAI-7 3.2 33
VAI-40 3.1 32
SAI-13 3.1 32
SAI-29 3.5 36
VFI-51 2.4 25
Control 9.6 100
Table 22. Efficacy of Citrinin against B. cinerea under greenhouse conditions
Treatments BGM severity (in 1─6 scale) #
Control 1.0
Only BGM spray 6.0
Only Citrinin spray 1.0
BGM spray followed by Citrinin spray at 0 h 1.7
Citrinin spray followed by BGM spray at 0 h 2.0
BGM spray at 0 h while Citrinin spray at 24 h 3.3
BGM spray at 0 h while Citrinin spray at 48 h 4.7
BGM spray at 0 h while Citrinin spray at 72 h 6.0
SE± 0.37***
LSD (5%) 1.11
CV% 20
SE= Standard error; LSD= Least significant differences; CV= Coefficients of variation; ***= Statistically
significant at 0.001; # = The BGM severity of the disease was recorded after 20 days of inoculation using a
1─6 rating scale where, 1 is no infection on any part of the plant and 6 is extensive soft rotting, fungal
growth on more than 70% of the leaves, branches and stems.

- 81 -
References
Agarwal, A. and Tripathi, H.S. 1999. Biological and chemical control of botrytis gray
mold of chickpea. Journal of Mycology and Plant Pathology, 29: 52–56.
Ahemad, M. and Kibret, M. 2014. Mechanisms and applications of plant growth
promoting rhizobacteria: Current perspective. Journal of King Saud University, 26:
1─20.
Ahmad, J.S. and Baker, R. 1988. Rhizosphere competence of Trichoderma harzianum.
Phytopathology, 77:182–189.
Akhtar, M.S. and Siddiqui, Z. A. 2010. Effect of AM fungi on plant growth and root rot
diseases of chickpea. American-Eurasian Journal of Agriculture and
Environmental Science, 8:544–549
Alström, S. 1991. Induction of disease resistance in common bean susceptible to halo
blight bacterial pathogen after seed bacterization with rhizosphere pseudomonads.
Journal of General and Applied Microbiology, 37:495-501.
Altschul, S.F., Gish, W., Miller, W., Myers, E.W., and Lipman, D.J. 1990. Basic local
alignment search tool. Journal of Molecular Biology, 215:403–410
Anderson, T.H and Domsch, K.H. 1989. Ratios of microbial biomass carbon to total
organic carbon in arable soils. Soil Biology and Biochemistry, 21:471–479.
Aneja, K.R. 2003. In (eds) Staining methods: Gram staining of bacteria. In New Age
(eds) Experiments in Microbiology Plant pathology and Biotechnology, New Age
International (P) Limited Publishers, pp 102–106.

- 82 -
Araújo, J.M. 1998. Strategies for selective isolation of actinomycetes. In: Melo IS,
Azevedo JL, (eds) Microbial Ecology, Jaguariuna: EMBRAPA – CNPMA, 351–
367.
Awasthi, C.P., Abidi, A.B., and Chowdhury, A.R. 1991. Studies on the nutritional quality
of different varieties of chickpea. Indian Journal of Agricultural Research, 25:
21─26.
Bailey, B.A., Bae, H., Strem, M.D., Roberts, D.P, Thomas, S.E., Crozier, J., Samuels,
G.J., Choi, I.Y. and Holmes, K.A. 2006. Fungal and plant gene expression during the
colonization of cacao seedlings by endophytic isolates of four Trichoderma species.
Planta, 224:1449–1464.
Bais, H.P., Weir, T.L., Perry, L.G., Gilroy, S. and Vivanco, J.M. 2006. The role of root
exudates in rhizosphere interactions with plants and other organisms. Annual Review
of Plant Biology 57:233–266
Bazzicalupo, M., and Fani, R. 1995.The use of RAPD for generating specific DNA
probes for microorganisms. In: Clap, J.P. (ed.) Methods in Molecular Biology,
Species Diagnostic Protocols: PCR and other Nucleic Acid Methods; Humana Press
Inc, Totowa NJ, 122─124.
Bhattacharya, A., Chandra, S. and Barik, S. 2009. Lipase and protease producing
microbes from the environment of sugar beet field. Industrial Journal of
Agricultural Biochemistry 22:26–30
Bhosale, H.J. and Kadam, T.A. 2015. Generic diversity and a comparative account on
plant growth promoting characteristics of actinomycetes in roots and rhizosphere of

- 83 -
Saccharum officinarum. International Journal of Current Microbiology and Applied
Science 4:230–244.
Boulter, J.I., Trevors, J.T. and Boland, G.J. 2002. Microbial studies of compost: bacterial
identification, and their potential for turfgrass pathogen suppression. World J Micro
Biotech 18:661–671
Bozzola, J.J. and Russell, L.D. 1999. In: Electron microscopy principals and techniques
for biologists. 2nd
edn, Jones and Barlett publishers, Sudbury, Massachusetts pp. 19–
24, 54–55, 63–67.
Brooks, P.C., Landman, A., Pruden, G. and Jenkinson, D.S. 1985. Chloroform fumigation
and the release of soil nitrogen; a rapid direct extraction method to measure
microbial biomass nitrogen in soil. Soil Biology and Biochemistry, 17: 837–842.
Casida, L.E. 1977. Microbial metabolic activity in soil as measured by dehydrogenase
determinations. Applied Environmental Microbiology, 34:630–636
Cattelan, A.J. and Hartel, P.G. 2000. Traits associated with plant growth-promoting
rhizobacteria (PGPR). In: Socieda de Brasileira de Ciência do Solo. Tópicosem
Ciênciado Solo.Viçosa: Socieda de Brasileira de Ciência do Solo, pp 213–234.
Chamblee, D.S. and Green, J.T. 1995. Production and utilization of pastures and forages
in North Carolina. North Carolina Agricultural Research Service Technical Bulletin,
305:153.
Chomczynski, P. and Mackey, K. 1995. Substitution of chloroform by
bromochloropropane in the single-step method of RNA isolation. Analytical
biochemistry, 1: 163–164.

- 84 -
Clarke, H. and Siddique, K. 2004. Response of chickpea genotypes to low temperature
stress during reproductive development. Field Crop Research, 90:323–334
Cross, T. 1989. Growth and examination of actinomycetes: some guidelines. In: Williams
ST, Sharpe ME, Holt JG, (eds) Bergey's manual of systematic bacteriology.
Baltimore: Williams and Wilkins, pp 2340–2343.
Daferena, D.J., Ziogas, B.N., and Polissiou, M.C. 2003. The effectiveness of plant
essential oils on the growth of Botrytis cinerea, Fusarium sp. and
Clavibactermichiganensis sub sp. michiganensis. Crop Protection, 22: 39–44.
Damodaran, C., Kathirvel-Pandian, S., Seeni, S., Ganesan, G.M. and
Shanmugasundaram, S. 1975. Citrinin, a phytotoxin?. Experientia, 31:1415-1417
De Weger, L. A., A. J. van der Bij, L. C. Dekkers, M. Simons, C. A.Wijffelman, and B. J.
J. Lugtenberg. 1995. Colonization of the rhizosphere of crop plants by plant-
beneficial pseudomonads. FEMS Microbiol. Ecol.
Ding, C.H., Jiang, Z.Q., Li, X.T., Li, L.T and Kusakabe, I. 2004. High activity xilanase
production by Streptomyces olivaceoviridis E-86. World Journal of Microbiology
and Biotechnology, 20:7─10.
do Rosário Marinho, A.M. and Rodrigues-Fo, E. 2011. Dicitrinol, a Citrinin Dimer,
Produced by Penicillium janthinellum, Helvetica ChimicaActa, 94: 835─841.
Drozdowicz, A.G. 1987. Microbiologia do solo. In: Roitman, I., Travassos, L.R. and
Azevedo, J.L. (eds) Tratado de microbiologia. São Paulo, Manole pp17–28.
Dutta, T., Sahoo, R., Sengupta, R., Ray, S.S., Bhattacharjee, A., and Ghosh, S. 2007.
Novel cellulases from an extremophilic filamentous fungi Penicillium citrinum:

- 85 -
production and characterization. Journal of Industrial Microbiology and
Biotechnology, 35: 275─282.
EFSA Panel on Contaminants in the Food Chain. 2012. Scientific Opinion on the risks
for public and animal health related to the presence of citrinin in food and feed1’
EFSA journal, 2605
Elliot, L.F. and Lynch, J.M. 1995. The international workshop on establishment of
microbial inocula in soils: cooperative research project on biological resource
management of the organization for economic cooperation and development
(OECD). American Journal of Alt Agriculture 10:50–73.
Ellis, R.J., Timms-Wilson, T.M. and Bailey, M.J. 2000. Identification of conserved traits
in fluorescent pseudomonads with antifungal activity. Environmental Microbiology,
2:274–284
El-Tarabily, K.A. 2008. Promotion of tomato (Lycopersi conesculentum Mill.) plant
growth by rhizosphere competent 1-aminocyclo propane-1-carboxylic acid
deaminase-producing Streptomycete actinomycetes. Plant Soil, 308: 161–174.
El-Tarabily, K.A., Nassar, A.H., Hardy, G.E.St.J. and Sivasithamparam, K. 2009. Plant
growth-promotion and biological control of Pythium aphanidermatum, a pathogen of
cucumber, by endophytic actinomycetes. Journal of Applied Microbiology, 106:13–
26.
Esitken, A., Yildiz, H.E., Ercisli, S., Donmez, F.M., Turan, M. and Gunes, A. 2010.
Effects of plant growth-promoting bacteria (PGPB) on yield, growth and nutrient
contents of organically grown strawberry. Scientia Horticulturae, 122:62– 64

- 86 -
Figueiredo, M.V.B., Martinez, C.R., Burity, H.A., and Chanway, C.P. 2008. Plant
growth-promoting rhizobacteria for improving nodulation and nitrogen fixation in
the common bean (Phaseolus vulgaris L.).World Journal of Microbiology
Biotechnology, 24: 1187−1193.
Franco-Correa, M., Quintana, A., Duque, C., Suarez, C., Rodriguez, M.X. and Jose-
Miguel, B. 2010. Evaluation of actinomycete strains for key traits related with plant
growth promotion and mycorrhiza helping activities. Applied Soil Ecology 45:209–
217.
Gerhardson, B. 2002. Biological substitutes for pesticides. Trends Biotechnol.20:338–
343.
Gopalakrishnan, S., Humayun, P., Kiran, B.K., Kannan, I.G.K., Vidya, M.S., Deepthi, K.,
and Rupela, O. 2011a. Evaluation of bacteria isolated from rice rhizosphere for
biological control of charcoal rot of sorghum caused by Macrophomina phaseolina
(Tassi) Goid’. World Journal of Microbiology Biotechnology, 27: 1313−1321
Gopalakrishnan, S., Pande, S., Sharma, M., Humayun, P., Kiran, B.K., Sandeep, D.,
Vidya, M.S.., Deepthi, K., and Rupela, O. 2011c. Evaluation of actinomycete
isolates obtained from herbal vermicompost for biological control of Fusarium wilt
of chickpea. Crop Protection, 30: 1070−1078.
Gopalakrishnan, S., Srinivas, V., Alekhya, G. and Prakash, B. 2015. Effect of plant
growth-promoting Streptomyces sp. on growth promotion and grain yield of
chickpea (Cicer arietinum L.). 3 Biotech, DOI 10.1007/s13205-015-0283-8
Gopalakrishnan, S., Suresh, P., Mamta. S., Humayun, P., Keerthi, K.B., Sandeep, D.,
Vidya, M.S., Deepthi, K. and Rupela, O. 2011. Evaluation of actinomycete isolates

- 87 -
obtained from herbal vermicompost for the biological control of Fusarium wilt of
chickpea. Crop Protection, 30:1070–1078
Gopalakrishnan, S., Upadhyaya, H.D., Humayun, P., Srinivas, V., Vidya, M.S., Alekhya,
G., Singh, A., Vijayabharathi, R., Bhimineni, R.K., Seema, M., Rathore, A. and
Rupela, O. 2012. Plant growth-promoting traits of biocontrol potential bacteria
isolated from rice rhizosphere. Springer Plus, 1:71
Gopalakrishnan, S., Vadlamudi, S., Bandikinda, P., Sathya, A., Vijayabharathi, R.,
Rupela, O., Kudapa, B., Katta, K. and Varshney, R.K. 2014. Evaluation of
Streptomyces strains isolated from herbal vermicompost for their plant growth-
promotion traits in rice. Microbiological Research, 169:40–48
Gray, E.J. and Smith, D.L. 2005. Intracellular and extracellular PGPR: commonalities
and distinctions in the plant-bacterium signaling processes. Soil Biology and
Biochemistry 37:395–412
Haas, D., Keel, C., Laville, J., Maurhofer, M., Oberhansli, T., Schnider, U., Voisard C.,
Wüthrich, B., and Défago, G. 1991. Secondary metabolites of Pseudomonas
fluorescens strain CHA0 involved in the suppression of root diseases. In: Hennecke,
H., and Verma, D.P.S., editors, Advances in Molecular Genetics of Plant-Microbe
Interactions. Kluwer Academic Publishers, 11: 450─456.
Habe, M.H. and Uesughi, C.H. 2000. An in vitro method for evaluating the ability of
bacteria colonizing on tomato roots. Brazilian Phytopathology 25:657–660
Halder, A.K., Mishra, A.K. and Chakarbarty, P.K. 1991. Solubilization of inorganic
phosphates by Bradyrhizobium. Indian Journal of Experimental Biology, 29:28–31.

- 88 -
Hamdali, H., Hafidi, M., Virolle, M.J. and Ouhdouch, Y. 2008. Rock phosphate-
solubilizing Actinomycetes: screening for plant growth-promoting activities. World
Journal of Microbiology and Biotechnology, 24:2565─2575.
Hendricks, C.W., Doyle, J.D. and Hugley, B. 1995. A new solid medium for enumerating
cellulose-utilizing bacteria in soil. Applied Environmental Microbiology, 61:2016–
2019.
Hirano, S. and Nagao, N. 1988. An improved method for the preparation of colloidal
chitin by using methanesulfonic acid. Agricultural and Biological Chemistry, 52:
2111─2112.
Hoffland, E., Hakulinen, J., and van Pelt, J. A. 1996. Comparison of systemic resistance
induced by avirulent and nonpathogenic Pseudomonas species. Phytopathology,
86:757-762.
Hsu, S.C. and Lockwood, J.L. 1975. Powdered Chitin Agar as a Selective Medium for
Enumeration of Actinomycetes in Water and Soil. Journal of Applied Microbiology,
29:422–426.
Indiragandhi, P., Anandham, R., Madhaiyan, M., and Sa, T.M. 2008. Characterization of
plant growth-promoting traits of bacteria isolated from larval guts of diamondback
moth Plutellaxylostella (Lepidoptera; Plutellidae). Current Microbiology, 56:
327─333.
Joseph, B., Patra, R.R. and Lawrence, R. 2007. Characterization of plant growth
promoting rhizobacteria associated with chickpea (Cicer arietinum L.). International
Journal of Plant Prod 1:141–152.

- 89 -
Keel C, Voisard C, Berling CH, Kahr G, Defago G (1989) Iron sufficiency, a prerequisite
for the suppression of tobacco black root Rot by Pseudomonas fluorescens strain
CHA0 under gnotobiotic conditions. Phytopathol 79(5):584–589
Khamna, S., Yokota, A. and Lumyoung, S. 2009. Actinomycetes isolated from medicinal
plant rhizosphere soils: diversity and screening of antifungal compounds Indole-3-
acetic acid and siderophore production. World Journal of Microbiology and
Biotechnology, 25:649–655
Khan, S.A, Hamayun, M., Yoon, H., Kim, H.Y., Suh, S.J., Hwang, S.K., Kim, J.M., Lee,
I.J., Choo, Y.S., Yoon, U.H., Kong, W.S., Lee, B.M., and Kim, J.G. 2008. Plant
growth-promotion and Penicillium citrinum. BMC Microbiology, 8: 231.
Kloepper, J., Tuzun, S. and Kuc, J. 1992. Proposed definitions related to induced disease
resistance. Biocontrol Science and Technology, 2:347–9.
Leeman, M., van Pelt, J. A., den Ouden, F. M., Heinsbroek, M., Bakker, P.A. H. M. and
Schippers, B. 1995. Induction of systemic resistance against Fusarium wilt of
radish by lipopolysaccharides of Pseudomonas fluorescens. Phytopathology,
85:1021-1027.
Lima, L.H.C., Marco, J.L., and Felix, J.R. 1998. Enzimas hidroliticasenvolvid as no
controle biologico por miciparasitisma. In: Melo, I.S., and Azevedo, J.L. (eds)
Controlebiologico. 11 Jaguraiuna; EMBRAPA-Meio Ambiente, pp263−304.
Loh, J., Pierson, E. A., Pierson, L. S., III, Stacey, G., and Chatterjee, A. 2002. Quorum
sensing in plant-associated bacteria. Current Opinion on Plant Biology, 5:285-
290.
Lorck, H. 1948. Production of hydrocyanic acid by bacteria. Plant Physiology, 1:142–146

- 90 -
Lugtenberg, B. and Kamilova, F. 2009. Plant-growth-promoting rhizobacteria. Annual
Review of Microbiology, 63:541–556
Lugtenberg, B.J.J. and Dekkers, L.C. 1999. What makes Pseudomonas bacteria
rhizosphere competent?. Environmental Microbiology, 1: 9─13.
Melouk, H.A., and Akem, C.N. 1987. Inhibition of growth of Sclerotinia minor and other
pathogens by citrinin in the filtrate of Penicillium citrinum. Mycopathologia, 100:
91─96.
Merzaeva, O.V. and Shirokikh, I.G. 2006. Colonization of plant rhizosphere by
actinomycetes of different genera. Microbiology, 75:226–230.
Muto, H., Watahiki, M.K. and Yamamoto, K.T. 2007. What Makes each Aux/IAA Gene
Unique in its Gene Family, Expression Pattern or Properties of the Gene Product?
Plant Signalling and Behavior, 2:390–392.
Nassar, A.H., El-Tarabily, K.A. and Sivasithamparam, K. 2003. Growth promotion of
bean (Phaseolus vulgaris L.) by a polyamine-producing isolate of Streptomyces
griseoluteus. Plant Growth Regulation, 40:97–106.
Nelson DW, Sommers LE (1982) Total organic carbon and organic matter. In Methods of
soil analysis, Part 3, Chemical and microbiological properties. Edited by Page
AL, Miller RH, Keeney DR, Soil Science of America, Inc., Madison, Wis., USA.
pp 539–579
Novozamsky I, Houba VJG, van Eck R, van Vark W (1983) A novel digestion technique
for multiple element analysis. Commun Soil Sci Plant Anal 14:239–248

- 91 -
Olsen SR, Sommers LE (1982) Phosphorus. In Methods of soil analysis, Part 2, Chemical
and microbial properties, 2nd ed, Agronomy Monograph No 9,Edited by AL
Page, American Society of Agronomy, Madison, Wis., USA pp 403–430
Pande, S., Galloway, J., Gaur, P.M., Siddique, K.H.M., Tripathi, H.S., Taylor, P.,
MacLeod, M.W.J., Basandrai, A.K., Bakr, A., Joshi, S., Kishore, G.K., Isenegger,
D.A., Rao, J.N., and Sharma, M.(2006), ‘Botrytis gray mold in chickpea: a review of
biology, epidemiology and disease management’,Australian Journalof Agricultural
Research, 57,1137─1150.
Pande, S., Sharma, M., Nagavardhini, A., and Rameshwar, T. (2012), ‘High throughput
phenotyping of chickpea diseases’, In: Information Bulletin No. 92. International
Crops Research Institute for the Semi-Arid Tropics, Patancheru 502 324, Andhra
Pradesh, India;ISBN 978-92-9066-552-6.
Pandey, P., Kang, S.C., and Maheswari, D.K. (2005),‘Isolation of endophytic plant
growth-promoting Burkholderia spp. MSSP from root nodules of Mimosa
pudica’,Current Science,89, 177─180.
Park, S.Y., Kim, R., Ryu, C.M., Choi, S.K., Lee, C.H., Kim, J.G., and Park, S.H.
(2008),‘Citrinin, a mycotoxin from Penicillum citrinum, plays a role in inducing
motility of Paenibacillus polymyxa’,FEMS Microbiology Ecology, 65, 229─237.
Patten C, Glick BR (2002) Role of Pseudomonas putida in indole acetic acid in
development of host plant root system. Appl Environ Microbiol 68:3795-3801
Petrosyan P, Garcia-Varela M, Luz-Madrigal A, Huitron C, Flores ME (2003)
Streptomyces mexicanus sp., a xylanolytic micro-organism isolated from soil. Int J
Syst Evol Microbiol 53:269–273.

- 92 -
Phukan I, Madhab M, Bordoloi M, Sarmah SR, Dutta P, Begum R, Tanti A, Bora S, Nair
SC, Rai S, Debnath S, Barthakur BK (2012) Exploitation of PGP microbes of tea for
improvement of plant growth and pest suppression: A novel approach. Two and a
Bud 59:69-74.
Pitt, J.J. (2002), ‘Biology and ecology of toxigenic Penicillium species’,Mycotoxins and
food Safety (De Vries, J.W., Trucksess, M.W. and Jackson, L.S., eds). Kluwer
Academic, Plenum Publishers, New York. Pp29–41.
Postma, J., M. Montanari, and P. H. J. F. van den Boogert. 2003. Microbial enrichment to
enhance the disease suppressive activity of compost. Eur. J. Soil Biol. 39:157–163.
Postma, J., Montanari, M., and Van den Boogert, P.H.J.F. (2003), ‘Microbial enrichment
to enhance disease suppressive activity of compost’,European Journal of Soil
Biology,39, 157−163.
Rao GVR, Ratna Kumari B, Sahrawat KL, Wani SP (2015) Integrated Pest Management
(IPM) for Reducing Pesticide Residues in Crops and Natural Resources. In: New
Horizons in Insect Science: Towards Sustainable Pest Management, edited by A K
Chakravarthy, pp 397–412
Rao PP, Birthal PS, Bhagavatula S, Bantilan MCS (2010) Chickpea and Pigeonpea
Economies in Asia: Facts, Trends and Outlook. Patancheru 502 324, Andhra
Pradesh, India: International Crops Research Institute for the Semi-Arid Tropics. pp
76.
Rodriguez H, Fraga R (1999) Phosphate solubilizing bacteria and their role in plant
growth-promotion. Biotechnol Adv 17:319–339.

- 93 -
Rosen S, Skaletsky HJ (2000) Primer 3 on the WWW for general users and for biologist
programmers, In Bioinformatics Methods and Protocols: Methods in Molecular
Biology. Krawetz S and Misener S (eds) Totowa, NJ, Humana Press, pp 365−386.
Saitou N, Nei M (1987) The neighbor-joining method: a new method for reconstructing
phylogenetic trees. Mol Bio 4:406–425
Schwyn B, Neilands JB (1987) Universal chemical assay for the detection and
determination of siderophore. Annu Biochem 160:47–56
Schwyn B, Neilands JB (1987) Universal chemical assay for the detection and
determination of siderophore. Annu Biochem 160:47–56.
Shahzad SM, Khalid A, Arshad M, Khalid M, Mehboob I (2008) Integrated use of plant
growth promoting bacteria and P-enriched compost for improving growth, yield and
nodulation of chickpea Pak J Bot 40:1735–1741
Sharma M, Mangla UN, Krishnamurthy M, Vedez V, Pande S (2010) Drought and dry
root rot of chickpea. Paper presented in 5th
International Food Legumes Research
Conference (IFLRCV) and European conference on Grain Legumes. 26–30.
Siddiqui ZA (2006) PGPR: prospective biocontrol agents of plant pathogens. In: Siddiqui
ZA (ed) PGPR: biocontrol and biofertilization. Springer, The Netherlands pp, 111–
142
Singh PP, Shin YC, Park CS, Chung YR (1999) Biological control of Fusarium wilt of
cucumber by chitinolytic bacteria. Phytopathol 89:92−99.
Sreevidya M, Gopalakrishnan S, Melø TM, Simic N, Bruheim P, Sharma M, Srinivas V,
Alekhya G (2015) Biological control of Botrytis cinerea and plant growth-

- 94 -
promotion potential by Penicillium citrinum in chickpea (Cicer arietinum L.)
Biocont Sci Tech 25:739–755
Suarez-Estrella F, Vargas-Garcıa C, Lopeza MJ, Capelb C, Morenoa J (2007)
Antagonistic activity of bacteria and fungi from horticultural compost against
Fusarium oxysporum f. sp. melonis. Crop Prot 26:46–53
Suthar, S., Choyal, R., Singh, R., and Sudesh, R. (2005), ‘Stimulatory effect of
earthworm body fluid on seed germination and seedlings growth of two
legumes’,Journal of Phytological Research, 1, 219−222.
Suwan N, Boonying W, Nalumpang S (2012) Antifungal activity of soil actinomycetes to
control chilli anthracnose caused by Colletotrichum gloeosporioides. J Agricult
Technol 8:725–737.
Thompson JD, Gibsom TJ, Plewniak F, Jeanmougin F, Higgins DG (1997) The clustal X
windows interface: flexible strategies for multiple sequence alignment aided by
quality analysis tools. Nucleic Acids Res 24:4876–4882
Tinatin, D., and Nurzat, T. (2006), ‘Biodiversity of Streptomyces of high-mountainous
ecosystems of Kyrgystan and its biotechnological potential’,Antonie van
Leeuwenhoek,89, 325−328.
Tokala RK, Strap JL, Jung CM, Crawford DL, Salove MH, Deobald DL, Bailey JF,
Morra M, (2002) Novel plant-microbe rhizosphere interaction involving
Streptomyces lydicus WYEC108 and the pea plant (Pisum sativum). Appl Environ
Microbiol 68:2161−71.
Torsvik, V., Ovreas, L., and Thingstad, T.F. (2002),‘Prokaryotic diversity: magnitude,
dynamics and controlling factors’,Science, 296, 1064−1066.

- 95 -
van Overbeek LS, van Elsas JD (1995) Root exudates-induced promoter activity in
Pseudomonas fluorescens mutants in the wheat rhizosphere. Appl Environ Microbiol
61: 890–898.
van Peer, R., Niemann, G. J. and Schippers, B. 1991. Induced resistance and phytoalexin
accumulation in biological control of Fusarium wilt of carnation by Pseudomonas
sp. strain WCS417r. Phytopathology 81:728–734.
Vessey, J.K. (2003), ‘Plant growth-promoting rhizobacteria as biofertilizers’,Plant Soil,
255, 571–586.
Wakiyama, M., Tanaka, H., Yoshihara, K., Hayashi, S., and Ohta, K. (2008),‘Purification
and properties of Family-10 Endo-1,4-β-Xylanase from Penicillium citrinum and
structural organization of encoding gene’,Journal of Bioscience and Bioengineering,
105, 367─374.
Walker TS, Bais HP, Grotewold E, Vivanco JM (2003) Root exudation and rhizosphere
biology. Plant Physiol 132:44–51
Wang Y, Brown HN, Crowley DE, Szaniszlo PJ (1993) Evidence for direct utilization of
a siderophore, ferrioxamine B, in axenically grown cucumber. Plant Cell Environ
16:579–585.
Wei G, Kloepper JW, Sadik T (1991) Induction of systemic resistance of cucumber to
Colletotrichum orbiculare by selected strains of plant growth promoting
rhizobacteria. Phytopathol 81:1508–1512.
Weller DM (1988) Biological control of soil-borne plant pathogens in the rhizosphere
with bacteria. Ann Rev Phytopathol 26:379–407.

- 96 -
Youssef YA, El-Tarabily KA, Hussein AM (2001) Plectosporium tabacinum root rot
disease of white lupine (Lupinus termis Forsk.) and its biological control by
Streptomyces species. J Phytopathol 1490:29–33.