isothiocyanates induce cell cycle arrest, apoptosis and...
TRANSCRIPT
Abstract. Isothiocyanates from cruciferous vegetables havebeen identified as potent anticancer agents in animal andhuman epidemiological studies. The present study compared thebiological activities of six dietary isothiocyanates (ITCs), allyl-ITC (AITC), benzyl-ITC (BITC), phenethyl-ITC (PEITC),sulforaphane (SFN), erucin (ERN) and iberin (IBN), on cellcycle progression, apoptosis induction and mitochondrialtransmembrane potential in multidrug-resistant HL60/ADR(MRP-1-positive) and HL60/VCR (Pgp-1-positive) cells incomparison to the parent cell line HL60. Multidrug-resistantHL60/ADR and HL60/VCR cells were less sensitive than theparental HL60 cells to all the six tested ITCs, since the mediansof IC50 values were 2.8- and 2.0-fold higher. All the selectedITCs induced time- and dose-dependant G2/M arrest, with themost effective AITC (10 ÌM, 24 h) inducing 52% G2/Maccumulation in HL60 cells. Apoptosis was determined byAnnexin V-FITC staining, metabolic conversion of fluoresceindiacetate and sub-G1 population quantification. Cell cycledistribution and mitochondrial JC-1 aggregation weredetermined by flow cytometry. The effectiveness of ITCs inapoptosis induction and mitochondrial potential dissipationfollowed the order: BITC=PEITC>ERN=IBN>AITC>SFN.
This study demonstrates that dietary ITCs are mitotic inhibitorsand/or apoptosis inductors and suggests they could bechemotherapeutic agents in cells with multidrug resistancephenotypes.
Many population-based studies have highlighted the ability
of macronutrients and micronutrients in fruits and
vegetables to reduce the risk of cancer (1). Several recent
studies have focused on phytochemicals in the plant-based
diet that possess cancer preventive properties and, among
them, isothiocyanates (ITCs) are regarded as a significant
dietary factor (2). ITCs are hydrolysis products of
glucosinolates, which occur in large amounts in a variety of
cruciferous vegetables. Upon plant tissue disruption during
food processing, glucosinolates stored in the cell vacuole are
released and hydrolyzed by the enzyme myrosinase to form
ITCs (3). Additionally, human enteric microflora exhibit
myrosinase-like activity and can convert a significant
proportion of ingested unhydrolyzed glucosinolates to ITCs
(4, 5). Studies showed that exposure of cells to ITCs
resulted in their rapid accumulation at high levels in cells,
which is critical for anticarcinogenic activity (6, 7). Although
the principal driving force for cellular accumulation of ITCs
is their reaction with glutathione (GSH), covalent protein
modification has also been identified (8).
The cellular and molecular events affected or regulated
by these chemopreventive phytochemicals include inhibition
of phase I enzymes, involved in the bioactivation of
carcinogens, and induction of phase II enzymes, functional
in carcinogen detoxification (9-13). Recent studies have
undertaken to delineate the influence of ITCs on the
mechanisms of G2/M checkpoint (14-17). Another cellular
signaling pathway investigated is represented by the MAPK
network (15, 18-21) and its connections to growth inhibition,
ROS production and/or apoptotic death (12, 22-24). These
effects of ITCs on most of the cell signaling cascades are
ultimately linked to the modulation of cell cycle regulatory
3375
*Current address: School of Medicine, Health Policy and Practice,
University of East Anglia, Norwich, NR4 7TJ, U.K.
Abbreviations: ITCs, isothiocyanates; AITC, allyl ITC; BITC,
benzyl ITC; PEITC, phenylethyl ITC; SFN, sulforaphane; ERN,
erucin; IBN, iberin; Pgp-1, P-glycoprotein-1; MRP-1, multidrug
resistance associated protein-1; GSH, glutathione; MAPKs,
mitogen-activated protein kinases; ROS, reactive oxygen species.
Correspondence to: Jan Sedlak, Cancer Research Institute, Vlarska
7, 833 91 Bratislava, Slovak Republic. e-mail: [email protected]
Key Words: Isothiocyanates, multidrug resistance, cell cycle,
apoptosis, mitochondrial transmembrane potential, HL60 cell line.
ANTICANCER RESEARCH 25: 3375-3386 (2005)
Isothiocyanates Induce Cell Cycle Arrest, Apoptosisand Mitochondrial Potential Depolarization in HL-60 and Multidrug-resistant Cell Lines
JANA JAKUBIKOVA1,2, YONGPING BAO1,* and JAN SEDLAK2
1Nutrition Division, Institute of Food Research, Norwich Research Park, Norwich, NR4 7UA, U.K.;2Laboratory of Tumor Immunology, Cancer Research Institute, Vlarska 7, Bratislava, Slovak Republic
0250-7005/2005 $2.00+.40

molecules, leading to growth inhibition and/or apoptotic
death of cancer cells (25-28). In this study, the effects of
Pgp-1 and MRP-1 cell surface efflux pump expressions on
ITCs-induced cell cycle modulation were examined, using
both the parental HL60 cell line and its multidrug-resistant
HL60/ADR and HL60/VCR sub-lines. In parallel, time-
dependent changes in mitochondrial potential, sub-G1 DNA
fragmentation and appearance of apoptotic and necrotic
cells induced by ITCs were also investigated.
Materials and Methods
Reagents. AITC, BITC and PEITC were purchased from Aldrich
(Milwaukee, WI, USA). SFN was purchased from ICN Biomedical
(Basingstoke, UK). ERN and IBN were purchased from LKT
Laboratories (St. Paul, MN, USA). The Annexin V-FITC apoptosis
detection kit was obtained from BD Biosciences Pharmingen. JC-1
(5,5’,6,6’-tetrachloro-1,1’,3,3’-tetraetylbenzimidazolylcarbocyanine
iodide) was purchased from Molecular Probes (Eugene, OR,
USA). Propidium iodide (PI), fluorescein diacetate (FDA),
RNA-se A and 3-[4, 5-dimethylthiazol-2-yl]-2, 5-diphenyl
tetrazolium bromide (MTT) were obtained from Sigma Chemical
Co. (St. Louis, MO, USA).
Cell lines. The human myeloid leukemia HL60 cell line and its
multidrug-resistant sublines, HL60/ADR (MRP-1-positive) and
HL60/VCR (Pgp-1-positive), were obtained from Dr. P. Ujhazy
(Roswell Park Cancer Institute, Buffalo, NY, USA) with consent
of Dr. M. S. Center, Kansas State University (Manhattan, USA)
and were cultured in RPMI 1640 medium supplemented with 10%
fetal calf serum as suspension cell cultures. All cells were
maintained in 6-cm dishes in a humidified incubator at 37ÆC with
5% CO2.
Treatment with ITCs. Except for the cytotoxicity assay described
below, in all other analyses, 1x10⁶ cells were grown on 6-cm dishes
with 5 ml medium for 24 h and then treated with ITCs as indicated.
The cells were exposed to various concentrations of ITC for 6 h
and 24 h at 37ÆC with 5% CO2. Stock solutions of ITC were
originally dissolved in DMSO, and an equal volume of DMSO
(final concentration <0.1%) was added to the control cells.
Cell survival assay. The effect of ITCs on survival of cells was
determined by a MTT assay (29). The cells (5x10³ per well in 100 Ìl
of medium) were seeded in a 96-well culture plate for 24 h. A test
ITC was then added to each well with 100 Ìl medium. In every
experiment, each dose of ITCs was tested in quadruplicate, and the
cytotoxicity curve was constructed from at least six (0.5, 1, 2.5, 5,
10, 15 and 25 ÌM) different concentration of ITCs. After 72 h, the
cells were incubated with 50 Ìl of MTT (1 mg/ml) in fresh media
and left in the dark at 37ÆC for an additional 4 h. Thereafter, the
medium was removed, the formazan crystals were dissolved in
200 Ìl of DMSO, and the absorbance was measured at 540 nm and
690 nm in a microplate reader (Dynatech Lab Inc., Chantilly, VA,
USA). The concentration of drug that inhibited cell survival to
50% (IC50) was determined by Calcusyn software.
Annexin V-FITC/PI staining. Apoptotic cells were quantified using
the Annexin V-FITC apoptosis detection kit, according to the
manufacturer’s instructions. Briefly, the cells were collected by
centrifugation at 700 x g for 3 min and washed twice with cold
phosphate-buffered saline (PBS). Approximately 5x10⁵ cells were
resuspended in 100 Ìl of manufacturer-supplied 1 x binding buffer,
and mixed with 5 Ìl of Annexin V-FITC and 5 Ìl of PI. After
15-min incubation in the dark at room temperature, the cells were
analyzed with a Coulter Epics Altra flow cytometer.
Fluorescein diacetate (FDA)/PI staining (30). Briefly, the cells were
collected by centrifugation at 700 x g for 3 min and washed twice
with cold PBS. Approximately 5x10⁵ cells were resuspended in
400 Ìl of PBS/0.2% BSA containing 10 nM of FDA (from a 5 mM
stock in DMSO) for 30 min at room temperature. The cells were
then cooled and 4 Ìl of PI (1 mg/ml) were added. Finally, after
15 min, the stained cells were analyzed with a Coulter Epics Altra
flow cytometer.
Cytofluorimetric analysis of mitochondrial potential. Variations of
mitochondrial membrane potential in the cells during apoptosis
were studied using a JC-1 fluorescent probe. Cells with normal
polarized mitochondrial membranes emit green-orange
fluorescence, and the percentage of cells that emit only green
fluorescence is attributable to depolarized mitochondrial
membranes. For analyses of mitochondrial membrane potential
„m, the cells were collected by centrifugation at 700 x g for 3 min.
Briefly, 5x10⁵ cells were washed twice with cold PBS and incubated
in 400 Ìl of PBS/0.2% BSA containing 4 ÌM of JC-1 (from a
7.7 mM stock in DMSO) for 30 min at 37ÆC. After 30 min of
incubation in the dark at 37ÆC, the cells were analyzed using a
Coulter Epics Altra flow cytometer.
Cell cycle analysis. This assay was based on the measurement of the
DNA content of nuclei labelled with propidium iodide. For flow
cytometry analyses of DNA cell cycle profile, approximately 5x10⁵
cells were collected by centrifugation at 700 x g for 3 min. The cells
were washed twice with cold PBS and resuspended in 0.05% Triton
X-100 and 15 Ìl of RNA-se A (10 mg/ml) for 20 min at 37ÆC. The
cells were then cooled and incubated on ice for at least 10 min
before PI (50 Ìg/ml) was added. Finally, after 15 min the stained
cells were analyzed using a Coulter Epics Altra flow cytometer.
Flow cytometry measurements and data analysis. The Coulter Epics
Altra flow cytometer was equipped with 488 nm excitation laser,
and fluorescence emission was measured using a bandpass filter set
525, 575, 610, 675 nm with respective photomultipliers FL1-FL4
required for fluorochrome used as follows: Annexin V-FITC and
PI (FL1, FL2), FDA and PI (FL1, FL2), JC-1 (FL1, FL2, ratio
FL2/FL1), cell cycle (log FL2 – sub-G1, lin FL3 – DNA cell cycle
histogram, FL4 peak vs. integral for doublets discrimination).
Forward/side light scatter characteristic was used to exclude the cell
debris from the analysis. For each analysis, 1x10⁴ cells were
acquired. Data were analyzed with WinMDI version 2.7 software
(J. Trotter, Scripps Research Institute, La Jolla, CA, USA). The
cell cycle calculations were performed with MULTI-CYCLE
Software (Phoenix Flow System).
Results
Cytotoxicity of ITCs in HL-60, HL60/ADR and HL60/VCRcell lines. To assess the cytotoxic effect of ITCs, the human
ANTICANCER RESEARCH 25: 3375-3386 (2005)
3376
myeloid leukemia HL60 cell line and its multidrug-resistant
HL60/ADR and HL60/VCR sublines were treated with
different concentrations of six ITCs. The concentration of
each ITC that reduced cell survival by 50% (IC50) was
determined from cell survival plots, and the data are
presented in Table I.
Marked differences in the resistance of the three cell lines
to the various ITCs were observed. As shown in Table I,
parental HL60 cells were relatively more resistant to AITC
and SFN since the corresponding IC50 were ≥4 times higher
than those of the BITC and PEITC treatments (72 h).
Moreover, the SFN sulfide analog, ERN, and sulfoxide
analog, IBN, were approximately 2 times more effective than
SFN in HL60 cells. The lowest IC50 value was from BITC
(0.6 ÌM) in HL60 cells. Both multidrug-resistant cell lines
tested were less sensitive to the cytotoxic effect of ITCs.
Among all the tested ITCs, the least difference was seen in
SFN treatments, with IC50 values of 5.1, 8.1 and 7.3 ÌM in
HL60, HL60/ADR and HL60/VCR, respectively. Most of the
relative IC50 values were within the range of 2 – 4-fold, with
the exception of BITC (5.2-fold) being higher in multidrug-
resistant cell lines than in parental HL60 cells. In
comparison to parental HL60 cells, the overall resistance of
HL60/ADR cells to the ITC panel was higher than the
resistance of HL60/VCR cells, with median relative IC50
values of 2.8- and 2.0-fold, respectively.
Induction of apoptosis in HL-60, HL60/ADR and HL60/VCRcell lines.Annexin-V staining: To determine whether reduced cell
survival of HL60, HL60/ADR and HL60/VCR by ITCs was
associated with apoptosis or necrosis induction, cells were
treated with 5, 10 and 20 ÌM ITCs for 6 and 24 h.
Transmembrane externalization of phosphatidylserine is a
recognized early event of apoptosis, which was detected by
the widely used flow cytometry-based Annexin V staining.
Propidium iodide, which does not enter cells with intact
membranes, was used to differentiate between early
apoptotic (Annexin V+ and PI–) and late apoptotic or
necrotic cells (Annexin V+ and PI+). Flow cytometric
analysis of Annexin V staining revealed a dose-dependent
increase of both early apoptotic and late apoptotic/necrotic
cells (Figure 1A). Approximately 1/2 and 1/3 of the cells
were viable (bottom left quadrant) after 5 and 10 ÌM of
BITC treatment, respectively. Although distinctive apoptotic
changes were detectable in parental HL60 cells treated with
all ITCs tested for 6 h (Figure 1B), maximal induction was
observed after 24-h treatment (Figure 1C). Flow cytometric
analysis of the sensitive HL60 cells indicates that ITCs
treatment increased Annexin V+/PI– and Annexin V+/PI+
cells in the order of potency: BITC=PEITC>ERN=IBN>
AITC>SFN (Figure 1C). The highest concentration
(20 ÌM) of the most effective ITCs was very toxic (data not
shown), while less toxic AITC and SFN at 20 ÌM induced
55% and 20% HL60 cell death, respectively.
Annexin V staining of HL60/ADR (Figure 2A) and
HL60/VCR cells (Figure 2B) treated with ITCs for 24 h
confirmed the MTT data, that both cell lines have a more
resistant phenotype compared to parental HL60 cells
(Figure 1C), i.e. parental HL60 cells were the most sensitive
cells to ITCs, followed by HL60/VCR cells; the HL60/ADR
cells were the least sensitive cells. Aromatic ITCs (BITC,
PEITC) were the most effective compounds, and SFN was
the least effective ITC in all 3 cell lines studied.
FDA/PI staining is another method for apoptosis
monitoring. Vital cells take up the fluorogen FDA, activate
it by non-specific esterases and retain the free fluorescein
in their cytoplasm. Apoptotic and dead cells show reduced
or no uptake, and the turnover of FDA and counterstaining
with PI identifies dead cells. As shown in Figure 3A, flow
cytometric analysis of the HL60 cells treated with 5 and
10 ÌM of BITC revealed 13.0 and 22.2% apoptotic cells
Jakubikova et al: Isothiocyanates and Multidrug Resistance
3377
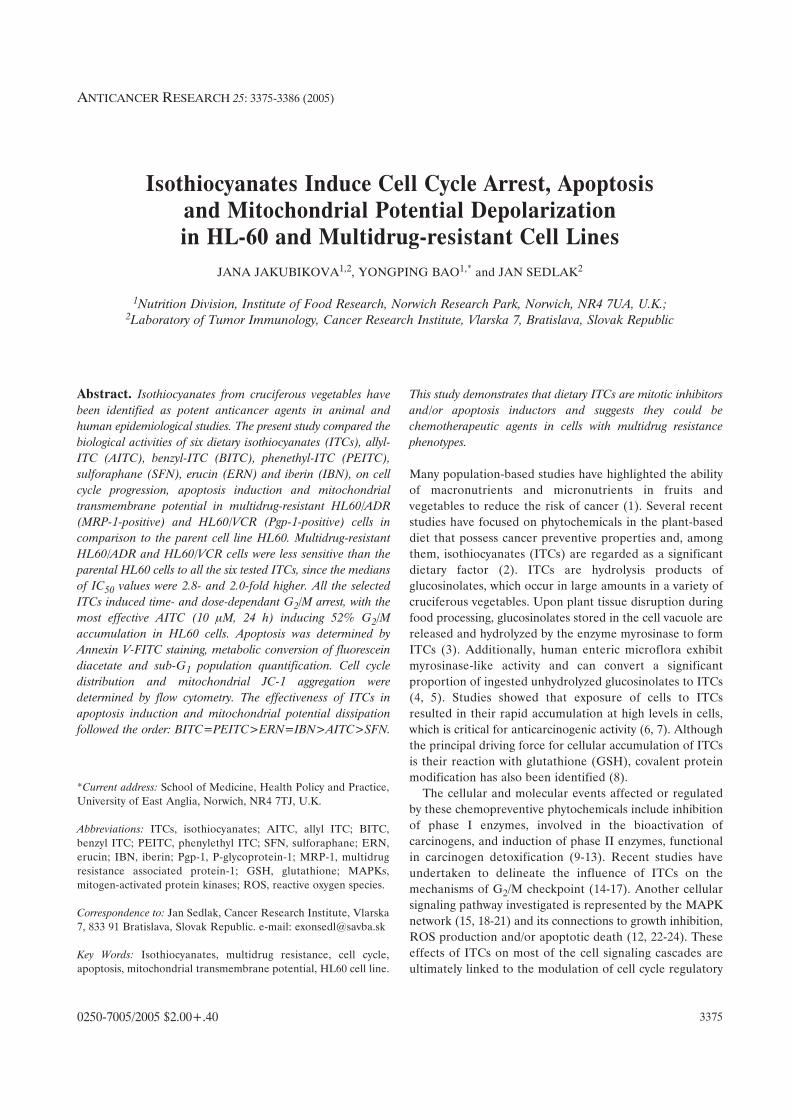
Table I. Cell survival analysis (72-h-treatment).
ITC, IC50 [ÌM]
Cell line AITC BITC PEITC SFN ERN IBN
HL60 4.0±1.7 0.6±1.1 1.0±1.9 5.1±1.3 1.9±1.2 2.3±1.8
HL60/ADR 10.5±2.5 3.1±1.4 3.8±1.8 8.1±0.9 5.6±0.8 4.0±1.9
HL60/VCR 7.8±1.9 3.1±1.2 2.1±1.6 7.3±1.3 7.6±1.2 6.3±1.9
relative IC50*
HL60/ADR 2.6 5.2 3.8 1.6 2.9 1.7
HL60/VCR 2 5.2 2.1 1.4 4 2.7
The IC50 values (the concentration of the ITCs that reduced cell survival by 50%) were determined by the MTT assay as described in "Materials
and Methods". The HL60, HL60/ADR and HL60/VCR cells were treated with various concentrations of ITCs for 72 h in 96-well plates. Each
treatment with a specific concentration of a compound was done in quadruplicate. The data presented are representative of results obtained from
three replicate experiments; and the results are means±SE. *relative IC50=IC50(HL60/ADR)/IC50(HL60) or IC50(HL60/VCR)/IC50(HL60), respectively.

ANTICANCER RESEARCH 25: 3375-3386 (2005)
3378
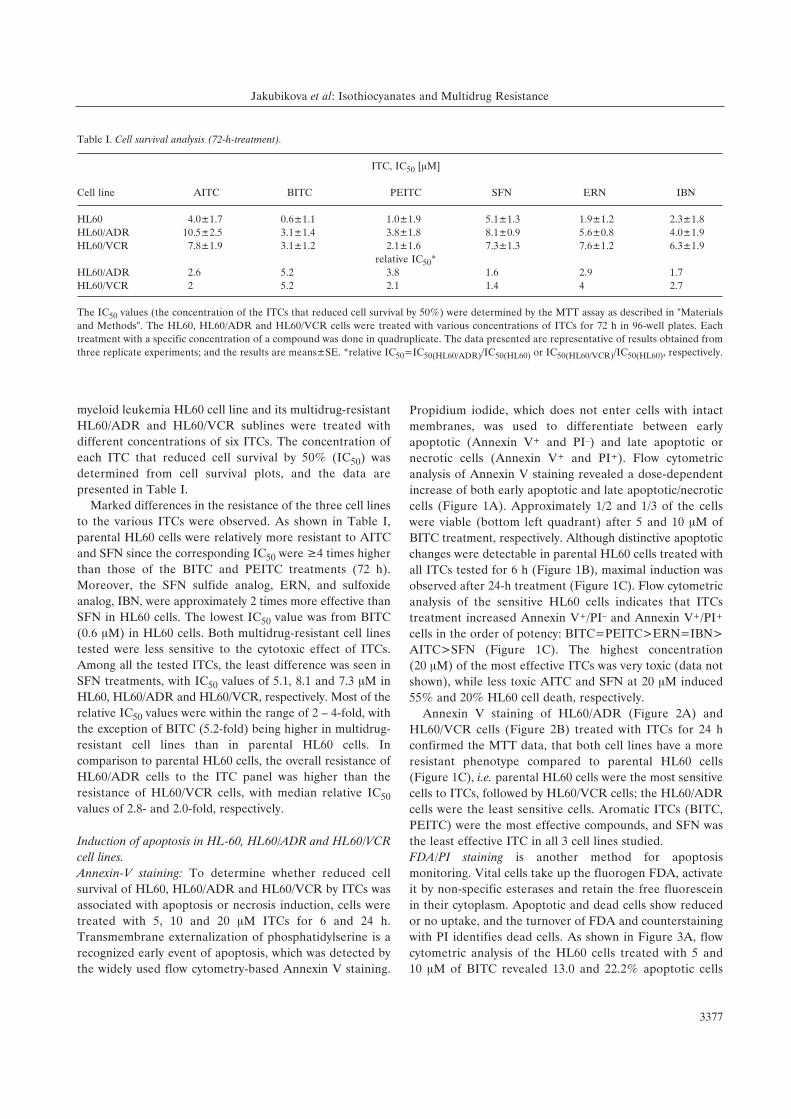
Figure 1. Effect of ITCs treatment on apoptosis and necrosis induction in HL60 cells using Annexin V/PI staining. (A) The Pgp-1-expressing HL60/VCRcells were treated with 5 and 10 ÌM of BITC and stained with Annexin V-FITC and PI. Numbers in the bottom right quadrant of each dot blot representthe percentage of cells in early apoptosis (Annexin V-FITC+/PI–) for untreated and BITC-treated cells. Numbers in the top right quadrant of each dotblot represent the percentage of cells in late apoptosis/necrosis (Annexin V-FITC+/PI+ double-positive). The data shown are representative of threeindependent experiments. The HL60 cells were exposed to either DMSO (control) cells or different concentrations of ITCs for 6 h (B) and for 24 h (C).The percentage of apoptotic (Annexin V-FITC+/PI–) and late apoptotic/necrotic (Annexin V-FITC+/PI+ double-positive) cells are shown. Each columnrepresents the mean±SE of the data obtained from three independent experiments. Significant difference from the controls, *p<0.05; **p<0.01.
Figure 2. Effect of ITCs treatment on apoptosis and necrosis induction in multidrug-resistant sublines HL60/ADR and HL60/VCR using Annexin V-FITC/PI staining. (A) The MRP1-expressing HL60/ADR cells and (B) Pgp-1-expressing HL60/VCR cells were exposed to different concentrations of ITCsfor 24 h. An equal volume of DMSO was added to the controls. Apoptotic cells were quantified by flow cytometry after staining with Annexin V-FITC andPI. Percentages of apoptotic (Annexin V-FITC+/PI–) and late apoptotic/necrotic (Annexin V-FITC+/PI+ double-positive) cells are shown. Each columnrepresents the mean±SE of the data obtained from three independent experiments. Significant difference from the controls, *p<0.05; **p<0.01.
(FDA–/PIlow - bottom left quadrant) and 42.3 and 76.2% of
dead or necrotic cells with FDA–/PIhigh characteristic
staining (top left quadrant), respectively. Both dose- and
time-dependent increases, corresponding to Annexin V/PI
staining, of FDA–/PIlow and FDA–/PIhigh positive cells were
observed in the range: BITC=PEITC>ERN=IBN>AITC
>SFN (Figure 3B and 3C). The extent of HL60/ADR cell
death (both apoptotic and necrotic) after 24-h treatment
(Figure 4A) was similar to the effects seen in parental HL60
cells after 6-h treatment (Figure 3B). The resistance of
HL60/VCR (Figure 4B) was similar to HL60/ADR cells,
with the exception of aromatic PEITC and BITC treatment.
These ITCs induced more profound apoptotic and necrotic
effects in HL60/VCR cells in comparison to HL60/ADR
cells, in which necrotic, i.e. FDA–/PIhigh positive, cells were
the dominant fraction.
DNA fragmentation: Flow cytometry was used for the
quantification of cells with sub-G1 staining patterns which
represent DNA fragmentation, a hallmark event in apoptotic
cells. As shown in Figure 5, ITCs induced dose- and time-
dependent DNA fragmentation. A higher dose (10 ÌM) of
BITC, PEITC and ERN produced 42.2, 41.2 and 36.8% cells
with sub-G1 pattern after 6-h treatment in HL60 cells.
However, in the presence of AITC, SFN or IBN, no increase
in percentage of sub-G1 cells was found. Extended treatment
for 24 h caused clear DNA fragmentation at 5 ÌM ITCs
treatment, with the exceptions of SFN and AITC (Figure
5A). Nevertheless, increased concentration of both ITCs
produced significant DNA fragmentation. In both drug-
resistant cell lines HL60/ADR and HL60/VCR treatment
with BITC, PEITC or ERN for 6 h resulted in enhanced sub-
G1 fraction, but no increase in the number of apoptotic cells
Jakubikova et al: Isothiocyanates and Multidrug Resistance
3379
Figure 3. Effect of ITCs treatment on induction of apoptosis and necrosis in parental HL60 cell line using FDA/PI staining. (A) The HL60 was treated with5 and 10 ÌM BITC and stained with FDA and PI. Numbers in the bottom right quadrant of each dot blot represent the percentage of viable cells (FDA+/PIlow)and bottom left quadrant of each dot blot represent the percentage of cells in early apoptosis (FDA–/PIlow) for untreated and BITC-treated cells. Numbers inthe top left quadrant of each dot blot represent the percentage of cells in late apoptosis/necrosis (FDA–/PIhigh). The data shown are representative of threeindependent experiments. The cells were exposed to either DMSO (control cells) or different concentrations of ITCs (B) for 6 h and (C) for 24 h. The datapresented is from the three independent experiments; and the results are means±SE. Significant difference from the controls, *p<0.05; **p<0.01.
ANTICANCER RESEARCH 25: 3375-3386 (2005)
3380
Figure 4. Effect of ITCs treatment on apoptosis and necrosis induction in multidrug-resistant sublines HL60/ADR and HL60/VCR using FDA/PI staining.(A) The MRP1-expressing HL-60/ADR cells and (B) Pgp-1-expressing HL-60/VCR cells were exposed to either DMSO (control cells) or differentconcentrations of ITCs for 24 h. Percentages of apoptotic (FDA–/PIlow) and late apoptotic/necrotic (FDA–/PIhigh) cells are shown. Each columnrepresents the mean±SE of the data obtained from three independent experiments. Significant difference from the controls, *p<0.05; **p<0.01.
Figure 5. Effect of ITCs on sub-G1-phase of the cell cycle in HL60 cells and its multidrug-resistant sublines HL60/ADR and HL60/VCR. The HL60 cellswere exposed to DMSO (control) or different concentrations of ITCs for 6 h and for 24 h. (B) The HL60/ADR and HL60/VCR cells were exposured toITCs for 24 h. The cells were collected, detergent permeabilized and stained with 50 Ìg/ml concentration of PI in the presence of RNA-se A. Thepercentage of the sub-G1 fraction was obtained from analysis of SSC versus log FL2 dot plot using WinMDI software. The representative data presentedare from the three independent experiments.
was observed following exposure to AITC, SFN or IBN (data
not shown). However, there was a significant increase in
DNA fragmentation after 24-h treatment (Figure 5B). In
comparison with parental HL60 cells, both multidrug-
resistant sublines were more resistant to ITCs treatment.
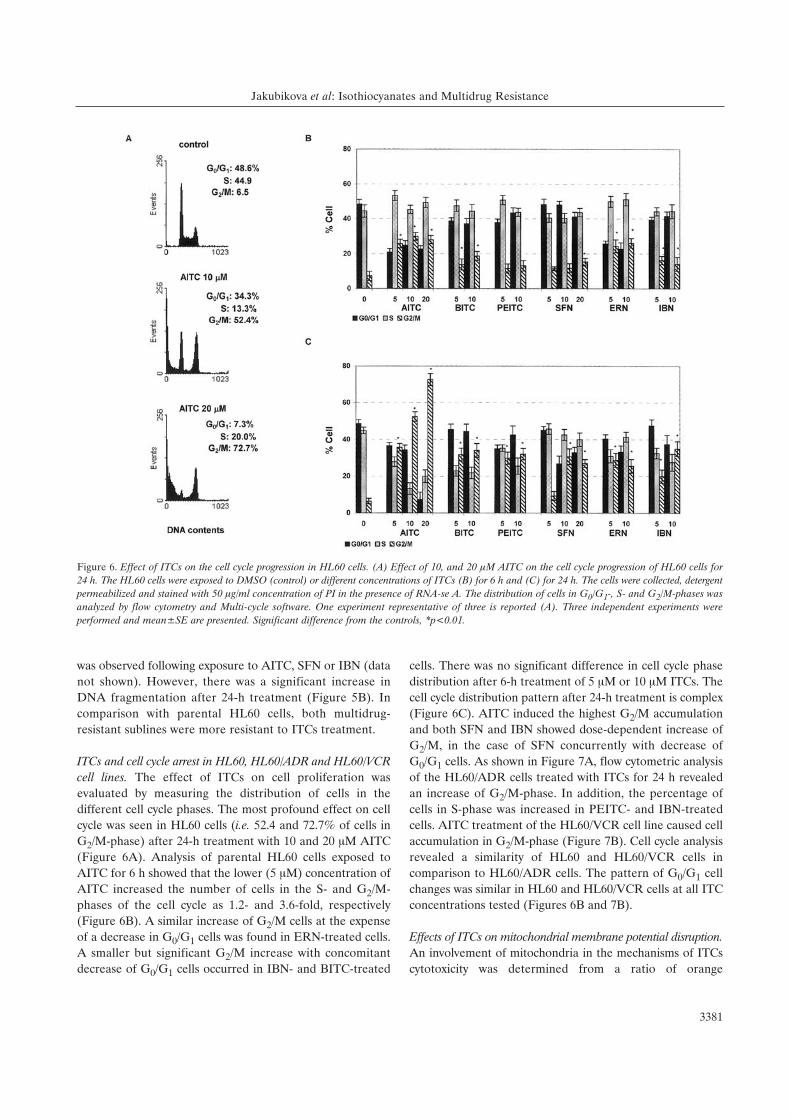
ITCs and cell cycle arrest in HL60, HL60/ADR and HL60/VCRcell lines. The effect of ITCs on cell proliferation was
evaluated by measuring the distribution of cells in the
different cell cycle phases. The most profound effect on cell
cycle was seen in HL60 cells (i.e. 52.4 and 72.7% of cells in
G2/M-phase) after 24-h treatment with 10 and 20 ÌM AITC
(Figure 6A). Analysis of parental HL60 cells exposed to
AITC for 6 h showed that the lower (5 ÌM) concentration of
AITC increased the number of cells in the S- and G2/M-
phases of the cell cycle as 1.2- and 3.6-fold, respectively
(Figure 6B). A similar increase of G2/M cells at the expense
of a decrease in G0/G1 cells was found in ERN-treated cells.
A smaller but significant G2/M increase with concomitant
decrease of G0/G1 cells occurred in IBN- and BITC-treated
cells. There was no significant difference in cell cycle phase
distribution after 6-h treatment of 5 ÌM or 10 ÌM ITCs. The
cell cycle distribution pattern after 24-h treatment is complex
(Figure 6C). AITC induced the highest G2/M accumulation
and both SFN and IBN showed dose-dependent increase of
G2/M, in the case of SFN concurrently with decrease of
G0/G1 cells. As shown in Figure 7A, flow cytometric analysis
of the HL60/ADR cells treated with ITCs for 24 h revealed
an increase of G2/M-phase. In addition, the percentage of
cells in S-phase was increased in PEITC- and IBN-treated
cells. AITC treatment of the HL60/VCR cell line caused cell
accumulation in G2/M-phase (Figure 7B). Cell cycle analysis
revealed a similarity of HL60 and HL60/VCR cells in
comparison to HL60/ADR cells. The pattern of G0/G1 cell
changes was similar in HL60 and HL60/VCR cells at all ITC
concentrations tested (Figures 6B and 7B).
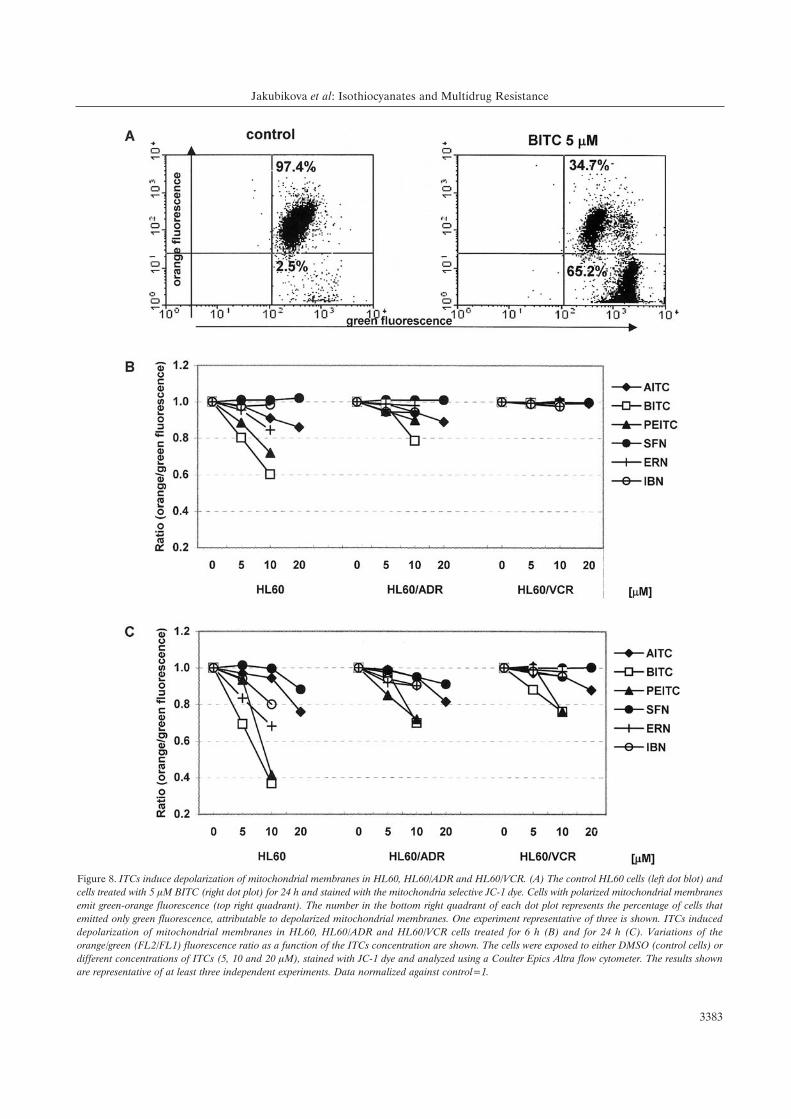
Effects of ITCs on mitochondrial membrane potential disruption.An involvement of mitochondria in the mechanisms of ITCs
cytotoxicity was determined from a ratio of orange
Jakubikova et al: Isothiocyanates and Multidrug Resistance
3381
Figure 6. Effect of ITCs on the cell cycle progression in HL60 cells. (A) Effect of 10, and 20 ÌM AITC on the cell cycle progression of HL60 cells for24 h. The HL60 cells were exposed to DMSO (control) or different concentrations of ITCs (B) for 6 h and (C) for 24 h. The cells were collected, detergentpermeabilized and stained with 50 Ìg/ml concentration of PI in the presence of RNA-se A. The distribution of cells in G0/G1-, S- and G2/M-phases wasanalyzed by flow cytometry and Multi-cycle software. One experiment representative of three is reported (A). Three independent experiments wereperformed and mean±SE are presented. Significant difference from the controls, *p<0.01.

fluorescence of JC-1 aggregates and green fluorescence of
JC-1 monomers. The aggregation of monomers is directly
correlated to mitochondrial membrane potential „m, and their
breakdown in dying cells results in increase of green
fluorescence. The representative dot plots are shown in Figure
8A, where JC-1 aggregates accumulated in control cells and
displayed high orange signal (top right quadrant). Treatment
of cells with 5 ÌM BITC for 24 h resulted in a shift to higher
green fluorescence with concomitant decrease of orange
fluorescence intensity (65.2% of cells in bottom right
quadrant). An induced decrease of „m by ITCs treatment for
6 h was clearly visible in the HL60 cell line, to a lesser extent
in the HL60/ADR cells and not observed in HL60/VCR cells
(Figure 8B). The extent of „m modulation was time- and
concentration-dependent (Figure 8C), because treatment for
24 h caused more intensive fluorescence ratio decrease in
comparison to 6-h treatment. Both aromatic ITCs (PEITC
and BITC) easily diminished „m, while SFN and AITC were
less effective. Finally, the results showed that ITCs disrupted
the mitochondrial potential of the cell lines according to the
ANTICANCER RESEARCH 25: 3375-3386 (2005)
3382
Figure 7. Effect of ITCs on the cell cycle progression in multidrug-resistant sublines HL60/ADR and HL60/VCR. (A) The MRP1-expressing HL60/ADRcells and (B) Pgp-1-expressing HL60/VCR cells were exposed to DMSO (control) or different concentrations of ITCs for 24 h. The cells were collected,detergent permeabilized and stained with 50 Ìg/ml concentration of PI in the presence of RNA-se A. The distribution of cells in G0/G1-, S- and G2/M-phases was analyzed by flow cytometry and Multi-cycle software. Three independent experiments were performed and mean±SE are presented. Significantdifference from the controls, *p<0.01.
Jakubikova et al: Isothiocyanates and Multidrug Resistance
3383
Figure 8. ITCs induce depolarization of mitochondrial membranes in HL60, HL60/ADR and HL60/VCR. (A) The control HL60 cells (left dot blot) andcells treated with 5 ÌM BITC (right dot plot) for 24 h and stained with the mitochondria selective JC-1 dye. Cells with polarized mitochondrial membranesemit green-orange fluorescence (top right quadrant). The number in the bottom right quadrant of each dot plot represents the percentage of cells thatemitted only green fluorescence, attributable to depolarized mitochondrial membranes. One experiment representative of three is shown. ITCs induceddepolarization of mitochondrial membranes in HL60, HL60/ADR and HL60/VCR cells treated for 6 h (B) and for 24 h (C). Variations of theorange/green (FL2/FL1) fluorescence ratio as a function of the ITCs concentration are shown. The cells were exposed to either DMSO (control cells) ordifferent concentrations of ITCs (5, 10 and 20 ÌM), stained with JC-1 dye and analyzed using a Coulter Epics Altra flow cytometer. The results shownare representative of at least three independent experiments. Data normalized against control=1.

order of susceptibility: HL60>HL60/ADR>HL60/VCR and
the effectiveness of ITCs followed the order:
BITC=PEITC>ERN=IBN>AITC >SFN, the same order in
observed potency in apoptosis induction.
Discussion
It is widely accepted that an imbalance between cell death
and proliferation may result in tumor formation. Moreover,
that tumor cells attempt to evade apoptosis can play a
significant role in their resistance to treatment. In this study,
the effects of six ITCs were studied, including the extent of
cell cycle alterations, apoptosis induction and mitochondrial
potential modulation. Three different methods, Annexin V
staining, accumulation and metabolic conversion of FDA
and appearance of cells with a sub-G1 population, were used
to confirm apoptotic cell death. Although Annexin-V and
FDA staining measures different cellular events, the
percentage of apoptotic and necrotic cells were similar
independent of the method used. Generation of the sub-G1
population is a later event in cell death, thus a lower
number of cells in this phase were found at similar times.
Short, 6-h treatment of parental HL60 cells was sufficient
to induce apoptosis at the ITCs concentration used.
Extension of the treatment for 24 h increased the
percentage of cells in late apoptotic/necrotic phase. The
IC50 values of particular ITCs for both multidrug-resistant
cell lines were at least 4-times higher in comparison to the
IC50 value for parental HL60 cells. Such an increase of IC50
values for ITCs in multidrug-resistant cells is consistent with
recently published data (28). This relatively small difference
of IC50 suggests the possible involvement of MRP-1 or Pgp-1
in resistance to ITCs since, in our hands, the resistance to
paclitaxel or daunomycin was 2-3 logs higher for
HL60/ADR and HL60/VCR cells in comparison to parental
HL60 cells (31). It is known that MRP proteins transport
drugs, either unmodified or conjugated, to anionic ligands
such as GSH, glucuronate, or sulphate, while
P-glycoproteins are thought to transport drugs in an
unmodified form (32, 33). Initial cellular accumulation in
the order AITC<PEITC<BITC, which did not exceed
factor 4 between the highest concentration in parental cells
and the lowest concentration in resistant cells, was followed
by transporter-mediated export of ITCs in the form of
dithiocarbamates (34). These findings are consistent with
our survival IC50 data, Annexin V and FDA staining, DNA
fragmentation and resulting increase of cell resistance to all
ITCs tested in the order: HL60<HL60/VCR<HL60/ADR.
Recent data have suggested that at least PEITC and BITC
are not substrates for Pgp-1, but that their glutathione
conjugates are probably substrates of MRP-1 (35).
There are several reports that ITCs induce cell cycle arrest
in the G2/M-phase, which is correlated with an increased
expression of cyclins A and B1, followed by cell death. On
the other hand, treatment of the prostate cell line LNCaP
and phytohemagglutinin-stimulated human T lymphocytes
resulted in G0/G1 cell phase arrest (18, 25). A significant
number of possible molecular targets of ITCs treatment have
been proposed, and the list of potential signaling pathway
nodules involves Chk2, cdc2, cyclin B1, cdc25B and cdc25C
(36, 37), p21Cip1/Waf1 and p27Kip1 (38, 39), Bax and Bcl2
levels (16), Nrf2 (40, 41), GADD gene members (42),
tubulin polymerization (15) and histone deacetylase
inhibition (43). Flow cytometric study of parental HL60 cells
and multidrug-resistant HL60/ADR and HL60/VCR cell
lines showed significant accumulation of cells in the G2/M-
phase. We observed a dose-dependent increase of G2/M
content after ITCs treatment, with the exception of high
concentrations of aromatic ITCs. This treatment (20 ÌM)
induced early damage of the cell membrane, allowing
propidium iodide permeation, and increased both forward
and side scatters in cytometric dot plots and dissipation of
mitochondrial potential; a typical pattern of toxic cell attack
(data not shown). Despite aliphatic ITCs being less effective
in apoptosis induction, they were equally potent or more
potent compounds (AITC) relative to aromatic ITC in the
induction of G2/M block. In contrast to Zhang et al. (28), we
did not observe AITC-induced G0/G1 block in parental
HL60 cells. In our hands, short, 6-h AITC treatment
increased the number of G2/M-arrested cells, an effect that
was extended more markedly after 24 h treatment in
parental and both resistant cell lines. This is in accordance
with recently published data (24). Our results showed that,
after accumulation in the G2/M cell cycle phase, the
proportion of cells with sub-G1 DNA content started to
grow. The induction of cell cycle arrest is not a separate
event; rather the cell cycle arrest leads to apoptotic cell
death. Indeed, in this study, apoptotic cell death is preceded
by an arrest of the cell cycle and accumulation of cells in the
G2/M-phase at the expense of the G0/G1-phase.
Analysis of the effect of ITCs in the human leukemia cell
lines revealed that these agents induced changes in
mitochondrial potential leading to progressive depolarization
culminating in apoptosis (12, 44, 45). Disruption of normal
„m presumably will compromise ATP synthesis in cells and
may be responsible for caspase-9 activation, which is
mediated by mitochondria (46). The parental HL60 cells
treated with ITCs for 24 h lost mitochondrial potential. The
same effect was observed in multidrug-resistant HL60/ADR
cells. On the other hand, no significant changes were visible
in HL60/VCR cells treated for 6 h. Although the JC-1
mitochondrial probe is a substrate for Pgp-1 protein,
extended treatment for 24 h allowed us to observe the
mitochondrial potential changes. Probably, a limited
availability of ATP in late apoptotic/necrotic cells is
responsible for the lower activity of Pgp-1 protein.
ANTICANCER RESEARCH 25: 3375-3386 (2005)
3384
Finally, the relative potency of ITCs to decrease
mitochondrial potential followed the same order as their
ability to induce apoptosis, as measured by Annexin V
staining: BITC=PEITC>ERN=IBN>AITC>SFN for both
parental and multidrug-resistant cell lines. ITCs, particularly
sulforaphane, are perceived as promising compounds
effective in Helicobacter pylori eradication (47), in protecting
the retina from photoreceptors against oxidative stress (48)
and in cancer prevention (all ITCs) (49-52). ITCs possess
mitotic inhibitor and/or apoptosis inducer capabilities,
together with ability to induce detoxification enzymes, thus
indicating potential applications as chemotherapeutic agents
in cancer treatment. Such effects might be quite relevant
and merit further study.
Acknowledgements
This work was supported in part by the Biotechnology and
Biological Sciences Research Council, UK (Y.B.), the EC Marie
Curie Training Site Fellowship (QLK5-1999-50510) (J.J.), the
Slovak Governmental Research and Development sub-programme
(food - quality and safety No. 2003SP270280E010280E01) and the
Slovak Grant Agency VEGA (No. 2/2094). We thank Ms. Margita
Sulikova, Mr. Geoff Plumb and Mr. Jim Bacon for their technical
assistance.
References
1 Steinmetz KA and Potter JD: Vegetables, fruit and cancer
prevention: a review. J Am Diet Assoc 96: 1027-1039, 1996.
2 Keck AS and Finley JW: Cruciferous vegetables: cancer
protective mechanisms of glucosinolate hydrolysis products and
selenium. Integr Cancer Ther 3: 5-12, 2004.
3 Fenwick GR, Heaney RK and Mullin WJ: Glucosinolates and
their breakdown products in food and food plants. Crit Rev
Food Sci Nutr 18: 123-201, 1983.
4 Getahun SM and Chung FL: Conversion of glucosinolates to
isothiocyanates in humans after ingestion of cooked watercress.
Cancer Epidemiol Biomarkers Prev 8: 447-451, 1999.
5 Shapiro TA, Fahey JW, Wade KL, Stephenson KK and Talalay
P: Human metabolism and excretion of cancer chemoprotective
glucosinolates and isothiocyanates of cruciferous vegetables.
Cancer Epidemiol Biomarkers Prev 7: 1091-1100, 1998.
6 Zhang Y: Role of glutathione in the accumulation of
anticarcinogenic isothiocyanates and their glutathione
conjugates by murine hepatoma cells. Carcinogenesis 21: 1175-
1182, 2000.
7 Zhang Y: Molecular mechanism of rapid cellular accumulation
of anticarcinogenic isothiocyanates. Carcinogenesis 22: 425-
431, 2001.
8 Goosen TC, Kent UM, Brand L and Hollenberg PF:
Inactivation of cytochrome P450 2B1 by benzyl isothiocyanate,
a chemopreventative agent from cruciferous vegetables. Chem
Res Toxicol 13: 1349-1359, 2000.
9 Hwang ES and Jeffery EH: Effects of different processing
methods on induction of quinone reductase by dietary broccoli
in rats. J Med Food 7: 95-99, 2004.
10 Morris CR, Chen SC, Zhou L, Schopfer LM, Ding X and
Mirvish SS: Inhibition by allyl sulfides and phenethyl
isothiocyanate of methyl-n-pentylnitrosamine depentylation by
rat esophageal microsomes, human and rat CYP2E1 and rat
CYP2A3. Nutr Cancer 48: 54-63, 2004.
11 Munday R and Munday CM: Induction of phase II
detoxification enzymes in rats by plant-derived
isothiocyanates: comparison of allyl isothiocyanate with
sulforaphane and related compounds. J Agric Food Chem 52:
1867-1871, 2004.
12 Nakamura Y, Ohigashi H, Masuda S, Murakami A, Morimitsu
Y, Kawamoto Y, Osawa T, Imagawa M and Uchida K: Redox
regulation of glutathione S-transferase induction by benzyl
isothiocyanate: correlation of enzyme induction with the
formation of reactive oxygen intermediates. Cancer Res 60:
219-225, 2000.
13 Svehlikova V, Wang S, Jakubikova J, Williamson G, Mithen R
and Bao Y: Interactions between sulforaphane and apigenin in
the induction of UGT1A1 and GSTA1 in CaCo-2 cells.
Carcinogenesis 25: 1629-1637, 2004.
14 Fimognari C, Nusse M, Berti F, Iori R, Cantelli-Forti G and
Hrelia P: Cyclin D3 and p53 mediate sulforaphane-induced cell
cycle delay and apoptosis in non-transformed human T
lymphocytes. Cell Mol Life Sci 59: 2004-2012, 2002.
15 Jackson SJ and Singletary KW: Sulforaphane: a naturally
occurring mammary carcinoma mitotic inhibitor, which
disrupts tubulin polymerization. Carcinogenesis 25: 219-227,
2004.
16 Miyoshi N, Uchida K, Osawa T and Nakamura Y: A link
between benzyl isothiocyanate-induced cell cycle arrest and
apoptosis: involvement of mitogen-activated protein kinases
in the Bcl-2 phosphorylation. Cancer Res 64: 2134-2142,
2004.
17 Parnaud G, Li P, Cassar G, Rouimi P, Tulliez J, Combaret L
and Gamet-Payrastre L: Mechanism of sulforaphane-induced
cell cycle arrest and apoptosis in human colon cancer cells. Nutr
Cancer 48: 198-206, 2004.
18 Fimognari C, Nusse M, Berti F, Iori R, Cantelli-Forti G and
Hrelia P: Sulforaphane modulates cell cycle and apoptosis in
transformed and non-transformed human T lymphocytes. Ann
NY Acad Sci 1010: 393-398, 2003.
19 Hu R, Kim BR, Chen C, Hebbar V and Kong AN: The roles of
JNK and apoptotic signaling pathways in PEITC-mediated
responses in human HT-29 colon adenocarcinoma cells.
Carcinogenesis 24: 1361-1367, 2003.
20 Xiao D and Singh SV: Phenethyl isothiocyanate-induced
apoptosis in p53-deficient PC-3 human prostate cancer cell line
is mediated by extracellular signal-regulated kinases. Cancer
Res 62: 3615-3619, 2002.
21 Yu R, Lei W, Mandlekar S, Weber MJ, Der CJ, Wu J and Kong
AT: Role of a mitogen-activated protein kinase pathway in the
induction of phase II detoxifying enzymes by chemicals. J Biol
Chem 274: 27545-27552, 1999.
22 Rose P, Whiteman M, Huang SH, Halliwell B and Ong CN:
beta-Phenylethyl isothiocyanate-mediated apoptosis in
hepatoma HepG2 cells. Cell Mol Life Sci 60: 1489-1503, 2003.
23 Singh AV, Xiao D, Lew KL, Dhir R and Singh SV:
Sulforaphane induces caspase-mediated apoptosis in cultured
PC-3 human prostate cancer cells and retards growth of PC-3
xenografts in vivo. Carcinogenesis 25: 83-90, 2004.
Jakubikova et al: Isothiocyanates and Multidrug Resistance
3385
24 Xiao D, Srivastava SK, Lew KL, Zeng Y, Hershberger P, Johnson
CS, Trump DL and Singh SV: Allyl isothiocyanate, a constituent
of cruciferous vegetables, inhibits proliferation of human prostate
cancer cells by causing G2/M arrest and inducing apoptosis.
Carcinogenesis 24: 891-897, 2003.
25 Chiao JW, Chung FL, Kancherla R, Ahmed T, Mittelman A and
Conaway CC: Sulforaphane and its metabolite mediate growth
arrest and apoptosis in human prostate cancer cells. Int J Oncol
20: 631-636, 2002.
26 Fimognari C, Nusse M, Cesari R, Iori R, Cantelli-Forti G and
Hrelia P: Growth inhibition, cell-cycle arrest and apoptosis in
human T-cell leukemia by the isothiocyanate sulforaphane.
Carcinogenesis 23: 581-586, 2002.
27 Gamet-Payrastre L, Li P, Lumeau S, Cassar G, Dupont MA,
Chevolleau S, Gasc N, Tulliez J and Terce F: Sulforaphane, a
naturally occurring isothiocyanate, induces cell cycle arrest and
apoptosis in HT29 human colon cancer cells. Cancer Res 60:
1426-1433, 2000.
28 Zhang Y, Tang L and Gonzalez V: Selected isothiocyanates
rapidly induce growth inhibition of cancer cells. Mol Cancer Ther
2: 1045-1052, 2003.
29 Mosmann T: Rapid colorimetric assay for cellular growth and
survival: application to proliferation and cytotoxicity assays. J
Immunol Methods 65: 55-63, 1983.
30 Bartkowiak D, Hogner S, Baust H, Nothdurft W and Rottinger
EM: Comparative analysis of apoptosis in HL60 detected by
annexin-V and fluorescein-diacetate. Cytometry 37: 191-196, 1999.
31 Sedlak J, Hunakova L, Chorvath M, Sulikova M, Novotny L,
Boljesikova E, Zeillinger R and Chorvath B: Resistance of
human multidrug-resistant neoplastic cell lines to paclitaxel-
induced-radiosensitization is reduced by the non-
immunosuppressive cyclosporine analog SDZ PSC 833.
Anticancer Res 18: 3099-3105, 1998.
32 Kool M, van der Linden M, de Haas M, Scheffer GL, de Vree
JM, Smith AJ, Jansen G, Peters GJ, Ponne N, Scheper RJ,
Elferink RP, Baas F and Borst P: MRP3, an organic anion
transporter able to transport anti-cancer drugs. Proc Natl Acad
Sci USA 96: 6914-6919, 1999.
33 Lautier D, Canitrot Y, Deeley RG and Cole SP: Multidrug
resistance mediated by the multidrug resistance protein (MRP)
gene. Biochem Pharmacol 52: 967-977, 1996.
34 Callaway EC, Zhang Y, Chew W and Chow HH: Cellular
accumulation of dietary anticarcinogenic isothiocyanates is
followed by transporter-mediated export as dithiocarbamates.
Cancer Lett 204: 23-31, 2004.
35 Hu K and Morris ME: Effects of benzyl-, phenethyl- and alpha-
naphthyl isothiocyanates on P-glycoprotein- and MRP1-mediated
transport. J Pharm Sci 93: 1901-1911, 2004.
36 Singh SV, Herman-Antosiewicz A, Singh AV, Lew KL, Srivastava
SK, Kamath R, Brown KD, Zhang L and Baskaran R:
Sulforaphane-induced G2/M phase cell cycle arrest involves
checkpoint kinase 2-mediated phosphorylation of cell division
cycle 25C. J Biol Chem 279: 25813-25822, 2004.
37 Srivastava SK and Singh SV: Cell cycle arrest, apoptosis induction
and inhibition of nuclear factor kappa B activation in anti-
proliferative activity of benzyl isothiocyanate against human
pancreatic cancer cells. Carcinogenesis 25: 1701-1709, 2004.
38 Chiao JW, Wu H, Ramaswamy G, Conaway CC, Chung FL,
Wang L and Liu D: Ingestion of an isothiocyanate metabolite
from cruciferous vegetables inhibits growth of human prostate
cancer cell xenografts by apoptosis and cell cycle arrest.
Carcinogenesis 25: 1403-1408, 2004.
39 Wang L, Liu D, Ahmed T, Chung FL, Conaway C and Chiao
JW: Targeting cell cycle machinery as a molecular mechanism
of sulforaphane in prostate cancer prevention. Int J Oncol 24:
187-192, 2004.
40 Keum YS, Owuor ED, Kim BR, Hu R and Kong AN:
Involvement of Nrf2 and JNK1 in the activation of antioxidant
responsive element (ARE) by chemopreventive agent phenethyl
isothiocyanate (PEITC). Pharm Res 20: 1351-1356, 2003.
41 Zhang DD and Hannink M: Distinct cysteine residues in Keap1
are required for Keap1-dependent ubiquitination of Nrf2 and
for stabilization of Nrf2 by chemopreventive agents and
oxidative stress. Mol Cell Biol 23: 8137-8151, 2003.
42 Powolny A, Takahashi K, Hopkins RG and Loo G: Induction
of GADD gene expression by phenethylisothiocyanate in
human colon adenocarcinoma cells. J Cell Biochem 90: 1128-
1139, 2003.
43 Myzak MC, Karplus PA, Chung FL and Dashwood RH: A novel
mechanism of chemoprotection by sulforaphane: inhibition of
histone deacetylase. Cancer Res 64: 5767-5774, 2004.
44 Nakamura Y, Kawakami M, Yoshihiro A, Miyoshi N,
Ohigashi H, Kawai K, Osawa T and Uchida K: Involvement
of the mitochondrial death pathway in chemopreventive
benzyl isothiocyanate-induced apoptosis. J Biol Chem 277:
8492-8499, 2002.
45 Susin SA, Lorenzo HK, Zamzami N, Marzo I, Brenner C,
Larochette N, Prevost MC, Alzari PM and Kroemer G:
Mitochondrial release of caspase-2 and -9 during the apoptotic
process. J Exp Med 189: 381-394, 1999.
46 Liu X, Kim CN, Yang J, Jemmerson R and Wang X: Induction
of apoptotic program in cell-free extracts: requirement for
dATP and cytochrome c. Cell 86: 147-157, 1996.
47 Haristoy X, Angioi-Duprez K, Duprez A and Lozniewski A:
Efficacy of sulforaphane in eradicating Helicobacter pylori in
human gastric xenografts implanted in nude mice. Antimicrob
Agents Chemother 47: 3982-3984, 2003.
48 Gao X and Talalay P: Induction of phase 2 genes by sulforaphane
protects retinal pigment epithelial cells against photooxidative
damage. Proc Natl Acad Sci USA 101: 10446-10451, 2004.
49 Weisburger JH: Antimutagens, anticarcinogens and effective
worldwide cancer prevention. J Environ Pathol Toxicol Oncol
18: 85-93, 1999.
50 Thornalley PJ: Isothiocyanates: mechanism of cancer chemo-
preventive action. Anticancer Drugs 13: 331-338, 2002.
51 Conaway CC, Yang YM and Chung FL: Isothiocyanates as cancer
chemopreventive agents: their biological activities and metabolism
in rodents and humans. Curr Drug Metab 3: 233-255, 2002.
52 Keck AS and Finley JW: Cruciferous vegetables: cancer
protective mechanisms of glucosinolate hydrolysis products and
selenium. Integr Cancer Ther 3: 5-12, 2004.
Received February 25, 2005Accepted May 30, 2005
ANTICANCER RESEARCH 25: 3375-3386 (2005)
3386