isprs journal of photogrammetry and remote sensing moura et al. 2017... · tortini et al., 2015)...
TRANSCRIPT
ISPRS Journal of Photogrammetry and Remote Sensing 131 (2017) 52–64
Contents lists available at ScienceDirect
ISPRS Journal of Photogrammetry and Remote Sensing
journal homepage: www.elsevier .com/ locate/ isprs jprs
Spectral analysis of amazon canopy phenology during the dry seasonusing a tower hyperspectral camera and modis observations
http://dx.doi.org/10.1016/j.isprsjprs.2017.07.0060924-2716/� 2017 International Society for Photogrammetry and Remote Sensing, Inc. (ISPRS). Published by Elsevier B.V. All rights reserved.
⇑ Corresponding author.E-mail address: [email protected] (Y.M. de Moura).
1 In Memoriam.
Yhasmin Mendes de Moura a,⇑, Lênio Soares Galvão a, Thomas Hilker b,1, Jin Wu c,d, Scott Saleska c,Cibele Hummel do Amaral e, Bruce Walker Nelson f, Aline Pontes Lopes a, Kenia K. Wiedeman c,g,Neill Prohaska c, Raimundo Cosme de Oliveira h, Carolyne Bueno Machado a, Luiz E.O.C. Aragão a,i
a Instituto Nacional de Pesquisas Espaciais (INPE), Avenida dos Astronautas, 1758, São José dos Campos, SP CEP 12245-970, BrazilbUniversity of Southampton, Department of Geography and Environment, Southampton SO17 1BJ, United KingdomcUniversity of Arizona, Department of Ecology and Evolutionary Biology, Tucson, AZ 85721, United Statesd Environmental and Climate Science Department, Brookhaven National Laboratory, Upton, NY, 11973, United StateseUniversidade Federal de Viçosa, MG 36570-900, Brazilf Instituto Nacional de Pesquisa da Amazônia (INPA), Departamento de Dinâmica Ambiental, Av. André Araújo, 2936, Manaus, AM 69067-375, Brazilg John A. Paulson School of Engineering and Applied Sciences, Harvard University, Cambridge, MA 02138, United Statesh Empresa Brasileira de Pesquisa Agropecuária (EMBRAPA), Centro de Pesquisa Agroflorestal da Amazônia Oriental, 66095100 Belém, PA, BraziliCollege of of Life and Environmental Sciences, University of Exeter, EX4 4RJ, United Kingdom
a r t i c l e i n f o
Article history:Received 4 April 2017Received in revised form 8 June 2017Accepted 15 July 2017
Keywords:PhenologyHyperspectral remote sensingTropical speciesLeaf flushAmazonSeasonalityDry season
a b s t r a c t
The association between spectral reflectance and canopy processes remains challenging for quantifyinglarge-scale canopy phenological cycles in tropical forests. In this study, we used a tower-mounted hyper-spectral camera in an eastern Amazon forest to assess how canopy spectral signals of three species arelinked with phenological processes in the 2012 dry season. We explored different approaches to disentan-gle the spectral components of canopy phenology processes and analyze their variations over time using 17images acquired by the camera. The methods included linear spectral mixture analysis (SMA); principalcomponent analysis (PCA); continuum removal (CR); and first-order derivative analysis. In addition, threevegetation indices potentially sensitive to leaf flushing, leaf loss and leaf area index (LAI) were calculated:the Enhanced Vegetation Index (EVI), Normalized Difference Vegetation Index (NDVI) and the entitledGreen-Red Normalized Difference (GRND) index.We inspected also the consistency of the camera observa-tions using Moderate Resolution Imaging Spectroradiometer (MODIS) and available phenological data onnew leaf production and LAI of young, mature and old leaves simulated by a leaf demography-ontogenymodel. The results showed a diversity of phenological responses during the 2012 dry season with relatedchanges in canopy structure and greenness values. Because of the differences in timing and intensity of leafflushing and leaf shedding, Erisma uncinatum,Manilkara huberi and Chamaecrista xinguensis presented dif-ferent green vegetation (GV) and non-photosynthetic vegetation (NPV) SMA fractions; distinct PCA scores;changes in depth, width and area of the 681-nm chlorophyll absorption band; and variations over time inthe EVI, GRND and NDVI. At the end of dry season, GV increased for Erisma uncinatum, while NPV increasedfor Chamaecrista xinguensis. For Manilkara huberi, the NPV first increased in the beginning of August andthen decreased toward September with new foliage. Variations in red-edge position were not statisticallysignificant between the species and across dates at the 95% confidence level. The camera datawere affectedby view-illumination effects, which reduced the SMA shade fraction over time.WhenMODIS datawere cor-rected for these effects using the Multi-Angle Implementation of Atmospheric Correction Algorithm(MAIAC), we observed an EVI increase toward September that closely tracked the modeled LAI of matureleaves (3–5 months). Compared to the EVI, the GRND was a better indicator of leaf flushing because themodeled production of new leaves peaked in August and then declined in September following theGRND closely. While the EVI was more related to changes in mature leaf area, the GRND was more associ-ated with new leaf flushing.� 2017 International Society for Photogrammetry and Remote Sensing, Inc. (ISPRS). Published by Elsevier
B.V. All rights reserved.

Y.M. de Moura et al. / ISPRS Journal of Photogrammetry and Remote Sensing 131 (2017) 52–64 53
1. Introduction
Terrestrial ecosystems regulate carbon-climate feedbacks bycontrolling fluxes of mass and energy between the biosphere andthe atmosphere (Bonan et al., 2003). In turn, changes of the bio-sphere’s carbon balance (i.e. uptake or losses) affect the climatesystem (Friedlingstein et al., 2006; Frank et al., 2015). However,detailed knowledge of the processes and mechanisms of the carboncycle is still lacking. A better understanding of these feedbacks isurgently needed to reduce climate model uncertainties and toallow more accurate predictions of vegetation changes underfuture climate scenarios. This is particularly important in the trop-ics, where high plant productivity sustains one of the largestremaining terrestrial carbon pools on the planet (Hilker et al.,2014; Wu et al., 2016a). The ongoing exposure of tropical ecosys-tems to anthropogenic pressures and climatic changes have ledto substantial concerns about the future of tropical forests as acomponent of the global climate system (Cox et al., 2004; Malhiet al., 2008). While field experiments, networks of flux-towersand remote sensing based studies have improved our understand-ing on the sensitivity of forests to climate in temperate regions(e.g., D’Odorico et al., 2015; Gamon et al., 2006; Hilker et al.,2010; Richardson et al., 2007, 2012; Yang et al., 2014), this issueis far less understood in the tropics.
Quantifying shifts in phenological cycles, which influences thetiming of plant maximum photosynthetic activity, is critical fordescribing tropical ecosystem metabolism and environmental con-trols (Cleland et al., 2007; Richardson et al., 2012; Wu et al.,2016a). However, phenological observations in tropical regionshave proven challenging (Samanta et al., 2010) and so far havebeen unable to produce unequivocal evidence for the constraintsof vegetation growth in the tropics (Huete et al., 2006; Lee et al.,2013; Borchert et al., 2015; Guan et al., 2015; Bi et al., 2015).Despite the uncertainty associated with the mean seasonality ofvegetative growth derived from satellite remote sensing, it is evenmore controversial when using these remote sensing observationsto explore tropical forest response to inter-annual droughts(Myneni et al., 2007; Morton et al., 2014; Saleska et al., 2016). Anincrease in greenness (higher Enhanced Vegetation Index - EVI)for the 2005 drought was reported by Saleska et al. (2007),whereas a widespread decline in photosynthetic activity (lowerEVI) for the 2010 drought was observed by Xu et al. (2011). Whileremote sensing approaches have shown conflicting results, field-based studies indicate that moisture stress in tropical forests dueto extreme events of droughts reduces aboveground biomassgrowth and increases tree mortality, altering carbon stocks andbiodiversity (Phillips et al., 2009).
To date, tropical leaf phenology remains one of the most chal-lenging components to parameterize in ecosystem models (Aroraand Boer, 2005). Part of the observational uncertainties has beenlinked to poor quality remote sensing data because of high atmo-spheric aerosol loadings and deficiencies in cloud detection andscreening (Samanta et al., 2010; Hilker et al., 2014). Progress hasbeen made with the development of more robust atmospheric cor-rection methods (e.g. Multi-Angle Implementation of AtmosphericCorrection - MAIAC) (Lyapustin et al., 2011), or the use of higherspatial resolution imagery (Zelazowski et al., 2011). However, ascale mismatch remains between moderate to coarse spatial reso-lution satellite imagery on one hand, and a sparse network of fieldobservations on the other.
One possible approach to address this mismatch and to helpfurther our understanding of tropical phenology is to use observa-tions from tower-based cameras to consistently link optical signalswith biophysical processes. Near surface, camera-based phenologycan help bridging the spatial mismatch existing between field and
satellite data by using optical principles similar to those used byspaceborne optical sensors, but still allowing interpretations simi-lar to those made at the plot level.
In temperate regions, tower-based optical remote sensing hasbeen used to establish frequent observations of plant phenology(Richardson et al., 2007), to link them to biophysical processes ofphotosynthesis (Hilker et al., 2010), and to scale-up field observa-tions (D’Odorico et al., 2015). Perhaps most prominently, the phe-nocam network (Richardson et al., 2007) provides a continental-scale phenological observatory, spanning a range of biogeoclimaticzones in North America. Other networks (Gamon et al., 2006) andindividual studies have been undertaken to connect optical mea-surements and flux tower observations of CO2 exchange andecosystem productivity using multi-angular (Hilker et al., 2010;Tortini et al., 2015) and mono-angle spectroscopy (Garbulskyet al., 2008; Garrity et al., 2010).
More recently, tower-based observations of plant phenologyhave also been established for tropical vegetation using near infra-red (NIR)-red-green cameras (Wu et al., 2016a) and simple RGBcameras (Lopes et al., 2016). Increases in dry season ‘‘Amazongreening” were linked to synchronous leaf flushing during thedry season in central Amazonia, in response to an increase in avail-able PAR, consistent with previous satellite studies (Huete et al.,2006; Anderson et al., 2011; Guan et al., 2015) and field investiga-tions (Restrepo-Coupe et al., 2013). Increases in vegetation green-ness were preceded by abrupt, brief ‘‘browning” because of theincreased leaf abscission (Lopes et al., 2016). While tower-basedobservations have improved our understanding of plant phenologyin the tropics, a comprehension of its effect on the optical signalobserved by hyperspectral instruments in different regions of theelectromagnetic spectrum is currently lacking, as is an understand-ing of the spatial heterogeneity of the observed signal. Such under-standing will be critical in order to assess tropical seasonality atbroader scales using future orbital hyperspectral missions suchas the Environmental Mapping and Analysis (EnMAP), plannedfor 2019 (Guanter et al., 2015), and the Hyperspectral Infrared Ima-ger (HyspIRI), planned for the near future (Hochberg et al., 2015),both with 30 m spatial resolution.
The objective of this paper was to analyze spectral componentsof canopy phenology using a tower-mounted hyperspectral camerain an eastern Amazon forest to assess dry season differencesexisting between individual species. Our analysis was based onhyperspectral data acquired during the 2012 dry season at thek67 flux-tower field station in the Tapajós National Forest (TNF),in Brazil. As far as we know, this is the first hyperspectral remotesensing study using a tower-mounted camera to observe canopyphenology in the Amazon.
Our study was designed to address four research questions: (1)How do individual components (leaves, branches and shade) oftropical species canopy vary throughout the dry season? (2) Whatare the most important spectral components responsible for thedata variance in the hyperspectral signal to describe phenologicalpatterns across species? (3) Are there dry season variations inspectral attributes and metrics between the species? (4) Are thephenological patterns observed from the tower-based hyperspec-tral data perceptible when evaluating a landscape level data(MODIS observations)?
2. Data acquisition and processing
2.1. Hyperspectral data acquisition
The study area in Brazil is the TNF, located in the eastern Ama-zon, near Santarém town, in the state of Pará, which is mainly com-posed of dense ombrophilous forest (Fig. 1). The climate in the
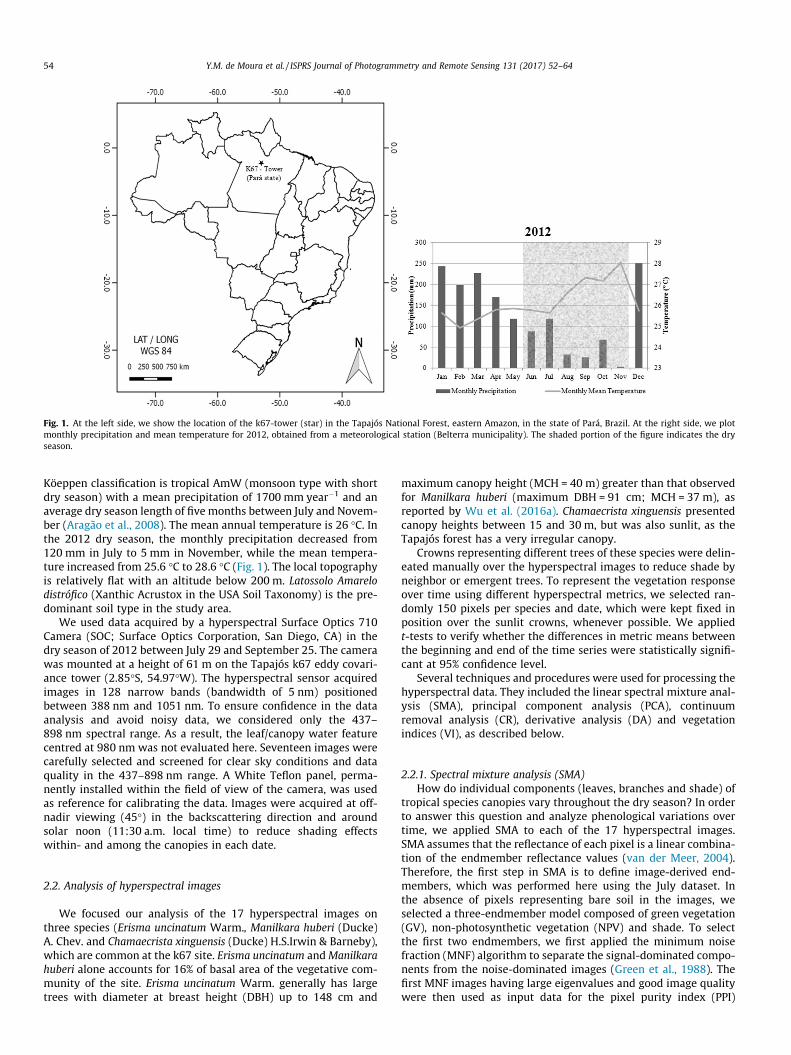
Fig. 1. At the left side, we show the location of the k67-tower (star) in the Tapajós National Forest, eastern Amazon, in the state of Pará, Brazil. At the right side, we plotmonthly precipitation and mean temperature for 2012, obtained from a meteorological station (Belterra municipality). The shaded portion of the figure indicates the dryseason.
54 Y.M. de Moura et al. / ISPRS Journal of Photogrammetry and Remote Sensing 131 (2017) 52–64
Köeppen classification is tropical AmW (monsoon type with shortdry season) with a mean precipitation of 1700 mm year�1 and anaverage dry season length of five months between July and Novem-ber (Aragão et al., 2008). The mean annual temperature is 26 �C. Inthe 2012 dry season, the monthly precipitation decreased from120 mm in July to 5 mm in November, while the mean tempera-ture increased from 25.6 �C to 28.6 �C (Fig. 1). The local topographyis relatively flat with an altitude below 200 m. Latossolo Amarelodistrófico (Xanthic Acrustox in the USA Soil Taxonomy) is the pre-dominant soil type in the study area.
We used data acquired by a hyperspectral Surface Optics 710Camera (SOC; Surface Optics Corporation, San Diego, CA) in thedry season of 2012 between July 29 and September 25. The camerawas mounted at a height of 61 m on the Tapajós k67 eddy covari-ance tower (2.85�S, 54.97�W). The hyperspectral sensor acquiredimages in 128 narrow bands (bandwidth of 5 nm) positionedbetween 388 nm and 1051 nm. To ensure confidence in the dataanalysis and avoid noisy data, we considered only the 437–898 nm spectral range. As a result, the leaf/canopy water featurecentred at 980 nm was not evaluated here. Seventeen images werecarefully selected and screened for clear sky conditions and dataquality in the 437–898 nm range. A White Teflon panel, perma-nently installed within the field of view of the camera, was usedas reference for calibrating the data. Images were acquired at off-nadir viewing (45�) in the backscattering direction and aroundsolar noon (11:30 a.m. local time) to reduce shading effectswithin- and among the canopies in each date.
2.2. Analysis of hyperspectral images
We focused our analysis of the 17 hyperspectral images onthree species (Erisma uncinatum Warm., Manilkara huberi (Ducke)A. Chev. and Chamaecrista xinguensis (Ducke) H.S.Irwin & Barneby),which are common at the k67 site. Erisma uncinatum andManilkarahuberi alone accounts for 16% of basal area of the vegetative com-munity of the site. Erisma uncinatum Warm. generally has largetrees with diameter at breast height (DBH) up to 148 cm and
maximum canopy height (MCH = 40 m) greater than that observedfor Manilkara huberi (maximum DBH = 91 cm; MCH = 37 m), asreported by Wu et al. (2016a). Chamaecrista xinguensis presentedcanopy heights between 15 and 30 m, but was also sunlit, as theTapajós forest has a very irregular canopy.
Crowns representing different trees of these species were delin-eated manually over the hyperspectral images to reduce shade byneighbor or emergent trees. To represent the vegetation responseover time using different hyperspectral metrics, we selected ran-domly 150 pixels per species and date, which were kept fixed inposition over the sunlit crowns, whenever possible. We appliedt-tests to verify whether the differences in metric means betweenthe beginning and end of the time series were statistically signifi-cant at 95% confidence level.
Several techniques and procedures were used for processing thehyperspectral data. They included the linear spectral mixture anal-ysis (SMA), principal component analysis (PCA), continuumremoval analysis (CR), derivative analysis (DA) and vegetationindices (VI), as described below.
2.2.1. Spectral mixture analysis (SMA)How do individual components (leaves, branches and shade) of
tropical species canopies vary throughout the dry season? In orderto answer this question and analyze phenological variations overtime, we applied SMA to each of the 17 hyperspectral images.SMA assumes that the reflectance of each pixel is a linear combina-tion of the endmember reflectance values (van der Meer, 2004).Therefore, the first step in SMA is to define image-derived end-members, which was performed here using the July dataset. Inthe absence of pixels representing bare soil in the images, weselected a three-endmember model composed of green vegetation(GV), non-photosynthetic vegetation (NPV) and shade. To selectthe first two endmembers, we first applied the minimum noisefraction (MNF) algorithm to separate the signal-dominated compo-nents from the noise-dominated images (Green et al., 1988). Thefirst MNF images having large eigenvalues and good image qualitywere then used as input data for the pixel purity index (PPI)

Y.M. de Moura et al. / ISPRS Journal of Photogrammetry and Remote Sensing 131 (2017) 52–64 55
technique to find pure endmembers. We set up the number ofinteractions to 5000 and the threshold to 2.5 of the MNF normal-ized noise. Candidate endmembers for GV and NPV detected auto-matically by the PPI were projected into an n-dimensionalscatterplot for final endmember selection looking at the corner ofthe data clouds (Galvão et al., 2011). From the use of the PPI tech-nique applied to the first 12 MNF images having eigenvaluesgreater than two and cumulative data variance greater than 90%,we selected a GV spectrum from Erisma uncinatum and a NPV spec-trum from Chamaecrista xinguensis as endmembers to compose athree-endmember model with shade. Following the proceduredescribed by Roberts et al. (1993), the shade endmember used inthis study had constant low reflectance to represent pure shadein all bands, spectrally flat in the 437–898 nm range.
The fixed set of three endmembers was then used in the SMA togenerate fraction images. The singular value decompositionapproach was used as a solution for data inversion into the fractionimages of each date. Endmember-fraction values were then plottedfor each species over time to inspect canopy phenology during thedry season.
2.2.2. Principal component analysis (PCA)What are the most important spectral intervals responsible for
the data variance in the hyperspectral signal to describe phenolog-ical patterns across species? PCA is a technique to handle highlycorrelated reflectance values across bands, to reduce data dimen-sionality and to detect the most important spectral bands, respon-sible for most of the data variance in the original variables (Moreiraand Galvão, 2010). Here, we applied PCA to a set of 7650 pixels(150 pixels, 3 species and 17 dates) to identify patterns of canopyphenology, using the reflectance of the 89 SOC camera bands posi-tioned between 437 and 898 nm as input variables. We appliedPCA to the set of 150 selected sunlit pixels (based on the crownsof each specie) instead of the entire image to reduce sun/canopyillumination effects on the interpretation of results and to giveequal weight to each species, thus enhancing their phenologicaldifferences.
Extraction of the components was based on the correlationmatrix and on eigenvalues responsible for more than 90% of thecumulative data variance. In the identification of patterns ofcanopy phenology, two principal components with eigenvaluesgreater than two were retained. The contribution of each band toexplain each component was determined from the analysis of thecomponent matrix loadings. Sampling adequacy and data suitabil-ity for reduction were examined using the Kaiser-Meyer-Olkin(KMO) measure and Bartlett’s test of sphericity, respectively(Cerny and Kaiser, 1977). We obtained and plotted the scores forthe first components without rotation and analyzed the spectralsimilarity between the three species. Because PCA is very sensitiveto outliers, we used scores greater than four standard deviationsaway from the mean to detect and remove them from the analysisbefore running again the algorithm.
2.2.3. Continuum removal, derivative analysis and vegetation indicesAre there dry season variations in spectral attributes and met-
rics between the species? To answer this question, we calculatedon a per pixel basis the depth, width, area and asymmetry of thechlorophyll absorption band centred at 680 nm for the 17 images.We used the Processing Routines in IDL for Spectroscopic Measure-ments (PRISM) software (Kokaly and Skidmore, 2015). The PRISMis based on the well-established continuum removal approach,which isolates absorption bands from the spectra to allow quantifi-cation of their parameters (Clark and Roush, 1984). We fixed thewavelengths at 560 nm and 760 nm (shoulders of the absorptionband) to remove the continuum. Absorption band parameters were
then plotted as a function of the species and of the date of imageacquisition.
In addition, derivative analysis detected the red-edge spectralposition, which is the wavelength of maximum first derivative ofthe reflectance spectrum between 690 nm and 750 nm. The red-edge position is potentially sensitive to changes in chlorophyll con-centration (Cho and Skidmore, 2006; Clevers and Gitelson, 2013).In our study, the first-order transformation was preceded by theSavitzky-Golay smoothing method for removing the backgroundnoise using a window size of three bands. Variations in red-edgeposition over time were analyzed per species.
Finally, we calculated the Normalized Difference VegetationIndex (NDVI) and the EVI to study their sensitivity to some pheno-logical events in the study area. For this purpose, we used the nar-row bands of the hyperspectral camera positioned at 472 nm(blue), 661 nm (red) and 861 nm (NIR). Both indices are the maincomponents of the Moderate Resolution Imaging Spectroradiome-ter (MODIS) vegetation index products (Huete et al., 2002). Theyhave been widely used in studies of the Amazonian tropical forests(e.g., Huete et al., 2006; Saleska et al., 2007; Galvão et al., 2011;Moura et al., 2012). Equations and parameters were the same asthe MODIS products.
After the analysis of leaf flushing events from neighboringbranches of a given species under the same illumination condi-tions, we additionally tested the potential of the normalized differ-ence between the green (563 nm) and red (661 nm) reflectance (q)to detect leaf flushing. Henceforth, to facilitate reading, this VI isentitled the Green-Red Normalized Difference (GRND) (Eq. (1)):
GRND ¼ ðq563nm � q661nmÞ=ðq563nm þ q661nmÞ ð1ÞThe GRND is conceptually similar to the Green Chromatic Coor-
dinate, a greenness index defined as the fractional contribution ofthe green spectral response to the summed response of the blue,green and red channels in a RGB camera (Woebbecke et al.,1995). In our study, we avoid using the blue band in the GRNDequation to reduce uncertainties associated with atmospheric scat-tering when calculating this index from MODIS data.
2.3. From tower hyperspectral measurements to MODIS (MAIAC)observations
Are the phenological patterns observed from the tower-basedhyperspectral data perceptible when evaluating a landscape leveldata (1-km MODIS observations)? Because the hyperspectral cam-era sensed a small footprint at the k67 Tapajós tower (300 m), wecompared our tower-based results with biweekly MODIS data pro-cessed by the MAIAC (Lyapustin et al., 2011). MAIAC applies rigor-ous cloud screening and atmospheric correction to obtain surfacereflectance without typical empirical assumptions. MODIS(MAIAC) data were corrected for Bidirectional Reflectance Distribu-tion Function (BRDF) effects, normalized to nadir viewing and to afixed solar zenith angle (SZA) of 45�. The BRDF correction reducesthe error and bias associated with view-illumination geometry thataffects differently the VIs. To compare the results, we calculatedthe NDVI (MODIS bands 1 and 2), EVI (bands 1, 2 and 3) and theGRND (bands 1 and 4) for a 3 � 3 km footprint at the tower siteand plotted the long-term mean (2000–2014) for the dry seasonto reduce noise in the time series.
Due to sample size limitations of the camera data, MODISobservations were compared with a landscape model of monthlyLAI partitioned into three leaf age classes. This approach was usedto inspect the consistency of the tower and MODIS results withground-based observations of canopy phenology. We used avail-able data on new leaf production and leaf area index (LAI) of young(1–2 months), mature (3–5 months) and old (�6 months) leavessimulated from a leaf demography-ontogeny model (Wu et al.,

56 Y.M. de Moura et al. / ISPRS Journal of Photogrammetry and Remote Sensing 131 (2017) 52–64
2016a). The simulation was supported by LAI (LAI-2000) and litter-fall (traps) measurements (2000–2005). We plotted the simulatednew leaf production (Wu et al., 2016a) and LAI against the MODIS(MAIAC) VIs.
3. Results
3.1. Spectral components of canopy phenology from SMA
Dry season differences in canopy phenology between the spe-cies were clearly visible in true color composites of the hyperspec-tral camera using bands positioned at 661 nm, 563 nm and 487 nmin red, green and blue, respectively (Fig. 2). For instance, Erismauncinatum (green line in Fig. 2) became brighter from July 29(DOY 211) to September 25 (DOY 269), while Chamaecristaxinguensis (red line) lost leaves toward the end of the dry season.
Endmember spectra for SMA are shown in Fig. 3. Distinct pat-terns of canopy phenology per species were observed in SMA colorcomposites using GV, NPV and shade fractions in green, red andblue colors, respectively (Fig. 4). Erisma uncinatum had increasingGV fractions toward the end of dry season, as indicated by brightergreen colors observed from DOY 211 to 269. In contrast, Chamae-crista xinguensis had increasing NPV fractions with deciduousness,as shown by the predominance of magenta shades in the images ofSeptember (DOY 247–269). The behavior of Manilkara huberi wasdifferent from the other two species (Fig. 4). The NPV firstincreased in the beginning of August (magenta shades in theDOY 218 and 227 images) and then decreased in the subsequentdates (green tones) with new foliage.
DOY 211 DOY
DOY 247 DOY
Fig. 2. Time series for six of the 17 true color composites of canopy phenology observed fand red lines for the first date delineate the three species: Erisma uncinatum, Manilkara hto color in this figure legend, the reader is referred to the web version of this article.)
Results of Fig. 4 were confirmed when we plotted the averageGV (Fig. 5a) and NPV (Fig. 5b) fractions calculated from 150 pixelsrandomly chosen per species and date. The contrasting phenologi-cal behavior between the evergreen Erisma uncinatum and thedeciduous Chamaecrista xinguensis was evident in the SMA frac-tions, because these species presented the largest mean GV (42–50%) and NPV (13–25%) values, respectively. When compared toErisma uncinatum, the evergreen Manilkara huberi had lower meanGV fraction and higher mean NPV fraction, especially in the begin-ning of August.
For the entire hyperspectral camera scene, the number of pixelswith shade fraction greater than 60% decreased from July toSeptember, revealing the influence of view-illumination effectsduring the dry season (Fig. 6). The 17 images were acquired aroundthe noon (11:30 a.m.) but the solar zenith angle (SZA) decreased13� from July 29 (SZA = 28�) to September 25 (SZA = 15�) (Fig. 7).In addition, the solar azimuth angle (SAA) increased toward theend of the dry season from 40� to 85�. As a result, the relative azi-muth angle (RAA) between the camera and the sun also decreasedover time with the sensor becoming more aligned to the directionof illumination (principal plane) toward September. Therefore,along with leaves density and distribution, view-illuminationeffects contributed for the reduced amounts of shadows and theincreased amounts of leaf/canopy scattering sensed by thetower-mounted camera at the end of September. For the twonon-deciduous species, GV increased gradually over the periodmainly due to decreasing shade and not at the expense of NPV,since NPV did not decrease for these two species in the lower graphof Fig. 5.
218 DOY 227
258 DOY 269
rom the hyperspectral camera mounted at the k67 tower in Tapajós. The green, blueuberi and Chamaecrista xinguensis, respectively. (For interpretation of the references

DOY 211 DOY 2
DOY 247 DOY 2
Fig. 4. Color composites of SMA fraction images showing dry season variations over time(red) and shade (blue) for six of the 17 hyperspectral images. The tree species discussed infigure legend, the reader is referred to the web version of this article.)
Fig. 3. Green and non-photosynthetic endmember spectra for spectral mixtureanalysis (SMA) selected from the sequential use of the minimum noise fraction(MNF) and pixel purity index (PPI) techniques. Shade is represented by a syntheticspectrum of flat low reflectance across all wavebands.
Y.M. de Moura et al. / ISPRS Journal of Photogrammetry and Remote Sensing 131 (2017) 52–64 57
3.2. Canopy phenology detected by PCA
Using the Bartlett Test of sphericity, we rejected the nullhypothesis that the correlation matrix was an identity matrix(p-value < 0.001), indicating that it was highly unlikely to haveobtained the correlation matrix from a population with zerocorrelation. The Kaiser-Meyer-Olkin (KMO) measure was closerto one (0.99), thus indicating sampling adequacy for PCA. The firsttwo principal components were responsible for 90.1% of the cumu-lative variance of the data. PC1 accounted for 61.5% of variance,while PC2 captured 29.6% of variance. The analysis of the compo-nent matrix loadings, which are the correlations between the bandreflectance and the component, showed that most of the SOC cam-era bands had large loadings on PC1, especially between 500 and650 nm and between 700 and 898 nm (Fig. 8). Therefore, PC1reflected brightness variations between the pixels. PC1 increasedwith increasing reflectance of these bands. By contrast, PC2showed large positive loadings in the blue (450–490 nm) and inthe chlorophyll red absorption region (650–680 nm), and negativeloadings in the NIR region between 750 and 898 nm. PC2 increasedwith increasing blue and red reflectance and with decreasing NIRreflectance. Thus, PC2 was sensitive to variations in NPV acrosspixels. The three species were separated from each other basedon their average reflectance (PC1) and average NPV content (PC2)over time.
Differences in canopy phenology between the three species areillustrated by projecting the first two PC scores for each of the 7650pixels extracted from the 17 dates of image acquisition (Fig. 9). Thespecies clustered differently in the PCA space. Confirming the
18 DOY 227
58 DOY 269
(July 29–September 25) in green vegetation (green), non-photosynthetic vegetationthe text are delineated in Fig. 2. (For interpretation of the references to color in this

Fig. 5. Bar graph illustration of dry season changes in spectral mixture fractions of(a) green vegetation (GV) and (b) non-photosynthetic vegetation (NPV) for the threespecies and six of the 17 dates under analysis.
58 Y.M. de Moura et al. / ISPRS Journal of Photogrammetry and Remote Sensing 131 (2017) 52–64
interpretation of the component matrix loadings, PC1 separatedthe highly reflective Erisma uncinatum at the right side of the axisfrom the other lower reflectance species at the left side. Therefore,brightness increased from the left to the right side of PC1. On theother hand, PC2 separated the deciduous Chamaecrista xinguensiswith greater amounts of NPV from the evergreen species. In thePC space of Fig. 9, increases in brightness and NPV were generallystronger toward the end of the dry season for Erisma uncinatum(gain in leaves) and Chamaecrista xinguensis (losses in leaves),respectively. Manilkara huberi presented an intermediate pheno-logical pattern between Erisma uncinatum and Chamaecristaxinguensis.
3.3. Variations in reflectance, vegetation indices and absorption bandattributes
In agreement with the PCA results (Figs. 8 and 9), Erisma uncina-tum had higher mean reflectance than Manilkara huberi andChamaecrista xinguensis in green and NIR bands with the largestloadings on PC1 (Fig. 10a and c). On the other hand, great amountsof NPV for Chamaecrista xinguensis produced comparatively higherred reflectance (Fig. 10b) and lower NIR reflectance (Fig. 10c) inbands that had large positive and negative PC2 loadings, respec-tively (Fig. 8). Therefore, the reflectance patterns observed in
Fig. 10 were consistent with the spatial distribution of the PCAscores in Fig. 9.
Reflectance differences over time were also observed for eachspecies and were statistically significant between the beginningand end of the time series at 95% confidence level (t-tests). ForChamaecrista xinguensis, differences over time were stronger inthe red bands due to increasing deciduousness. For Erisma uncina-tum, SMA results and the green and NIR reflectance differencesobserved between the beginning and end of the dry season(Fig. 10) indicated the presence of coupled effects of leaf flushingand reduction in shadows due to changes in SZA and SAA, or inRAA (Figs. 6 and 7). As illustrated in Fig. 11, the role played by leafflushing detected over the images is to increase the reflectance,especially in the green and NIR spectral regions. Differencesbetween young and old leaves for reflectance spectra extractedfrom neighboring branches under the same illumination condi-tions were concentrated in the green region due to lower chloro-phyll content of young leaves, and in the NIR region due todifferences in leaf structure.
Variations in the described patterns of canopy phenology werealso detected after VI determination (Fig. 12). There were statisticaldifferences (95% confidence level) between the species and acrossthe dates, especially for EVI and GRND, for Erisma uncinatum andChamaecrista xinguensis, and between August (DOY 210–220) andSeptember (DOY 268). Leaf flushing over Erisma uncinatum towardthe end of time series produced increases in EVI (Fig. 12a) andGRND (Fig. 12c) because of the observed changes in the NIR andgreen reflectance in response to the modification in the dominantleaf class in the crown from mature to young leaves (Fig. 11). Asdemonstrated in previous studies, EVI is strongly dependent onthe NIR reflectance at both MODIS (Galvão et al., 2011; Mouraet al., 2012) and single leaf scales (Yang et al., 2014). For Chamae-crista xinguensis, the NDVI decreased over time due to the reduc-tion in chlorophyll content and the resultant increase in the redreflectance with deciduousness (Fig. 12b).
From the continuum removal analysis, deeper chlorophyllabsorption bands centred at 681 nm were observed for Erismauncinatum when compared to the other two species (Fig. 13). Asimilar pattern was observed for the width and area of this spectralfeature, which did not present a well-defined trend for the asym-metry. However, except for Chamaecrista xinguensis, the differenceswere not statistically significant for each species between the per-iod analyzed.
In general, increased chlorophyll contents broaden the 681-nmabsorption feature that becomes deeper for a given species, shift-ing the red-edge position to longer wavelengths in the 690–750 nm range. Our first-order derivative analysis, however,showed variations in the red-edge position between the speciesand across dates close to the bandwidth of the hyperspectral cam-era (5 nm). Such differences (results not shown) were not statisti-cally different at 95% confidence level, as indicated by t-tests ofmeans differences between the beginning and end of the observa-tion period.
3.4. MODIS observations at the Tapajós k67 site
In the previous hyperspectral analysis with the tower-basedcamera, we detected three distinct patterns of canopy phenology:two patterns associated with evergreen species that predominatedat the k67 site (Erisma uncinatum and Manilkara huberi) and onepattern related to a less common deciduous species (Chamaecristaxinguensis). For scaling up our tower-based results to a larger foot-print, we plotted biweekly long-term mean (2000–2014) of MODISEVI and GRND corrected for BRDF effects using MAIAC (Fig. 14).According to our results, these two VIs were more sensitive to leaf

DOY 211 DOY 218 DOY 227
DOY 247 DOY 258 DOY 269
Fig. 6. Spatial and temporal variability in shade fraction for pixels with endmember abundance greater than 60%. The decrease in shade over time is clearly apparent due todecreasing solar zenith angle (SZA), increasing solar azimuth angle (SAA), or decreasing relative azimuth angle (RAA), toward the end of the dry season (DOY 211–269).
Fig. 7. Temporal changes in solar zenith angle (SZA) and solar azimuth angle (SAA)observed at the time of image collection (11:30 a.m. local time) for each of the 17dates of hyperspectral image acquisition. The marked change in SZA and relativeazimuth angle (RAA; not shown) between July and September contributed to shadevariability in the scene, as illustrated in Fig. 6.
Fig. 8. Component matrix loadings for the first two principal components (PC1 andPC2). PC1 was driven mostly by brightness variations, whereas PC2 was dominatedby relative changes in green and non-photosynthetic vegetation (NPV) due to leaflosses.
Y.M. de Moura et al. / ISPRS Journal of Photogrammetry and Remote Sensing 131 (2017) 52–64 59
flushing than the NDVI because of the respective changes in greenand NIR reflectance observed from old to young leaves (Fig. 11).
The VI comparison at a 3 � 3-km MODIS footprint with themodeled phenological observations (leaf demography-ontogeny
model) by Wu et al. (2016a) showed that the GRND was closelyrelated to new leaf production at the Tapajós k67 site (Fig. 14).On the other hand, the EVI was more associated with changes inthe LAI of mature leaves (3–5 months). Therefore, these observedincreases in EVI during the dry season can be related to a propor-tional increase in mature leaves in relation to young leaves. GRNDincreased from July to August and then decreased toward Septem-ber. In contrast, EVI increased over time toward the end of the dryseason (Fig. 14). Young bright green leaves (high GRND) constitute

Fig. 10. Dry season variations in mean reflectance of the (a) green, (b) red and (c)near infrared bands of the tower-mounted hyperspectral camera for the 3 speciesand 17 dates under analysis. The error bars represent the spatial variability of thesamples within the tree crowns (mostly driven by differences in shade fraction).Temporal differences between dates of minimum and maximum reflectance werestatistically significant for all species at 95% confidence level. (For interpretation ofthe references to color in this figure legend, the reader is referred to the web versionof this article.)
Fig. 9. First two scores from PCA applied to the reflectance of 89 bands (437–898 nm) of the hyperspectral camera, showing canopy spectral variations betweenthree species (n = 7650 pixels from 17 dates). In the observation period (July 29–September 25), brightness increased from the left to the right side of PC1 with gainsin leaves. NPV increased from the bottom to the top of PC2 with losses in leaves.
60 Y.M. de Moura et al. / ISPRS Journal of Photogrammetry and Remote Sensing 131 (2017) 52–64
a brief phenological stage. These leaves change to mature darkgreen leaves (lower GRND, but high EVI), a longer-lasting pheno-logical stage. The abundance of this class increases over the dryseason as more trees have flushed in the prior dry months.
4. Discussion
Canopy phenology is a vital indicator of environmental controlson species and ecosystems (Cleland et al., 2007; Richardson et al.,2012). A better understanding of vegetation phenology is thereforeurgently needed for a better comprehension of climate sensitivityof tropical vegetation (Hilker et al., 2014). The results presentedin this study, which is the first hyperspectral investigation usinga tower-mounted camera to observe canopy phenology in theAmazon, contribute to this ongoing discussion in two major ways.
First, we have demonstrated, using a detailed study of individ-ual tree crowns observed by the hyperspectral camera at theTapajós site, a diversity of phenological responses during the2012 dry season. Our results have shown different stages of phe-nology for three individual species (Erisma uncinatum, Manilkarahuberi and Chamaecrista xinguensis). Different timings and intensityin leaf flushing and leaf shedding affected the GV and NPV fractionsobtained from SMA (Figs. 5 and 6); the spatial distribution of PCAscores associated with brightness and deciduousness (Fig. 9); thered, green and NIR reflectance and related VIs (Figs. 10 and 12);and the 681-nm chlorophyll absorption band parameters(Fig. 13). The standard deviation of these spectral attributes waslarger after DOY 245 with the closest alignment between the towercamera and the sun as well as with the largest phenological vari-ability observed with the precipitation decrease and the tempera-ture increase (Fig. 1). As discussed by Lopes et al. (2016), flushingin the Amazon is concentrated in the months of low rainfall andoccurs in a strategy to exploit the season of high insolation.
The temporal variation in these spectral attributes was there-fore affected to some extent by view-illumination effects producedby decreasing SZA, increasing SAA, or modifications in the RAA
between the camera and the sun, which decreased toward theend of the dry season (Fig. 7). In the SMA, such effects wereexpressed by decreasing shade fractions over time (Fig. 6). How-ever, they did not explain, for instance, the temporal differencesbetween the two evergreen species with Erisma uncinatum pre-senting clearly leaf flush events in the images that varied in inten-sity between the trees.
The results presented in our paper confirm previous findings ofother two recent tower-based phenological studies in the Amazonbasin using multispectral data or RGB cameras (Lopes et al., 2016;Wu et al., 2016a). Importantly, this study demonstrates the useful-ness of tower-based cameras to have a comprehensive understand-ing of the processes that are occurring through time in the canopyand how they influence the vegetation spectral behavior at highspectral resolution. Knowing how the spectra change with physicalmodifications in the canopy will enhance our knowledge on howthese changes affect the spectra from large-scale orbital opticaldata.
From the three studied species, Erisma uncinatum andManilkarahuberi alone account for 16% of basal area of the vegetativecommunity of the area and are therefore very important. Whilearguably measurements of a few tree crowns, or flux tower
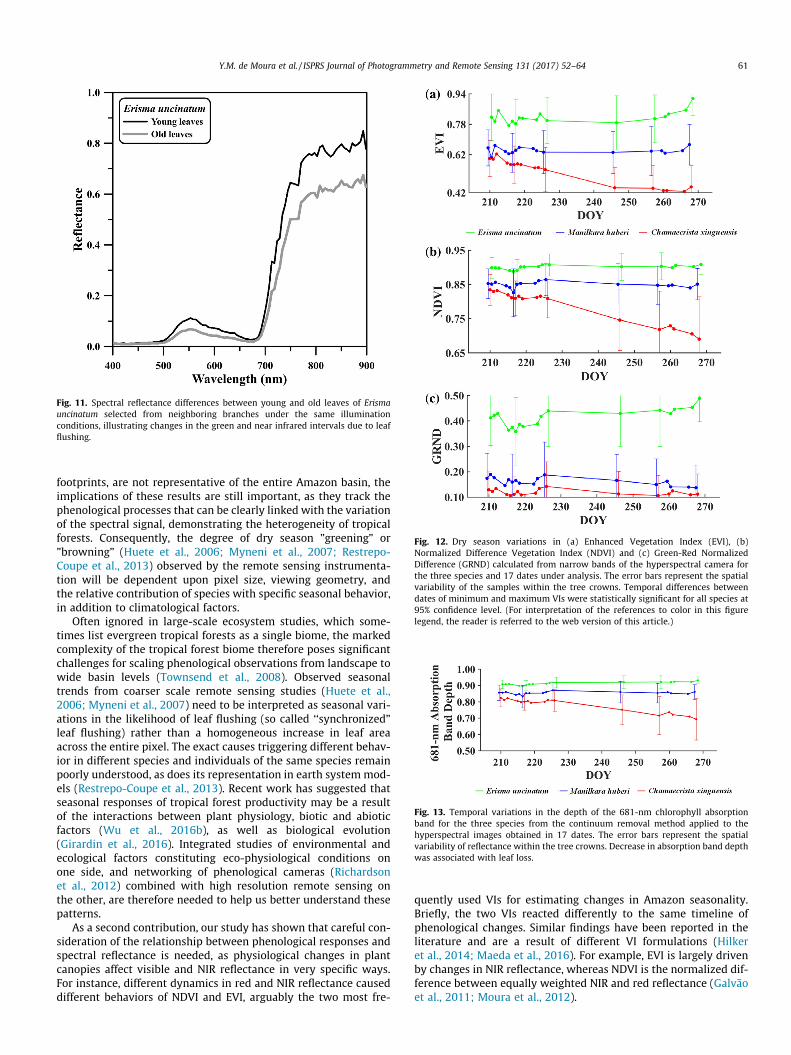
Fig. 11. Spectral reflectance differences between young and old leaves of Erismauncinatum selected from neighboring branches under the same illuminationconditions, illustrating changes in the green and near infrared intervals due to leafflushing.
Fig. 12. Dry season variations in (a) Enhanced Vegetation Index (EVI), (b)Normalized Difference Vegetation Index (NDVI) and (c) Green-Red NormalizedDifference (GRND) calculated from narrow bands of the hyperspectral camera forthe three species and 17 dates under analysis. The error bars represent the spatialvariability of the samples within the tree crowns. Temporal differences betweendates of minimum and maximum VIs were statistically significant for all species at95% confidence level. (For interpretation of the references to color in this figurelegend, the reader is referred to the web version of this article.)
Fig. 13. Temporal variations in the depth of the 681-nm chlorophyll absorptionband for the three species from the continuum removal method applied to thehyperspectral images obtained in 17 dates. The error bars represent the spatialvariability of reflectance within the tree crowns. Decrease in absorption band depthwas associated with leaf loss.
Y.M. de Moura et al. / ISPRS Journal of Photogrammetry and Remote Sensing 131 (2017) 52–64 61
footprints, are not representative of the entire Amazon basin, theimplications of these results are still important, as they track thephenological processes that can be clearly linked with the variationof the spectral signal, demonstrating the heterogeneity of tropicalforests. Consequently, the degree of dry season ”greening” or”browning” (Huete et al., 2006; Myneni et al., 2007; Restrepo-Coupe et al., 2013) observed by the remote sensing instrumenta-tion will be dependent upon pixel size, viewing geometry, andthe relative contribution of species with specific seasonal behavior,in addition to climatological factors.
Often ignored in large-scale ecosystem studies, which some-times list evergreen tropical forests as a single biome, the markedcomplexity of the tropical forest biome therefore poses significantchallenges for scaling phenological observations from landscape towide basin levels (Townsend et al., 2008). Observed seasonaltrends from coarser scale remote sensing studies (Huete et al.,2006; Myneni et al., 2007) need to be interpreted as seasonal vari-ations in the likelihood of leaf flushing (so called ‘‘synchronized”leaf flushing) rather than a homogeneous increase in leaf areaacross the entire pixel. The exact causes triggering different behav-ior in different species and individuals of the same species remainpoorly understood, as does its representation in earth systemmod-els (Restrepo-Coupe et al., 2013). Recent work has suggested thatseasonal responses of tropical forest productivity may be a resultof the interactions between plant physiology, biotic and abioticfactors (Wu et al., 2016b), as well as biological evolution(Girardin et al., 2016). Integrated studies of environmental andecological factors constituting eco-physiological conditions onone side, and networking of phenological cameras (Richardsonet al., 2012) combined with high resolution remote sensing onthe other, are therefore needed to help us better understand thesepatterns.
As a second contribution, our study has shown that careful con-sideration of the relationship between phenological responses andspectral reflectance is needed, as physiological changes in plantcanopies affect visible and NIR reflectance in very specific ways.For instance, different dynamics in red and NIR reflectance causeddifferent behaviors of NDVI and EVI, arguably the two most fre-
quently used VIs for estimating changes in Amazon seasonality.Briefly, the two VIs reacted differently to the same timeline ofphenological changes. Similar findings have been reported in theliterature and are a result of different VI formulations (Hilkeret al., 2014; Maeda et al., 2016). For example, EVI is largely drivenby changes in NIR reflectance, whereas NDVI is the normalized dif-ference between equally weighted NIR and red reflectance (Galvãoet al., 2011; Moura et al., 2012).

Fig. 14. Temporal changes in long-term means (2000–2014) of MODIS (MAIAC) EVI (red axis) and GRND (dark green axis) compared to the new leaf production (light greenaxis, leaves 1–2 mo old) and leaf area index of mature leaves (orange axis, 3–5 mo old) modeled by Wu et al. (2016a). Modeled new leaf production at the Tapajós k67 sitefollowed GRND closely, whereas EVI was more related to changes in mature leaf area. (For interpretation of the references to color in this figure legend, the reader is referredto the web version of this article.)
62 Y.M. de Moura et al. / ISPRS Journal of Photogrammetry and Remote Sensing 131 (2017) 52–64
Biophysical interpretations of large scale ‘‘greening” and‘‘browning” effects as a result of changes in these VIs need to bemade carefully as the underlying physiological behavior may becomplex, especially given the spatial heterogeneity demonstratedhere on just a few individual trees. For instance, changes in NIRreflectance can be caused by variations in LAI, but can also be justthe result of modifications in canopy structure or leaf angle distri-bution (de Moura et al., 2015). Similarly, increased absorption ofvisible reflectance is indicative of increased photosynthetic capac-ity of vegetation, but photosynthesis itself depends on additionalfactors such as light use efficiency (Demmig-Adams et al., 2008).
In our study, changes in EVI most closely tracked changes inmature leaf area modeled at the landscape level by Wu et al.(2016a) at the Tapajós site, but EVI was not a good indicator of leafflushing behavior. For instance, a monotonic increase in MODISobserved EVI from July to September, after the BRDF correctionby MAIAC, was more consistent with an increase in LAI of matureleaves, because new leaf flushing peaked in August and thendeclined in September (Fig. 14). Leaf flushing may have little effecton total leaf area (Wu et al., 2016a,b), as abscised leaves are quicklyreplaced by new grown leaves (Lopes et al., 2016). Nonetheless,young, mature and old leaves have very different capacities to pho-tosynthesize (Kitajima et al., 1997). Consequently, leaf demogra-phy is an important driver of photosynthetic potential. Thesevariations may be missed when only observing reflectance sensi-tive to changes in LAI.
Our findings showed that new leaf flushing was closelyobserved by the GRND rather than by the EVI. This seems plausible,as absorption of visible radiation is largely driven by leaf pigmentconcentrations, which, in turn, is closely linked to leaf age(Blackburn, 2007; Doughty and Goulden, 2008; Kitajima et al.,1997; Roberts et al., 1998). For instance, leaf chlorophyll concen-trations peak in mature leaves and decline toward senescence.
The relatively large standard deviations in comparison to thevariation in seasonal signals presented in the spectral profiles(Figs. 10, 12 and 13) are resultant of the spatial variability withinthe illuminated part of the tree crowns. While there may still besome effects of canopy shading driving this variation due to imper-fect estimates of shadow fractions, these variations show oppositebehavior for different species and can therefore not be attributed
solely to sun-sensor effects. Our results are in agreement with pre-vious studies (Hilker et al., 2014; Saleska et al., 2016), but do notsupport findings on constant canopy structure and greening duringthe dry season in the Amazon (Morton et al., 2014). Despite thespatial variability within the tree canopies, temporal changes werestill statistically significant at 95% confidence level for most of thespectral attributes. Furthermore, even after BRDF correction ofMODIS data by the MAIAC, the behavior of the EVI and GRNDwas not constant over time.
Our results have shown that accurate monitoring of tropical for-est phenology is possible from tower and spaceborne remote sens-ing when considering the spatial heterogeneity of Amazonianforests and the biophysical underpinnings of spectral reflectancebehavior in different regions of the electromagnetic spectrum.The current analysis is important to support future studies in theAmazon using planned orbital hyperspectral missions such as theEnMAP and HyspIRI. All techniques used here can be applied toimages of these sensors to link information from future networksof tower-mounted hyperspectral cameras with hyperspectralsatellite observations at 30 m spatial resolution.
5. Conclusions
We provided a comprehensive analysis about the spectral com-ponents of canopy phenology of three species and compared thedata acquired by a tower-mounted hyperspectral camera in theeastern Amazon with BRDF-corrected MODIS (MAIAC) data andmodeled LAI/leaf flushing. Our findings showed dry season changesin canopy structure and greenness of the species. In addition,because of the NIR dependence, the EVI was more sensitive tocanopy structure than the GRND, which was closely associatedwith leaf flushing.
The variation in timing and intensity of leaf flushing and leafshedding for Erisma uncinatum, Manilkara huberi and Chamaecristaxinguensis was mostly expressed by distinct GV and NPV fractionsfrom SMA, different clusters of species in the PCA space, and bymodifications in parameters of the 681-nm chlorophyll absorptionband from the continuum removal approach. Well-defined trendswere not observed for the red-edge spectral position that varied
Y.M. de Moura et al. / ISPRS Journal of Photogrammetry and Remote Sensing 131 (2017) 52–64 63
close to the 5-nm bandwidth of the camera. The most importantspectral intervals associated with leaf flushing were the greenand NIR regions. Leaf loss in Chamaecrista xinguensis increasedthe red reflectance (reduction in chlorophyll content) anddecreased the NIR reflectance due to great amounts of NPVobserved for this species in September. The hyperspectral cameradata were affected by view-illumination effects, which reducedthe amounts of shadows viewed by the sensor cast by neighboror emergent trees.
View-illumination effects on MODIS data were corrected by theMAIAC. At the k67 tower site, the EVI corrected for BRDF effectsmonotonically increased from July to September and closelytracked the changes in LAI of mature leaves (3–5 months) modeledby the leaf demography-ontogeny model. The GRND was a betterindicator of leaf flushing than the EVI, because the modeled pro-duction of new leaves peaked in August and then declined inSeptember. Therefore, the modeled new leaf production at theTapajós site followed the GRND closely, whereas the EVI was morerelated to changes in mature leaf area.
Acknowledgements
This work was supported by the GOAmazon project, fundedjointly by the U.S. Department of Energy (DOE) (DE-SC0008383),Fundação de Amparo à Pesquisa do Estado de São Paulo (FAPESP)(2013/50533-5 and 2015/23868-1), and Fundação de Amparo àPesquisa do Estado do Amazonas (FAPEAM) (062.00570/2014).TH was supported by the Conselho Nacional de DesenvolvimentoCientífico e Tecnológico (CNPq) (PVE 401025/2014-4). The authorsthank the reviewers for their comments and suggestions.
References
Anderson, L.O., Aragão, L.E.O.C., Shimabukuro, Y.E., Almeida, S., Huete, A., 2011.Fraction images for monitoring intra-annual phenology of different vegetationphysiognomies in Amazonia. Int. J. Remote Sens. 32 (2), 387–408.
Aragão, L.E.O.C., Malhi, Y., Barbier, N., Lima, A., Shimabukuro, Y., Anderson, L.,Saatchi, S., 2008. Interactions between rainfall, deforestation and fires duringrecent years in the Brazilian Amazonia. Philos. Trans. R. Soc. Lond. B Biol. Sci.363 (1498), 1779–1785. http://dx.doi.org/10.1098/rstb.2007.0026.
Arora, V.K., Boer, G.J., 2005. A parameterization of leaf phenology for the terrestrialecosystem component of climate models. Glob. Change Biol. 11 (1), 39–59.http://dx.doi.org/10.1111/j.1365-2486.2004.00890.x.
Bi, J., Knyazikhin, Y., Choi, S., Park, T., Barichivich, J., Ciais, P., et al., 2015. Sunlightmediated seasonality in canopy structure and photosynthetic activity ofAmazonian rainforests. Environ. Res. Lett. 10 (6), 064014. http://dx.doi.org/10.1088/1748-9326/10/6/064014.
Blackburn, G.A., 2007. Hyperspectral remote sensing of plant pigments. J. Exp. Bot.58 (4), 855–867. http://dx.doi.org/10.1093/jxb/erl123.
Bonan, G.B., Levis, S., Sitch, S., Vertenstein, M., Oleson, K.W., 2003. A dynamic globalvegetation model for use with climate models: concepts and description ofsimulated vegetation dynamics. Glob. Change Biol. 9 (11), 1543–1566. http://dx.doi.org/10.1046/j.1365-2486.2003.00681.x.
Borchert, R., Calle, Z., Strahler, A.H., Baertschi, A., Magill, R.E., Broadhead, J.S., Kamau,J., Njoroge, J., Muthuri, C., 2015. Insolation and photoperiodic control of treedevelopment near the equator. New Phytol. 205, 7–13.
Cerny, C.A., Kaiser, H.F., 1977. A study of a measure of sampling adequacy for factor-analytic correlation matrices. Multivar. Behav. Res. 12, 43–47.
Cho, M.A., Skidmore, A.K., 2006. A new technique for extracting the red edgeposition from hyperspectral data: The linear extrapolation method. RemoteSens. Environ. 101 (2), 181–193. http://dx.doi.org/10.1016/j.rse.2005.12.011.
Clark, R.N., Roush, T.L., 1984. Reflectance spectroscopy: quantitative analysistechniques for remote sensing applications. J. Geophys. Res.: Solid Earth 89(B7), 6329–6340. http://dx.doi.org/10.1029/JB089iB07p06329.
Cleland, E.E., Chuine, I., Menzel, A., Mooney, H.A., Schwartz, M.D., 2007. Shiftingplant phenology in response to global change. Trends Ecol. Evol. 22 (7), 357–365. http://dx.doi.org/10.1016/j.tree.2007.04.003.
Clevers, J.G.P.W., Gitelson, A.A., 2013. Remote estimation of crop and grasschlorophyll and nitrogen content using red-edge bands on Sentinel-2 and -3.Int. J. Appl. Earth Observations Geoinf. 23, 344–351. http://dx.doi.org/10.1016/j.jag.2012.10.008.
Cox, P.M., Betts, R.A., Collins, M., Harris, P.P., Huntingford, C., Jones, C.D., 2004.Amazonian forest dieback under climate-carbon cycle projections for the 21stcentury. Theoret. Appl. Climatol. 78 (1–3), 137–156. http://dx.doi.org/10.1007/s00704-004-0049-4.
D’Odorico, P., Gonsamo, A., Gough, C.M., Bohrer, G., Morison, J., Wilkinson, M., et al.,2015. The match and mismatch between photosynthesis and land surfacephenology of deciduous forests. Agric. For. Meteorol. 214, 25–38. http://dx.doi.org/10.1016/j.agrformet.2015.07.005.
Demmig-Adams, B., Adams III, W.W., Barker, D.H., Logan, B.A., Bowling, D.R.,Verhoeven, A.S., 2008. Using chlorophyll fluorescence to assess the fraction ofabsorbed light allocated to thermal dissipation of excess excitation. Physiol.Plant. 98 (2), 253–264. http://dx.doi.org/10.1034/j.1399-3054.1996.980206.x.
Doughty, C.E., Goulden, M.L., 2008. Seasonal patterns of tropical forest leaf areaindex and CO2 exchange. J. Geophys. Res. 113, G00B06. http://dx.doi.org/10.1029/2007JG000590.
Frank, D., Reichstein, M., Bahn, M., Thonicke, K., Frank, D., Mahecha, M.D., et al.,2015. Effects of climate extremes on the terrestrial carbon cycle: concepts,processes and potential future impacts. Glob. Change Biol. 21 (8), 2861–2880.http://dx.doi.org/10.1111/gcb.12916.
Friedlingstein, P., Cox,P., Betts,R., Bopp, L., vonBloh,W.,Brovkin,V., etal., 2006. Climate-carbon cycle feedback analysis: results from the C4MIP model intercomparison. J.Clim. 19 (14), 3337–3353. http://dx.doi.org/10.1175/JCLI3800.1.
Galvão, L.S., dos Santos, J.R., Roberts, D.A., Breunig, F., Marcelo, B., Toomey, M., deMoura, Y.M., 2011. On intra-annual EVI variability in the dry season of tropicalforest: a case study with MODIS and hyperspectral data. Remote Sens. Environ.115 (9), 2350–2359. http://dx.doi.org/10.1016/j.rse.2011.04.035.
Gamon, J.A., Rahman, A.F., Dungan, J.L., Schildhauer, M., Huemmrich, K.F., 2006.Spectral network (SpecNet)—what is it and why do we need it? Remote Sens.Environ. 103 (3), 227–235. http://dx.doi.org/10.1016/j.rse.2006.04.003.
Garbulsky, M.F., Peñuelas, J., Papale, D., Filella, I., 2008. Remote estimation of carbondioxide uptake by a Mediterranean forest. Glob. Change Biol. 14 (12), 2860–2867. http://dx.doi.org/10.1111/j.1365-2486.2008.01684.x.
Garrity, S.R., Vierling, L.A., Bickford, K., 2010. A simple filtered photodiodeinstrument for continuous measurement of narrowband NDVI and PRI overvegetated canopies. Agric. For. Meteorol. 150.
Girardin, C.A.J., Malhi, Y., Doughty, C.E., Metcalfe, D.B., Meir, P., del Aguila-Pasquel, J.,et al., 2016. Seasonal trends of Amazonian rainforest phenology, net primaryproductivity, and carbon allocation. Global Biogeochem. Cycles 30 (5), 700–715.http://dx.doi.org/10.1002/2015GB005270.
Green, A.A., Berman, M., Switzer, P., Craig, M.D., 1988. A transformation for orderingmultispectral data in terms of image quality with implications for noiseremoval. IEEE Trans. Geosci. Remote Sens. 26 (1), 65–74. http://dx.doi.org/10.1109/36.3001.
Guan, K., Pan, M., Li, H., Wolf, A., Wu, J., Medvigy, D., Caylor, K.K., Sheffield, J., Wood,E.F., Malhi, Y., Liang, M., 2015. Photosynthetic seasonality of global tropicalforests constrained by hydroclimate. Nat. Geosci. 8 (4), 284–289.
Guanter, L., Kaufmann, H., Segl, K., Foerster, S., Rogass, C., Chabrillat, S., et al., 2015.The EnMAP spaceborne imaging spectroscopy mission for earth observation.Remote Sensing 7 (7), 8830–8857. http://dx.doi.org/10.3390/rs70708830.
Hilker, T., Leeuwen, M., Coops, N.C., Wulder, M.A., Newnham, G.J., Jupp, D.L.B.,Culvenor, D.S., 2010. Comparing canopy metrics derived from terrestrial andairborne laser scanning in a Douglas-fir dominated forest stand. Trees 24 (5),819–832. http://dx.doi.org/10.1007/s00468-010-0452-7.
Hilker, T., Lyapustin, A.I., Tucker, C.J., Hall, F.G., Myneni, R.B., Wang, Y., et al., 2014.Vegetation dynamics and rainfall sensitivity of the Amazon. Proc. Natl. Acad.Sci. 111 (45), 16041–16046. http://dx.doi.org/10.1073/pnas.1404870111.
Hochberg, E.J., Roberts, D.A., Dennison, P.E., Hulley, G.C., 2015. Special issue on thehyperspectral infrared imager (HyspIRI): emerging science in terrestrial andaquatic ecology, radiation balance and hazards. Remote Sens. Environ. 167, 1–5.
Huete, A., Didan, K., Miura, T., Rodriguez, E.P., Gao, X., Ferreira, L.G., 2002. Overviewof the radiometric and biophysical performance of the MODIS vegetationindices. Remote Sens. Environ. 83 (1–2), 195–213.
Huete, A.R., Didan, K., Shimabukuro, Y.E., Ratana, P., Saleska, S.R., Hutyra, L.R., et al.,2006. Amazon rainforests green-up with sunlight in dry season. Geophys. Res.Lett. 33 (6), L06405. http://dx.doi.org/10.1029/2005GL025583.
Kitajima, K., Mulkey, S., Wright, S., 1997. Decline of photosynthetic capacity withleaf age in relation to leaf longevities for five tropical canopy tree species. Am. J.Bot. 84 (5), 702.
Kokaly, R.F., Skidmore, A.K., 2015. Plant phenolics and absorption features invegetation reflectance spectra near 1.66 lm. Int. J. Appl. Earth Obs. Geoinf. 43,55–83. http://dx.doi.org/10.1016/j.jag.2015.01.010.
Lee, J.E., Frankenberg, C., van der Tol, C., Berry, J.A., Guanter, L., Boyce, C.K., Fisher, J.B., Morrow, E., Worden, J.R., Asefi, S., Badgley, G., 2013. Forest productivity andwater stress in Amazonia: Observations from GOSAT chlorophyll fluorescence.Proc. R. Soc. Lond. B: Biol. Sci. 280 (1761), 20130171.
Lopes, A.P., Nelson, B.W., Wu, J., de Graça, P.M.L., et al., 2016. Leaf flush drives dryseason green-up of the Central Amazon. Remote Sens. Environ. 182. http://dx.doi.org/10.1016/j.rse.2016.05.009.
Lyapustin, A.I., Martonchik, J., Wang, Y., Laszlo, I., Korkin, S., 2011. Multiangleimplementation of atmospheric correction (MAIAC): 1. Radiative transfer basisand look-up tables. J. Geophys. Res.: Atmos. 116(D3).
Maeda, E.E., Moura, Y.M., Wagner, F., Hilker, T., Lyapustin, A.I., Wang, Y., et al., 2016.Consistency of vegetation index seasonality across the Amazon rainforest. Int. J.Appl. Earth Obs. Geoinf. 52, 42–53. http://dx.doi.org/10.1016/j.jag.2016.05.005.
Malhi, Y., Roberts, J.T., Betts, R.A., Killeen, T.J., Li, W., Nobre, C.A., 2008. ClimateChange, Deforestation, and the Fate of the Amazon. http://dx.doi.org/10.1126/science.1146961 (January 11).
Moreira, R.C., Galvão, L.S., 2010. Variation in spectral shape of urban materials.Remote Sensing Lett. 1 (3), 149–158. http://dx.doi.org/10.1080/01431161003692032.

64 Y.M. de Moura et al. / ISPRS Journal of Photogrammetry and Remote Sensing 131 (2017) 52–64
Morton, D.C., Nagol, J., Carabajal, C.C., Rosette, J., Palace, M., Cook, B.D., et al., 2014.Amazon forests maintain consistent canopy structure and greenness during thedry season. Nature 506 (7487), 221–224. http://dx.doi.org/10.1038/nature13006.
de Moura, Y.M., Hilker, T., Lyapustin, A.I., Galvão, L.S., dos Santos, J.R., Anderson, L.O.,et al., 2015. Seasonality and drought effects of Amazonian forests observed frommulti-angle satellite data. Remote Sens. Environ. 171, 278–290. http://dx.doi.org/10.1016/j.rse.2015.10.015.
Moura, Y.M., Galvao, L.S., dos Santos, J.R., Roberts, D.A., Breunig, F.M., 2012. Use ofMISR/Terra data to study intra- and inter-annual EVI variations in the dryseason of tropical forest. Remote Sens. Environ. 127, 260–270. http://dx.doi.org/10.1016/j.rse.2012.09.013.
Myneni, R.B., Yang, W., Nemani, R.R., Huete, A.R., Dickinson, R.E., Knyazikhin, Y.,et al., 2007. Large seasonal swings in leaf area of Amazon rainforests. Proc. Natl.Acad. Sci. USA 104 (12), 4820–4823. http://dx.doi.org/10.1073/pnas.0611338104.
Phillips, O.L., Aragão, L.E.O.C., Lewis, S.L., Fisher, J.B., Lloyd, J., López-gonzález, G.,et al., 2009. Drought sensitivity of the amazon rainforest. Science 323 (5919),1344–1347.
Restrepo-Coupe, N., da Rocha, H.R., Hutyra, L.R., da Araujo, A.C., Borma, L.S.,Christoffersen, B., et al., 2013. What drives the seasonality of photosynthesisacross the Amazon basin? A cross-site analysis of eddy flux towermeasurements from the Brasil flux network. Agric. For. Meteorol. 182–183,128–144. http://dx.doi.org/10.1016/j.agrformet.2013.04.031.
Richardson, A.D., Anderson, R.S., Arain, M.A., Barr, A.G., Bohrer, G., Chen, G., et al.,2012. Terrestrial biosphere models need better representation of vegetationphenology: results from the North American Carbon Program Site Synthesis.Glob. Change Biol. 18 (2), 566–584. http://dx.doi.org/10.1111/j.1365-2486.2011.02562.x.
Richardson, A.D., Jenkins, J.P., Braswell, B.H., Hollinger, D.Y., Ollinger, S.V., Smith, M.-L., 2007. Use of digital webcam images to track spring green-up in a deciduousbroadleaf forest. Oecologia 152 (2), 323–334. http://dx.doi.org/10.1007/s00442-006-0657-z.
Roberts, D.A., Nelson, B.W., Adams, J.B., Palmer, F., 1998. Spectral changes with leafaging in Amazon caatinga. Trees 12, 315–325.
Roberts, D.A., Smith, M.O., Adams, J.B., 1993. Green vegetation, nonphotosyntheticvegetation, and soils in AVIRIS data. Remote Sens. Environ. 44, 255–269.
Saleska, S.R., Didan, K., Huete, A.R., da Rocha, H.R., 2007. Amazon forests green-upduring 2005 drought. Science (New York, NY) 318 (5850), 612. http://dx.doi.org/10.1126/science.1146663.
Saleska, S.R., Wu, J., Guan, K., Araújo, A., Huete, A.R., Restrepo-Coupe, N., 2016. Dry-season greening of Amazon forests evidence from ecological studies. Nature531. http://dx.doi.org/10.1038/nature13006.
Samanta, A., Ganguly, S., Hashimoto, H., Devadiga, S., Vermote, E., Knyazikhin, Y.,et al., 2010. Amazon forests did not green-up during the 2005 drought.Geophys. Res. Lett. 37 (5). http://dx.doi.org/10.1029/2009GL042154.
Tortini, R., Hilker, T., Coops, N., Nesic, Z., 2015. Technological advancement intower-based canopy reflectance monitoring: the AMSPEC-III system. Sensors 15(12), 32020–32030. http://dx.doi.org/10.3390/s151229906.
Townsend, A.R., Asner, G.P., Cleveland, C.C., 2008. The biogeochemicalheterogeneity of tropical forests. Trends Ecol. Evol. 23 (8), 424–431. http://dx.doi.org/10.1016/j.tree.2008.04.009.
van der Meer, F., 2004. Analysis of spectral absorption features in hyperspectralimagery. Int. J. Appl. Earth Obs. Geoinf. 5 (1), 55–68. http://dx.doi.org/10.1016/j.jag.2003.09.001.
Woebbecke, D.M., Meyer, G.E., Von Bargen, K., Mortensen, D.A., 1995. Color indicesfor weed identification under various soil, residue, and lighting conditions.Trans. ASAE 38, 259–269.
Wu, J., Albert, L.P., Lopes, A.P., Restrepo-Coupe, N., Hayek, M., Wiedemann, K.T.,et al., 2016a. Leaf development and demography explain photosyntheticseasonality in Amazon evergreen forests. Science 351 (6276). http://dx.doi.org/10.1126/science.aad5068.
Wu, J., Guan, K., Hayek, M., Restrepo-Coupe, N., Wiedemann, K.T., Xu, X., Wehr, R.,Christoffersen, B.O., Miao, G., Silva, R., Araujo, A.C., 2016b. Partitioning controlson Amazon forest photosynthesis between environmental and biotic factors athourly to interannual timescales. Glob. Change Biol. http://dx.doi.org/10.1111/gcb.13509.
Xu, L., Samanta, A., Costa, M.H., Ganguly, S., Nemani, R. R., Myneni, R.B., 2011.Widespread decline in greenness of Amazonian vegetation due to the 2010drought. Geophys. Res. Lett. 38(7), n/a–n/a. http://dx.doi.org/10.1029/2011GL046824.
Yang, X., Tang, J., Mustard, J.F., 2014. Beyond leaf color: comparing camera-basedphenological metrics with leaf biochemical, biophysical, and spectral propertiesthroughout the growing season of a temperate deciduous forest. J. Geophys.Res.: Biogeosci. 119, 181–191.
Zelazowski, P., Sayer, A.M., Thomas, G.E., Grainger, R.G., 2011. Reconciling satellite-derived atmospheric properties with fine-resolution land imagery: insights foratmospheric correction. J. Geophys. Res. 116 (D18), D18308. http://dx.doi.org/10.1029/2010JD015488.