isps working paper isps17-22 zack cooper, yale university
TRANSCRIPT

Surprise! Out-of-Network Billing for Emergency Care in the United States
ISPS Working Paper
September 2019
ISPS17-22
Zack Cooper, Yale University and NBER
Fiona Scott Morton, Yale University and NBER
Nathan Shekita, Yale University

Surprise! Out-of-Network Billing for Emergency
Care in the United States⇤
Zack Cooper, Yale University and NBERFiona Scott Morton, Yale University and NBER
Nathan Shekita, Yale University
September 2019
Abstract
Hospitals and physicians independently negotiate contracts with insurers. Asa result, a privately insured individual can be treated at an in-network hospital’semergency department, but receive care and potentially a large, unexpected billfrom an out-of-network emergency physician working at that facility. Becausepatients do not choose their emergency physician, emergency physicians can remainout-of-network and charge high prices without losing significant patient volume inthe short-run. We illustrate that this strong outside option improves emergencyphysicians’ bargaining power with insurers. We observe that a leading, nationalphysician staffing company uses out-of-network billing as tool to generate profits.The firm offers substantial compensation to hospitals for allowing them to billout-of-network from their facilities. Finally, we analyze a New York State lawthat introduced binding arbitration between emergency physicians and insurersand therefore weakened physicians’ outside option in negotiations. We observethat the New York law reduced out-of-network billing by 56 percent and loweredin-network emergency physician payments by 14 percent.
JEL codes: I11, I13, I18, L14
⇤Acknowledgements: This project received financial support from the National Institute for
Health Care Management Foundation, the Laura and John Arnold Foundation, the University ofToulouse, and the Tobin Center for Economic Policy at Yale University. We benefited tremendouslyfrom feedback from the editor and three anonymous referees. We also received helpful comments fromStuart Craig, Leemore Dafny, Neale Mahoney, Chima Ndumele, and Amanda Starc. We appreciate theexcellent research assistance provided by Eugene Larsen-Hallock, Charles Gray, Emily Gudbranson,Harriet Jeon, Lachi Singh, Hao Nguyen, and Mark Thomas. All mistakes are our own. The authors’email addresses are: [email protected], [email protected], and [email protected].
1

1 Introduction
Each year, there are 41.9 emergency department (ED) visits per 100 people in theUnited States (US) (Rui, Kang, and M 2013). When patients access EDs, they areconsuming an indivisible package of care that includes hospital and physician services.However, what most privately insured patients do not realize is that hospitals andphysicians in the US independently negotiate contracts with insurers. As a result, itis possible for a patient to choose a hospital ED that is in-network with his insurer,but receive care and a subsequent large bill from an unavoidable ED physicianworking at the hospital who is out-of-network with his insurer. This exposes patientsto significant financial risk.
The pricing of ED physician services is problematic because patients have littlescope for knowing the network status of ED physicians before entering the hospital,and once patients make a decision over which hospital to attend, have no choiceover which ED physician treats them once care has been initiated. As a result, EDphysicians need not set their prices in response to patient demand. Ultimately, thepractice of out-of-network billing from inside in-network hospitals undercuts thefunctioning of health care labor markets and reduces social welfare. In this paper,we describe where out-of-network billing occurs, why it persists, and explore policyoptions to address the issue. Out-of-network billing is both an immediate policyconcern and provides an illuminating demonstration of the economics of insurerphysician bargaining. In particular, this paper illustrates how shifting a physician’soutside option and disagreement payoff changes the negotiated payments they receivefrom insurers.
The financial harm patients face when they are treated by an out-of-networkphysician can be substantial. When a physician is out-of-network, she bills for andattempts to collect her “charges,” which are not competitively determined. In manyinstances, when a patient is treated by an out-of-network physician, insurers will onlypay physicians a portion of their out-of-network charges. This leaves the physicianto attempt to collect the difference between her charges and the insurer’s payment(the balance) from the patient (so-called balance or surprise billing). These balancebills can be hundreds or thousands of dollars and have been well documented in thepopular press (see, for example, Rosenthal 2014a; Rosenthal 2014b; Sanger-Katzand Abelson 2016). Moreover, even in instances when an insurer pays the entiretyof a physician’s out-of-network charges, those higher payments will be passed ontoconsumers through higher premiums and cost sharing. Given that nearly half of
2

individuals in the US do not have the liquidity to pay an unexpected $400 expensewithout taking on debt, these out-of-network bills can be financially devastating toa large share of the population and should be a major policy concern (Board of theGovernors of the Federal Reserve System 2016).
ED physicians’ ability to bill out-of-network also has the potential to raise thecosts of all in-network emergency care. The prices of health care services deliveredto privately insured individuals in the US are set via bilateral negotiations betweenhealth care providers and health insurers. The incentives facing ED physicians tojoin insurers’ networks differ markedly from the incentives facing most other non-ED physicians. Traditionally, physicians (e.g. orthopedic surgeons and internists)face a price-volume tradeoff when deciding whether to join an insurer’s network.An orthopedic surgeon can, for example, refuse to join all insurers’ networks andbill her patients for her charges. However, many patients will not seek treatmentfrom a physician who is out-of-network because of the additional cost they wouldincur. Alternatively, the orthopedic surgeon could join insurers’ networks, whichwill increase the physician’s demand, but in exchange for that demand, the insurerswill require a price concession. In this way, physicians in high demand or with fewsubstitutes are able to command higher prices, a characteristic of functioning labormarkets. By contrast, because they are part of a wider bundle of hospital careand cannot be avoided once the hospital choice is made, ED physicians (and otherspecialty physicians like radiologists, pathologists, and anesthesiologists) face fairlyinelastic demand from patients in the short-run. Because patients will struggle toavoid out-of-network ED doctors working from in-network hospitals (in the extreme,a patient transported via ambulance has almost no choice over their provider), EDphysicians will not see a significant reduction in their patient volume if they fail tonegotiate contracts with insurers.
The ability to stay out-of-network and charge high prices with little impacton quantity might suggest that we should observe zero in-network ED physicians.However, as we discuss, physicians can incur significant costs when they bill out-of-network, such as an intrinsic dislike of the practice and the costs of collecting bills.Theory predicts that the availability of a lucrative outside option (e.g. the ability tobill out-of-network without losing significant patient volume) will give ED physiciansbargaining leverage that will allow them to obtain higher in-network payment ratesrelative to what other physicians who cannot readily bill out-of-network are paid.1
As a result, physicians can use the threat of out-of-network billing to raise their1For a description of this result, see Osborne and Rubinstein (1990)
3

in-network payments and avoid the added costs of being out-of-network. Thesehigher payment rates, caused not by supply or demand but rather by the abilityto “ambush” the patient, represent a transfer from consumers to physicians, andbecause ED care is so common, raise overall health spending.
In this paper, we analyze data from a large insurer that covers tens of millionsof lives annually to study where and why out-of-network ED billing occurs. We alsouse our analysis of ED billing in the US to illustrate how a strong outside optionimproves a party’s negotiating power. Finally, we test empirically whether a policypursued in New York State that limited ED physicians’ ability to bill out-of-network(and hence lowers their disagreement payoff) reduces the frequency of out-of-networkbilling and lowers ED physicians’ average in-network payments.
We begin by assessing the distribution of out-of-network billing for ED careacross hospitals in the US. Previous work has found that approximately a fifth ofprivately insured patients treated at in-network hospital EDs were treated by out-of-network ED physicians (Cooper and Scott Morton 2016; Garmon and Chartock2016). However, we illustrate that looking at national or regional averages of out-of-network is uninformative because out-of-network billing is concentrated in a smallnumber of hospitals: 71 percent of hospitals have out-of-network billing prevalencebelow 20 percent while 15 percent of hospitals have out-of-network billing prevalenceabove 80 percent. Out-of-network physicians in our data charge, on average, 637percent of what the Medicare program would pay for identical services. Consistentwith predictions that a strong outside option should give ED physicians strongernegotiating power over in-network rates, we find that ED physicians in our data arepaid in-network rates of 266 percent of Medicare payments, which is higher thanmost other specialists (for reference, in our data, in-network orthopedic surgeonsare paid 178 percent of Medicare rates for performing hip replacements).
Approximately two-thirds of hospitals in the US outsource the staffing of theirEDs to physician management firms that hire and manage physicians, manage EDoperations, and take care of billing (Deutsche Bank 2013). There is anecdotalevidence that physicians and national physician staffing companies are using out-of-network billing as a tool to generate profits. We analyze the behavior of thelargest ED outsourcing firm in the US – EmCare – to understand how the firmuses the strong outside option ED physicians possess to influence their negotiationswith insurers. We find that EmCare uses the power of their outside option toraise revenues when they take over new contracts with hospitals. We observe thatwhen the firm enters into a new contract to manage a hospital’s ED services, they
4

immediately exit insurer networks, bill as out-of-network providers, and seek tocollect their charges (which they double relative to the charges billed by the priorphysician group in that hospital).
What hospitals would allow physician groups working inside their facilities toengage in an out-of-network billing strategy given that it both exposes patients tofinancial risk and exposes hospitals to reputational harm? Newhouse (1970) positedthat hospitals trade off patient and community benefit with profits. Since a hospitalultimately controls which physician groups staff their EDs, hospitals that allowout-of-network billing must be receiving transfers of value from those out-of-networkED physician practices that offset the reputational costs the hospitals incur from out-of-network billing occurring. Likewise, hospitals that allow ED physician practicesthat bill out-of-network to work from inside their facilities must put more weight onprofit relative to patient welfare than hospitals that do not.
Consistent with these predictions, we estimate that EmCare offers hospitals thatallow them to bill out-of-network $2 million or more in transfers annually. Thesetransfers come via lowering the fees they charge hospitals to staff their facilities,allowing hospitals to share the profits they make from physician billing, and alteringthe the clinical practice of their physicians in ways that are advantageous to thehospital (for example, we observe that after EmCare physicians took over EDs,they ordered more imaging studies and admitted patients to the hospital at higherrates, which both generated additional hospital revenue). Note that in 2012, averageprofits per hospital in the US were $12.9 million (Becker’s Hospital Review 2014).As a result, the transfers that EmCare make constitute a 15.5 percent increase inhospital profits. Moreover, consistent with theory, we find that for-profit hospitalsare significantly more likely to contract with EmCare than non-profit or governmentfacility.
Out-of-network bills are irksome for consumers (historically, they were the numberone health insurance complaint to the New York Department of Financial Services),expose patients to financial risk, and raise the total cost of health care services(New York State Department of Financial Services 2012). Policy-makers at the stateand federal level are now exploring a range of policy options to protect consumersand restore a competitively set price for ED physicians’ payments (Lucia, Hoadley,and Williams 2017; Cassidy 2018; Hassan 2018). We finish by testing the impactof a 2014 law in New York that introduced baseball rules arbitration to settle theout-of-network billing disputes between physicians and insurers. Under the NewYork law, patients were only exposed to in-network cost sharing if they saw an
5

out-of-network ED physician and physicians were prohibited from balance billingpatients. In addition, to address contested bills, the state created a binding processwhere an arbitrator could select between the original offer made by the insurer andthe original bill sent by the physician. This policy therefore weakened the outsideoption of ED physicians by constraining what they could receive if they billedout-of-network. We find that the New York State policy reduced out-of-networkbilling by 56 percent and lowered in-network ED physician payments in the state by14 percent.
Ultimately, this paper makes two contributions to the literature. First, we analyzethe drivers of out-of-network billing in the US, quantify the extent the issue raisestotal health care costs and harms consumers, and test one state’s efforts to addressthe issue. Second, we demonstrate how the strength of a party’s outside optionsinfluences negotiations. We show three pieces of evidence which illustrate thatimproving physicians’ outside options and disagreement payoffs in their negotiationswith insurers lead to higher in-network payments. These results are thereforeinformative about broader physician/insurer bargaining.
Going forward, this paper is structured as follows. Section 2 gives backgroundon ED care in the US and describes the impact of surprise out-of-network billingon patients. In Section 3, we outline the incentives of physicians and hospitals toengage in out-of-network billing. We describe our data and analytic approach inSection 4. In Section 5, we identify the factors associated with out-of-network billing,analyze the impact of the entry of EmCare on out-of-network billing prevalence, andanalyze the transfers EmCare makes to hospitals where they enter into contracts.In Section 6, we assess the impact of a law passed in New York that was designed toto protect consumers from surprise bills. We conclude in Section 7.
2 Background
2.1 The Evolution of Emergency Medicine in the United States
From the 1970s through the 1990s, care in hospital-based EDs shifted from beingprovided on an ad hoc basis by community physicians to being delivered, round-the-clock, by doctors who often completed emergency medicine residencies and obtainedboard-certification in the specialty (Institute of Medicine 2006).2 At present, there
2Many EDs are not staffed by board-certified ED physicians. Approximately a third of emergencycare is provided by family physicians. In rural states, the share of family physicians delivering
6

are more than 4,500 EDs in the US and approximately 40,000 physicians who staffthem nationwide (Hsia, Kellermann, and Shen 2011; Morganti et al. 2013). The useof EDs has risen dramatically over time. From 1993 to 2003, the US populationgrew by 12 percent, hospitalizations increased by 12 percent, and ED visits increasedby 26 percent (Institute of Medicine 2006). From 2001 through 2008, the use ofEDs increased 1.9 percent each year—60 percent faster than concurrent populationgrowth (Hsia, Kellermann, and Shen 2011).
Over the last several decades, EDs have become one of the main pathwaysthrough which patients are admitted to the hospital (Morganti et al. 2013). From1993 to 2006, the share of all inpatient stays in which patients were admitted tothe hospital via an ED increased from 33.5 percent to 48.3 percent (Schuur andVenkatesh 2012). Over time, as the use of EDs has gone up, waiting times to betreated in EDs also increased (Hing and Bhuiya 2012). In response to rising waitingtimes, EDs are now increasingly are competing on the length of time patients have towait before they are treated (Esposito 2015; Rice 2016). Because EDs have become amajor source of patients, hospitals now want to keep their EDs open at all hours andrun them efficiently (Institute of Medicine 2006; Morganti et al. 2013). As a result,there has been a marked increase in the outsourcing of management of hospital EDs.ED outsourcing companies hire and manage physicians, manage ED operations, andtake care of billing and collections. At present, roughly 65 percent of the physicianmarket is outsourced (Deutsche Bank 2013). Among the hospitals that outsourcetheir services, approximately a third contract with a large, national outsourcingchain and the remainder are outsourced to smaller, local firms (Dalavagas 2014).
The national market for physician outsourcing is dominated by two firms, EmCareand TeamHealth, that collectively account for approximately 30 percent of theoutsourced physician market (Deutsche Bank 2013). Both firms were publicly tradeduntil they were taken private by large private equity firms. EmCare was publiclytraded until 2018 when it was bought by KKR & Co. Inc. It operates in 45 states, has23,100 affiliated or employed physicians and health care professionals, and accordingto their 2016 Form 10-K, delivers more than 18 million emergency episodes per year.More recently, EmCare has partnered with a large, for-profit hospital chain andformed joint ventures where the firm and its hospital partners share in profits fromphysician bills (Deutsche Bank 2013). TeamHealth is approximately the same size.It was publicly traded until 2016, when it was purchased by the Blackstone Group.
emergency care is higher than 50% (Wadman et al. 2005; Groth et al. 2013; McGirr, Williams, andPrescott 1998).
7

In the aggregate, ED care is profitable for hospitals. Wilson and Cutler (2014)estimated that average ED profit margins are approximately 7.8 percent per patient.However, the profit margins that hospitals face for ED care vary significantlydepending on how a patient’s care is funded and based on whether a patient isadmitted to the hospital. Wilson and Cutler (2014) found that hospitals had profitmargins of 39.6 percent for privately insured patients treated in EDs, whereas theprofit margin for patients covered by Medicare, covered by Medicaid, and thoseuninsured were �15.6 percent, �35.9 percent, and �54.4 percent, respectively. Theyalso found that patients who were admitted to the hospital were significantly moreprofitable than those who were not. For Medicare patients, the profit margin onED care for patients who were discharged from the ED was �53.6 percent whereasthe profit margin for patients who were admitted to the hospital was 18.4 percent(Wilson and Cutler 2014).
2.2 Out-of-Network Surprise Billing
There has been significant coverage of out-of-network billing in the popular press(Rosenthal 2014a; Rosenthal 2014b; Sanger-Katz and Abelson 2016). However, untilrecently, there has been no systematic evidence on the frequency that out-of-networkbilling occurs. Recent survey work suggests that it is fairly common for privatelyinsured patients to be treated by out-of-network physicians. A Consumers Union2015 survey found that 30 percent of privately insured individuals reported receivinga surprise medical bill within the previous year, and Kyanko, Curry, and Busch (2013)found that most instances in which privately insured individuals involuntarily sawout-of-network providers occurred during medical emergencies. In many instances,when patients receive a surprise bill, they simply pay the balance in full (ConsumersUnion 2015). Likewise, among those who had trouble paying a medical bill, 32percent reported that their financial troubles stemmed from a bill from an out-of-network provider for services that were not covered or were only partially coveredby their insurer (Hamel et al. 2016). In this Hamel et al. (2016) survey, the authorsfound that bills from ED physicians made up the largest share of medical debt thatpatients reported having problems paying.
The results of these surveys have been confirmed by recent empirical evidence.A 2014 report found that among the three largest insurers in Texas, 45 percent,56 percent, and 21 percent of their in-network hospitals had zero in-network EDphysicians (Pogue and Randall 2014). Likewise, in the first national study of out-
8

of-network billing, Cooper and Scott Morton (2016) analyzed data from a largecommercial insurer and found that 22 percent of in-network ED hospital visitsincluded a primary physician claim from an out-of-network doctor. Using differentdata, Garmon and Chartock (2016) found that 20 percent of ED cases in whichcare was delivered to privately insured patients at in-network hospitals involved carefrom an out-of-network physician. However, as we will show below, knowing theaverage probability of receiving an out-of-network bill does not help diagnose thepolicy problem, which lies in the tail of the distribution of out-of-network billingprevalence across hospitals.
There are broadly two types of out-of-network bills. The first form of out-of-network billing results from contracting frictions between insurers and physicians.In the US, there are approximately 54,000 ED physicians, 5,500 hospitals, and over1,000 insurers (Kaiser Family Foundation 2018; American Hospital Association 2018).As a result, it is unlikely that every ED physician could have a contract with everyinsurer that covers all the patients they treated. As an example, an ED physicianin a popular vacation destination could see patients from across the country. Evenif she wanted to, this ED physician would struggle to enter into contracts withinsurers from across the country. While an out-of-state patient’s insurer might havea contract with the hospital in the area the patient is visiting, it is possible theymight not have a contract with the patient’s ED physician. In these instances, if thephysician were not engaging in a deliberate out-of-network strategy, the physicianmight accept a payment rate that is of the same magnitude as her usual in-networkpayments.
A second form of out-of-network billing occurs when physicians deliberately donot participate in insurers’ networks so that they can reap higher payments. Asthe New York State Department of Financial Services noted, “a relatively smallbut significant number of out-of-network specialists appear to take advantage ofthe fact that emergency care must be delivered and [that] advanced disclosure isnot typically demanded or even expected by consumers. The fees charged by theseproviders can, in some instances, be many times larger than what private or publicpayers typically allow, and are another source of consumer complaints” (New YorkState Department of Financial Services 2012). Indeed, a recent study found thatphysicians who tend not to be chosen by patients (anesthesiologists, radiologists,pathologists, and ED physicians) have the highest charges measured as a percentageof their Medicare payments (Bai and Anderson 2016).
When an insured patient sees an out-of-network physician, there are three
9

potential outcomes. First, the insurer may pay the physician’s out-of-network bill inits entirety. This will protect the patient, but ultimately insurers will pass the costof these higher payment rates on to all beneficiaries in the form of higher premiums.In addition, patients generally face higher co-insurance rates when they see anout-of-network provider. As a result, even if their insurer pays their physician hischarge, the patient may still face substantial cost-sharing. Second, the insurer maypay the out-of-network physician his usual and customary rate, which the insurercalculates based on average charges or average in-network payments for the servicesprovided. This payment is generally lower than the total billed amount. Whenthis occurs, the physician may accept the usual and customary rate the insurer isoffering and move on. Alternatively, the physician may pursue the patient to pay thedifference between the charge and whatever the insurer paid. This is referred to as“balance billing.” Third, the insurer may not cover the costs of out-of-network care atall, leaving the patient to pay the entire physician bill herself. As we show later fromour data, these physician bills can be extremely large. While there is no systematicevidence on the frequency that patients are balance billed by physicians, from 2012to 2015, data from the Texas Department of Insurance showed that balance-billingcomplaints in the state increased 1,000% (Gooch 2016).
2.3 EmCare and Out-of-Network Billing
There is anecdotal evidence suggesting EmCare, the nation’s largest physician staffingcompany, uses out-of-network billing as a tool to raise profits. For example, on March29, 2016, an investment advising service noted that, "What EmCare actually does istake over an in-network hospital Emergency Room that is aligned with most localhealthcare insurance plans and staff it with physicians who are out-of-network...SinceEmCare is out-of-network, it refuses to sign in-network agreements with localinsurance providers, it 1) can charge exorbitant out-of-network reimbursement ratesfrom the providers and 2) since it is out-of-network, it can "balance bill" its patientsfor the difference between its prices and the amount the insurer belies is "usual andcustomary". This is a license to print money!" (Chanos 2016)
A video of hospital administrators at Glen Rose Medical Center in Glen Rose,Texas discussing out-of-network bills also suggests EmCare uses surprise billing as adeliberate strategy (the transcript from the video is available in Appendix 1). Asthe hospital administrators state in the video, in order to get EmCare physicians tocease billing out-of-network and balance billing their patients, they would need to
10

increase their subsidies to EmCare. To that end, one of the hospital staff says, "They[the ED physician] bill out-of-network for most insurance ...and we could expandthe insurances that are covered in the ER, but it’s at a cost of about $200,000 ayear to us...[If] we require them to be in-network...then our subsidy would increasesignificantly". Later, in response to discussion of the $200,000 in additional fundsthe hospital would have to pay EmCare, another hospital administrator replies, "Wewould have to pay EmCare an additional $200,000 to put those people in-networkbecause right now billing out-of-network they’re making more money."
Envision (the parent company of EmCare) has confirmed this strategy in theirreply to an earlier draft of this paper posted on their webpage. In that reply,they state, "We dispute that ‘a hospital does not benefit directly from physiciansengaging in out-of-network billing’ (page 19). Hospitals do benefit directly whenhigher out-of-network insurance payments rather than hospital subsidies to theemergency physicians, enable the hospital to recruit, retain, and expand high-qualityboard certified emergency physicians." (Envision Healthcare 2017)
3 Incentives for Insurers, Physicians, and Hospitalsto Allow or Engage in Out-of-Network Billing
For a patient to receive a surprise bill, there are three parties that have to prefer out-of-network billing to an in-network contract: the ED physician group, the hospital,and the insurer. The physician group and insurer must be unable to come to anagreement on an in-network contract. In addition, the hospital must allow physiciansto bill out-of-network from inside their facilities.3 We discuss each party’s incentivesin turn. We more formally model these incentives in Appendix 2.
3.1 Insurers and Out-of-Network-Billing
The physician group and the insurer bargain over the price the insurer will pay thephysician for care delivered to policy holders. The insurer faces a tradeoff betweenincluding more and better physicians in its network and the higher in-networkpayments needed to make to retain those physicians in the network. The decision
3The hospital may not have legal authority to prevent a physician (or physician group) frompracticing in the ED just because that physician has failed to come to an agreement with any giveninsurer or insurers. However, we assume there are so many interactions between the hospital andan ED physician group that if the hospital disapproved of the group’s overall strategy, it couldmake the relationship sufficiently onerous such that the physicians would move in-network.
11

about how broad and how highly reputable a network of providers to create (andhow to handle out-of-network bills) is a function of the preferences of the purchasersof health insurance. Buyers of insurance might prefer a broad network of physicians,have a distaste for out-of-network bills, and therefore be willing to accept higherpremiums. On the other hand, the buyers might prefer lower premiums and bewilling to accept an insurance plan with a narrower network of providers and a higherprobability of a policy-holder seeing an out-of-network physician. In the extreme,the buyers of insurance could be willing to accept a plan with out-of-network EDphysician billing and believe it to function as a very expensive form of patientcost-sharing for accessing ED services.
When ED physicians are pursuing a deliberate strategy of billing out-of-network,insurers can face higher payments, higher transaction costs, and dissatisfied customers(e.g. those who received a balance bill). In general, absent specific out-of-networkbilling laws, the insurer’s outside option in the event of disagreement over an EDphysician’s payment is litigation or the threat of litigation under the relevant federaland state statutes. The fees physicians collect under disagreement in this settingwill therefore not be competitively set by hospital demand and physician laborsupply, but driven by the possibility of litigation over their bills as well as adversepublicity and social norms.4 By contrast, as we discuss, a number of states haveregulations that impact ED physicians’ outside option if they bill out-of-network.Some states, like California, Maryland, and Connecticut, directly regulate paymentsto out-of-network providers. Other states, like New York and Texas have eachintroduced an arbitration process between providers and insurers. Finally, there arestates that do not have surprise billing protections, but do have more general lawsagainst price gouging and similar behavior. As a result, the outside option for aninsurer of formally disputing an out-of-network charge will be differentially successfuldepending on state law. State law will impact physicians’ outside option, which willaffect the rates an insurer is willing to pay ED physicians to join its network.
3.2 Hospitals and Out-of-Network Billing
EDs serve as the front door to hospitals. The majority of admitted patients in ahospital at any given point in time were came in via the ED. As a result, hospitals
4See, for example, UnitedHealthcare Servs., Inc. v Asprinio (2015 NY Slip Op 25298) andChildren’s Hosp. Cent. Cal. v. Blue Cross of Cal., 172 Cal. Rptr. 3d 861, 872 (Ct. App. 2014) forexamples of litigation over providers’ charges. Richman et al. (2017) provides further examples oflitigation over providers’ charges.
12

need to keep their EDs open at all hours in order to retain patients. To keep their EDsrunning, hospitals must recruit staff to run their EDs and arrange with physicians toprovide care from inside their facilities. Alternatively, they can contract with an EDstaffing company to manage the entirety of their ED, including recruiting, managing,and paying physicians. However, EDs deliver significant amounts of uncompensatedcare and ED physicians regularly treat patients from whom they receive little or nocompensation (Garthwaite, Gross, and Notowigdo 2018). Because of the EmergencyMedical Treatment & Active Labor Act (EMTALA), EDs must provide care topatients in an emergency (Centers for Medicare and Medicaid Services 2018). As aresult, hospitals must typically pay physicians a fee to work from their facilities tooffset the physicians’ costs for uncompensated care and pay for the services theyprovide above and beyond their clinical practice (e.g. managing the ED).
Hospitals control which physicians or ED staffing firms they allow to workfrom inside their facilities. We assume that hospitals are aware of whether ornot physician staffing firms engage in a deliberate out-of-network billing strategy.When ED physicians bill out-of-network, the ED physicians themselves (or thestaffing firms for whom they work) benefit from higher out-of-network payments.However, the hospitals where they work do not generally receive direct benefitsfrom out-of-network ED physician billing. Indeed, when ED physicians remainout-of-network and balance bill patients, it introduces costs to hospitals, includingreputational harm.5 Therefore, for hospitals to be willing to permit physicians to billout-of-network from inside their facility, they must receive a transfer from physiciansor staffing firms equal or greater to the cost of the reputational harm they incurfrom allowing the practice to persist.
These transfers could take a myriad of forms. For example, ED staffing firmsoften demand subsidies from hospitals to staff their EDs. Physician staffing firmscould lower these subsidies in exchange for being allowed to bill out-of-network.Alternatively, ED physicians could deliver medical care in a manner that raisesrevenue for the hospital. This could include increasing imaging and lab testing rates(which raises hospital revenue) or increasing the rate that patients from the ED areadmitted to the hospital. ED staffing firms could also raise the quality of hospitalEDs, such that they attract more patients and improve the hospital’s reputation. Atthe extreme, physician staffing companies could enter into profit sharing agreementswith hospitals where the hospitals would benefit directly from the profits generated
5Historically, most media stories of out-of-network billing have cited the hospital where thepatient who received an out-of-network bill was treated (See Rosenthal 2014a).
13

by physicians’ out-of-network billing.
3.3 Physicians and Out-of-Network Billing
A physician or physician group faces a choice of negotiating in-network rates withinsurers or going out-of-network, collecting higher out-of-network payments, butincurring costs from engaging in the practice. In the longer term, they may see amodest reduction in the number of patients they treat if patients become aware oftheir out-of-network billing strategy and begin to avoid their facility. A physician orphysician group must consider the incremental profit she or the group will obtainfrom going out-of-network. In a standard market with downward-sloping demand,if a physician went out-of-network, she would experience a significant decline inthe number of patients she treats due to her higher out-of-network price that mostpatients would face. However, because we are examining ED physicians, we makethe more realistic assumption (for this setting) that demand for ED physicians isinelastic in the short-run.6 Therefore, in this setting, if the ED physician does notenter into an insurance network and seeks to collect her charges, she still obtainsroughly the quantity of patients equal to what she would receive were she in-network.As a result, we make a simplifying modelling assumption that her increase in revenue(or revenue for the ED staffing firm) is the difference between the in-network pricesand out-of-network payments she collects multiplied by the cases she performs peryear. ED staffing companies may not be able to collect the entirety of their chargesfrom all privately insured patients they treat. For example, some insurers may notpay out-of-network physicians the entirety of their charges and patients may havevarying abilities to cover balance bills. Under this scenario, the staffing companyis engaging in a form of first-degree price discrimination and seeking to collect theentirety of their charges from the patients with the ability and willingness to paythem.
Physicians likely incur costs from engaging in an out-of-network strategy. Thesecould include fixed costs, such as physicians’ own intrinsic dislike of the practice,potential peer pressure, unpleasant meetings with stakeholders, and the cost ofsoftware necessary for billing and collection. Likewise, these could include variable
6We posit that demand is inelastic in the short-run because ED physicians are not chosen bypatients and cannot be avoided. Indeed, previous studies have exploited the fact that patients donot choose ED physicians as a source of plausibly exogenous variation in work assessing the impactof seeing physicians with a greater or lower likelihood of prescribing opioids and seeing physiciansat the end of their shift (Barnett, Olenski, and Jena 2017; Chan 2015).
14

costs such as more unpleasant and time-consuming communication with patients,hospitals, and insurers, the costs of collecting on each bill, and defending againstlitigation.
Physicians will also have to compensate the hospital for allowing them to engagein out-of-network billing from inside their facilities. As we described, physicianscan compensate the hospital from their own pockets via reducing the subsidies theyrequire for managing a hospital’s ED services or entering into joint ventures wherehospitals get a portion of physicians’ profits. A less expensive but more legallyrisky option for the physician is to deliver medical care in a style that benefits thehospital. However, changes in their clinical activity that benefit the hospital (such asover-testing) could open the physician or physician groups to legal risk (e.g. claimsof fraudulent billing). As a result, the propensity to engage in these actions dependon the risk-tolerance of these physicians.7
In our setting, we think ED management firms may have greater awareness ofthe intricacies of physician payment and better understand the benefits of settinghigher charges than individual physicians operating in small group practices. In thissense, the ED management firms engage in informational arbitrage (a la Hayek).Previous work by Clemens, Gottlieb, and Molnár (2017) showed that individualphysicians and physicians in small groups tend to set commercial prices that followthe Medicare payment rates. By contrast, physicians in large group practices tendto have payment rates that are less strongly correlated with Medicare payment rates.National physician management companies will likely seek a profit-maximizing pricethat takes advantage of ED physicians’ strong outside option. One might imaginethat in equilibrium, this superior fee structure would have arrived at all hospitals.This is not the case in the US for two reasons we can identify. First, outsourcingfirms with an out-of-network strategy will not be able to enter hospitals that, becauseof their utility function, require compensation above what the physicians gain (e.g.some non-profit hospitals may place a high premium on protecting patients fromfinancial harm). Second, if out-of-network billing were pervasive, there would be anextremely high risk of regulatory backlash.8
7See, for example, a 2017 settlement between the US Department of Justice and TeamHealthover accusations the firm billed for higher and more expensive levels of medical service than wereactually performed (Department of Justice 2017). https://www.justice.gov/opa/pr/healthcare-service-provider-pay-60-million-settle-medicare-and-medicaid-false-claims-act.
8Indeed this occurred after an earlier version of this paper was posted (Marso 2017).
15

4 Data and Descriptive Statistics on Out-of-Net-work Billing
4.1 Data
Our claims data come from a large commercial insurer that covers tens of millionsof lives annually. The data run from January 1, 2011, through December 31,2015. The data are structured at the service-line level and include detailed patientcharacteristics, a provider identifier, and the ability to link to a range of third-partydatasets. We limit our analysis to episodes that occurred at hospitals registeredwith the American Hospital Association (AHA). Therefore, we do not include, forexample, treatment that was delivered at urgent care clinics.
To construct emergency episodes, we identify emergency room visits in our dataas those with a physician claim for emergency care and a facility claim with a codefor an emergency care that occurred on the same day. We identify ED claims forphysicians as those that include a CPT code of 99281, 99282, 99283, 99284, 99285,or 99291. We match those to facility claims by identifying claims delivered to thesame patient, on the same date, that include a hospital service line with a revenuecode of 0450, 0451, 0452, 0453, 0454, 0455, 0456, 0457, 0458, or 0459. The episoderuns until the patient is discharged from the hospital. We exclude episodes with alength of stay over 30 days.
At baseline, our data include 13,444,445 ED episodes. We introduce severalsample restrictions to our data to produce an analytic dataset. First, we excludeepisodes that were missing an AHA hospital ID or did not come from an AHA-identified hospital. Thus, the analysis is focused only on hospital-based ED care.This restriction eliminates 1,908,710 episodes. Second, we exclude episodes for whichthe same physician billed as in-network and out-of-network on separate service lineson the same claim form. This restriction eliminates 264,636 episodes. Third, weexclude episodes with duplicative insurer payments, episodes with insurer paymentsthat were negative, and episodes for which the insurer paid $0 because the claimswere denied. This restriction removes 217,267 episodes. Fourth, we exclude episodesfor which the start date of the episode occurs after the end date of the episode.This restriction excludes 79 episodes. Fifth, we limit our analysis to hospitals thatdelivered 10 or more episodes per year and appear in all five years of the data. Thisrestriction excludes 330,312 episodes. Sixth, we limit our analysis to individuals whohad six months of continuous enrollment before their emergency episode. Having
16

six-months of historical data is necessary to create our Charlson comorbidity scores.This restriction excludes 1,810,245 episodes from our analysis. Finally, we winsorizethe top and bottom 1 percent of the prices in our data.9 We do this to limit theinfluence of idiosyncratically high- and low-priced episodes.
In our data, we observe physician and hospital charges, the amount that theinsurer paid, and patients’ co-insurance payments, co-payments, and spending undertheir deductibles. We define the total amount an ED physician was paid as the sumof the insurer payment, the patient co-insurance payment, the patient co-payment,and the patient deductible on physician service lines that have a CPT code foremergency services. We calculate facility payments as the sum of the insurer payment,patient co-insurance, patient co-payment, and patient spending under her deductiblesummed across all facilities claims. All prices are put in 2015 dollars using the U.S.Bureau of Labor Statistics Consumer Price Index.
Unfortunately, we do not observe whether patients were balance billed by physi-cians. Therefore, it is possible that the physician collects more in total than we canmeasure. To our knowledge, there are no datasets with information on the balancebilling of patients. However, we construct a potential balance bill measure that isthe difference between what the physician charged and what would be the medianin-network payment for that case as a percentage of Medicare payments.
In addition, we construct an indicator for whether or not imaging occurredduring an episode based on whether or not there are facility claims with revenuecodes associated with imaging studies.10 We also identify episodes as involving anadmission to the hospital if the facility claim for the episode includes a revenue codefor room and board fees.11
For each episode, we also observe the patient’s sex, age (measured in 10-year agebins), and race (white, black, Hispanic, and other). We also use our claims datato measure historical patient spending for six- and 12-month periods preceding anepisode. Because we do not want the emergency episodes we are analyzing to feedinto the historical spending measures, we measure spending from two weeks beforethe admission date for an episode back six and 12 months. In addition, we usedsix and 12 months of claims data to calculate Charlson measures of comorbidity
9Our results are robust to not winsorizing prices, but there are extremely large hospital andphysician charges and payments.
10We identified episodes that included imaging studies based on whether or not the facility claimshad a service line with the revenue codes 350-352, 610-619, 400-404, or 409.
11We identified room and board fees based on the following revenue codes on facility claims: 100,101, 103, 110-160, 164, 167, 169-176, 179, 190-194, 199-204, 206-214, 219, 658, or 1000-1005.
17

(Charlson et al. 1987).12
4.2 Identifying Where EmCare Have Contracts
EmCare bills insurers using their contracted physicians’ National Provider Identifier(NPI) numbers. As a result, our claims data do not indicate that a particular claimis being billed by a physician employed by EmCare. Moreover, the firm does notprovide a list of facilities where they have contracts. To overcome this informationgap, we use data from EmCare’s own webpage and public documents to identify thehospitals where the firm has outsourcing contracts. We require two independentsources of information to classify a hospital as a facility that outsourced its EDservices to EmCare.
Our first source of information on the hospitals where EmCare has contractscomes from the firm’s parent company, Envision. Envision posted a map on theirwebpage that included dots marking the location of hospitals where the firm hadcontracts (see Appendix Figure A.1). To identify hospital locations on the Envisionmap, we scraped the map using mapping software from ArcGIS to identify thelatitude and longitude of the centroid of each point on the map.13 We then matchedthe latitudes and longitudes of these centroids to data on hospital locations from theAHA. We assumed that the AHA registered hospital that was the shortest Euclideandistance to the centroid of each point on the Envision map was an EmCare contractedhospital.
The second source of information we use to identify hospitals that contract withEmCare is job advertisements posted by the firm. EmCare posts job advertisementson their webpage to recruit physicians to work at their care locations (see an examplein Appendix Figure A.2). The job advertisements include the name of the hospitalwhere physicians are being recruited and the specialty of the physicians the hospitalis looking to hire. We scraped the names of the hospitals and the specialty of thephysicians being recruited from all EmCare’s job postings and webpage histories.This allowed us to create a roster of hospitals where EmCare was recruiting ED
12We pooled individuals with a Charlson score of 6 and higher.13To obtain the latitudes and longitudes of the hospital locations displayed on the map, we
utilized georeferencing within ArcMap. This technique aligns a map with a known coordinatesystem to the map of interest (which has no identified coordinate system). After transforming andoverlaying the two aligned maps, we then obtain coordinate estimates of each marked hospitalwithin a reasonable range of accuracy. While it has since been removed, embedded in the code forthe webpage were the latitudes and longitudes of centroids of each point on the map. We matchedthe latitudes and longitudes from the Envision webpage to the latitudes and longitudes we obtainedusing ArcMap to validate our analysis.
18

physicians between 2011 and 2015.Ultimately, we regard a hospital as having a contract with EmCare if we are able
to identify the hospital on a map from their webpage and found a job hiring postwhere an ED physician was being recruited. This strategy exploits the fact that, ingeneral, EmCare wholly takes over an ED and participates in exclusive contractswith hospitals (Deutsche Bank 2013). Using this strategy, we identify 212 hospitalsaffiliated with EmCare. As a result, of the 3,345 hospitals in our analysis that meetour sample criteria, 6.3 percent outsource their ED to EmCare. Based on investorreports on EmCare, our sample of hospitals with contracts with EmCare representsa modest under-count of the total population of hospitals that have contracts withEmCare.
We also use the entry and exit of EmCare into and from hospitals to estimatethe causal effect that entry and exit of the firm have on out-of-network billingprevalence, physician pricing, and hospital behavior. We relied on three strategiesto find hospitals where EmCare entered. First, we searched the firm’s webpage forpress releases announcing new contracts. Second, we used LexusNexus and Googleto search the popular press for news stories that announced when EmCare enteredor exited a hospital ED. Third, we called all hospitals where we observed EmCaremight have had a contract based on our map analysis and scrapes of their job hiringpages, spoke to the staff at the ED, and inquired about when EmCare entered intoa contract with the hospital ED.14 All told, as we illustrate in Table 1, we identified36 hospitals where EmCare entered from 2011 to 2015 and 3 where EmCare exiteda contract.
5 Out-of-Network Billing, Physician Prices, and Hos-pital Outsourcing
5.1 Descriptive Statistics on ED Physician Payments and Out-of-NetworkBilling Prevalence
Our final dataset is composed of 8,913,120 ED episodes that occurred between Jan-uary 1, 2011 and December 31, 2015 (see Table 2).15 This represents approximately
14We made three attempts to reach staff at each hospital. If we were not given the precise dateof entry, we used the middle date of the time unit we were provided. For example, if we were toldentry occurred in 2012, we assumed entry occurred on June 1, 2012.
15Seventy-seven percent of individuals with an ED episode had insurance from an administrativeservices only (ASO) insurance product and the balance had coverage from fully insured plans.
19

$28 billion in emergency spending. The mean in-network ED physician paymentacross our sample period was $320.62 (266 percent of what the Medicare fee-for-service program paid for the same services) (Table 2). The amount ED physicianswere paid increased as a percentage of Medicare over our time period. During thisperiod, patient out-of-pocket costs for emergency care also steadily increased andthe mean total out-of-pocket cost for an emergency episode (combining the physicianand facility component) in our data was $458.69. Over 99 percent of ED cases in ourdata occurred at an in-network hospital. Appendix Table A.1 includes descriptivestatistics for our analytic sample of ED episodes.
At the mean in-network hospital in our data, 25.8 percent of patients treated inthe ED were treated by an out-of-network ED physician (Table 2). The frequencythat patients at in-network hospitals were treated by out-of-network ED physicianshas declined over time from 28.6 percent in 2011 to 21.9 percent in 2015. However,this average masks significant heterogeneity in out-of-network billing prevalenceacross hospitals and is somewhat misleading. Figure 1 shows the distribution ofout-of-network billing prevalence across hospitals in our data in 2015 and summarystatistics for that year. It illustrates that out-of-network billing is highly concentratedin a small group of hospitals. As we illustrate, 50 percent of hospitals have out-of-network billing prevalence of approximately one percent. By contrast, the out-of-network billing prevalence for hospitals in the 75th percentile of the distribution ofout-of-network billing prevalence was 28 percent and 15 percent of hospitals haveout-of-network prevalence of higher than 80 percent. This skewed distribution isevident in 2011, 2013, and 2015 (see Appendix Figure A.3).
5.2 Cross-Sectional Analysis of Hospitals’ Out-of-Network Billing Preva-lence
To assess the factors associated with the variation in hospitals’ out-of-network billingprevalence, we follow the approach of Finkelstein, Gentzkow, and Williams (2016)and run a least absolute shrinkage and selection operator (Lasso) regression on arange of hospital, local area, physician market, and hospital market characteristics(a complete list and descriptions of the variables that we include in our first-stageLasso are available in Appendix 3). We also include an indicator variable for whetheror not EmCare had a contract with the hospital. The Lasso method applies apenalizing parameter to the coefficient of the explanatory variables included in theregression. We use 10-fold cross-validation to choose the penalizing parameter that
20

minimizes the mean squared error. We use this Lasso procedure to select a set ofvariables that we include in a second stage where we determine their conditionalcorrelations with hospitals’ out-of-network billing prevalence.
Figure 2 presents our conditional correlations between the variables selected usingthe Lasso regression and the share of patients per hospital that saw out-of-networkphysicians between 2011 and 2015 during an emergency. The results should notbe interpreted causally. In this figure, we have scaled the continuous variables sothey have a mean of zero and a standard deviation of one. As a result, the pointestimates on our continuous variables should be interpreted as the influence ofa one standard deviation change in the dependent variable. As Figure 2 shows,the presence of EmCare at a hospital is positively correlated with the hospital’sout-of-network billing prevalence. We also obseve that areas with more physiciansper capita have lower prevalence of out-of-network billing. Out-of-network billing isalso less common at non-profit hospitals, government hospitals, teaching hospitals,and hospitals with higher amounts of technology. There is more out-of-networkbilling in high population counties and regions with more economic inequality.
5.3 Causal Estimates of the Effect of EmCare Entry on Hospitals’ OONPrevalence
Our cross-sectional results suggest that out-of-network billing is significantly higherat hospitals that outsource their ED to EmCare. In this section, we estimate thecausal effect that the entry of EmCare had on the likelihood patients were treated byout-of-network physicians working from in-network hospitals. To do so, we exploitevidence we collected from press releases, news stories on the firm’s webpage, articlesin the popular press announcing the timing of EmCare contracts, and our phonecalls to hospitals to identify the dates and locations where EmCare entered andexited into hospital ED staffing contracts. We then compare outcomes before andafter EmCare entered and exited hospitals. In total, we analyze the entry of EmCareinto 36 hospitals between 2011 and 2015 and their exit from three hospitals duringthe same period. We estimate entries and exits separately. We begin by showingtrends in the raw data of hospitals where EmCare entered or exited a managementcontract. We follow that up with a regression-based analysis. Crucially, we observeno difference in the pre-trends of key outcomes variables before EmCare entered orexited a hospital.
In our main analysis, we estimate a hospital fixed effects model with an indicator
21

variable, EmCarei,t that takes a value of 1 on and after the date that EmCareentered a hospital and returns to zero on the dates that the firm exited hospitalsif the firm lost a contract. We also run a separate estimate for the three hospitalswhere EmCare loses a contract. Our estimation takes the form:
Yi,j,t = �0 + �1EmCarei,t + �j + ✓t + "i,j,t, (1)
where we estimate the outcomes for episode i that occurred at hospital j in month t.We also include a vector of hospital fixed effects �j and a unique month dummy, ✓t,for each month in the data. Our standard errors are clustered around hospitals. OurEmCare indicator is used to designate either an entry or exit event as we denote inthe table. For exit events, the event indicator takes a value of 1 on and after theexit event and we exclude hospitals where EmCare entered from these regressions.
We compare outcomes at hospitals where EmCare entered or exited to outcomesat three sets of control hospitals: 1) all hospitals nationally that did not have EDsmanaged by EmCare, 2) hospitals drawn from the same states where the hospitalsthat experienced entry were located but did not outsource their ED services toEmCare, and 3) hospitals that were not managed by EmCare that we matched toentry hospitals using propensity scores.16 One obvious concern with our identificationstrategy is that treated and untreated hospitals may have differences in their trendsin out-of-network billing prevalence, physician pricing, or hospital behavior prior tothe entry of EmCare. However, as we illustrate, when we plot the raw data fromour treated hospitals, there do not appear to be any changes in behavior prior tothe entry of those firms. Moreover, that we observe significant changes in hospitalbehavior when EmCare ends a contract with a hospital also is suggestive that weare estimating the effects of EmCare entry and not a hospital-specific phenomenon.
In Figure 3, we present a smoothed average using a local polynomial regressionof the monthly hospital-level out-of-network ED physician billing prevalence fromone year before EmCare entered hospitals until one year after their entrance (PanelA) and one year before EmCare exited hospitals until one year after their exit (PanelB). Because we measure the date of entry with six months of noise on either side ofthe entry event, we have put this time window in gray.
16To calculate propensity scores, we ran a logistic regression where the dependent variable wasan indicator variable that took a value of 1 if EmCare took over management of the hospital’s ED.We regressed that against hospital beds, technology, the square, cubic and quadratic forms of bedsand technology, and non-profit/for-profit status. The predicted values from this regression producea propensity score for a hospital. We then use a propensity score match to determine hospitalsmost similar to those with entry, with the condition that matching hospitals must be in the samestate.
22

EmCare enters two types of hospitals (Appendix Figure A.4). The first group(27 hospitals) has out-of-network prevalence below 90 percent prior to EmCare entry(the mean out-of-network prevalence in these hospitals prior to entry was 11 percent).The second group (9 hospitals) has out-of-network prevalence of over 90 percentbefore EmCare enters (the average out-of-network prevalence in this group is 99percent).
In Panel A of Figure 3, the raw data show a clear increase in out-of-networkbilling prevalence at hospitals with previously low out-of-network prevalence afterEmCare entered. Looking from six months prior to EmCare entry to six monthsafter, the out-of-network billing prevalence at these hospitals that previously hadlow out-of-network prevalence increases discontinuously to nearly 100 percent. Bycontrast, Panel B of Figure 3 shows that there is a marked decrease in out-of-networkbilling at the three hospitals in our sample where EmCare exited a contract almostimmediately after exit occurred.
For interested readers we present the raw, quarterly average out-of-networkprevalence by hospital at each of the 36 hospitals that EmCare entered and show thethree EmCare exited in Appendix Figure A.5.17 None of these graphs shows markedchanges in out-of-network billing prevalence before EmCare entered or exited ahospital; nearly all show that out-of-network billing prevalence increase dramaticallyin the months after EmCare takes over a staffing contract and decrease immediatelyafter they exited.
In Table 3, we show estimates of Equation (1) and identify the impact of EmCareentry and exit on hospitals’ out-of-network billing prevalence. In Column (1) of Table3, we estimate the impact of the entry of EmCare into hospitals with previously lowout-of-network prevalence (those with out-of-network prevalence below 90 percentprior to EmCare entry). These results mirror what we observe in the raw data.We observe that the entry of EmCare into these hospitals raised out-of-networkprevalence by 82.8 percentage points. In Column (2), we focus on changes in out-of-network billing prevalence at hospitals that EmCare entered that previously had highout-of-network billing prevalence. After EmCare entered, there is no statisticallysignificant change in the likelihood a patient was treated by an out-of-network
17For nearly all hospitals that had previously high out-of-network billing prevalence (PanelsBB, CC, DD, EE, FF, GG, HH, II, and JJ of Appendix Figure A.5), when EmCare entered,out-of-network billing prevalence remained high. By contrast, after EmCare entered hospitals thatpreviously had low out-of-network billing prevalence, in nearly all cases, the likelihood a patient wastreated by an out-of-network physician increased to nearly 100 percent immediately after EmCareentered the hospital (Panels A, B, C, D, E, F, G, H, I, J, K, L, M, N, O, P, Q, R, S, T, U, V, X, Y,Z, and AA of Appendix Figure A.5). We show EmCare exits in Panels KK, LL, and MM.
23

physician. This is a mechanical effect, since there was no scope for out-of-networkbilling to increase at these facilities. In Column (3), we estimate the effect of the exitof EmCare on hospitals’ out-of-network billing prevalence. It is important to notethat hospitals may have made a decision to end their contract with EmCare in orderto eliminate out-of-network billing from their facility. Nevertheless, we observe thatafter EmCare exited a hospital, the prevalence of out-of-network billing decreasedby 76.5 percentage points.18 In Appendix Table A.2, we show that these results arerobust to using alternative control groups.
5.4 The Impact of Out-of-Network Strategies on Payment Rates
These results suggest that EmCare does not negotiate with insurers and insteadutilizes its outside option and seeks to collect its charges. This increase in out-of-network billing and physician charges generated large increases in revenue forEmCare physicians. In Panel A of Figure 4, we show that after entry, EmCareraised its charges significantly. In Column (1) of Table 4, we quantify these changesand show that after EmCare entered, they more than doubled physician charges,raising them by, on average, $480.13. Our data contributor paid most of physicians’out-of-network bills. As a result, after EmCare entered, we observe that the insurerpayments to ED physicians increased by $391.89 (117 percent).
These changes also exposed patients to increased cost sharing and financial risk.Because patients typically have out-of-pocket costs that are set via co-insurance thatpays a fixed percentage of the total cost of care, patient payments (e.g. cost-sharingpayments) to ED physicians increased by $46.32 (92 percent). Collectively, weobserve that the total payments to ED physicians increased by $438.20 per case afterEmCare entered a hospital. This is a 114 percent increase in ED physician payments.These changes occurred after EmCare entered a hospital (Figure 4). Notably, aswe observe in Column (7), we do not observe a decrease in patient volume afterEmCare enters a hospital, begins billing out-of-network, and increases their charges.
While our data contributor covered most of physicians’ out-of-network charges,many insurers simply pay out-of-network providers at median in-network rates.When this occurs, physicians can bill patients for the difference between theircharges and that payment (so-called balance billing). To calculate patients’ potentialbalance bills, we create a potential balance billing measure, which is the differencebetween the physician charge for the case and what would be the providers’ median
18This result is robust to estimating Equation (1) using logistic regression
24

in-network payment for the case (219 percent of Medicare rates in our data). InColumn (5) of Table 4, we show that the entry of EmCare raised patients’ potentialbalance bills (if insurers only paid median in-network rates) by $457.21. Bills ofthis magnitude would be financially devastating to a large share of the population(Board of the Governors of the Federal Reserve System 2016). As we illustrate inPanel E of Figure 4, this change also occurred immediately after EmCare enteredhospitals.
The increase in physician payments was generated by price increases and substi-tution to higher acuity (and more generously reimbursed) CPT codes. In AppendixTable A.3, we show that EmCare physicians increased their charges and total pay-ments for all but the lowest acuity emergency CPT code. In addition to increasingtheir charges, EmCare physicians also increased the rate they coded ED physicianservices using the highest-intensity CPT code by 11.4 percentage points (47 percent)(Columns (6) in Table 4) and increased the relative value units (RVUs) of physiciancare they provided by 9 percent (Columns (1) in Appendix Table A.3). This increasein the use of high severity coding (and the increase in physician charges) occurredafter the firm entered (Panel F of Figure 4).19 Moreover, as we discuss and illustratelater, these changes in coding occurred for patients with both high and low historicalmedical spending and high and low medical risk. We have further discussion of theimpact of the entry of physician management companies on hospitals’ case mix inSection 5.6.
It is striking that at the three hospitals where we observe EmCare exit, thereis a reversal in all of these key outcomes after the firm’s staffing contracts ended,including a reduction in the frequency of the use of CPT code 99285. As we illustrategraphically in Figure 5, immediately after EmCare exits, there is a discontinuousdrop in physician charges, total payments, insurer payments, patient cost-sharing,and high-severity coding. Estimates of Equation (1) in Table 5 show that thesechanges are quite large and statistically significant. They show that relative to thequarter before exit occurred, total ED physician charges decrease by $645.76 (50percent), total payments decrease by $701.68 (62 percent), patient cost sharing goesdown by $68.68 (63 percent), and the the use of the highest severity CPT codedecreased by 10.3 percentage points. We also observe a modest increase in thenumber of patients treated per year.
In Section 3.3, we argued that having the ability to go out-of-network without19As we illustrate in Appendix Table A.4 and A.5, these results are robust when we use alternative
control groups.
25

seeing a sizeable reduction in the number of patients they treat gave ED physiciansa stronger outside option in negotiations with insurers. We argued that this strongeroutside option would allow them to negotiate higher in-network payments. In Table6, we show the average in-network payments in our data made to internists forperforming standard office visits and orthopedists for performing hip replacement.We observe that, on average, internists are paid 158 percent of Medicare rates(Column (1)) and orthopedists are paid 178 percent of Medicare rates (Column (2)).By contrast, the average in-network ED physician in our data is paid 266 percent ofMedicare rates (Column (3)). We posited that firms that could credibly threatento go out-of-network could negotiate higher payments. Indeed, we observe that inthe cross-section, the mean payment in our data to EmCare ED physicians (who,for the most part, do not participate in networks) is 542 percent of Medicare rates(Column (5)).20
5.5 Transfers to Hospitals To Permit Out-of-Network Billing
When physicians bill out-of-network, it creates costs for the hospitals where theywork. We hypothesized that physician management firms that use out-of-networkbilling as a strategy would have to offer transfers to hospitals to offset these costs.There are four categories of benefits that hospitals could receive from allowingED physicians to bill out-of-network network from inside their facilities. First, byallowing physicians to bill out-of-network, hospitals could receive a discount inthe fees they must pay a physician staffing company to manage their ED. As wedescribed in Section 2.3, the transcript from administrators at Glen Rose MedicalCenter discussing out-of-network billing (presented in Appendix 1) revealed EmCarewas willing to offer a $200,000 per year concession in staffing fees to the facility inexchange for allowing them to bill out-of-network.
Second, hospitals, per our findings, can get additional revenue when out-of-network physicians alter their practice styles in ways that increase hospital activity(e.g. raising hospital imaging rates or admitting patients from the ED to the hospitalat higher frequency). Our results presented in Table 7 are consistent with ourpredictions. We estimate Equation (1) and find that after EmCare entered a hospitaland began billing out-of-network for ED services, facility charges at the hospitalswhere they worked increased by $1,270.15 (17 percent) and facilities’ total paymentsincreased by $220.11 (8 percent). As we illustrate in Table 7, this increase in facility
20Appendix Table A.6 provides detailed summary statistics of ED physicians’ prices and charges.
26

payments was driven, in part, by a 1.1 percentage point (4 percent) increase in theprobability that a patient received an imaging procedure (Column (5)) and a 1.7percentage point (22 percent) increase in the likelihood that a patient was admittedto the hospital.21 As we illustrate in Panel F of Figure 6, this increase in admissionsis visible in the raw data and occurred after EmCare entered a hospital. As weillustrate in Table 8 and Figure 7, it is striking that almost all of these changes infacility activity reverse in the three cases where we observe EmCare exit from ahospital.
The modal ED treats approximately 20,000 privately insured patients per year,so the $220.11 increase in hospital payments per case would generate an annualincrease in revenue of approximately $4.4 million per hospital (= 20,000 * $220.21)(HealthLeaders Media 2016). Wilson and Cutler (2014) estimated that privatelyinsured patients have a profit margin for hospitals of 39.6 percent. Taken together,this suggests that each hospital that outsourced its ED to EmCare should make atleast an additional $1.7 million per year (= $4.4 million * 0.396) in profit from thechanges in the way out-of-network physicians practice. Note that since this estimatedoes not capture profits from changes in medical care for Medicare or Medicaidbeneficiaries, our estimate represents a lower bound on the returns a hospital couldreceive from clinical practice changes made by EmCare physicians.
Third, EmCare is increasingly entering into joint ventures with hospitals wherehospitals can share in the profits of EmCare physicians (Luthi 2019). For example,according to a 2013 Deutsche Bank report, the EmCare joint venture with theHospital Corporation of America "offers 50/50 profit sharing above a certain marginthreshold, which we believe is in the 13 percent range." (Deutsche Bank 2013). Wefound that, on average, EmCare physicians generated $438.20 in physician paymentsper case. If EmCare were to treat 20,000 privately insured patients per year in ahospital, this would generate $8.8 million in revenue annually across all privatelyinsured patients (= $438.20 * 20,000). If we made a conservative assumption thathospitals in a joint venture with EmCare made a 1 percent profit on this physicianrevenue, this would generate an additional $87,640 for the hospital each year (=$8.8 million * 0.01). Again, this estimate is a lower bound, since it does not reflectprofits on Medicare beneficiaries.
Finally, EmCare could potentially bring efficiency gains to the hospitals wherethey gain contracts via lowering the costs of running EDs. EmCare touts that
21As we illustrate in Appendix Tables A.7 and A.8, these results are robust to using other controlgroups. Our results are also qualitatively similar when we restrict our analysis to episodes that didnot involve an inpatient admission.
27

they manage the staffing, physician recruiting and billing.22 These could result inadditional savings to hospitals.
These estimates suggest that outsourcing emergency services to EmCare conser-vatively brings each hospital approximately $2 million per year in additional annualprofits (= $200,000 + $1.7 million + $87,640). For reference, the average hospitalin the US in 2012 had a revenue of $164.3 million per year and made a profit of$12.9 million (Becker’s Hospital Review 2014). As a result, ED outsourcing wouldincrease the average hospital’s profits by 15.5 percent (= $2 million/$12.9 million).These gains must be offset against the costs of allowing a firm like EmCare to workfrom inside their facility. As we discussed in Section 3.2, these costs would includeany reputational harm the hospital would incur if it was discovered that they wereallowing out-of-network billing at their facility and their inherent dislike of exposingtheir patients to financial risk.
Ultimately, a hospital would outsource their ED services to EmCare if theadditional $2m in profit they received from each year from outsourcing exceeded thesum of the reputational costs they incurred from contracting with the firm and thecost of their inherent distaste for exposing their patients to risk. As a result, wewould expect that for-profit hospitals, which likely put a higher weight on profitsthan would government or non-profit facilities, to be more likely to contract withEmCare. In Table 9, we present the characteristics of hospitals in our sample thatdid and did not contract with EmCare. We find that across all hospitals that meetour sample restrictions, 61 percent are non-profit, 19 percent are for-profit, and20 percent are government owned. Consistent with our predictions, 45 percent ofhospitals where EmCare has a contract are for-profit facilities. Hospitals in areaswith lower numbers of physicians per capita are also more likely to contract withEmCare.23
5.6 Robustness Checks
It is possible that the entry of EmCare led to subsequent changes in the case mix ofpatients that the hospitals treat. Indeed, EmCare advertises that a benefit of theirservice is that they shorten ED waiting times (Cantlupe 2013). With shorter waitingtimes, hospitals could potentially attract healthier patients who would have otherwisereceived treatment at urgent care centers. Likewise, on EmCare’s webpage, EmCare
22See EmCare webpage, https://www.emcare.com/.23As we show in Appendix Table A.9, hospitals that contract with EmCare before 2011 have
similar characteristics to hospitals where we observe the entry of EmCare between 2011 and 2015.
28

has also highlighted its excellence in improving the treatment of complex cases,such as stroke care (EmCare 2014). To the extent that this improves a hospital’sreputation, advertising and improvements in quality could allow that hospital toattract more complex patients. Any changes in the case mix of hospitals EmCareentered could explain why, after the firm entered hospitals, the rates of hospitaladmissions, the rates of imaging tests, and the rates at which physicians coded forthe most intensive services increased. Finally, EmCare could face an incentive toattract or make its patients appear riskier in order to increase the chances of thehospital where they are working becoming a trauma center. Extolling the financialbenefits of being designated a trauma center, an EmCare executive wrote, "Medicareoffers disproportionate funding to hospitals with trauma centers. Additionally, thePatient Protection and Affordable Care Act re-institute the trauma stabilizationact, which will unlock some government funding for the development of traumaprograms. On top of that, as a designated trauma center, hospitals can actually billand collect for certain activation fees that are paid by both Medicare and privateinsurance companies. Those fees can be very meaningful, sometimes more thanfunding the trauma program itself" (XXX). As the Trauma Center Association ofAmerica notes, one criteria to becoming a trauma center is having minimum numbersof high severity patients.
In Appendix Table A.10, we analyze the impact that the entry of EmCare hadon the case mix of patients that hospitals treat. We find evidence that after EmCareentered a hospital, the hospital attracted a sicker mix of patients. In Columns 1 and2, we show that after EmCare entered a hospital, the six-month historical spending ofthe hospital’s patients increased by $820.39 (14 percent) and the 12-month historicalspending increased by $1,232.60 (11 percent). We also find that after the entryof EmCare into a hospital, the six-month Charlson score of patients who attendthe ED increased by 7 percent and the 12-month Charlson scores increased by 7.5percent. In Appendix Figure A.6, we show the average Charlson co-morbidity scoreand six-month historical spending levels of patients, by month, at hospitals whereEmCare entered. There is no evidence of immediate changes in these outcomes aftera change in management.
Crucially, however, we find the same changes in physician behavior and hospitalactivity at EmCare facilities appearing across patients irrespective of their healthstatus. Thus, even holding patient severity constant, we still see an increase inquantity of care delivered after EmCare enters a hospital. In Appendix Table A.11,we estimate Equation (1) using several different sample restrictions and sets of
29

controls for the health of the patients. We focus on the impact that the entry ofEmCare had on the frequency that physicians coded using the CPT code for themost intensive emergency. We find that even among patients with low historicalspending and no comorbidities, there was a substantial increase in the rate they hadepisodes that included physician claims coded using the highest intensity CPT code.In Column 1, we estimate Equation (1) with no patient controls; in Column 2, were-estimate Equation (1) controlling for patients’ age, sex, and race; and in Column 3,we control for patients’ age, sex, race, and their Charlson comorbidity score. Acrossall three estimates, the point estimate on the impact of entry on the rate of using thehighest-intensity CPT code for emergency physician visits is consistent and rangesfrom 0.114 to 0.116. In Column 4, we estimate Equation (1) and limit our analysisto patients throughout our sample who have a Charlson comorbidity score of 0 (e.g.,patients who have no comorbidities). In Column 5, we estimate Equation (1) andlimit our analysis to patients throughout our data who have a non-zero Charlsonscore. The point estimates in Columns 4 and 5 illustrate that whether or not theyhad comorbidities, patients were almost equally more likely to have physician visitscoded using the CPT code for the most intensive emergency after EmCare entereda hospital. Likewise, in Columns 6, 7, and 8, we estimate Equation (1) on thesamples of patients in the lower third ($0 to $279.60), the middle-third ($279.61to $2,033.86), and the top-third ($2,033.87 to $115,499.30) of the distribution ofhistorical six-month patient health spending. Across all three sub-samples, the entryof EmCare led to an increase in the rate patients had physician claims coded usingthe CPT code for the most severe emergency.
In Appendix Table A.12, we repeat this analysis and examine the impact of theentry of EmCare on facility spending across different samples of the data (the sumof the allowed amounts on the physician claims). We see that there was increasedfacility spending across patients with and without comorbidities and with high andlow historical spending. Likewise, controlling for patients’ comorbidities does littleto alter the impact of the entry of EmCare on facility spending. In Appendix TableA.13, we see broadly robust findings for imaging studies. After the entry of EmCareinto a hospital, patients with no comorbidities are 4 percent more likely to receivean imaging study.
Finally, in Appendix Table A.14, we analyze whether we observe higher hospitaladmission rates for patients with low historical spending and no comorbiditiesfollowing the entry of EmCare. In Column 4, we find that after EmCare entered ahospital, patients with no comorbidities were 20 percent more likely to be admitted
30
to the hospital. In Column 6, we find patients with low historical spending (e.g., lessthan $279.60 in the previous six months) were 16 percent more likely to be admittedto the hospital after EmCare took over the management of the hospital ED.
5.7 Generalizability of Our Data
Our data come from a single insurer that operates across all fifty states. Our datacapture nearly $28 billion in economic activity; thus, the sample is interesting tostudy regardless of generalizability. However, to gauge the generalizability of ourresults, we compare the out-of- network prevalence we observe to out-of-networkprevalence presented in Garmon and Chartock (2016), the only other study thatexamines the out-of-network prevalence nationally.24 Garmon and Chartock used2007 to 2014 data from the Truven Health MarketScan database. They focus onwhether patients at in-network hospitals saw any out-of-network physicians. Thismeasure is slightly different from our measure; we focus on the network participationof the primary physician in ED cases at in-network hospitals. Garmon and Chartock(2016) found that emergency cases that had an admission had out-of-network bills inone in five cases; outpatient emergency cases had out-of-network bills in 14 percentof cases. These results are similar to our results. Garmon and Chartock foundout-of-network prevalence for admitted patients in Florida, Texas, and New York of37 percent, 34 percent, and 35 percent, respectively. For those same states, when wefocus on patients with an admission, we observe out-of-network prevalence duringthe 2011 to 2015 period of 24.8 percent, 46.3 percent, and 16.1 percent, respectively.They also found, as we do, that out-of-network prevalence decrease over time.
6 Policies to Address Out-of-Network Billing
6.1 Policy Goals and Scaling the Effect of Policies to Address Out-of-Network Billing
A successful out-of-network policy should achieve two aims. First, a policy shouldprotect consumers from large, unexpected bills from out-of-network ED physicianswhom the consumers could not reasonably avoid. Second, a successful policy shouldestablish an environment in which the price that out-of-network ED physicians
24Cooper and Scott Morton (2016) is a national study, but it uses the same data used in thisanalysis.
31

are paid for their services is either competitively determined or is as close to thecompetitively determined price as possible. Addressing this currently “missing” pricewill both settle disputes between physicians and insurers over their bills and influencein-network payments by determining ED physicians’ outside option in negotiationswith private insurers.
Constraining ED physicians’ outside option could have a significant effect on totalhealth spending via reducing their in-network payments. To produce a back of theenvelope estimate of the potential savings from addressing out-of-network ED billing,consider the nation-wide average in-network payment rates orthopedic surgeonsnegotiate with the insurer that supplied our data. Orthopedic surgeons form aninteresting comparison group because, according to a recent survey, they have thehighest salaries among physicians in the US (Grisham 2017). However, whereasthe average in-network ED physician payment in our data was 266 percent of theMedicare payment rates (and the average out-of-network payment was 637 percentof the Medicare payment rates), the average in-network payments to orthopedicsurgeons for performing hip replacements during our sample period was 178 percentof the Medicare payment rates. If we assumed our policy proposal would generatecompetition that lowered ED physicians’ in-network payment levels to approximatethe in-network payment rate of orthopedic surgeons in our data (178 percent ofthe Medicare payment rates), this would lower total ED physician spending by 46percent. If we assume that private spending is one-third of total health spendingin the US and that ED physicians account for approximately 1 percent of totalprivate spending, a reasonable back of the envelope calculation would suggest thataddressing this issue would produce savings in the range of $5 billion annually.25
While these estimates ignore general equilibrium effects, they give a scale of thesavings possible via addressing out-of-network billing.
6.2 Existing State and Federal Policies to Address Out-of-Network Billing
At present, 21 states have some laws focused on out-of-network billing, and 6 of those21 have comprehensive policies that both protect consumers and include a processdetermine payments from insurers to out-of-network providers (Lucia, Hoadley,and Williams 2017). Unfortunately, state policies only apply to the 40 percentof commercially insured individuals in the US that are enrolled in fully-insured,employer-sponsored health plans (Kaiser Family Foundation 2017). Sixty percent of
25These numbers are from Morganti et al. (2013) and Hartman et al. (2017).
32

the individuals in the US with commercial insurance are enrolled in plans offeredby firms that self-insure. Because of the Employee Retirement Income Security Actof 1974, state-based protections for out-of-network policies do not apply to theseenrollees. At the federal level, protections for consumers are limited. The AffordableCare Act amended Section 2719A of the Public Health Service Act and requiredhealth plans to cover emergency services without prior authorization and irrespectiveof network status.26 Unfortunately, the provision still allows providers to balance billpatients for the difference between their charges and the insurer payment. Notably,however, two recent bi-partisan policy proposals from the Senate, if passed, wouldoffer federal protections that applied to individuals enrolled in fully- and self-insuredinsurance plans and prohibit balance billing.
Most states’ surprise billing laws include a hold harmless provision to protectpatients from financial risks (Lucia, Hoadley, and Williams 2017). These lawsstipulate that patients cannot be charged more than their usual in-network costsharing during emergencies if they see an out-of-network provider that is working atan in-network facility. However, only 9 of the 21 states with hold-harmless provisionsrestrict providers from balance-billing patients. So, while patients that saw anout-of-network provider would not be subject to higher cost-sharing rates, they couldstill be exposed to significant financial risk if physicians acted to collect the balanceof their bill from them directly.
The harder policy problem for the states is choosing the “missing” price when thereis no contract between physicians and insurers. By 2017, only 6 states (California,Connecticut, Florida, Illinois, Maryland, and New York) introduced state-specificmethods for determining how insurers should pay out-of-network ED physicians whotreat patients at in-network hospitals. In California, Connecticut, and Maryland, the“missing” price is determined via regulation. A recent Senate proposal has proposedsimilar regulated payments where the insurer is required to pay providers the averagein-network prices in the region (Cassidy 2018). However, it is extremely unlikelythat a regulated price of this sort will match the match the true competitive price forany given transaction. As soon as the regulated price set by states differs from themarket price, either the insurer or the physician will take advantage of a regulatedprice that favors them. If the regulated payment for providers’ out-of-network billsis greater than the expected in-network price, ED physicians will be reluctant tojoin networks. Likewise, if the regulated payment is below expected in-network
26The law requires that health plans pay providers a "reasonable amount," which is defined asthe greatest of 1) the median in-network rates; 2) Medicare rates for emergency services; or 3)usual and customary payments (Public Health Service Act 2018; Keith 2018).
33

rates, insurers will not want to form networks (see, for example, recent experiencein California described in Duffy (2019).
In Florida, Illinois, and New York, in addition to prohibiting patients from beingbalance billed, the states introduced an arbitration process to determine insurerpayments in the event that insurers and providers cannot reach a resolution onpayments in cases when an ED physician is out-of-network. Likewise, a recentbill sponsored by Senator Maggie Hassan of New Hampshire also introduces anarbitration process (Hassan 2018). New York’s law, passed on April 1, 2014, is themost ambitious in the nation to date. The law has two components. The first isa hold harmless provision that prohibits balance billing and requires patients whoare treated by an out-of-network physician to pay no more than what they wouldhave paid in cost sharing should the physician have been in-network. The secondcomponent is an arbitration process to determine what providers are paid when theytreat a patient and do not participate in the patient’s insurer’s network. The law alsostipulates that insurers must develop reasonable payment rates for out-of-networkcare, illustrate how their out-of-network payments were calculated, and show howthey compare to usual and customary rates (Hoadley, Ahn, and Lucia 2015).27
In practice, under this law in New York, when a patient is seen out-of-network,the insurer makes its payment to the provider. If the out-of-network providerdoes not accept the payer’s offer, the provider can initiate an independent disputeresolution process. The independent dispute resolution process is judged by practicingphysicians who use baseball rules arbitration. The arbitrator can stipulate thatthe provider will be paid the insurer’s original payment or alternatively select theprovider’s original charge. Ultimately, this policy disadvantages providers thatbill for unreasonably high charges and punishes insurers that offer unreasonablylow initial payments. The law also encourages physicians and payers to negotiateindependently and avoid arbitration. Technically, the law applies only to fullyinsured insurance products, as states cannot regulate ASO plans (which account forthe majority of privately insured products in the US) (Kaiser Family Foundation2017). However, because most providers are unaware of a patient’s plan funding,their billed amount is likely chosen to reflect the possibility of arbitration.
This type of arbitration process shifts the outside option for physicians when theynegotiate their in-network payments. Under the New York law, physicians cannotbalance bill patients or collect their inflated charges from insurers. As a result, the
27Usual and customary rates are defined in the New York State law as the 80th percentile ofcharges based on the Fair Health database, which captures physician charges in the states for mostmedical procedures.
34

2014 New York law should both reduce the prevalence of out-of-network billing(since it is no longer as profitable a strategy) and impact in-network payments (vialowering ED physicians disagreement payoff). We take these propositions to the databy testing the impact of New York State’s 2014 surprise billing on out-of-networkbilling rates and the level of physicians’ in-network payments.
6.3 Analyzing the Impact of New York State’s Law
As Appendix Table A.15 shows, our data include 323,936 ED episodes delivered atNew York hospitals between 2011 and 2015, which captures approximately $1 billionin emergency health care spending. In addition, 90.2 percent of the patients in ourdata in New York are in ASO products. To test the impact of the New York Statelaws, we run a difference-in-difference regression and compare New York hospitals’out-of-network prevalence, physician in-network payment rates, and facility paymentrates before and after the passage of the out-of-network legislation to outcomes inhospitals in 21 control states that had no out-of-network protections and did notintroduce out-of-network protections from 2011 to 2015.28 To do so, we estimate:
Yi,h,t = �0 + �1NYh + �2Post t + �3NYh ⇤ Post t + �h + µt + "i,h,t, (2)
where the dependent variable is our outcome of interest for patient i, treated athospital h, in quarter t. We include an indicator for whether a hospital is locatedin New York. This is our treatment variable and it takes a value of 1 for all timeperiods if a hospital is located in New York (e.g. is in our treated group). Post t takesvalue of 1 for all periods from April 1, 2014, onward, after New York State passedits out-of-network billing laws. Our �3 coefficient is the coefficient of interest andcaptures the interaction between our treatment variable (that a hospital is locatedin New York) and our post variable, which is turned on after the out-of-networkbilling law was passed.
We take two approaches to calculating our standard errors. First, we presentstandard errors that are clustered around hospitals. However, because we arecomparing treatment effects in one state (New York) to outcomes in 21 control
28Our control group contains 21 states: Alabama, Arizona, Arkansas, District of Columbia,Georgia, Kansas, Kentucky, Louisiana, Michigan, Minnesota, Missouri, Nebraska, Nevada, Ohio,Oklahoma, Oregon, South Carolina, Tennessee, Virginia, Washington, Wisconsin. This based onanalysis by Lucia, Hoadley, and Williams (2017). We also exclude nine states from our controlgroup that had fewer than 5000 episodes of ED care annually. Our results, however, are robust toincluding these states.
35

states, there are concerns that traditional clustering methods would be inappropriatefor estimating precision with so few degrees of freedom and only a single treatedgroup (Donald and Lang 2007). As a result, in our second approach, we followBuchmueller, DiNardo, and Valletta (2011) and implement a permutation test inthe spirit of Fisher (1935). To do so, we compare the treatment effects we observein New York state to 21 placebo treatment effects we observe when we estimateEquation (2) independently and sequentially use of each of those 21 control states asthe ‘placebo’ treated state instead of New York. We then present how our treatmenteffects for New York state compares to the distribution of ‘placebo’ treatment effectswe observe when the control states are used as the treatment group.
6.4 The Impact of New York State’s Out-of-Network Billing Laws
Table 10 presents least-squares estimates of Equation (2) and shows the impact ofthe New York State law on hospitals’ out-of-network prevalence, physician chargesand payments, and hospital charges and payments. As Column 1 illustrates, theNew York State law reduced the frequency of out-of-network billing by 9 percentagepoints (56 percent) relative to changes observed in the 21 control states off a baserate of out-of-network prevalence in New York of 16 percent. These results areprecisely estimated using our clustered standard errors and our point estimate fallsoutside of the 5th and 95th percentiles of the distribution of placebo treatmenteffects.
Figure 8 presents non-parametric estimates of Equation (2) graphically. Theout-of-network prevalence in New York and control states followed similar trendsbefore the introduction of the New York State out-of-network protection law in 2014.However, almost immediately after the law was passed (and before the requiredimplementation date), there was a marked reduction in out-of-network billing inNew York. Figure 9 shows the distribution of out-of-network prevalence acrosshospitals in 2011 and 2015. The out-of-network prevalence in New York in 2011was 25.0 percent. Four years later, the rate was 6.4 percent, and the reduction inout-of-network prevalence was driven by reductions in out-of-network prevalenceacross nearly all hospitals, including those that previously had high prevalence ofout-of-network billing.
Perhaps more notably, as we illustrate in Column (3), the New York state lawlowered in-network payments to physicians by $41.39 (14 percent). These results arealso precisely estimated using both of our approaches for identifying standard errors.
36

This reduction in payments is consistent with predictions that the law would lowerED physicians’ disagreement payoff in negotiations with insurers over in-networkpayments, which should lower the prices reached in the negotiations. It is alsonotable that this effect was observable in New York where, in addition to engagingin arbitration, insurers have to identify how their proposed out-of-network paymentsare scaled relative to usual and customary payments (the 80th percentile of physiciancharges).
Evidence from New York State suggests that introducing a hold-harmless pro-vision and arbitration over insurers’ payments to out-of-network physicians canlower the frequency of out-of-network billing and the level of physicians’ in-networkpayments. This result shows how changing physicians’ outside option in negotiationsalters their ultimate negotiated payment. Nevertheless, the New York State law isadministratively complex, costly to administer, and has the potential to be gamed.If patients receive a surprise out-of-network bill and are charged out-of-networkrates, they must be aware that the protections exist and fill out the form included inAppendix 4. Likewise, the state has to fund and administer the arbitration processin perpetuity. Moreover, because states cannot regulate ASO products, the NewYork protections only offer formal protection to individuals covered by fully insuredinsurance products. And perhaps the biggest challenge with this policy is that,because the outcome of arbitration is linked to physician charges (which physiciansset themselves), there is scope that physicians could game the system and increasetheir charges over time, which would improve their outcome in arbitration. As aresult, the long-run impact of arbitration may differ from what we found in theshort-run.29
29An alternative (and potentially superior) approach for addressing out-of-network billing detailedin our working paper (Cooper, Scott Morton, and Shekita 2017) is for the state to regulate theform of the contract between hospitals, physicians, and insurers, so that the resulting physicianpayment is generated by market forces. Under this policy, states or the federal government wouldrequire hospitals to sell and insurers to contract for an ED service package that includes physicianand facility services. Hospitals would purchase the inputs for ED services the way they purchaseother labor inputs, such as nursing care and non-labor inputs, such as bandages and needles. Allcare provided in the ED would be included when the hospital contracted to be “in-network” with aninsurer. This type of policy would require the hospital to buy ED physician services in a local labormarket, which would expose hospitals and physicians to competitive forces and produce a marketprice for ED physician services. Hospitals would then submit a single bill to insurers. Patientschoosing in-network facilities would have no surprise bills. Furthermore, states are permitted toregulate hospitals and in this way could protect all consumers including those covered through ASOinsurance. This policy is also likely to lower the equilibrium prices for in-network ED physicians.
37

7 Conclusion
Out-of-network billing by ED physicians working from in-network hospitals is afunction of an idiosyncrasy in the US health system: physicians may not participatein the same insurance networks as the hospital where they practice medicine. Forbundled services where patients consume physician and facility care together (andcannot select their physician or observe physicians’ networks ex ante), doctors faceinelastic demand in the short-run. When a physician is out-of-network, dependingon a patient’s insurance plan, the patient can be hit with a large and unexpected billthat is not competitively determined. These out-of-network bills can expose patientsto significant financial risk. Moreover, when physicians and physician groups can billout-of-network without seeing a sizeable reduction in the number of patients theytreat, it undercuts the functioning of health care markets by insulating physicianfrom competition and changing the outside option physicians face when negotiatingwith insurers over their prices. This strong outside option allows physicians tonegotiate high in-network payments.
Consistent with their strong outside option, we observe that ED physicians werepaid more, as a percentage of Medicare payments, than other physician specialties.Moreover, we find that out-of-network billing is concentrated in a minority ofhospitals. We find that at 75 percent of hospitals have out-of-network prevalenceof less than 20 percent. By contrast, ten percent of hospitals have out-of-networkprevalence of over 99 percent. This suggests that out-of-network billing is a deliberatepractice by groups of physicians and hospitals.
We identify that one of the nation’s leading physician staffing companies - EmCare- is using out-of-network billing as a tool to raise profits. We find that after EmCaretakes over the management of ED services at a hospital, it raises out-of-networkbilling prevalence by over 80 percentage points. This allows the firm to collect higherpayments from insurers and from patients. We calculate that the payments theyreceived from insurers increased by 117 percent and patient cost sharing increasedby 92 percent. Hospitals with ED services that are outsourced to EmCare form asignificant percentage of the 15 percent of hospitals in the US with extremely highout-of-network billing levels. However, EmCare is not the only physician staffingcompany to use out-of-network billing to raise revenue. In previous analysis, wehave shown that TeamHealth, another private-equity backed, large physician staffingcompany exits networks as soon as it enters hospitals, but eventually re-entersnetworks after negotiating significantly higher in-network payments (Cooper, Scott
38

Morton, and Shekita 2017).When ED physicians bill out-of-network, it likely creates reputational harm for
the in-network hospitals where they work and some disutility if hospitals valuepatient welfare. To offset this harm, we find evidence that EmCare offers $2 millionor more in economic transfers annually to hospitals where the have contracts tooffset any costs the hospitals incur. This represents a 15.5 percent increase in theprofit margin at the average hospital in the US. The transfers we observe includeEmCare-affiliated physicians ordering treatments that lead to increased hospitalbilling, such as ordering more imaging studies and increasing rates that patients areadmitted to the hospital. We also find evidence that EmCare offers reductions instaffing fees for hospitals in exchange for being allowed to remain out-of-network.
Policies to address surprise billing must both protect consumers and restore acompetitively set price for emergency care. Ultimately, the strength physicians’outside option (e.g. the extent they can go out-of-network and collect their charges)influences their in-network payments. We studied a New York State law that prohib-ited balance billing and introduced an arbitration process to settling billing disputesbetween physicians and insurers. This policy lowered out-of-network prevalence inthe state by 14 percent. Moreover, we show that the policy also led to a significantreduction in ED physicians’ in-network payments.
References
American Hospital Association (2018). Fast facts on U.S. hospitals. AmericanHospital Association. Accessed 11/29/2018. url: https://www.aha.org/statistics/fast-facts-us-hospitals.
Bai, Ge and Gerard F Anderson (2016). “Variation in the Ratio of Physician Chargesto Medicare Payments by Specialty and Region”. In: JAMA 317.3, pp. 315–318.
Baker, Laurence C, M Kate Bundorf, Anne B Royalty, and Zachary Levin (2014).“Physician Practice Competition and Prices Paid by Private Insurers for OfficeVisits”. In: JAMA 312.16, pp. 1653–1662.
Barnett, Michael L, Andrew R Olenski, and Anupam B Jena (2017). “Opioid-Prescribing Patterns of Emergency Physicians and Risk of Long-Term Use”. In:New England Journal of Medicine 376.7, pp. 663–673.
Becker’s Hospital Review (2014). 12 Statistics on Hospital Profit and Revenue in2012. Becker’s Hospital Review. Accessed August 2019. url: https://www.
39

beckershospitalreview . com / finance / 12 - statistics - on - hospital - profit - and -revenue-in-2012.html.
Board of the Governors of the Federal Reserve System (2016). Report on the EconomicWell-Being of U.S. Households in 2015. Federal Reserve Board, Washington.Accessed February 2018. url: https://www.federalreserve.gov/2015-report-economic-well-being-us-households-201605.pdf.
Buchmueller, Thomas C, John DiNardo, and Robert G Valletta (2011). “The Effectof an Employer Health Insurance Mandate on Health Insurance Coverage andthe Demand for Labor: Evidence from Hawaii”. In: American Economic Journal:Economic Policy 3.4, pp. 25–51.
Cantlupe, Joe (2013). Keys to Better Flow, Better Care in EDs. HealthLeaders.Accessed February 2018. url: http://www.healthleadersmedia.com/community-rural/4-keys-better-emergency-department.
Cassidy, Bill (2018). Cassidy, Bipartisan Colleagues Relsease Draft Legislation toEnd Surprise Medical Bills. Office of Senator Bill Cassidy. url: https://www.cassidy.senate.gov/newsroom/press- releases/cassidy- bipartisan- colleagues-release-draft-legislation-to-end-surprise-medical-bills.
Centers for Medicare and Medicaid Services (2018). Emergency Medical Treatment &Labor Act (EMTALA). url: https://www.cms.gov/Regulations-and-Guidance/Legislation/EMTALA/.
Chan, David C. Jr. (2015). The Efficiency of Slacking Off: Evidence from theEmergency Department. Working Paper 21002. National Bureau of EconomicResearch.
Chanos, Thomas (2016). Envision Healthcare Holdings, Inc - Report. Bear Facts.Charlson, Mary E, Peter Pompei, Kathy L Ales, and C Ronald MacKenzie (1987).
“A New Method of Classifying Prognostic Comorbidity in Longitudinal Studies:Development and Validation”. In: Journal of Chronic Diseases 40.5, pp. 373–383.
Clemens, Jeffrey, Joshua D Gottlieb, and Tímea Laura Molnár (2017). “Do HealthInsurers Innovate? Evidence from the Anatomy of Physician Payments”. In:Journal of health economics 55, pp. 153–167.
Consumers Union (2015). Surprise Medical Bills Survey: 2015 Nationally-Rep-resentative Online Survey. Consumer Reports National Research Center. Ac-cessed February 2018. Washington DC. url: http://consumersunion.org/wp-content/uploads/2015/05/CY-2015-SURPRISE-MEDICAL-BILLS-SURVEY-REPORT-PUBLIC.pdf.
40

Cooper, Zack and Fiona Scott Morton (2016). “Out-of-Network Emergency-PhysicianBills–An Unwelcome Surprise”. In: New England Journal of Medicine 375.20,pp. 1915–1918.
Cooper, Zack, Fiona Scott Morton, and Nathan Shekita (2017). Surprise! Out-of-network Billing for Emergency Care in the United States. Tech. rep. NationalBureau of Economic Research.
Dalavagas, Jason (2014). Coverage Initiation: Envision Healthcare Holdings. Ed-ucational Articles. Accessed February 2018. url: http://www.valueline.com/Stocks/Highlights/Coverage_Initiation__Envision_Healthcare_Holdings .aspx#.WRyVe_nyuUk.
Department of Regulatory Agencies (2010). Report of the Commissioner of Insuranceto the Colorado General Assembly on § 10-17-704(3), C.R.S. Consumer Pro-tections Against Balance Billing. Colorado Department of Regulatory Agencies,Denver, CO. Accessed February 2018. url: http://hermes.cde.state.co.us/drupal/islandora/object/co%3A8599/datastream/OBJ/view.
DeRoma, Tris (2012). ER Transition Expected to be Smooth at LAMC. The LosAlamos Monitor. Accessed February 2018. url: http://www.lamonitor.com/content/er-transition-expected-be-smooth-lamc.
Deutsche Bank (2013). Markets Research - Envision Healthcare.Donald, Stephen G and Kevin Lang (2007). “Inference with Difference-in-Differences
and Other Panel Data”. In: The review of Economics and Statistics 89.2, pp. 221–233.
Duffy, Erin L (2019). “Influence of Out-of-Network Payment Standards on In-surer–Provider Bargaining: California’s Experience”. In: The American Journalof Managed Care 25.8, e243–e246.
EmCare (2014). Cross-Departmental Initiative Leads to Nationally Recognized StrokeTreatment Program. Accessed February 2018. url: https://www.emcare.com/resources/case-studies/pdf/emcare6_casestudyholyoke.pdf.
Envision Healthcare (2017). EmCare Review of Cooper Working Paper. EnvisionHealthcare. Accessed August 2019. url: https://www.evhc.net/campaigns/patients/endsurprisecoverage/documents/emcare-review-of-cooper-working_paper-october_upda.pdf.
Esposito, Lisa (2015). Enduring Really Long Waits at the Emergency Room: WhatCan You Do When You’re Last on the List? U.S. News and World Report. url:https://health.usnews.com/health-news/patient-advice/articles/2015/05/08/enduring-really-long-waits-at-the-emergency-room.
41
Finkelstein, Amy, Matthew Gentzkow, and Heidi Williams (2016). “Sources ofGeographic Variation in Health Care: Evidence From Patient Migration”. In:Quarterly Journal of Economics 131.4, pp. 1681–1726.
Fisher, Ronald Aylmer (1935). The Design of Experiments. Edinburgh: Oliver andBoyd.
Garmon, Christopher and Benjamin Chartock (2016). “One in Five Inpatient Emer-gency Department Cases May Lead to Surprise Bills”. In: Health Affairs 36.1,pp. 177–181.
Garthwaite, Craig, Tal Gross, and Matthew Notowigdo (2018). “Hospitals as Insurersof Last Resort”. In: American Economic Journal: Applied Economics 10.1, pp. 1–39.
Gooch, Kelly (2016). Texas Sees Dramatic Rise in Balanced Billing Complaints:3 Things to Know. Becker’s Hospital Review. Accessed February 2018. url:https://www.beckershospitalreview.com/finance/texas-sees-dramatic-rise-in-balanced-billing-complaints-3-things-to-know.html.
Grisham, Sarah (2017). Medscape Physician Compensation Report. Medscape MedicalNews. Accessed February 2018. url: https://www.medscape.com/slideshow/compensation-2017-overview-6008547#4.
Groth, Heather, Hans House, Rachel Overton, and Eric DeRoo (2013). “Board-Certified Emergency Physicians Comprise a Minority of the Emergency Depart-ment Workforce in Iowa”. In: Western Journal of Emergency Medicine 14.2,pp. 186–90.
Hamel, Liz, Mira Norton, Karen Pollitz, Larry Levitt, Gary Claxton, and BrodieMollyann (2016). The Burden of Medical Debt: Results from the Kaiser FamilyFoundation/New York Times Medical Bills Survey. The Henry J. Kaiser FamilyFoundation. Accessed February 2018. url: https://kaiserfamilyfoundation.files.wordpress.com/2016/01/8806-the-burden-of -medical-debt-results-from-the-kaiser-family-foundation-new-york-times-medical-bills-survey.pdf.
Hartman, Micah, Anne B Martin, Nathan Espinosa, Aaron Catlin, National HealthExpenditure Accounts Team, et al. (2017). “National Health Care Spending in2016: Spending and Enrollment Growth Slow After Initial Coverage Expansions”.In: Health Affairs 37.1, pp. 150–160.
Hassan, Maggie (2018). Shaheen & Hassan to Each Introduce Legislation to CombatEscalating Out-of-Pocket Health Care Costs, Stabilize Health Care Marketplace& End Surprise Medical Bills. Office of Senator Maggie Hassan. url: https://www.hassan.senate.gov/news/press-releases/shaheen-and-hassan-to-each-
42

introduce- legislation-to-combat-escalating-out-of-pocket-health-care-costs-stabilize-health-care-marketplace_end-surprise-medical-bills.
HealthLeaders Media (2016). ED Success: Coordinating Emergent and NonemergentCare. Intelligence Report. Brentwood, TN: HealthLeaders Media.
Hing, Esther and Farida Bhuiya (2012). Wait Time for Treatment in HospitalEmergency Departments: 2009. National Center for Health Statistics. AccessedFebruary 2018. Hyattsville, MD. url: https : / /www . cdc . gov /nchs /data /databriefs/db102.pdf.
Hoadley, Jack, Sandy Ahn, and Kevin Lucia (2015). Balance Billing: How AreStates Protecting Consumers from Unexpected Charges? The Center on HealthInsurance Reforms. Georgetown Univerity Health Policy Institute, Washington,DC. Accessed February 2018. url: https://www.rwjf.org/content/dam/farm/reports/issue_briefs/2015/rwjf420966.
Hsia, Renee Y, Arthur L Kellermann, and Yu-Chu Shen (2011). “Factors Associatedwith Closures of Emergency Departments in the United States”. In: JAMA 305.19,pp. 1978–1985.
Institute of Medicine (2006). Hospital-Based Emergency Care: At the Breaking Point.Washington DC: The National Academic Press.
Kaiser Family Foundation (2017). Employer Health Benefits Annual Survey: 2017.The Henry J. Kaiser Family Foundation, Menlo Park, CA. Accessed February2018. url: http://files.kff.org/attachment/Report-Employer-Health-Benefits-Annual-Survey-2017.
— (2018). Professionally Active Specialist Physicians by Field. Kaiser Family Foun-dation. url: https : / /www . kff . org / other / state - indicator / physicians - by -specialty- area/?currentTimeframe=0%5C&sortModel=%7B%22colId%22:%22Location%22,%22sort%22:%22asc%22%7D.
Keith, Katie (2018). New Regulation Justifies Previous Position On EmergencyRoom Balance Billing. Health Affairs. Accessed August 2019. url: https://www.healthaffairs.org/do/10.1377/hblog20180509.247998/full/.
Kyanko, Kelly A, Leslie A Curry, and Susan H Busch (2013). “Out-of-NetworkPhysicians: How Prevalent Are Involuntary Use and Cost Transparency?” In:Health Services Research 48.3, pp. 1154–1172.
Lucia, Kevin, Jack Hoadley, and Ashley Williams (2017). “Balance Billing by HealthCare Providers: Assessing Consumer Protections Across States”. In: Issue Brief(Common Fund) 16, pp. 1–10.
43

Luthi, Susannah (2019). In Battle over Surprise Bills, Senate Ponders RequiringIn-network Rates. Modern Healthcare. Accessed August 2019. url: https://www.modernhealthcare.com/physicians/battle-over-surprise-bills-senate-ponders-requiring-network-rates.
Marso, Andy (2017). Surprised by an ER bill? A company that staffs KC hospitalsfaces reports of overcharging. The Kansas City Star. Accessed August 2019. url:https://www.kansascity.com/news/business/health- care/article175493541.html.
McGirr, Joseph, Janet M Williams, and John E Prescott (1998). “Physicians inRural West Virginia Emergency Departments: Residency Training and BoardCertification Status”. In: Academic Emergency Medicine 5.4, pp. 333–336.
Morganti, Kristy G, Sebastian Bauhoff, Janice C Blanchard, Mahshid Abir, NeemaIyer, Alexandria C Sith, Joseph V Vesely, Edward N Okeke, and Arthur LKellermann (2013). The Evolving Role of Emergeny Departments in the UnitedStates. RAND Health. RAND Corporation, Santa Monica, CA. Accessed February2018. url: https://www.rand.org/pubs/research_reports/RR280.html.
New York State Department of Financial Services (2012). An Unwelcome Surprise:How New Yorkers are Getting Stuck with Unexpected Medical Bills from Out-of-Network Providers. New York Department of Financial Services. Albany, NY.
Newhouse, Joseph P (1970). “Toward a Theory of Nonprofit Institutions: An Eco-nomic Model of a Hospital”. In: American Economic Review 60.1, pp. 64–74.
Osborne, Martin J and Ariel Rubinstein (1990). Bargaining and Markets. San Diego,CA: Emerald Group Publishing Limited.
Pogue, Stacey and Megan Randall (2014). Surprise Medical Bills Take Advantage ofTexans. Center for Public Policy Priorities, Austin, TX. Accessed February 2018.url: https://forabettertexas.org/images/HC_2014_09_PP_BalanceBilling.pdf.
Public Health Service Act (2018). Office of the Legislative Counsel of the U.S. Houseof Representatives. Accessed August 2019. url: https://legcounsel.house.gov/Comps/PHSA-merged.pdf.
Rice, Sabriya (2016). Cutting Emergency Department Wait Times as Patient Vol-umes Rise. Modern Healthcare. Accessed February 2018. url: http://www.modernhealthcare.com/article/20160213/MAGAZINE/302139996.
Richman, Barak D, Nick Kitzman, Arnold Milstein, and Kevin A Schulman (2017).“Battling the Chargemaster: A Simple Remedy to Balance Billing for UnavoidableOut-of-Network Care”. In: American Journal of Managed Care 23.4, pp. 100–105.
44

Rosenthal, Elisabeth (2014a). After Surgery, $117,000 Bill for Doctor He Didn’tKnow. New York Times. Accessed February 2018. url: https://www.nytimes.com/2014/09/29/us/costs-can-go-up-fast-when-er- is- in-network-but-the-doctors-are-not.html.
— (2014b). Costs Can Go Up Fast When E.R. Is in Network But the Doctors AreNot. New York Times. Accessed February 2018. url: https://www.nytimes.com/2014/09/29/us/costs-can-go-up-fast-when-er-is-in-network-but-the-doctors-are-not.html.
Rui, P, K Kang, and Albert M (2013). National Hospital Ambulatory MedicalCare Survey: 2013 Emergency Department Summary Tables. Centers for DiseaseControl and Prevention, Washington, DC. Accessed February 2018. url: https://www.cdc.gov/nchs/data/ahcd/nhamcs_emergency/2013_ed_web_tables.pdf.
Sanger-Katz, Margot and Reed Abelson (2016). Surprise! Insurance Paid the E.R.but Not the Doctor. New York Times. Accessed February 2018. url: https ://www.nytimes.com/2016/11/17/upshot/first-comes-the-emergency-then-comes-the-surprise-out-of-network-bill.html.
Schuur, Jeremiah D and Arjun K Venkatesh (2012). “The Growing Role of EmergencyDepartments in Hospital Admissions”. In: New England Journal of Medicine367.5, pp. 391–393.
Wadman, Michael C, Robert L Muelleman, David Hall, T Paul Tran, and Richard AWalker (2005). “Qualification Discrepancies Between Urban and Rural EmergencyDepartment Physicians”. In: Journal of Emergency Medicine 28.3, pp. 273–276.
Wilson, Michael and David Cutler (2014). “Emergency Department Profits are Likelyto Continue as the Affordable Care Act Expands Coverage”. In: Health Affairs33.5, pp. 792–799.
45

Table 1: EmCare Entry and Exit Events from 2011 to 2015
EmCare Entries EmCare Exits
2011 1 Hospital 02012 7 Hospitals 02013 15 Hospitals 1 Hospital2014 10 Hospitals 02015 3 Hospitals 2 Hospitals
Total 36 Hospitals 3 HospitalsNotes: From 2011 to 2015, we identified 36 hospitals that entered intooutsourcing contracts with EmCare and three hospitals that ended con-tracts with EmCare. To identify EmCare entries and exits, we calledeach hospital we believed to have a contract with EmCare, reviewed pressreleases from the firm, and searched for news stories that highlighted anEmCare entry or exit event.
46

Tabl
e2:
ED
Epi
sode
sPe
rY
ear
Em
erge
ncy
Epi
sode
s
Tota
lFac
ility
Spen
ding
(mill
ions
)
Tota
lP
hysi
cian
Spen
ding
(mill
ions
)
Mea
nP
hysi
cian
In-N
etw
ork
Paym
ent
(%M
edic
are)
Patien
tC
ost-
Shar
ing
onP
hysi
cian
s
Patien
tC
ost-
Shar
ing
onH
ospi
tals
Hos
pita
lOut
-of
-Net
wor
kP
reva
lenc
e
2011
1,69
9,23
1$4
,522
$603
$274
.47
$42.
93$3
42.1
628
.6%
(228
%)
2012
1,89
9,45
8$5
,013
$718
$288
.65
$49.
01$3
61.9
528
.0%
(245
%)
2013
1,82
0,17
1$5
,097
$754
$317
.79
$57.
87$4
07.4
426
.1%
(269
%)
2014
1,74
5,10
3$5
,043
$752
$342
.57
$66.
36$4
43.5
024
.2%
(281
%)
2015
1,74
9,15
7$5
,263
$779
$375
.82
$69.
02$4
55.0
521
.9%
(303
%)
Tota
l8,
913,
120
$24,
938
$3,6
05$3
20.6
2$5
6.98
$401
.71
25.8
%(2
66%
)N
otes:
The
tabl
esh
ows
epis
odes
per
year
,fa
cilit
ysp
endi
ngpe
rye
ar,ph
ysic
ian
spen
ding
per
year
,th
em
ean
paym
ent
toan
in-n
etw
ork
ED
phys
icia
n(a
ndth
em
ean
expr
esse
das
ape
rcen
tage
ofM
edic
are
paym
ents
),pa
tien
tpa
ymen
tsfo
rph
ysic
ian
fees
,pat
ient
paym
ents
for
hosp
ital
fees
,an
dye
arly
out-
of-n
etw
ork
prev
alen
ce.
The
phys
icia
npa
ymen
tis
the
sum
ofth
ein
sure
ran
dpa
tien
tco
ntri
buti
on.
All
dolla
ram
ount
sar
ein
2015
dolla
rs.
We
obse
rve
that
over
99%
ofE
Dca
reoc
curr
edat
in-n
etw
ork
hosp
ital
s.
47

Tabl
e3:
The
Impa
ctof
Em
Car
eE
ntry
and
Exi
ton
Hos
pita
ls’P
reva
lenc
eof
Out
-of-N
etw
ork
ED
Phy
sici
anB
illin
g
(1)
(2)
(3)
Hos
pita
lsw
ith
OO
NP
reva
lenc
eB
elow
90%
Pri
orto
Ent
ry
Hos
pita
lsw
ith
OO
NP
reva
lenc
eA
bove
90%
Pri
orto
Ent
ryA
llH
ospi
tals
Em
Car
eE
ntry
Em
Car
eE
xit
OO
NIn
dica
tor
OO
NIn
dica
tor
Em
Car
eE
ntry
/Exi
t0.
828*
**-0
.027
-0.7
65**
*(0
.060
)(0
.043
)(0
.077
)
Hos
pita
lFE
Yes
Yes
Yes
Mon
thFE
Yes
Yes
Yes
Mea
nE
mC
are
0.06
00.
995
1.00
0M
ean
Non
-Em
Car
e0.
229
0.22
90.
229
Obs
erva
tion
s8,
362,
441
8,38
6,03
28,
323,
064
Con
trol
All
Non
-Em
Car
eH
ospi
tals
All
Non
-Em
Car
eH
ospi
tals
All
Non
-Em
Car
eH
ospi
tals
Notes:
⇤p<
0.10
,⇤⇤p<
0.05
,⇤⇤⇤
p<
0.01
.T
his
tabl
epr
esen
tsle
ast-
squa
res
esti
mat
esof
Equ
atio
n(1
).In
Col
umn
(1),
we
focu
son
hosp
ital
sth
atE
mC
are
ente
red
that
had
out-
of-n
etw
ork
prev
alen
cepr
ior
toen
try
that
wer
ebe
low
90pe
rcen
t(t
hem
ean
out-
of-n
etw
ork
prev
alen
cein
thes
eho
spit
als
prio
rto
entr
yw
as11
.6pe
rcen
t).
InC
olum
n(2
),w
efo
cus
onho
spit
als
that
had
out-
of-n
etw
ork
prev
alen
cepr
ior
toen
try
abov
e90
perc
ent
(the
mea
nou
t-of
-net
wor
kpr
eval
ence
prio
rto
entr
yw
as99
perc
ent)
.In
Col
umn
(3),
we
focu
son
the
thre
eho
spit
als
whe
reE
mC
are
ende
da
cont
ract
wit
ha
hosp
ital
.T
hede
pend
ent
vari
able
inal
lreg
ress
ions
isa
bina
ryin
dica
tor
for
whe
ther
apa
tien
tat
anin
-net
wor
kho
spital
was
trea
ted
byan
out-
of-n
etw
ork
phys
icia
n.O
uran
alys
isis
run
atth
epa
tien
t-le
vel.
The
cont
rolg
roup
sar
eal
lhos
pita
lsin
the
US
that
did
not
outs
ourc
eth
eir
ED
man
agem
ent
toE
mC
are.
Eac
hre
gres
sion
incl
udes
cont
rols
for
pati
ent
age,
gend
er,r
ace,
and
Cha
rlso
nsc
ore.
Stan
dard
erro
rsar
ecl
uste
red
arou
ndho
spit
als.
Mea
nsar
edr
awn
from
the
anal
ytic
sam
ple
popu
lati
onun
derl
ying
the
regr
essi
on.
InA
ppen
dix
Tab
leA
.2w
esh
owth
ese
esti
mat
esus
ing
alte
rnat
ive
cont
rolg
roup
s.
48
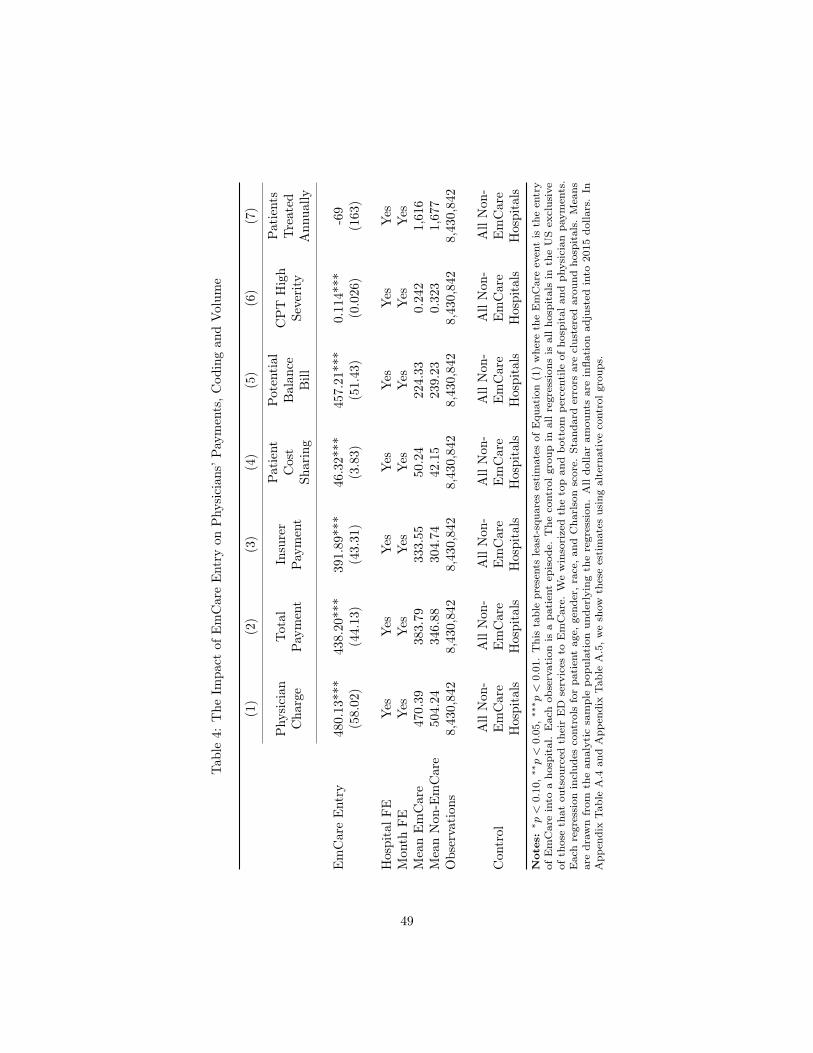
Tabl
e4:
The
Impa
ctof
Em
Car
eE
ntry
onP
hysi
cian
s’Pa
ymen
ts,C
odin
gan
dV
olum
e
(1)
(2)
(3)
(4)
(5)
(6)
(7)
Phy
sici
anC
harg
eTo
tal
Paym
ent
Insu
rer
Paym
ent
Patien
tC
ost
Shar
ing
Pote
ntia
lB
alan
ceB
ill
CP
TH
igh
Seve
rity
Patien
tsTr
eate
dA
nnua
lly
Em
Car
eE
ntry
480.
13**
*43
8.20
***
391.
89**
*46
.32*
**45
7.21
***
0.11
4***
-69
(58.
02)
(44.
13)
(43.
31)
(3.8
3)(5
1.43
)(0
.026
)(1
63)
Hos
pita
lFE
Yes
Yes
Yes
Yes
Yes
Yes
Yes
Mon
thFE
Yes
Yes
Yes
Yes
Yes
Yes
Yes
Mea
nE
mC
are
470.
3938
3.79
333.
5550
.24
224.
330.
242
1,61
6M
ean
Non
-Em
Car
e50
4.24
346.
8830
4.74
42.1
523
9.23
0.32
31,
677
Obs
erva
tion
s8,
430,
842
8,43
0,84
28,
430,
842
8,43
0,84
28,
430,
842
8,43
0,84
28,
430,
842
Con
trol
All
Non
-E
mC
are
Hos
pita
ls
All
Non
-E
mC
are
Hos
pita
ls
All
Non
-E
mC
are
Hos
pita
ls
All
Non
-E
mC
are
Hos
pita
ls
All
Non
-E
mC
are
Hos
pita
ls
All
Non
-E
mC
are
Hos
pita
ls
All
Non
-E
mC
are
Hos
pita
lsN
otes:
⇤p<
0.10
,⇤⇤p<
0.05
,⇤⇤⇤
p<
0.01
.T
his
tabl
epr
esen
tsle
ast-
squa
res
esti
mat
esof
Equ
atio
n(1
)w
here
the
Em
Car
eev
ent
isth
een
try
ofE
mC
are
into
aho
spit
al.
Eac
hob
serv
atio
nis
apa
tien
tep
isod
e.T
heco
ntro
lgr
oup
inal
lre
gres
sion
sis
allho
spit
als
inth
eU
Sex
clus
ive
ofth
ose
that
outs
ourc
edth
eir
ED
serv
ices
toE
mC
are.
We
win
sori
zed
the
top
and
bott
ompe
rcen
tile
ofho
spit
alan
dph
ysic
ian
paym
ents
.E
ach
regr
essi
onin
clud
esco
ntro
lsfo
rpa
tien
tag
e,ge
nder
,rac
e,an
dC
harl
son
scor
e.St
anda
rder
rors
are
clus
tere
dar
ound
hosp
ital
s.M
eans
are
draw
nfr
omth
ean
alyt
icsa
mpl
epo
pula
tion
unde
rlyi
ngth
ere
gres
sion
.A
lldo
llar
amou
nts
are
infla
tion
adju
sted
into
2015
dolla
rs.
InA
ppen
dix
Tab
leA
.4an
dA
ppen
dix
Tab
leA
.5,w
esh
owth
ese
esti
mat
esus
ing
alte
rnat
ive
cont
rolg
roup
s.
49

Tabl
e5:
The
Impa
ctof
Em
Car
eE
xit
onP
hysi
cian
s’Pa
ymen
ts,C
odin
gan
dV
olum
e
(1)
(2)
(3)
(4)
(5)
(6)
(7)
Phy
sici
anC
harg
eTo
tal
Paym
ent
Insu
rer
Paym
ent
Patien
tC
ost
Shar
ing
Pote
ntia
lB
alan
ceB
ill
CP
TH
igh
Seve
rity
Patien
tsTr
eate
dA
nnua
lly
Em
Car
eE
xit
-645
.76*
**-7
01.6
8***
-633
.00*
**-6
8.68
***
-632
.37*
**-0
.103
*46
**(1
85.4
2)(1
48.3
4)(1
25.7
1)(2
2.63
)(1
69.5
2)(0
.057
)(1
9)
Hos
pita
lFE
Yes
Yes
Yes
Yes
Yes
Yes
Yes
Mon
thFE
Yes
Yes
Yes
Yes
Yes
Yes
Yes
Mea
nE
mC
are
1,28
4.05
1,12
3.75
1,01
4.64
109.
111,
031.
570.
304
616
Mea
nN
on-E
mC
are
504.
2434
6.88
304.
7442
.15
239.
230.
323
1,67
7O
bser
vati
ons
8,32
3,06
48,
323,
064
8,32
3,06
48,
323,
064
8,32
3,06
48,
323,
064
8,32
3,06
4
Con
trol
All
Non
-E
mC
are
Hos
pita
ls
All
Non
-E
mC
are
Hos
pita
ls
All
Non
-E
mC
are
Hos
pita
ls
All
Non
-E
mC
are
Hos
pita
ls
All
Non
-E
mC
are
Hos
pita
ls
All
Non
-E
mC
are
Hos
pita
ls
All
Non
-E
mC
are
Hos
pita
lsN
otes:
⇤p<
0.10
,⇤⇤p<
0.05
,⇤⇤⇤
p<
0.01
.T
his
tabl
epr
esen
tsle
ast-
squa
res
esti
mat
esof
Equ
atio
n(1
)w
here
the
Em
Car
eev
ent
isth
eex
itof
Em
Car
efr
oma
hosp
ital
.E
ach
obse
rvat
ion
isa
pati
ent
epis
ode.
The
cont
rolg
roup
inal
lreg
ress
ions
isal
lhos
pita
lsin
the
US
excl
usiv
eof
thos
eth
atou
tsou
rced
thei
rE
Dse
rvic
esto
Em
Car
e.W
ew
inso
rize
dth
eto
pan
dbo
ttom
perc
enti
leof
hosp
ital
and
phys
icia
npa
ymen
ts.
Eac
hre
gres
sion
incl
udes
cont
rols
for
pati
ent
age,
gend
er,ra
ce,an
dC
harl
son
scor
e.St
anda
rder
rors
are
clus
tere
dar
ound
hosp
ital
s.M
eans
are
draw
nfr
omth
ean
alyt
icsa
mpl
epo
pula
tion
unde
rlyi
ngth
ere
gres
sion
.A
lldo
llar
amou
nts
are
infla
tion
adju
sted
into
2015
dolla
rs.
50

Table 6: Physicians’ Payments from a Private Insurer Expressed as a Percentage of MedicarePhysician Part B Payments By Specialty
(1) (2) (3) (4)
Internist Office VisitPayment Rate
Orthopedist HipReplacement Payment
Rate
ED PhysicianStandard Visit Rate
(In-network)
EmCare ED PhysicianStandard Visit Rate
(% of Medicare)
158% 178% 266% 542%Notes: This table shows physicians’ payments for commercially insured patients (including cost sharing) expressedas a percentage of Medicare Part B payments. Columns (3) and (4) are derived from our analytic sample of EDepisodes. Column (4) includes physician payments to providers working in hospitals that contract with EmCare.Columns (1) and (2) are drawn from 2011 to 2015 claims from the same payer supplying the ED data.
51

Tabl
e7:
The
Impa
ctof
Em
Car
eE
ntry
onH
ospi
tals
’Pay
men
ts,a
ndB
ehav
ior
(1)
(2)
(3)
(4)
(5)
(6)
Faci
lity
Cha
rge
Tota
lPa
ymen
tIn
sure
rPa
ymen
tPa
tien
tC
ost
Shar
ing
Imag
ing
Adm
issi
onto
Hos
pita
l
Em
Car
eE
ntry
1,27
0.15
***
220.
11**
173.
42**
46.7
0***
0.01
1***
0.01
7***
(329
.40)
(91.
49)
(81.
17)
(14.
02)
(0.0
04)
(0.0
05)
Hos
pita
lFE
Yes
Yes
Yes
Yes
Yes
Yes
Mon
thFE
Yes
Yes
Yes
Yes
Yes
Yes
Mea
nE
mC
are
7,56
6.25
2,71
9.70
2,30
8.49
411.
210.
283
0.07
9M
ean
Non
-Em
Car
e6,
100.
012,
660.
512,
320.
1334
0.38
0.27
30.
098
Obs
erva
tion
s8,
430,
842
8,43
0,84
28,
430,
842
8,43
0,84
28,
430,
842
8,43
0,84
2
Con
trol
All
Non
-Em
Car
eH
ospi
tals
All
Non
-Em
Car
eH
ospi
tals
All
Non
-Em
Car
eH
ospi
tals
All
Non
-Em
Car
eH
ospi
tals
All
Non
-Em
Car
eH
ospi
tals
All
Non
-Em
Car
eH
ospi
tals
Notes:
⇤p<
0.10
,⇤⇤p<
0.05
,⇤⇤⇤
p<
0.01
.T
his
tabl
epr
esen
tsle
ast-
squa
res
esti
mat
esof
Equ
atio
n(1
)w
here
the
Em
Car
eev
ent
isth
een
try
ofE
mC
are
into
aho
spit
al.
Eac
hob
serv
atio
nis
apa
tien
tep
isod
e.T
heco
ntro
lgro
upin
allr
egre
ssio
nsis
allh
ospi
tals
inth
eU
Sex
clus
ive
ofth
ose
that
outs
ourc
edth
eir
ED
serv
ices
toE
mC
are.
We
win
sori
zed
the
top
and
bott
ompe
rcen
tile
ofho
spit
alan
dph
ysic
ian
paym
ents
.Im
agin
gis
anin
dica
tor
vari
able
capt
urin
gw
heth
era
pati
ent
had
anim
agin
gst
udy
perf
orm
eddu
ring
anE
Dvi
sit.
Adm
issi
onto
hosp
ital
isan
indi
cato
rva
riab
leth
atca
ptur
esw
heth
era
pati
ent
was
adm
itte
dto
the
hosp
ital
afte
ran
ED
visi
t.E
ach
regr
essi
onin
clud
esco
ntro
lsfo
rpa
tien
tag
e,ge
nder
,rac
e,an
dC
harl
son
scor
e.St
anda
rder
rors
are
clus
tere
dar
ound
hosp
ital
s.M
eans
are
draw
nfr
omth
ean
alyt
icsa
mpl
epo
pula
tion
unde
rlyi
ngth
ere
gres
sion
.A
lldo
llar
amou
nts
are
infla
tion
adju
sted
into
2015
dolla
rs.
InA
ppen
dix
Tab
leA
.7an
dA
ppen
dix
Tab
leA
.8,w
esh
owth
ese
esti
mat
esus
ing
alte
rnat
ive
cont
rolg
roup
s.
52

Tabl
e8:
The
Impa
ctof
Em
Car
eE
xit
onH
ospi
tals
’Pay
men
ts,a
ndB
ehav
ior
(1)
(2)
(3)
(4)
(5)
(6)
Faci
lity
Cha
rge
Tota
lPa
ymen
tIn
sure
rPa
ymen
tPa
tien
tC
ost
Shar
ing
Imag
ing
Adm
issi
onto
Hos
pita
l
Em
Car
eE
xit
-395
.46*
*-1
73.4
3***
-161
.01*
**-1
2.42
-0.0
06-0
.020
***
(173
.08)
(35.
95)
(29.
35)
(7.9
7)(0
.011
)(0
.001
)
Hos
pita
lFE
Yes
Yes
Yes
Yes
Yes
Yes
Mon
thFE
Yes
Yes
Yes
Yes
Yes
Yes
Mea
nE
mC
are
3,10
1.79
2,12
6.10
1,89
4.28
231.
820.
192
0.03
1M
ean
Non
-Em
Car
e6,
100.
012,
660.
512,
320.
1334
0.38
0.27
30.
098
Obs
erva
tion
s8,
323,
064
8,32
3,06
48,
323,
064
8,32
3,06
48,
323,
064
8,32
3,06
4
Con
trol
All
Non
-Em
Car
eH
ospi
tals
All
Non
-Em
Car
eH
ospi
tals
All
Non
-Em
Car
eH
ospi
tals
All
Non
-Em
Car
eH
ospi
tals
All
Non
-Em
Car
eH
ospi
tals
All
Non
-Em
Car
eH
ospi
tals
Notes:
⇤p<
0.10
,⇤⇤p<
0.05
,⇤⇤⇤
p<
0.01
.T
his
tabl
epr
esen
tsle
ast-
squa
res
esti
mat
esof
Equ
atio
n(1
)w
here
the
Em
Car
eev
ent
isth
eex
itof
Em
Car
efr
oma
hosp
ital
.E
ach
obse
rvat
ion
isa
pati
ent
epis
ode.
The
cont
rolg
roup
inal
lreg
ress
ions
isal
lhos
pita
lsin
the
US
excl
usiv
eof
thos
eth
atou
tsou
rced
thei
rE
Dse
rvic
esto
Em
Car
e.W
ew
inso
rize
dth
eto
pan
dbo
ttom
perc
entile
ofho
spit
alan
dph
ysic
ian
paym
ents
.Im
agin
gis
anin
dica
tor
vari
able
capt
urin
gw
heth
era
pati
ent
had
anim
agin
gst
udy
perf
orm
eddu
ring
anE
Dvi
sit.
Adm
issi
onto
hosp
ital
isan
indi
cato
rva
riab
leth
atca
ptur
esw
heth
era
pati
ent
was
adm
itte
dto
the
hosp
ital
afte
ran
ED
visi
t.E
ach
regr
essi
onin
clud
esco
ntro
lsfo
rpa
tien
tag
e,ge
nder
,rac
e,an
dC
harl
son
scor
e.St
anda
rder
rors
are
clus
tere
dar
ound
hosp
ital
s.M
eans
are
draw
nfr
omth
ean
alyt
icsa
mpl
epo
pula
tion
unde
rlyi
ngth
ere
gres
sion
.A
lldo
llar
amou
nts
are
infla
tion
adju
sted
into
2015
dolla
rs.
53

Table 9: The Characteristics of Hospitals that Contract with EmCare
Hospital Characteristics All Hospitals(3,345)
EmCareHospitals (212)
P-value fromtwo-sided t-test
For-profit 0.19 0.45 0.00Non-profit 0.61 0.33 0.00Government 0.20 0.22 0.49Teaching 0.06 0.03 0.03Hospital Beds 182.69 156.36 0.04Technologies 49.04 40.19 0.00Hospital HHI 0.55 0.57 0.35Proportion Medicare 49.53 49.39 0.89Proportion Medicaid 18.65 18.28 0.62ED Physicians per Capita (per 10,000) 0.77 0.67 0.00Physicians per Capita (per 10,000) 22.06 21.27 0.02Physician HHI 0.42 0.42 0.61Insurer HHI 0.37 0.36 0.21Household Income ($) 36,899 37,147 0.59Gini Coefficient 0.32 0.33 0.00Notes: The table compares characteristics of hospitals that contract with EmCare to the characteristics of hospi-tals in the universe of hospitals registered with the American Hospital Association. The number of hospitals ineach column is shown in parenthesis. The p-value is reported from a two-sided t-test comparing the difference inmeans between all hospitals and EmCare hospitals.
54

Table 10: Estimating the Impact of the New York State Surprise Billing Law
(1) (2) (3) (4) (5)Out-of-Network
Prevalence
PhysicianCharge
In-NetworkPhysicianPayment
FacilityCharge
FacilityPayment
NY*Post dummy -0.09*** -14.24 -41.39*** -75.73 39.66(0.03) (19.76) (8.89) (135.45) (70.95)
Placebo treatment effects (drawn from distribution of 21 states)5th percentile -0.08 -102.53 -32.35 -338.17 -127.1995th percentile 0.11 109.91 56.17 380.02 151.16
Hospital FE Yes Yes Yes Yes YesQuarter FE Yes Yes Yes Yes Yes
Mean NY 0.16 501.47 293.99 6,083.08 2,745.82Mean Non-NY 0.17 581.68 315.02 5,750.11 2,577.81Observations 4,100,767 4,100,767 3,419,554 4,100,767 4,100,767R-Square 0.61 0.47 0.54 0.10 0.10Notes:
⇤p < 0.10, ⇤⇤p < 0.05, ⇤⇤⇤p < 0.01. This table presents least-squares estimates of Equation (2). All regressionsare run at the patient level. Each regression includes an indicator variable for whether the episode occurred in NewYork. The post dummy turns on in 2014 Q1 (when the NY vote was passed). Hospital and physician payments arewinsorized at the top and bottom one percentile. The control group includes 21 states that have not introducedsurprise billing protections (Alabama, Arizona, Arkansas, District of Columbia, Georgia, Kansas, Kentucky, Louisiana,Michigan, Minnesota, Missouri, Nebraska, Nevada, Ohio, Oklahoma, Oregon, South Carolina, Tennessee, Virginia,Washington, Wisconsin). Each regression includes controls for patient age, gender, race, and Charlson score. Standarderrors are clustered around hospitals. Means are drawn from the analytic sample population underlying the regression.All dollar amounts are inflation adjusted into 2015 dollars.
55

Figure 1: The Prevalence of Out-of-Network ED Physician Billing Across Hospitalsin 2015
Observations 10th 25th 50th 75th 90th
Out-of-Network Prevalence 3,345 0 0 0.011 0.278 0.990Notes: The figure shows the prevalence of out-of-network ED physician across US hospitals in2015.
56

Figure 2: Conditional Correlates of Hospitals’ Out-of-Network Billing Prevalence
Notes: The figure shows the point estimates from a least-squared regression of hospitals’ out-of-network prevalence on variables chosen from our Lasso. We used data from 2011 through 2015.Each observation is a hospital-year prevalence of out-of-network billing. The regression includesyear fixed-effects. For continuous variables, we scale the variables so that they have a mean ofzero and a standard deviation of one. As a result, the point estimates can be interpreted as thepercentage point change in out-of-network prevalence for a one standard deviation increase in theexplanatory variable. For binary variables, the point estimate illustrates the impact of having thevariable take a value of one. To obtain these results, we run a Lasso with all possible variables (89in total). We then run an OLS regression of hospital out-of-network prevalence on variables chosenfrom Lasso. We also include measures of hospital and insurer market concentration and physiciangroup indicator.
57

Figure 3: The Impact of EmCare Entry and Exit on Hospitals’ Prevalence ofOut-of-Network ED Physician Billing
Notes: The panels plot the monthly average out-of-network prevalence by hospital from 12 monthsbefore to 12 months after EmCare entered (Panel A) or exited (Panel B) a hospital. In Panel A, welimit our analysis to hospitals with pre-entry out-of-network prevalence below 90 percent. There issix month period of uncertainty on either side of entry and exit dates, which we denote by shadingthe area gray.
58

Figure 4: The Impact of EmCare Entry on Physicians’ Payments, Coding, andVolume
Notes: The panels plot the monthly average by hospital from 12 months before to 12 monthsafter EmCare entered the hospital. We exclude the top 1% observations in each panel. The localpolynomial is weighted by the number of episodes in each month. There is six month period ofuncertainty on either side of entry and exit dates, which we denote by shading the area gray.
59

Figure 5: The Impact of EmCare Exit on Physicians’ Payments, Coding, and Volume
Notes: The panels plot the monthly average by hospital from 12 months before to 12 months afterEmCare exited the hospital. The local polynomial is weighted by the number of episodes in eachmonth. There is six month period of uncertainty on either side of entry and exit dates, which wedenote by shading the area gray.
60

Figure 6: The Impact of EmCare Entry on Hospitals’ Payments, and Behavior
Notes: The panels plot the monthly average by hospital from 12 months before to 12 monthsafter EmCare entered the hospital. We exclude the top 1% observations in each panel. The localpolynomial is weighted by the number of episodes in each month. There is six month period ofuncertainty on either side of entry and exit dates, which we denote by shading the area gray.
61
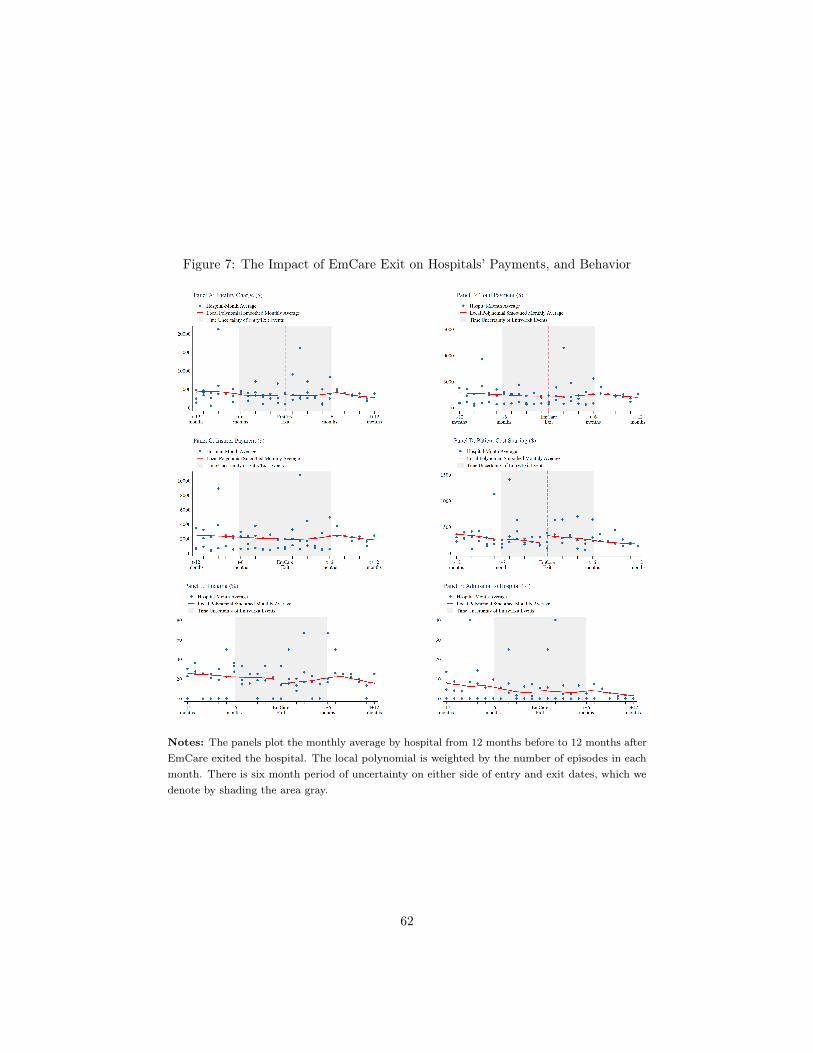
Figure 7: The Impact of EmCare Exit on Hospitals’ Payments, and Behavior
Notes: The panels plot the monthly average by hospital from 12 months before to 12 months afterEmCare exited the hospital. The local polynomial is weighted by the number of episodes in eachmonth. There is six month period of uncertainty on either side of entry and exit dates, which wedenote by shading the area gray.
62

Figure 8: Out-of-Network Prevalence in New York and States Without SurpriseBilling Laws
Notes: The figure presents least-squares estimates of Equation (2) - an episode-level regressionwhere the dependent variable is whether or not a patient at an in-network ED received a bill froman out-of-network physician. We regress that against an indicator for whether the episode occurredin the state of New York, a vector of quarterly fixed effects, and the interaction of the New Yorkindicator and the quarterly fixed effects. Patient age, gender, race, and Charlson scores are includedas controls. The omitted category is Q1 2013. We include a vector of hospital fixed effects. Thecontrol group is composed of observations from 21 states that did not have surprise billing laws.The red dotted line denotes when the NY vote passed, and the green dotted line denotes when theNY law was enacted.
63

Figure 9: The Distribution of Out-of-Network Billing in New York in 2011 and 2015
Notes: The figure shows the kernel density distribution of hospital out-of-network prevalence inNew York in 2011 and 2015
64

Appendix – For Online Publication
65

Appendix 1 Transcript of Discussions about EmCareand Out-of-Network Billing at Glen RoseMedical Center
Video from Glen Rose Medical Center in Glen Rose, Texas.Accessible at: https://www.youtube.com/watch?v=6kvM5fKPqCE.Recorded on 4/28/15.
Speaker 1: The question has been brought up in the past, and y’all might get it aswell so, but on the insurance or ER physicians and bills under FossilRim, so if anybody gets a bill under Fossil Rim, Fossil Rim PhysiciansGroup is who the billing group is there. But they bill out-of-networkfor most insurance, and we did contact them a while back, and wecould expand the insurances covered in the ER but it’s at a cost ofabout two hundred thousand dollars a year, to us to expand that forthe patients so.
Speaker 2: If we require them to be in-network with all the providers, then oursubsidy would increase significantly.
Speaker 3: That would cover all the providers, are there some that are cheap, andsome that aren’t?
Speaker 2: No, they all pay about the same, it’s that we do have some thatare in-network, they are in-network, well they’re in-network withMedicare. They’re in-network with some of the providers, but most ofthe providers they’re not in-network. Which means that if you’re in-network you have to accept what insurance pays, if you’re in-networkwith a provider, what an insurance pays, that’s what you have toaccept. You’re out-of-network, even if insurance pays you can bill thepatient for the additional amount. That’s our retail store.
Speaker 4: So the power plant and the school are they considered in-network orout-of-network?
66

Speaker 2: I don’t know, it depends on who their insurance is with, like the powerplants got several different insurances. Insurance by insurance notemployer by employer. Yea.
Speaker 2: Oh so, [crosstalk 00:01:48] Luminen has different insurance.
Speaker 3: Some of them can be in-network, some of them can be out.
Speaker 3: In the two hundred thousand that it will take to be in-network witheverybody that’s not necessarily equally distributed between a thou-sand different insurance companies? Or some of them might cost fivethousand a year? [crosstalk 00:02:08]
Speaker 1: That’s what we would have to pay EmCare an additional 200,000 toput those people in-network because right now billing out-of-networkthey’re making more money. So basically we’re supplementing them.It would be cheaper on the patients but we’re actually absorbing thatpatient cost that they’re [EmCare] getting for billing out-of-networkfor the patient, so it would actually come back to us.
Speaker 3: Okay, and if we get enough people in it then we’re getting it at adiscounted rate?
Speaker 1: If we can build our buy-up to about 750 or 800 visits a month, it’llbe a wash for us. Yeah it wouldn’t cost us any to have them down there.
Speaker 3: Well we’re gonna start having emails sent out about the 20th of themonth to all the board members looking to come in to check a runnynose.
Speaker 2: It is, it’s just from that perspective only it doesn’t make any differenceif they pay or not pay, it’s visits. Of course there’s another side to it,that’s our billing side of the ER visit.
Speaker 5: Summer’s coming there’s always [crosstalk 00:03:03]
67

Speaker 2: Oh I know, it’s true.
Speaker 1: One ER visit can, I mean looking at the bill it is a fairy significantamount of money for that one visit depending on where you’re at.
Speaker 2: Tell them to use my office. Tell them, they probably already settled[inaudible 00:03:27] So they can get out of the hall.
Speaker 2: Yeah the questions on the ER billing hope you, hope I clarified a littlebit. Probably the complaint that we get the most on is an insurancebeing out-of-network for.
Speaker 4: Government
Speaker 2: It’s the most significant one.
Speaker 4: That’s how we [inaudible 00:03:39]
Speaker 3: The administrative fee is paid to the Emcare.
Speaker 1: The administrative fee is paid to EmCare, yes.
Speaker 3: EmCare administers Fossil Rim Emergency Physicians and our Emer-gency Room, or just the Fossil Rim?
Speaker 2: Just for billing for the physician for the Emergency Room.
Speaker 3: That’s all EmCare does?
Speaker 2: Yes
Speaker 3: Just billing for the physicians?
Speaker 2: Yes
68

Speaker 3: Billing for everything else is us?
Speaker 1: Right. Right. If you come to the ER you’re gonna get 2 bills, you’regonna get a bill from the doctor and a bill from us.
69

Appendix 2 Modelling Surprise Out-of-Network Billing
For it to occur, there are three parties that have to prefer out-of-network billingto an in-network contract: the physician group, the hospital, and the insurer. Thephysician group and insurer must be unable to come to an agreement on an in-network contract. In addition, the hospital must effectively allow physicians to billout-of-network from inside their facilities.30 We discuss each party’s incentives inturn.
Out-of-Network Prices
The physician group and the insurer bargain over the price the insurer will paythe physicians. If there is no agreement between them and yet the physician isable to obtain access to the hospital ED (discussed below), patients do not createelastic demand because they are unaware of the out-of-network status of the doctor,uninformed about any increased price they will have to pay, and not in a position tochange hospitals. A physician optimizing against this short-run demand curve couldpotentially set a very high price. The constraints that will limit such price-settingare legal (e.g. state laws that restrict price gouging), and publicity and reputationalcosts. Thus, the revenue component of the disagreement payoff of the physiciangroup, should it end up out-of-network, will vary by state, and we could think of theprice as being a function of that state’s institutional environment, e.g. p = f(laws).31
However, the model below will focus on agents operating in one state and describethe average out-of-network price the group can collect, pL, as coming from thelegal environment, not the market environment in that state. A crucial feature ofemergency medicine is that the quantity of patients seen by the emergency physiciangroup is almost invariant to its network status as long as it retains the ability tostaff the hospital ED and the negative publicity from any surprise billing does notdrive away ED patients from the hospital.32
30The hospital may not have legal authority to prevent a physician (or physician group) frompracticing in the ED just because that physician has failed to come to an agreement with any giveninsurer or insurers. However, we assume there are so many interactions between the hospital andan ED physician group that if the hospital disapproved of the group’s overall strategy, it couldmake the relationship sufficiently onerous such that the physicians would move in-network.
31In Maryland and California, for example, out-of-network physicians cannot bill more thanthe greatest of either their in-network payments, a fixed percentage of Medicare payments, orphysicians’ usual and customary charges.
32When patients attend a hospital ED, they have no choice over the physician that treats them.As a result, once a patient decides to attend a hospital ED, the patient cannot avoid out-of-networkphysicians working in that ED. Previous researchers have used this feature of emergency medicine
70

Insurers
We denote the equilibrium negotiated price as p⇤. We abstract from all other revenueand costs of the insurer and simply define r to be the insurer’s net revenue perpatient without any ED physician cost. Thus, the net benefit of a representativeenrollee to the plan is r less the cost of the ED physician. If the physician groupand the insurer agree to a contract at p⇤, the insurer gets:
Ui,IN = r � p⇤. (3)
If the two parties do not agree, then the physician group begins billing its charges,which are higher than negotiated network rates. The insurer may take advantage ofany state law to reduce those physician charges, but the laws result in an effectiveprice received by the physicians of pL. We assume that the insurer ends up payingsome fraction �, less than one of the new out-of-network price pL. We will treat �
as exogenous in our model.33 The net insurer payoff under disagreement is thus:
Ui,OUT = r � �pL. (4)
A second difference under disagreement is that now the physicians also collect thebalance of the payment from the patient, who earns a disutility payoff W ((1��)pL) <
0. The patient blames the hospital for the balance bill so the hospital suffers harm toits reputation of kh. Throughout the model, when we use the term “out-of-networkbilling” we are referring to physicians using the deliberate strategy of raising chargesby a significant amount in order to earn higher payments. It is perfectly possiblefor an ED physician group to not have a contract with a patient’s insurer (perhapsdue to transaction costs) and to charge that patient a typical in-network price. Weassume, as is the case in our data, that in this situation the patient and the insurerwill share costs in the usual way and there are no disputes. We further assumethat in that case there is no reputational cost to the hospital. While this settingis technically also “out-of-network billing,” we exclude it from the definition in ourdiscussion below in order to focus on the deliberate strategy of raising prices.
as a source of random variation in physician assignment (see Barnett, Olenski, and Jena 2017).33It could be that � is determined by state laws and norms as well as by competition in the
insurer market. We assume that frictions in the physician ED market are too small to create anyfeedback to insurance competition.
71

Hospitals
We assume that hospitals understand when their outsourcing firm will be takingadvantage of patients and insurers with an out-of-network billing strategy. Hospitalsappreciate that the management company cannot carry out its strategy withoutaccess to the ED, and therefore the hospital will be able to bargain to keep a share ofthe increased profits generated by the outsourcing firm. These profits could take theform of physicians allowing the hospital to share in the physicians’ profits (e.g., witha joint venture) or through a reduction in any management fees that a hospital wouldhave to pay a firm to staff their ED. The payment could alternatively be generatedby increases in facility fees that result from increased testing rates, imaging rates, oradmissions to the hospital. By ordering these services, ED physicians have significantinfluence over hospitals’ revenue. However, increased ordering of services that arenot medically necessary exposes physicians to legal liability.
Because the hospital can block an out-of-network billing strategy, it must becompensated for the reputational loss it incurs from having this practice occur insideits facility. We assume that an outsourcing firm can pay a fixed amount c > kh
to satisfy the hospital.34 Physicians also have the ability to generate payment cto the hospital without it coming from the physician’s own pocket. This couldoccur via potentially unnecessary activities A such as ordering additional lab testing,imaging studies, or raising the rates that patients are admitted to the hospital.Increasing these activities does not generate revenue for the physician, but it doesgenerate revenues to the hospital. Engaging in activity A carries with it some legalrisk indicated by R(A), (with R0(A) > 0, R(0) = 0), since it may involve givingmedically unnecessary care which could be found to violate laws or regulations.A more complex model could make c endogenous and allow outsourcing firms tocompete by increasing it, but we do not take on that topic in this paper.
We also assume the hospital does not face any cost of higher-priced in-networkbilling. We think this is a reasonable assumption because it is hard for patientsto observe counterfactual prices and patients perceive they are ‘covered’ in thesecircumstances. That is, the level of p⇤ paid to ED physicians when they participatein an insurer’s network does not affect the hospital’s payoff. Hospitals value consumer
34We recognize a possible role for asymmetric information. A hospital may not realize thestrategy of the outsourcing firm ex ante. An uniformed hospital may sign a contract that is laterterminated when the hospital realizes its patients are receiving balance bills and the reputationalcost is high. For example, the Los Alamos Medical Center began contracting with EmCare in2012 (DeRoma 2012). Several years later, the hospital ended their contract with the hospital overconcerns about out-of-network billing and coding practices.
72

welfare with weight ↵h. If a hospital hires an out-of-network group to staff its ED,hospital utility changes by:
�Uh = (c� kh) + ↵hW ((1� �)pL), (5)
which represents its incremental financial earnings less the dollar value of the disutilityof patients. The hospital will only agree to out-of-network billing if its weight ↵h onpatients is sufficiently low. Recall that W < 0 and c > kh, so ↵h will be positivebut smaller, all else equal, for hospital willing to engage in out-of-network billing:
↵h < (c� kh)/(�W ((1� �)pL). (6)
If a hospital experiences a very high reputational or other cost to hosting a physiciangroup engaged in an out-of-network billing strategy, physician groups will find itexpensive to locate their strategy in that hospital and will tend to locate elsewhere.In the empirical section of the paper we will identify the characteristics of hospitalsthat have high out-of-network prevalence and contract with firms that engage in anout-of-network billing strategy.
Physicians
A physician group faces a choice of strategy. It can end all its contracts with insurersand collect pL for its services while compensating the hospital c (or engaging in A)and bearing the disutility from financially harming patients. Out-of-network billingfrom a patient’s doctor results in disutility to that patient of W ((1��)pL) which thephysicians take into account with a weight ↵p. Alternatively, the physician group canjoin insurer networks for p⇤ and avoid all hospital payments and patient disutility.(In our model consumer welfare, W , is constant at zero across in-network pricesbecause we assume the equilibrium impact of out-of-network billing on premiumstakes place slowly over time and is not perceived by consumers within our game.)
Physicians value profits, consumer welfare, and legal risk with weights as notedbelow. Profit is the negotiated price times a fixed quantity of patients less anyfinancial costs due to the physician group’s choice. We model patient numbersas fixed because of the almost inelastic response of patients described above. Ifout-of-network status is chosen, the group must either pay the hospital the financialcost c or bear risk R(A), which is a decrement to the physicians’ utility weighted by�p. Physician per patient utility (the number of patients is fixed) when bargaining
73

fails is:
Up,OUT (⇡,W,A) = pL + ↵pW ((1� �)pL)�min{c,�pR(A)}. (7)
We assume that everywhere physicians’ gain from an additional dollar increase in pL
is larger than their utility loss from the harm to consumers. Physicians’ increasedutility from income can be offset by harm to consumers, but not reversed. Thisis particularly plausible when � is large, which is the case in our setting.35 Wetherefore assume |↵pW 0| < 1.
When bargaining succeeds and the physician group is in-network at the hospital,its utility is:
Up,IN (⇡,W,A) = p⇤. (8)
We assume equal bargaining power for the two parties. The Nash bargainingexpression is therefore the product of the gains from agreement for both parties:
[Up,OUT � Up,IN ] ⇤ [Ui,IN � Ui,OUT ]. (9)
Which can equivalently be written:
[p⇤ � pL + ↵pW ((1� �)pL)�min{c,�pR(A)}] ⇤ [�pL � p⇤]. (10)
We assume bargaining strengths are equal and therefore p⇤ will split any differencebetween the two outside options. If the following holds:
Up,OUT (⇡,W,A) = pL + ↵pW ((1� �)pL)�min{c,�pR(A)} � �pL, (11)
then there are no gains from a contract and the physician group will stay out-of-network. On the other hand, if:
Up,OUT (⇡,W,A) = pL + ↵pW ((1� �)pL)�min{c,�pR(A)} < �pL, (12)
then we expect an equilibrium p⇤:
p⇤ = [pL + ↵pW ((1� �)pL)�min{c,�pR(A)}� �pL]/2 (13)
The intuition for the case where an in-network price is possible is graphed below.35Few consumers have savings to pay a large medical bill and therefore the fraction of it that
can be actually collected by physicians is relatively small.
74

The key condition that allows this outcome is that physicians’ net utility for beingout-of-network is low, either because of concern for patient welfare or because thehospital’s reputational cost, and therefore transfer, is high. Alternatively, there is noscope for agreement if Up,OUT (measured in dollars) lies above �pL on the line below,either because physicians are not concerned about putting patients in a bad situationor hospital reputation costs are low. The model does not include heterogeneityin consumers because our data do not allow us to examine that. However, thebalance billing strategy may be even more profitable if it allows the physician toprice discriminate by collecting a higher fraction of charges from the wealthy andwell-insured.
Up,OUT p⇤ �pL pL
The insurer’s outside option (�pL) is not specific to an insurer but is constant acrossall insurers due to state law. In particular, equilibrium p⇤ will fall in between thetwo outside options when Up,OUT is low enough. In this situation if the law or otherforces raise the insurer’s out-of-network payment, the equilibrium negotiated pricewill increase. We can check if an increase in pL will raise the equilibrium negotiatedrate by taking the derivative of the expression for p⇤ with respect to pL and askingif it is positive.
1� � + (1� �)↵pW0 > 0 (14)
We know W 0 is negative (a higher payment paid by consumers makes their utilitymore negative) and we also know |↵pW 0| < 1 by our assumption above. Since (1��)
is positive, the derivative is therefore positive.It is instructive to look at the case where physicians put no weight on legal risk
or patient disutility. In that situation the physician payoff is pL (they choose activityA and do not pay c) and there is nothing the insurer can offer as an in-network pricethat will be attractive. The physicians will stay out of the network, insurers willpay �pL and patients will pay the balance. As physicians’ disutility for risk, c, andweight on patients all rise, the outside option for the physician group becomes worseand eventually will fall below �pL whereupon there is scope for an in-network ratethat benefits both sides.
The question of whether out-of-network physician groups will choose to pay c orinstead engage in activity A depends on which is less costly to the doctors. Theircosts depend on their risk tolerance �p. Physician groups with low ↵p and high �p
75

want to choose the out-of-network strategy but do not want the risk of activity Aand therefore must pay the hospital directly. Physician groups with low ↵p and lowwill �p choose the out-of-network billing strategy for the additional profit, and paythe hospital through activity A which they find relatively cheap compared to givingup profit.
76
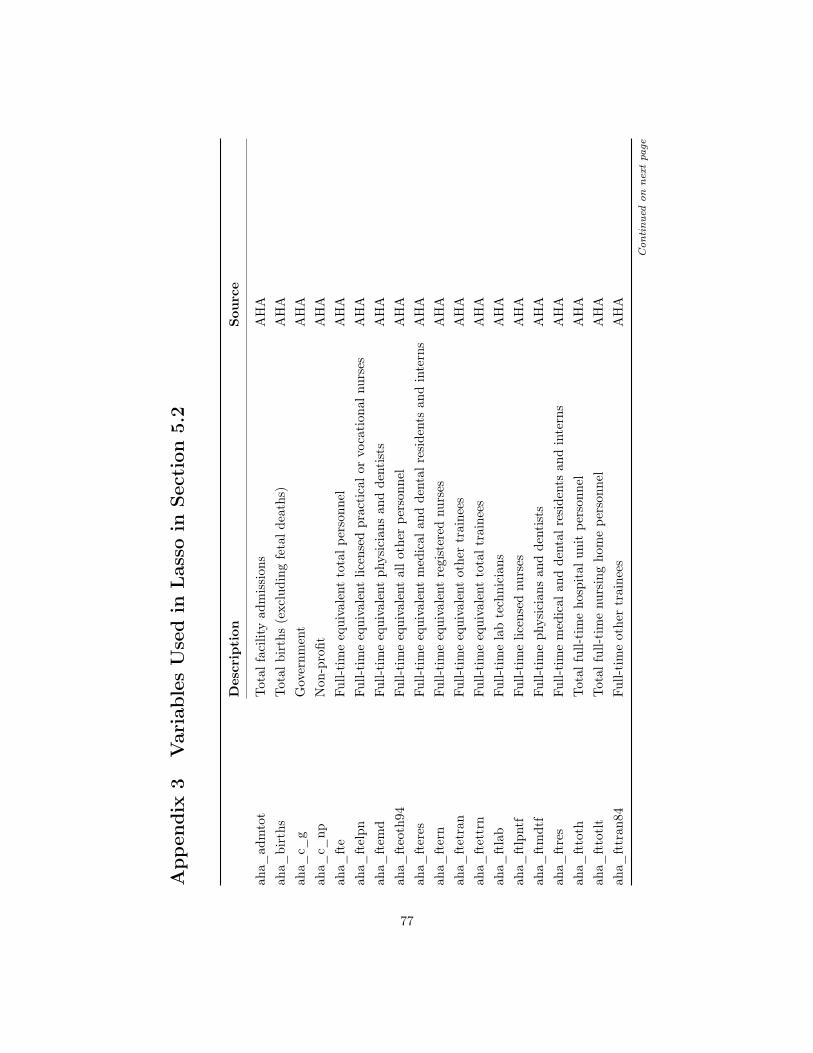
App
endi
x3
Var
iabl
esU
sed
inLas
soin
Sect
ion
5.2
Des
crip
tion
Sour
ce
aha_
adm
tot
Tota
lfac
ility
adm
issi
ons
AH
Aah
a_bi
rths
Tota
lbir
ths
(exc
ludi
ngfe
tald
eath
s)A
HA
aha_
c_g
Gov
ernm
ent
AH
Aah
a_c_
npN
on-p
rofit
AH
Aah
a_ft
eFu
ll-ti
me
equi
vale
ntto
talp
erso
nnel
AH
Aah
a_ft
elpn
Full-
tim
eeq
uiva
lent
licen
sed
prac
tica
lor
voca
tion
alnu
rses
AH
Aah
a_ft
emd
Full-
tim
eeq
uiva
lent
phys
icia
nsan
dde
ntis
tsA
HA
aha_
fteo
th94
Full-
tim
eeq
uiva
lent
allo
ther
pers
onne
lA
HA
aha_
fter
esFu
ll-ti
me
equi
vale
ntm
edic
alan
dde
ntal
resi
dent
san
din
tern
sA
HA
aha_
fter
nFu
ll-ti
me
equi
vale
ntre
gist
ered
nurs
esA
HA
aha_
ftet
ran
Full-
tim
eeq
uiva
lent
othe
rtr
aine
esA
HA
aha_
ftet
trn
Full-
tim
eeq
uiva
lent
tota
ltra
inee
sA
HA
aha_
ftla
bFu
ll-ti
me
lab
tech
nici
ans
AH
Aah
a_ft
lpnt
fFu
ll-ti
me
licen
sed
nurs
esA
HA
aha_
ftm
dtf
Full-
tim
eph
ysic
ians
and
dent
ists
AH
Aah
a_ft
res
Full-
tim
em
edic
alan
dde
ntal
resi
dent
san
din
tern
sA
HA
aha_
ftto
thTo
talf
ull-t
ime
hosp
ital
unit
pers
onne
lA
HA
aha_
ftto
tlt
Tota
lful
l-tim
enu
rsin
gho
me
pers
onne
lA
HA
aha_
fttr
an84
Full-
tim
eot
her
trai
nees
AH
A
Contin
ued
on
nextpage
77
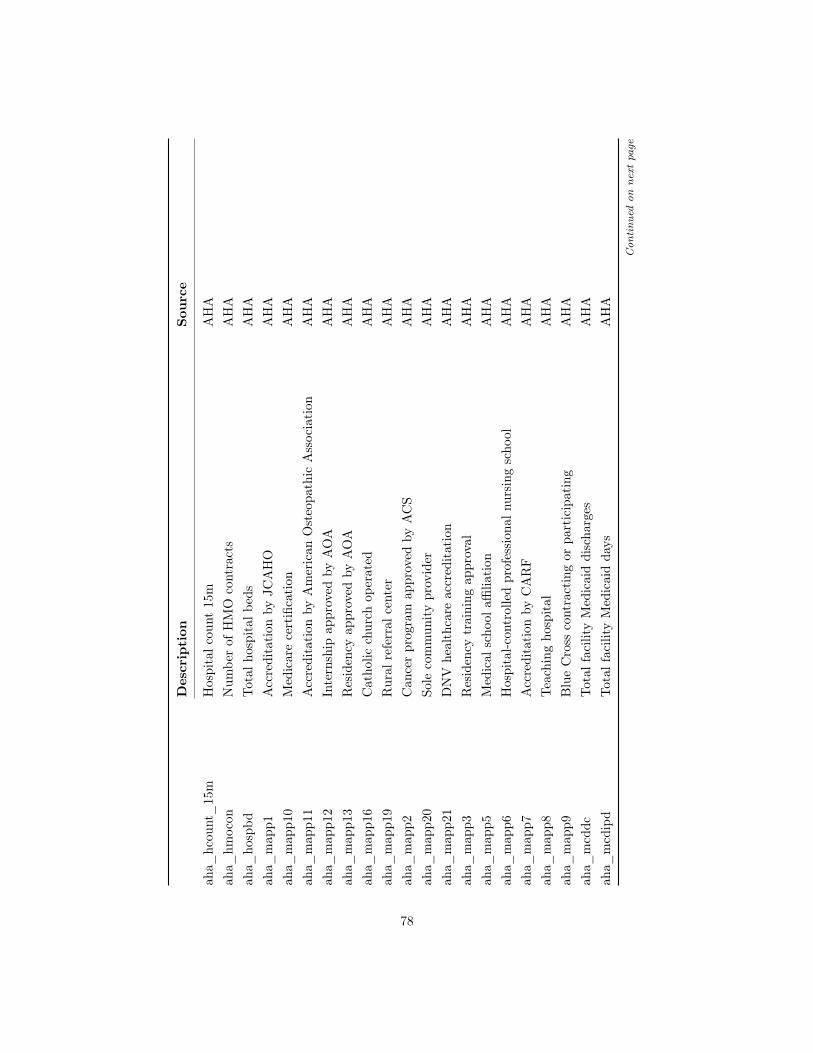
Des
crip
tion
Sour
ce
aha_
hcou
nt_
15m
Hos
pita
lcou
nt15
mA
HA
aha_
hmoc
onN
umbe
rof
HM
Oco
ntra
cts
AH
Aah
a_ho
spbd
Tota
lhos
pita
lbed
sA
HA
aha_
map
p1A
ccre
dita
tion
byJC
AH
OA
HA
aha_
map
p10
Med
icar
ece
rtifi
cati
onA
HA
aha_
map
p11
Acc
redi
tati
onby
Am
eric
anO
steo
path
icA
ssoc
iati
onA
HA
aha_
map
p12
Inte
rnsh
ipap
prov
edby
AO
AA
HA
aha_
map
p13
Res
iden
cyap
prov
edby
AO
AA
HA
aha_
map
p16
Cat
holic
chur
chop
erat
edA
HA
aha_
map
p19
Rur
alre
ferr
alce
nter
AH
Aah
a_m
app2
Can
cer
prog
ram
appr
oved
byA
CS
AH
Aah
a_m
app2
0So
leco
mm
unity
prov
ider
AH
Aah
a_m
app2
1D
NV
heal
thca
reac
cred
itat
ion
AH
Aah
a_m
app3
Res
iden
cytr
aini
ngap
prov
alA
HA
aha_
map
p5M
edic
alsc
hool
affilia
tion
AH
Aah
a_m
app6
Hos
pita
l-con
trol
led
prof
essi
onal
nurs
ing
scho
olA
HA
aha_
map
p7A
ccre
dita
tion
byC
AR
FA
HA
aha_
map
p8Te
achi
ngho
spit
alA
HA
aha_
map
p9B
lue
Cro
ssco
ntra
ctin
gor
part
icip
atin
gA
HA
aha_
mcd
dcTo
talf
acili
tyM
edic
aid
disc
harg
esA
HA
aha_
mcd
ipd
Tota
lfac
ility
Med
icai
dda
ysA
HA
Contin
ued
on
nextpage
78

Des
crip
tion
Sour
ce
aha_
mcr
dcTo
talf
acili
tyM
edic
are
disc
harg
esA
HA
aha_
npay
ben
Tota
lfac
ility
empl
oyee
bene
fits
AH
Aah
a_pa
ytot
Faci
lity
payr
olle
xpen
ses
AH
Aah
a_pr
op_
caid
Pro
port
ion
Med
icai
dA
HA
aha_
prop
_ca
reP
ropo
rtio
nM
edic
are
AH
Aah
a_pt
lab
Part
-tim
ela
bora
tory
tech
nici
ans
AH
Aah
a_pt
lpnt
fPa
rt-t
ime
licen
sed
prac
tica
lor
voca
tion
alnu
rses
AH
Aah
a_pt
mdt
fPa
rt-t
ime
phys
icia
nsan
dde
ntis
tsA
HA
aha_
ptph
rPa
rt-t
ime
phar
mac
ists
,lic
ense
dA
HA
aha_
ptph
tPa
rt-t
ime
phar
mac
yte
chni
cian
sA
HA
aha_
ptra
dPa
rt-t
ime
radi
olog
yte
chni
cian
sA
HA
aha_
ptre
sPa
rt-t
ime
med
ical
and
dent
alre
side
nts
and
inte
rns
AH
Aah
a_pt
resp
Part
-tim
ere
spir
ator
yth
erap
ists
AH
Aah
a_pt
toth
Tota
lpar
t-ti
me
hosp
ital
unit
pers
onne
lA
HA
aha_
ptto
tlt
Tota
lpar
t-ti
me
nurs
ing
hom
epe
rson
nel
AH
Aah
a_pt
tran
84Pa
rt-t
ime
othe
rtr
aine
esA
HA
aha_
suni
tsSe
para
tenu
rsin
gho
me
AH
Aah
a_su
ropi
pIn
pati
ent
surg
ical
oper
atio
nsA
HA
aha_
suro
ptot
Tota
lsur
gica
lope
rati
ons
AH
Aah
a_sy
shhi
_15
mH
ospi
tal1
5mH
HI
AH
Aah
a_te
chto
tal
Tech
nolo
gyA
HA
Contin
ued
on
nextpage
79

Des
crip
tion
Sour
ce
aha_
vem
Em
erge
ncy
room
visi
tsA
HA
aha_
vtot
Tota
lout
pati
ent
visi
tsA
HA
eop_
cs00
_se
g_in
cIn
com
ese
greg
atio
nE
qual
ityof
Opp
ortu
nity
Pro
ject
eop_
cs_
divo
rced
Frac
tion
ofdi
vorc
edad
ults
Equ
ality
ofO
ppor
tuni
tyP
roje
cteo
p_cs
_el
f_in
d_m
anM
anuf
actu
ring
empl
oym
ent
shar
eE
qual
ityof
Opp
ortu
nity
Pro
ject
eop_
cs_
fam
_w
kids
ingl
emom
Frac
tion
ofch
ildre
nw
ith
sing
lem
othe
rsE
qual
ityof
Opp
ortu
nity
Pro
ject
eop_
cs_
labf
orce
Labo
rpa
rtic
ipat
ion
rate
Equ
ality
ofO
ppor
tuni
tyP
roje
cteo
p_cs
_m
arri
edFr
action
ofad
ults
mar
ried
Equ
ality
ofO
ppor
tuni
tyP
roje
cteo
p_cs
_ra
ce_
bla
Frac
tion
blac
kE
qual
ityof
Opp
ortu
nity
Pro
ject
eop_
cs_
race
_th
eil_
2000
The
ilIn
dex
ofra
cial
segr
egat
ion
Equ
ality
ofO
ppor
tuni
tyP
roje
cteo
p_fr
ac_
trav
elti
me_
lt15
Frac
tion
wit
hco
mm
ute
less
than
15m
inut
esE
qual
ityof
Opp
ortu
nity
Pro
ject
eop_
gini
Gin
i(in
clud
esto
p1%
)E
qual
ityof
Opp
ortu
nity
Pro
ject
eop_
hhin
c00
Hou
seho
ldIn
com
eE
qual
ityof
Opp
ortu
nity
Pro
ject
eop_
inc_
shar
e_1p
erc
Top
1%in
com
esh
are
Equ
ality
ofO
ppor
tuni
tyP
roje
cteo
p_in
cgro
wth
0010
Inco
me
grow
th,2
000-
2006
/10
Equ
ality
ofO
ppor
tuni
tyP
roje
cteo
p_in
ters
ects
_m
saU
rban
indi
cato
rE
qual
ityof
Opp
ortu
nity
Pro
ject
eop_
mig
_in
flow
Mig
ration
inflo
wra
teE
qual
ityof
Opp
ortu
nity
Pro
ject
eop_
mig
_ou
tflow
Mig
ration
outfl
owra
teE
qual
ityof
Opp
ortu
nity
Pro
ject
eop_
rel_
tot
Frac
tion
relig
ious
Equ
ality
ofO
ppor
tuni
tyP
roje
cteo
p_su
bcty
_ex
pend
Loca
lgov
ernm
ent
expe
nditur
espe
rca
pita
Equ
ality
ofO
ppor
tuni
tyP
roje
cteo
p_ta
xrat
eLo
calt
axra
teE
qual
ityof
Opp
ortu
nity
Pro
ject
Contin
ued
on
nextpage
80
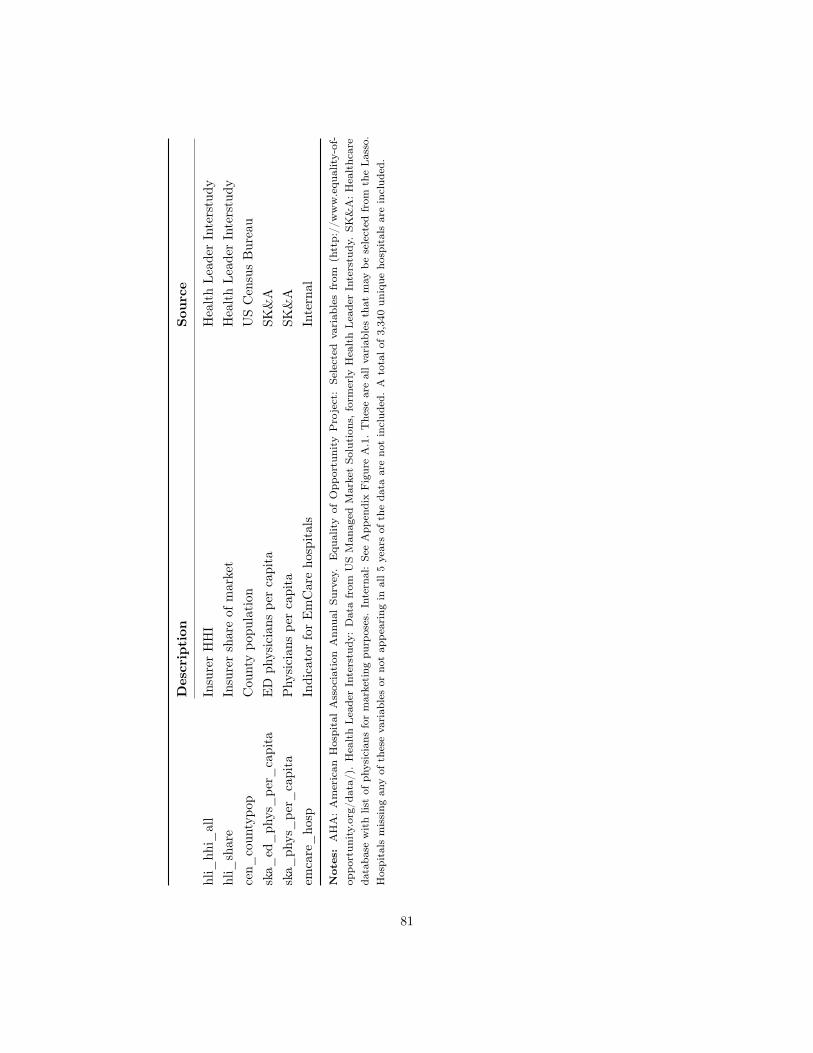
Des
crip
tion
Sour
ce
hli_
hhi_
all
Insu
rer
HH
IH
ealt
hLe
ader
Inte
rstu
dyhl
i_sh
are
Insu
rer
shar
eof
mar
ket
Hea
lth
Lead
erIn
ters
tudy
cen_
coun
typo
pC
ount
ypo
pula
tion
US
Cen
sus
Bur
eau
ska_
ed_
phys
_pe
r_ca
pita
ED
phys
icia
nspe
rca
pita
SK&
Ask
a_ph
ys_
per_
capi
taP
hysi
cian
spe
rca
pita
SK&
Aem
care
_ho
spIn
dica
tor
for
Em
Car
eho
spit
als
Inte
rnal
Notes:
AH
A:
Am
eric
anH
ospi
tal
Ass
ocia
tion
Ann
ual
Surv
ey.
Equ
ality
ofO
ppor
tuni
tyP
roje
ct:
Sele
cted
vari
able
sfr
om(h
ttp:
//w
ww
.equ
ality-
of-
oppo
rtun
ity.
org/
data
/).
Hea
lth
Lea
der
Inte
rstu
dy:
Dat
afr
omU
SM
anag
edM
arke
tSo
luti
ons,
form
erly
Hea
lth
Lea
der
Inte
rstu
dy.
SK&
A:H
ealt
hcar
eda
taba
sew
ith
list
ofph
ysic
ians
for
mar
keti
ngpu
rpos
es.
Inte
rnal
:Se
eA
ppen
dix
Fig
ure
A.1
.T
hese
are
allv
aria
bles
that
may
bese
lect
edfr
omth
eLa
sso.
Hos
pita
lsm
issi
ngan
yof
thes
eva
riab
les
orno
tap
pear
ing
inal
l5ye
ars
ofth
eda
taar
eno
tin
clud
ed.
Ato
talo
f3,
340
uniq
ueho
spit
als
are
incl
uded
.
81

Appendix 4 Surprise Billing Forms from New YorkState
New York State Out-of-Network Surprise Medical Bill
82

New York State Out-of-Network Surprise Medical Bill Assignment of Benefits Form
Use this form if you receive a surprise bill for health care services and want the services to betreated as in network. To use this form, you must: (1) fill it out and sign it; (2) send a copy toyour health care provider (include a copy of the bill or bills); and (3) send a copy to your insurer(include a copy of the bill or bills). If you don’t know if it is a surprise bill, contact the Departmentof Financial Services at 1-800-342-3736.
A surprise bill is when:
1. You received services from a nonparticipating physician at a participating hospital or ambula-tory surgical center, where a participating physician was not available; or a nonparticipatingphysician provided services without your knowledge; or unforeseen medical circumstancesarose at the time the services were provided. You did not choose to receive services from anonparticipating physician instead of from an available participating physician; OR
2. You were referred by a participating physician to a nonparticipating provider, but you didnot sign a written consent that you knew the services would be out-of-network and wouldresult in costs not covered by your insurer. A referral occurs: (1) during a visit with yourparticipating physician, a nonparticipating provider treats you; or (2) your participatingphysician takes a specimen from you in the office and sends it to a nonparticipating laboratorypathologist; or (3) for any other health care services when referrals are required under yourplan.
I assign my rights to payment to my provider and I certify to the best of my knowledge that:
I (or my dependent/s) received a surprise bill from a health care provider. I want the providerto seek payment for this bill from my insurance company (this is an “assignment”). I want myhealth insurer to pay the provider for any health care services I or my dependent/s received thatare covered under my health insurance. With my assignment, the provider cannot seek paymentfrom me, except for any copayment, coinsurance or deductible that would be owed if I or mydependent/s used a participating provider. If my insurer paid me for the services, I agree to sendthe payment to the provider.
Your name:
Your Address:
Insurer Name:
Your Insurance ID No:
Provider Name: Provider Phone Number:
Provider Address:
Date of Service:
Any person who knowingly and with intent to defraud any insurance company or other person filesand application for insurance or statement of claim containing any materially false information,or conceals for the purpose of misleading, information concerning any fact thereto, commits afraudulent insurance act, which is a crime, and shall also be subject to a civil penalty not to exceedfive thousand dollars and the stated value of the claim for each such violation.
(Signature of patient) (Date of signature)
83

App
endi
xTa
ble
A.1
:E
DE
piso
deD
escr
ipti
veSt
atis
tics
Mea
nSD
Min
P10
P25
P50
P75
P90
Max
Phy
sici
anPa
ymen
t40
4.44
313.
9448
.19
104.
5317
8.91
308.
2453
3.96
856.
761,
617.
59P
hysi
cian
Cha
rge
603.
4937
8.27
105.
0022
0.28
326.
5150
9.60
773.
051,
116.
872,
113.
93P
hysi
cian
Insu
rer
Paym
ent
347.
4530
4.91
0.00
44.1
813
2.55
266.
3147
4.60
774.
911,
617.
59P
hysi
cian
Patien
tPa
ymen
t56
.98
112.
460.
000.
000.
000.
0064
.11
181.
6666
9.16
Pote
ntia
lBal
ance
Bill
337.
6231
3.83
0.00
48.2
611
7.96
237.
5146
8.89
751.
592,
006.
55Fa
cilit
yPa
ymen
t2,
797.
895,
121.
6911
6.88
392.
9667
7.00
1,11
7.80
2,37
3.00
6,26
1.15
35,7
36.7
9Fa
cilit
yC
harg
e6,
519.
4712
,770
.32
169.
0054
2.71
1,04
6.39
2,28
2.88
5,69
5.04
15,0
17.1
588
,819
.04
Faci
lity
Insu
rer
Paym
ent
2,39
6.18
4,97
0.15
0.00
0.00
361.
0984
6.67
1,96
4.17
5,52
5.53
35,7
36.7
9Fa
cilit
yPa
tien
tPa
ymen
t40
1.71
570.
960.
000.
0010
1.72
197.
3143
6.35
1,06
1.74
3,30
1.67
Adm
issi
ons
0.09
0.29
00
00
00
1Im
agin
g0.
280.
450
00
01
11
Leng
thof
Stay
0.58
1.97
00
00
01
30C
PT
9928
10.
050.
210
00
00
01
CP
T99
282
0.13
0.34
00
00
01
1C
PT
9928
30.
480.
500
00
01
11
CP
T99
284
0.50
0.50
00
00
11
1C
PT
9928
50.
350.
480
00
01
11
His
pani
c0.
080.
280
00
00
01
Bla
ck0.
100.
300
00
00
11
Whi
te0.
480.
500
00
01
11
Yea
rof
Bir
th19
47-1
954
0.09
0.28
00
00
00
1Y
ear
ofB
irth
1955
-195
90.
090.
280
00
00
01
Yea
rof
Bir
th19
60-1
964
0.09
0.29
00
00
00
1Y
ear
ofB
irth
1965
-196
90.
090.
280
00
00
01
Contin
ued
on
nextpage
84

App
endi
xTa
ble
A.1
:E
DE
piso
deD
escr
ipti
ves
(con
tinu
ed)
Mea
nSD
Min
P10
P25
P50
P75
P90
Max
Yea
rof
Bir
th19
70-1
974
0.09
0.28
00
00
00
1Y
ear
ofB
irth
1975
-197
90.
080.
270
00
00
01
Yea
rof
Bir
th19
80-1
984
0.08
0.27
00
00
00
1Y
ear
ofB
irth
1985
-198
90.
080.
270
00
00
01
Yea
rof
Bir
th19
90-1
996
0.13
0.33
00
00
01
1Y
ear
ofB
irth
1997
-200
50.
100.
300
00
00
01
Yea
rof
Bir
th20
06-2
015
0.10
0.30
00
00
00
16-
mon
thC
harl
son
Scor
es0.
330.
920
00
00
16
12-m
onth
Cha
rlso
nSc
ores
0.45
1.06
00
00
02
66-
mon
thSp
endi
ng6,
248
17,1
950
014
975
73,
547
14,2
5311
5,49
912
-mon
thSp
endi
ng11
,481
27,9
040
115
523
2,08
68,
231
27,1
7017
8,29
7E
piso
des
per
Hos
pita
l2,
665
3,82
160
190
442
1,17
63,
279
6,96
447
,599
Notes:
The
sear
eth
ede
scri
ptiv
est
atis
tics
for
allE
Dca
ses
inou
rda
ta.
The
sear
elim
ited
toca
ses
that
occu
rred
atin
-net
wor
kho
spit
als.
Pay
men
tan
dch
arge
sar
ew
inso
rize
dat
the
top
and
bott
omon
epe
rcen
tile
s.Pay
men
tsan
dch
arge
sar
eal
soin
flati
onad
just
edin
to20
15do
llars
usin
gth
eB
LSA
llC
onsu
mer
Pri
ceIn
dex.
85

App
endi
xTa
ble
A.2
:T
heIm
pact
ofE
mC
are
Ent
ryan
dE
xit
onH
ospi
tals’
Pre
vale
nce
ofO
ut-o
f-Net
wor
kE
DP
hysic
ian
Bill
ing
Acr
oss
Diff
eren
tC
ontr
olG
roup
s (1)
(2)
(3)
(4)
(5)
(6)
(7)
(8)
(9)
Hos
pita
lsw
ith
OO
NP
reva
lenc
eB
elow
90%
Pri
orto
Ent
ryH
ospi
tals
wit
hO
ON
Pre
vale
nce
Abo
ve90
%P
rior
toE
ntry
All
Hos
pita
ls
Em
Car
eE
ntry
Em
Car
eE
ntry
Em
Car
eE
xit
OO
NIn
dica
tor
OO
NIn
dica
tor
OO
NIn
dica
tor
Em
Car
eE
ntry
/Exi
t0.
828*
**0.
843*
**0.
781*
**-0
.027
-0.0
10-0
.025
-0.7
65**
*-0
.762
***
-0.7
49**
*(0
.060
)(0
.061
)(0
.061
)(0
.043
)(0
.044
)(0
.053
)(0
.077
)(0
.081
)(0
.085
)
Hos
pita
lFE
Yes
Yes
Yes
Yes
Yes
Yes
Yes
Yes
Yes
Mon
thFE
Yes
Yes
Yes
Yes
Yes
Yes
Yes
Yes
Yes
Mea
nE
mC
are
0.06
00.
060
0.06
00.
995
0.99
50.
995
1.00
01.
000
1.00
0M
ean
Non
-Em
Car
e0.
229
0.28
40.
319
0.22
90.
284
0.31
90.
229
0.28
40.
319
Obs
erva
tion
s8,
362,
441
3,84
1,37
411
0,88
78,
386,
032
3,86
4,96
513
4,47
88,
323,
064
3,80
1,99
771
,510
Con
trol
All
Non
-E
mC
are
Hos
pita
ls
Hos
pita
lsin
Sam
eSt
ate
Pro
pens
itySc
ore
Mat
ch
All
Non
-E
mC
are
Hos
pita
ls
Hos
pita
lsin
Sam
eSt
ate
Pro
pens
itySc
ore
Mat
ch
All
Non
-E
mC
are
Hos
pita
ls
Hos
pita
lsin
Sam
eSt
ate
Pro
pens
itySc
ore
Mat
ch
Notes:
⇤p<
0.10,⇤⇤
p<
0.05,⇤⇤
⇤p<
0.01.
Thi
sta
ble
pres
ents
leas
t-sq
uare
ses
tim
ates
ofE
quat
ion
(1)
sepa
rate
lyon
hosp
ital
sw
ith
out-
of-n
etw
ork
(OO
N)
prev
alen
cebe
low
90pe
rcen
t(C
olum
ns1-
3)an
dab
ove
90%
(Col
umns
4-6)
whe
reE
mC
are
ente
red.
We
also
esti
mat
eE
quat
ion
(1)
for
the
exit
ofE
mC
are
from
hosp
ital
sin
Col
umns
(7-9
).T
hede
pend
ent
vari
able
inal
lre
gres
sion
sis
abi
nary
indi
cato
rfo
rw
heth
era
pati
ent
atan
in-n
etw
ork
hosp
ital
was
trea
ted
byan
out-
of-n
etw
ork
phys
icia
n.O
uran
alys
isis
run
atth
epa
tien
t-le
vel.
The
cont
rolg
roup
sfo
rC
olum
ns(1
,4,7
)ar
eal
lhos
pita
lsin
the
US
that
did
not
outs
ourc
eth
eir
ED
man
agem
ent
toE
mC
are.
The
cont
rolg
roup
sfo
rC
olum
ns(2
,5,8
)ar
eal
lhos
pita
lsin
sam
est
ates
asth
etr
eate
dho
spit
als,
excl
udin
gho
spit
als
that
outs
ourc
edth
eir
ED
serv
ices
toE
mC
are.
The
cont
rolg
roup
sin
Col
umns
(3,6
,9)
are
hosp
ital
sm
atch
edto
trea
ted
hosp
ital
sus
ing
prop
ensi
tysc
ores
calc
ulat
edus
ing
entr
yas
pred
icte
dby
atr
eate
dho
spit
al’s
beds
,tec
hnol
ogy,
and
non-
profi
t/fo
r-pr
ofit
stat
us.
Eac
hre
gres
sion
incl
udes
cont
rols
for
pati
ent
age,
gend
er,r
ace,
and
Cha
rlso
nsc
ore.
Stan
dard
erro
rsar
ecl
uste
red
arou
ndho
spit
als.
Mea
nsar
edr
awn
from
the
anal
ytic
sam
ple
popu
lati
onun
derl
ying
the
regr
essi
on.
86

App
endi
xTa
ble
A.3
:T
heIm
pact
ofE
mC
are
Ent
ryon
Phy
sici
anPa
ymen
tsan
dRV
U
(1)
(2)
(3)
(4)
(5)
(6)
(7)
(8)
(9)
(10)
(11)
Wor
kRV
Us
Phy
sici
anC
harg
esTo
talP
aym
ents
All
ED
CP
TC
PT
9928
1C
PT
9928
2C
PT
9928
3C
PT
9928
4C
PT
9928
5C
PT
9928
1C
PT
9928
2C
PT
9928
3C
PT
9928
4C
PT
9928
5
Em
Car
eE
ntry
0.21
***
-15.
8023
1.40
***
297.
00**
*40
5.99
***
521.
09**
*-9
.88
206.
66**
*27
7.68
***
385.
48**
*48
1.65
***
(0.0
7)(1
0.05
)(1
8.40
)(2
8.74
)(3
9.50
)(6
8.13
)(1
1.46
)(1
4.90
)(2
9.71
)(3
1.19
)(6
7.00
)
Hos
pita
lFE
Yes
Yes
Yes
Yes
Yes
Yes
Yes
Yes
Yes
Yes
Yes
Mon
thFE
Yes
Yes
Yes
Yes
Yes
Yes
Yes
Yes
Yes
Yes
Yes
Mea
nE
mC
are
2.35
122.
9217
2.49
301.
3048
2.30
759.
6493
.32
143.
6225
4.11
392.
6360
8.40
Mea
nN
on-E
mC
are
2.50
129.
5917
9.18
303.
0249
0.32
750.
4771
.48
104.
4119
8.84
332.
8053
6.96
Obs
erva
tion
s8,
375,
188
27,5
4330
4,19
52,
452,
057
2,80
9,86
62,
593,
849
27,5
4330
4,19
52,
452,
057
2,80
9,86
62,
593,
849
Con
trol
All
Non
-E
mC
are
Hos
pita
ls
All
Non
-E
mC
are
Hos
pita
ls
All
Non
-E
mC
are
Hos
pita
ls
All
Non
-E
mC
are
Hos
pita
ls
All
Non
-E
mC
are
Hos
pita
ls
All
Non
-E
mC
are
Hos
pita
ls
All
Non
-E
mC
are
Hos
pita
ls
All
Non
-E
mC
are
Hos
pita
ls
All
Non
-E
mC
are
Hos
pita
ls
All
Non
-E
mC
are
Hos
pita
ls
All
Non
-E
mC
are
Hos
pita
lsN
otes:
⇤p<
0.10,⇤
⇤p<
0.05,⇤
⇤⇤p<
0.01.
Thi
sta
ble
pres
ents
leas
t-sq
uare
ses
tim
ates
ofE
quat
ion
(1).
We
test
the
impa
ctof
Em
Car
een
try
onph
ysic
ians
’wor
kRV
U(C
olum
n(1
)),
phys
icia
nch
arge
spe
rC
PT
(Col
umns
(2)
-(6
)),a
ndph
ysic
ians
’allo
wed
amou
nts
per
CP
T(C
olum
ns(7
)-(1
1)).
The
cont
rolg
roup
sfo
ral
lcol
umns
are
allh
ospi
tals
inth
eU
Sth
atdi
dno
tou
tsou
rce
thei
rE
Dm
anag
emen
tto
Em
Car
e.St
anda
rder
rors
are
clus
tere
dar
ound
hosp
ital
s.M
eans
are
draw
nfr
omth
ean
alyt
icsa
mpl
epo
pula
tion
unde
rlyi
ngth
ere
gres
sion
.
87

App
endi
xTa
ble
A.4
:T
heIm
pact
ofE
mC
are
Ent
ryon
Phy
sici
ans’
Paym
ents
,Cod
ing,
and
Vol
ume
Usi
ngC
ontr
olH
ospi
tals
from
the
Sam
eSt
ate
(1)
(2)
(3)
(4)
(5)
(6)
(7)
Phy
sici
anC
harg
eTo
tal
Paym
ent
Insu
rer
Paym
ent
Patie
ntC
ost
Shar
ing
Pote
ntia
lB
alan
ceB
illC
PT
Hig
hSe
veri
ty
Patien
tsTr
eate
dA
nnua
lly
Em
Car
eE
ntry
483.
92**
*44
0.76
***
392.
89**
*47
.87*
**46
0.21
***
0.11
7***
-66
(58.
27)
(44.
37)
(43.
50)
(3.8
5)(5
1.71
)(0
.026
)(1
64)
Hos
pita
lFE
Yes
Yes
Yes
Yes
Yes
Yes
Yes
Mon
thFE
Yes
Yes
Yes
Yes
Yes
Yes
Yes
Mea
nE
mC
are
470.
3938
3.79
333.
5550
.24
224.
330.
242
1,61
6M
ean
Non
-Em
Car
e50
2.10
357.
9231
2.61
45.3
123
5.62
0.33
41,
546
Obs
erva
tion
s3,
909,
775
3,90
9,77
53,
909,
775
3,90
9,77
53,
909,
775
3,90
9,77
53,
909,
775
Con
trol
Hos
pita
lsin
Sam
eSt
ate
Hos
pita
lsin
Sam
eSt
ate
Hos
pita
lsin
Sam
eSt
ate
Hos
pita
lsin
Sam
eSt
ate
Hos
pita
lsin
Sam
eSt
ate
Hos
pita
lsin
Sam
eSt
ate
Hos
pita
lsin
Sam
eSt
ate
Notes:
⇤p<
0.10,⇤⇤
p<
0.05,⇤⇤
⇤p<
0.01.
Thi
sta
ble
pres
ents
leas
t-sq
uare
ses
tim
ates
ofE
quat
ion
(1)
whe
reth
eE
mC
are
even
tis
the
entr
yof
Em
Car
ein
toa
hosp
ital
.E
ach
obse
rvat
ion
isa
pati
ent
epis
ode.
The
cont
rolg
roup
inal
lreg
ress
ions
incl
udes
hosp
ital
sfr
omth
esa
me
stat
eas
the
hosp
ital
sw
here
Em
Car
een
try
occu
rred
.W
ew
inso
rize
dth
eto
pan
dbo
ttom
perc
enti
leof
hosp
ital
and
phys
icia
npa
ymen
ts.
Eac
hre
gres
sion
incl
udes
cont
rols
for
pati
ent
age,
gend
er,r
ace,
and
Cha
rlso
nsc
ore.
Stan
dard
erro
rsar
ecl
uste
red
arou
ndho
spit
als.
Mea
nsar
edr
awn
from
the
anal
ytic
sam
ple
popu
lati
onun
derl
ying
the
regr
essi
on.
All
dolla
ram
ount
sar
ein
flati
onad
just
edin
to20
15do
llars
.
88
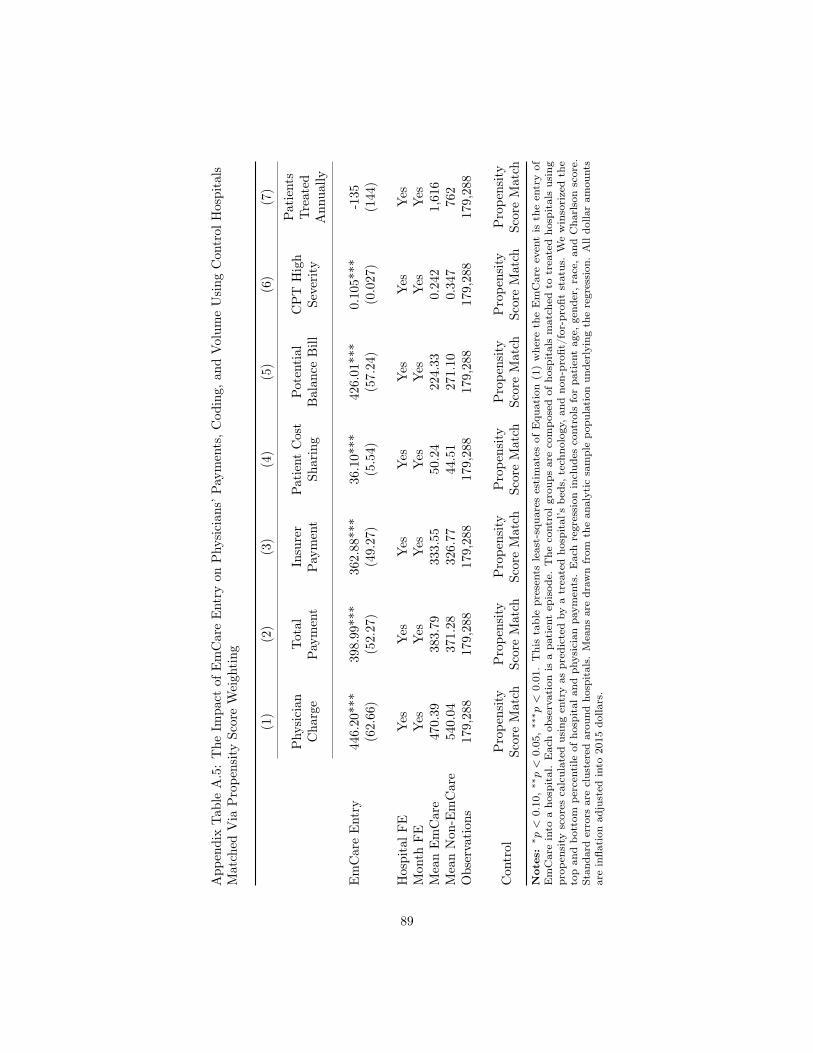
App
endi
xTa
ble
A.5
:T
heIm
pact
ofE
mC
are
Ent
ryon
Phy
sici
ans’
Paym
ents
,Cod
ing,
and
Vol
ume
Usi
ngC
ontr
olH
ospi
tals
Mat
ched
Via
Pro
pens
itySc
ore
Wei
ghting
(1)
(2)
(3)
(4)
(5)
(6)
(7)
Phy
sici
anC
harg
eTo
tal
Paym
ent
Insu
rer
Paym
ent
Patie
ntC
ost
Shar
ing
Pote
ntia
lB
alan
ceB
illC
PT
Hig
hSe
veri
ty
Patien
tsTr
eate
dA
nnua
lly
Em
Car
eE
ntry
446.
20**
*39
8.99
***
362.
88**
*36
.10*
**42
6.01
***
0.10
5***
-135
(62.
66)
(52.
27)
(49.
27)
(5.5
4)(5
7.24
)(0
.027
)(1
44)
Hos
pita
lFE
Yes
Yes
Yes
Yes
Yes
Yes
Yes
Mon
thFE
Yes
Yes
Yes
Yes
Yes
Yes
Yes
Mea
nE
mC
are
470.
3938
3.79
333.
5550
.24
224.
330.
242
1,61
6M
ean
Non
-Em
Car
e54
0.04
371.
2832
6.77
44.5
127
1.10
0.34
776
2O
bser
vati
ons
179,
288
179,
288
179,
288
179,
288
179,
288
179,
288
179,
288
Con
trol
Pro
pens
itySc
ore
Mat
chP
rope
nsity
Scor
eM
atch
Pro
pens
itySc
ore
Mat
chP
rope
nsity
Scor
eM
atch
Pro
pens
itySc
ore
Mat
chP
rope
nsity
Scor
eM
atch
Pro
pens
itySc
ore
Mat
chN
otes:
⇤p<
0.10,⇤⇤
p<
0.05,⇤⇤
⇤p<
0.01.
Thi
sta
ble
pres
ents
leas
t-sq
uare
ses
tim
ates
ofE
quat
ion
(1)
whe
reth
eE
mC
are
even
tis
the
entr
yof
Em
Car
ein
toa
hosp
ital
.E
ach
obse
rvat
ion
isa
pati
ent
epis
ode.
The
cont
rolg
roup
sar
eco
mpo
sed
ofho
spit
als
mat
ched
totr
eate
dho
spit
als
usin
gpr
open
sity
scor
esca
lcul
ated
usin
gen
try
aspr
edic
ted
bya
trea
ted
hosp
ital
’sbe
ds,t
echn
olog
y,an
dno
n-pr
ofit/
for-
profi
tst
atus
.W
ew
inso
rize
dth
eto
pan
dbo
ttom
perc
enti
leof
hosp
ital
and
phys
icia
npa
ymen
ts.
Eac
hre
gres
sion
incl
udes
cont
rols
for
pati
ent
age,
gend
er,r
ace,
and
Cha
rlso
nsc
ore.
Stan
dard
erro
rsar
ecl
uste
red
arou
ndho
spit
als.
Mea
nsar
edr
awn
from
the
anal
ytic
sam
ple
popu
lati
onun
derl
ying
the
regr
essi
on.
All
dolla
ram
ount
sar
ein
flati
onad
just
edin
to20
15do
llars
.
89

Appendix Table A.6: Physician Payment Rates for ED Visits
Mean S.D. P25 P50 P75 Max
In-Network EDPhysician Payment $320.62 $234.42 $153.67 $262.02 $413.72 $1,617.59
(Percent Medicare) (266%)Out-of-Network EDPhysician Charge $771.31 $435.22 $433.00 $669.16 $997.26 $2,113.93
(Percent Medicare) (637%)Notes: We limit our data to hospitals with more than 10 episodes per year from 2011 to 2015.Physician charges and payments are winsorized at the top and bottom percentile. Prices are inflationadjusted using the BLS All Consumer Price Index.
90

App
endi
xTa
ble
A.7
:T
heIm
pact
ofE
mC
are
Ent
ryon
Hos
pita
ls’P
aym
ents
,and
Beh
avio
rU
sing
Con
trol
Hos
pita
lsfr
omth
eSa
me
Stat
e
(1)
(2)
(3)
(4)
(5)
(6)
Faci
lity
Cha
rge
Tota
lPa
ymen
tIn
sure
rPa
ymen
tPa
tien
tC
ost
Shar
ing
Imag
ing
Adm
issi
onto
Hos
pita
l
Em
Car
eE
ntry
1,20
9.14
***
198.
88**
156.
39*
42.4
9***
0.01
0**
0.01
5***
(327
.56)
(91.
13)
(80.
98)
(13.
95)
(0.0
04)
(0.0
05)
Hos
pita
lFE
Yes
Yes
Yes
Yes
Yes
Yes
Mon
thFE
Yes
Yes
Yes
Yes
Yes
Yes
Mea
nE
mC
are
7,56
6.25
2,71
9.70
2,30
8.49
411.
210.
283
0.07
9M
ean
Non
-Em
Car
e6,
086.
932,
787.
992,
423.
9036
4.09
0.27
10.
092
Obs
erva
tion
s3,
909,
775
3,90
9,77
53,
909,
775
3,90
9,77
53,
909,
775
3,90
9,77
5
Con
trol
Hos
pita
lsin
Sam
eSt
ate
Hos
pita
lsin
Sam
eSt
ate
Hos
pita
lsin
Sam
eSt
ate
Hos
pita
lsin
Sam
eSt
ate
Hos
pita
lsin
Sam
eSt
ate
Hos
pita
lsin
Sam
eSt
ate
Notes:
⇤p<
0.10,⇤⇤
p<
0.05,⇤⇤
⇤p<
0.01.
Thi
sta
ble
pres
ents
leas
t-sq
uare
ses
tim
ates
ofE
quat
ion
(1)
whe
reth
eE
mC
are
even
tis
the
entr
yof
Em
Car
ein
toa
hosp
ital
.E
ach
obse
rvat
ion
isa
pati
ent
epis
ode.
The
cont
rolgr
oup
inal
lre
gres
sion
sin
clud
esho
spit
als
from
the
sam
est
ate
asth
eho
spit
als
whe
reE
mC
are
entr
yoc
curr
ed.
We
win
sori
zed
the
top
and
bott
ompe
rcen
tile
ofho
spit
alan
dph
ysic
ian
paym
ents
.Im
agin
gis
anin
dica
tor
vari
able
capt
urin
gw
heth
era
pati
ent
had
anim
agin
gst
udy
perf
orm
eddu
ring
anE
Dvi
sit.
Adm
issi
onto
hosp
ital
isan
indi
cato
rva
riab
leth
atca
ptur
esw
heth
era
pati
ent
was
adm
itte
dto
the
hosp
ital
afte
ran
ED
visi
t.E
ach
regr
essi
onin
clud
esco
ntro
lsfo
rpa
tien
tag
e,ge
nder
,ra
ce,a
ndC
harl
son
scor
e.St
anda
rder
rors
are
clus
tere
dar
ound
hosp
ital
s.M
eans
are
draw
nfr
omth
ean
alyt
icsa
mpl
epo
pula
tion
unde
rlyi
ngth
ere
gres
sion
.A
lldo
llar
amou
nts
are
infla
tion
adju
sted
into
2015
dolla
rs.
91

App
endi
xTa
ble
A.8
:T
heIm
pact
ofE
mC
are
Ent
ryon
Hos
pita
ls’P
aym
ents
,and
Beh
avio
rU
sing
Con
trol
Hos
pita
lsM
atch
edV
iaP
rope
nsity
Scor
eW
eigh
ting (1)
(2)
(3)
(4)
(5)
(6)
Faci
lity
Cha
rge
Tota
lPa
ymen
tIn
sure
rPa
ymen
tPa
tien
tC
ost
Shar
ing
Imag
ing
Adm
issi
onto
Hos
pita
l
Em
Car
eE
ntry
1,05
4.61
***
182.
88*
149.
9932
.89*
*0.
009
0.01
1**
(305
.89)
(98.
48)
(90.
02)
(15.
27)
(0.0
06)
(0.0
05)
Hos
pita
lFE
Yes
Yes
Yes
Yes
Yes
Yes
Mon
thFE
Yes
Yes
Yes
Yes
Yes
Yes
Mea
nE
mC
are
7,56
6.25
2,71
9.70
2,30
8.49
411.
210.
283
0.07
9M
ean
Non
-Em
Car
e6,
662.
512,
544.
252,
193.
9635
0.28
0.28
00.
095
Obs
erva
tion
s17
9,28
817
9,28
817
9,28
817
9,28
817
9,28
817
9,28
8
Con
trol
Pro
pens
itySc
ore
Mat
chP
rope
nsity
Scor
eM
atch
Pro
pens
itySc
ore
Mat
chP
rope
nsity
Scor
eM
atch
Pro
pens
itySc
ore
Mat
chP
rope
nsity
Scor
eM
atch
Notes:
⇤p<
0.10,⇤
⇤p<
0.05,⇤
⇤⇤p<
0.01.
Thi
sta
ble
pres
ents
leas
t-sq
uare
ses
tim
ates
ofE
quat
ion
(1)
whe
reth
eE
mC
are
even
tis
the
entr
yof
Em
Car
ein
toa
hosp
ital
.E
ach
obse
rvat
ion
isa
pati
ent
epis
ode.
The
cont
rolg
roup
sar
eco
mpo
sed
ofho
spit
als
mat
ched
totr
eate
dho
spit
als
usin
gpr
open
sity
scor
esca
lcul
ated
usin
gen
try
aspr
edic
ted
bya
trea
ted
hosp
ital
’sbe
ds,t
echn
olog
y,an
dno
n-pr
ofit/
for-
profi
tst
atus
.W
ew
inso
rize
dth
eto
pan
dbo
ttom
perc
enti
leof
hosp
ital
and
phys
icia
npa
ymen
ts.
Imag
ing
isan
indi
cato
rva
riab
leca
ptur
ing
whe
ther
apa
tien
tha
dan
imag
ing
stud
ype
rfor
med
duri
ngan
ED
visi
t.A
dmis
sion
toho
spit
alis
anin
dica
tor
vari
able
that
capt
ures
whe
ther
apa
tien
tw
asad
mit
ted
toth
eho
spit
alaf
ter
anE
Dvi
sit.
Eac
hre
gres
sion
incl
udes
cont
rols
for
pati
ent
age,
gend
er,r
ace,
and
Cha
rlso
nsc
ore.
Stan
dard
erro
rsar
ecl
uste
red
arou
ndho
spit
als.
Mea
nsar
edr
awn
from
the
anal
ytic
sam
ple
popu
lati
onun
derl
ying
the
regr
essi
on.
All
dolla
ram
ount
sar
ein
flati
onad
just
edin
to20
15do
llars
.
92

Appendix Table A.9: Comparison of Entry Hospital Characteristics and EmCare Hospitals We Observe inthe Cross-section
Hospital Characteristics EmCareHospitals
EmCare EntryHospitals
P-value fromtwo-sided t-test
For-profit 0.45 0.47 0.80Non-profit 0.32 0.33 0.91Government 0.23 0.19 0.67Teaching 0.03 0.00 0.26Hospital Beds 151.31 181.06 0.31Technologies 39.75 42.36 0.63Hospital HHI 0.57 0.58 0.91Proportion Medicare 49.54 48.67 0.72Proportion Medicaid 17.92 20.04 0.22ED Physicians per Capita (per 10,000) 0.67 0.66 0.83Physicians per Capita (per 10,000) 21.52 20.08 0.09Physician HHI 0.41 0.49 0.07Insurer HHI 0.37 0.35 0.52Household Income ($) 37,509.40 35,372.57 0.12Gini Coefficient 0.33 0.33 0.67Notes: The table compares the characteristics of hospitals where we observe EmCare enter to hospitals where weinfer EmCare has a contract but cannot identify the entry date. The p-value is reported from a two-sided t-testcomparing the difference in means between hospitals and hospitals with entry.
93

Appendix Table A.10: The Impact of EmCare Entry on the Historical Spending and Charlson Score ofTreated ED Patients
(1) (2) (3) (4)
6 monthhistoricalspending
12 monthhistoricalspending
6 monthCharlson
12 monthCharlson
EmCare Entry 820.39*** 1,232.60*** 0.02** 0.03***(225.46) (392.17) (0.01) (0.01)
Hospital FE Yes Yes Yes YesMonth FE Yes Yes Yes YesMean EmCare 5,903.65 10,910.82 0.28 0.40Mean Non-EmCare 6,251.32 11,483.54 0.33 0.45Observations 8,430,842 7,066,887 8,430,842 7,066,887
Control All Non-EmCareHospitals
All Non-EmCareHospitals
AllNon-EmCare
Hospitals
AllNon-EmCare
HospitalsNotes:
⇤p < 0.10, ⇤⇤p < 0.05, ⇤⇤⇤p < 0.01. This table presents least-squares estimates of Equation (1). Eachobservation is a patient episode. The control group in all regressions includes all hospitals in the US exclusive ofthose that outsourced their ED services to EmCare. We winsorized the top percentile of 6 and 12 month historicalspending. Standard errors are clustered around hospitals.
94

App
endi
xTa
ble
A.1
1:T
heIm
pact
ofE
mC
are
Ent
ryon
Cod
ing
Seve
rity
-R
obus
tnes
s
(1)
(2)
(3)
(4)
(5)
(6)
(7)
(8)
Cod
ing
Seve
rity
Cod
ing
Seve
rity
Cod
ing
Seve
rity
Cod
ing
Seve
rity
Cod
ing
Seve
rity
Cod
ing
Seve
rity
Cod
ing
Seve
rity
Cod
ing
Seve
rity
Em
Car
eE
ntry
0.11
6***
0.11
5***
0.11
4***
0.11
5***
0.11
8***
0.11
1***
0.11
6***
0.11
8***
(0.0
26)
(0.0
26)
(0.0
26)
(0.0
25)
(0.0
29)
(0.0
26)
(0.0
26)
(0.0
27)
Hos
pita
lFE
Yes
Yes
Yes
Yes
Yes
Yes
Yes
Yes
Mon
thFE
Yes
Yes
Yes
Yes
Yes
Yes
Yes
Yes
Mea
nE
mC
are
0.24
20.
242
0.24
20.
224
0.34
10.
206
0.23
20.
299
Mea
nN
on-E
mC
are
0.32
30.
323
0.32
30.
303
0.41
90.
275
0.29
70.
405
Obs
erva
tion
s8,
430,
842
8,43
0,84
28,
430,
842
6,97
0,94
61,
459,
896
2,81
0,30
22,
810,
262
2,81
0,27
8
Con
trol
No
Con
trol
s
Patien
tC
hara
cter
-is
tics
Patien
tC
hara
cter
-is
tics
and
Cha
rlso
nSc
ore
Cha
rlso
nSc
ore
of0
Non
-zer
oC
harl
son
Scor
e
Bot
tom
Thi
rdof
the
His
tori
cal
Spen
ding
Dis
trib
utio
n
Mid
dle
Thi
rdof
the
His
tori
cal
Spen
ding
Dis
trib
utio
n
Upp
erT
hird
ofth
eH
isto
rica
lSp
endi
ngD
istr
ibut
ion
Notes:
⇤p<
0.10
,⇤⇤p<
0.05
,⇤⇤⇤
p<
0.01
.T
his
tabl
epr
esen
tsle
ast-
squa
res
esti
mat
esof
Equ
atio
n(1
).E
ach
obse
rvat
ion
isa
pati
ent
epis
ode.
The
cont
rolg
roup
inal
lre
gres
sion
sin
clud
esal
lhos
pita
lsin
the
US
excl
usiv
eof
thos
eth
atou
tsou
rced
thei
rE
Dse
rvic
esto
Em
Car
e.W
ew
inso
rize
dth
eto
pan
dbo
ttom
perc
enti
leof
faci
lity
paym
ents
.St
anda
rder
rors
are
clus
tere
dar
ound
hosp
ital
s.In
colu
mns
6,7,
and
8hi
stor
ical
spen
ding
issp
litin
toth
irds
whe
reea
chco
lum
nco
ntai
nsth
esa
mpl
eof
pati
ents
from
the
bott
om,m
iddl
e,an
dup
per
thir
dof
spen
ding
.
95
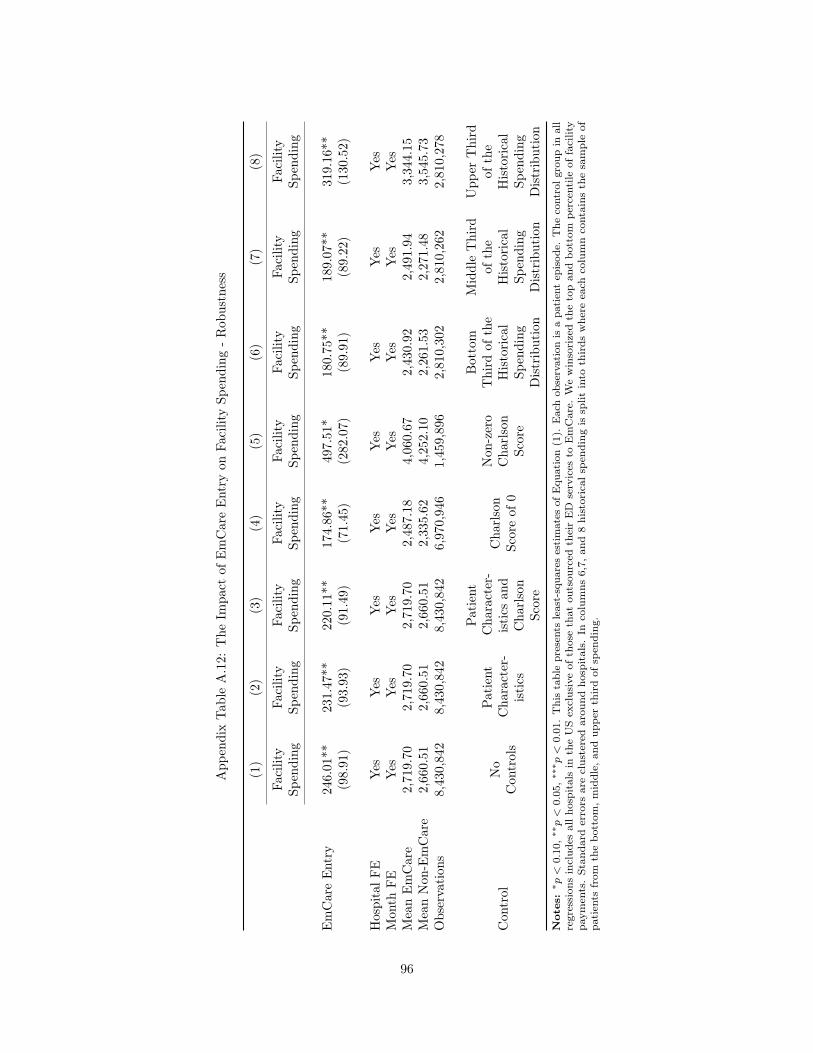
App
endi
xTa
ble
A.1
2:T
heIm
pact
ofE
mC
are
Ent
ryon
Faci
lity
Spen
ding
-R
obus
tnes
s
(1)
(2)
(3)
(4)
(5)
(6)
(7)
(8)
Faci
lity
Spen
ding
Faci
lity
Spen
ding
Faci
lity
Spen
ding
Faci
lity
Spen
ding
Faci
lity
Spen
ding
Faci
lity
Spen
ding
Faci
lity
Spen
ding
Faci
lity
Spen
ding
Em
Car
eE
ntry
246.
01**
231.
47**
220.
11**
174.
86**
497.
51*
180.
75**
189.
07**
319.
16**
(98.
91)
(93.
93)
(91.
49)
(71.
45)
(282
.07)
(89.
91)
(89.
22)
(130
.52)
Hos
pita
lFE
Yes
Yes
Yes
Yes
Yes
Yes
Yes
Yes
Mon
thFE
Yes
Yes
Yes
Yes
Yes
Yes
Yes
Yes
Mea
nE
mC
are
2,71
9.70
2,71
9.70
2,71
9.70
2,48
7.18
4,06
0.67
2,43
0.92
2,49
1.94
3,34
4.15
Mea
nN
on-E
mC
are
2,66
0.51
2,66
0.51
2,66
0.51
2,33
5.62
4,25
2.10
2,26
1.53
2,27
1.48
3,54
5.73
Obs
erva
tion
s8,
430,
842
8,43
0,84
28,
430,
842
6,97
0,94
61,
459,
896
2,81
0,30
22,
810,
262
2,81
0,27
8
Con
trol
No
Con
trol
s
Patien
tC
hara
cter
-is
tics
Patien
tC
hara
cter
-is
tics
and
Cha
rlso
nSc
ore
Cha
rlso
nSc
ore
of0
Non
-zer
oC
harl
son
Scor
e
Bot
tom
Thi
rdof
the
His
tori
cal
Spen
ding
Dis
trib
utio
n
Mid
dle
Thi
rdof
the
His
tori
cal
Spen
ding
Dis
trib
utio
n
Upp
erT
hird
ofth
eH
isto
rica
lSp
endi
ngD
istr
ibut
ion
Notes:
⇤p<
0.10
,⇤⇤p<
0.05
,⇤⇤⇤
p<
0.01
.T
his
tabl
epr
esen
tsle
ast-
squa
res
esti
mat
esof
Equ
atio
n(1
).E
ach
obse
rvat
ion
isa
pati
ent
epis
ode.
The
cont
rolg
roup
inal
lre
gres
sion
sin
clud
esal
lhos
pita
lsin
the
US
excl
usiv
eof
thos
eth
atou
tsou
rced
thei
rE
Dse
rvic
esto
Em
Car
e.W
ew
inso
rize
dth
eto
pan
dbo
ttom
perc
enti
leof
faci
lity
paym
ents
.St
anda
rder
rors
are
clus
tere
dar
ound
hosp
ital
s.In
colu
mns
6,7,
and
8hi
stor
ical
spen
ding
issp
litin
toth
irds
whe
reea
chco
lum
nco
ntai
nsth
esa
mpl
eof
pati
ents
from
the
bott
om,m
iddl
e,an
dup
per
thir
dof
spen
ding
.
96

App
endi
xTa
ble
A.1
3:T
heIm
pact
ofE
mC
are
Ent
ryon
Hos
pita
lIm
agin
gPe
rfor
med
inth
eE
D-
Rob
ustn
ess
(1)
(2)
(3)
(4)
(5)
(6)
(7)
(8)
Imag
ing
Imag
ing
Imag
ing
Imag
ing
Imag
ing
Imag
ing
Imag
ing
Imag
ing
Em
Car
eE
ntry
0.01
3***
0.01
1***
0.01
1***
0.01
1**
0.02
1**
0.01
3**
0.01
4**
0.00
8(0
.004
)(0
.004
)(0
.004
)(0
.005
)(0
.009
)(0
.006
)(0
.007
)(0
.005
)
Hos
pita
lFE
Yes
Yes
Yes
Yes
Yes
Yes
Yes
Yes
Mon
thFE
Yes
Yes
Yes
Yes
Yes
Yes
Yes
Yes
Mea
nE
mC
are
0.28
30.
283
0.28
30.
278
0.31
40.
261
0.27
60.
321
Mea
nN
on-E
mC
are
0.27
30.
273
0.27
30.
264
0.31
80.
250
0.25
50.
319
Obs
erva
tion
s8,
430,
842
8,43
0,84
28,
430,
842
6,97
0,94
61,
459,
896
2,81
0,30
22,
810,
262
2,81
0,27
8
Con
trol
No
Con
trol
s
Patien
tC
hara
cter
-is
tics
Patien
tC
hara
cter
-is
tics
and
Cha
rlso
nSc
ore
Cha
rlso
nSc
ore
of0
Non
-zer
oC
harl
son
Scor
e
Bot
tom
Thi
rdof
the
His
tori
cal
Spen
ding
Dis
trib
utio
n
Mid
dle
Thi
rdof
the
His
tori
cal
Spen
ding
Dis
trib
utio
n
Upp
erT
hird
ofth
eH
isto
rica
lSp
endi
ngD
istr
ibut
ion
Notes:
⇤p<
0.10
,⇤⇤p<
0.05
,⇤⇤⇤
p<
0.01
.T
his
tabl
epr
esen
tsle
ast-
squa
res
esti
mat
esof
Equ
atio
n(1
).E
ach
obse
rvat
ion
isa
pati
ent
epis
ode.
The
cont
rolg
roup
inal
lre
gres
sion
sin
clud
esal
lhos
pita
lsin
the
US
excl
usiv
eof
thos
eth
atou
tsou
rced
thei
rE
Dse
rvic
esto
Em
Car
e.W
ew
inso
rize
dth
eto
pan
dbo
ttom
perc
enti
leof
faci
lity
paym
ents
.St
anda
rder
rors
are
clus
tere
dar
ound
hosp
ital
s.In
colu
mns
6,7,
and
8hi
stor
ical
spen
ding
issp
litin
toth
irds
whe
reea
chco
lum
nco
ntai
nsth
esa
mpl
eof
pati
ents
from
the
bott
om,m
iddl
e,an
dup
per
thir
dof
spen
ding
.
97

App
endi
xTa
ble
A.1
4:T
heIm
pact
ofE
mC
are
Ent
ryon
Hos
pita
lAdm
issi
ons
from
the
ED
-R
obus
tnes
s
(1)
(2)
(3)
(4)
(5)
(6)
(7)
(8)
Adm
issi
ons
Adm
issi
ons
Adm
issi
ons
Adm
issi
ons
Adm
issi
ons
Adm
issi
ons
Adm
issi
ons
Adm
issi
ons
Em
Car
eE
ntry
0.01
8***
0.01
8***
0.01
7***
0.01
3***
0.04
0***
0.01
0**
0.01
5***
0.02
8***
(0.0
05)
(0.0
05)
(0.0
05)
(0.0
03)
(0.0
15)
(0.0
05)
(0.0
04)
(0.0
08)
Hos
pita
lFE
Yes
Yes
Yes
Yes
Yes
Yes
Yes
Yes
Mon
thFE
Yes
Yes
Yes
Yes
Yes
Yes
Yes
Yes
Mea
nE
mC
are
0.07
90.
079
0.07
90.
064
0.16
50.
062
0.06
70.
115
Mea
nN
on-E
mC
are
0.09
80.
098
0.09
80.
078
0.19
70.
072
0.07
80.
152
Obs
erva
tion
s8,
430,
842
8,43
0,84
28,
430,
842
6,97
0,94
61,
459,
896
2,81
0,30
22,
810,
262
2,81
0,27
8
Con
trol
No
Con
trol
s
Patien
tC
hara
cter
-is
tics
Patien
tC
hara
cter
-is
tics
and
Cha
rlso
nSc
ore
Cha
rlso
nSc
ore
of0
Non
-zer
oC
harl
son
Scor
e
Bot
tom
Thi
rdof
the
His
tori
cal
Spen
ding
Dis
trib
utio
n
Mid
dle
Thi
rdof
the
His
tori
cal
Spen
ding
Dis
trib
utio
n
Upp
erT
hird
ofth
eH
isto
rica
lSp
endi
ngD
istr
ibut
ion
Notes:
⇤p<
0.10
,⇤⇤p<
0.05
,⇤⇤⇤
p<
0.01
.T
his
tabl
epr
esen
tsle
ast-
squa
res
esti
mat
esof
Equ
atio
n(1
).E
ach
obse
rvat
ion
isa
pati
ent
epis
ode.
The
cont
rolg
roup
inal
lre
gres
sion
sin
clud
esal
lhos
pita
lsin
the
US
excl
usiv
eof
thos
eth
atou
tsou
rced
thei
rE
Dse
rvic
esto
Em
Car
e.W
ew
inso
rize
dth
eto
pan
dbo
ttom
perc
enti
leof
faci
lity
paym
ents
.St
anda
rder
rors
are
clus
tere
dar
ound
hosp
ital
s.In
colu
mns
6,7,
and
8hi
stor
ical
spen
ding
issp
litin
toth
irds
whe
reea
chco
lum
nco
ntai
nsth
esa
mpl
eof
pati
ents
from
the
bott
om,m
iddl
e,an
dup
per
thir
dof
spen
ding
.
98

Appendix Table A.15: ED Episodes and Annual Physician and Facility Spending forCare in New York State
EmergencyEpisodes
Total FacilitySpending
Total PhysicianSpending
PercentASO
Share ofEpisodes atIn-NetworkHospitals
2011 61,325 $156,174,143 $20,152,501 87.6% 99.0%2012 69,406 $176,099,801 $23,549,516 89.2% 99.4%2013 67,316 $185,283,334 $22,938,521 91.5% 99.6%2014 65,388 $187,270,755 $21,558,206 92.1% 99.8%2015 60,501 $184,643,289 $21,198,611 90.4% 99.8%
Total 323,936 $889,471,321 $109,397,356 90.2% 99.5%Notes: The table shows summary statistics for our data in New York State. Only episodes that occur inan in-network hospital are included. There are a small percentage of episodes (> 0.5%) that are missinga label for ASO or fully-insured.
99
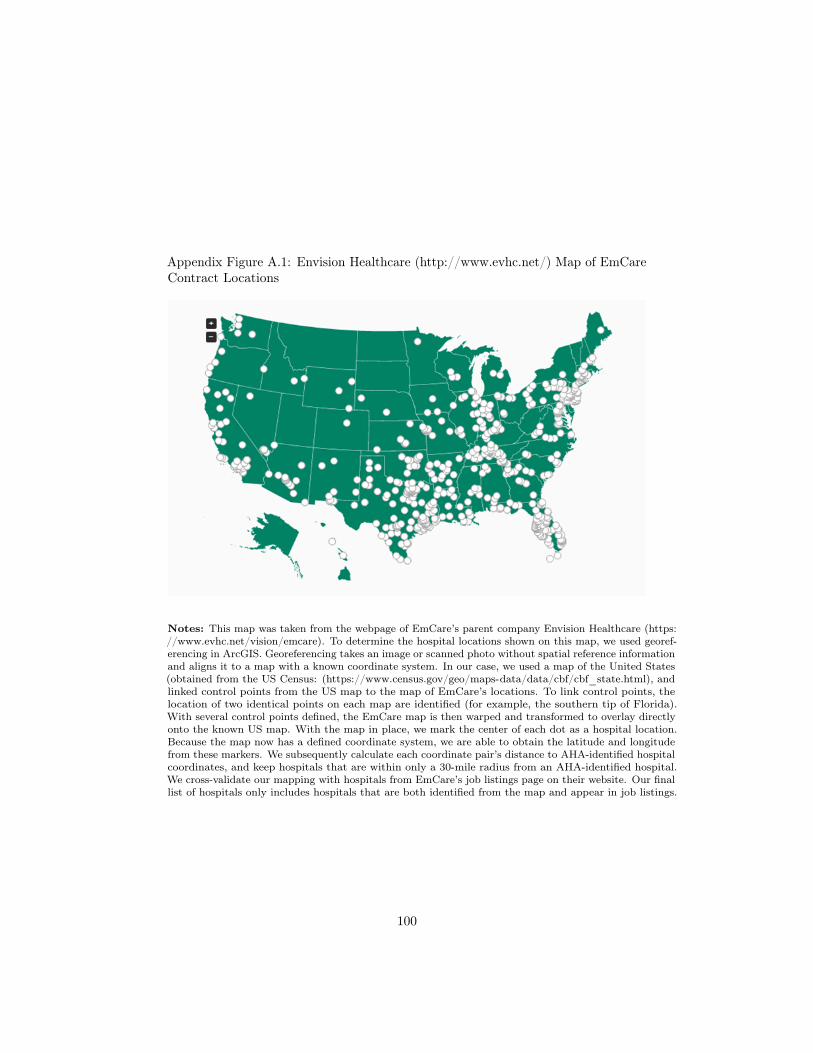
Appendix Figure A.1: Envision Healthcare (http://www.evhc.net/) Map of EmCareContract Locations
Notes: This map was taken from the webpage of EmCare’s parent company Envision Healthcare (https://www.evhc.net/vision/emcare). To determine the hospital locations shown on this map, we used georef-erencing in ArcGIS. Georeferencing takes an image or scanned photo without spatial reference informationand aligns it to a map with a known coordinate system. In our case, we used a map of the United States(obtained from the US Census: (https://www.census.gov/geo/maps-data/data/cbf/cbf_state.html), andlinked control points from the US map to the map of EmCare’s locations. To link control points, thelocation of two identical points on each map are identified (for example, the southern tip of Florida).With several control points defined, the EmCare map is then warped and transformed to overlay directlyonto the known US map. With the map in place, we mark the center of each dot as a hospital location.Because the map now has a defined coordinate system, we are able to obtain the latitude and longitudefrom these markers. We subsequently calculate each coordinate pair’s distance to AHA-identified hospitalcoordinates, and keep hospitals that are within only a 30-mile radius from an AHA-identified hospital.We cross-validate our mapping with hospitals from EmCare’s job listings page on their website. Our finallist of hospitals only includes hospitals that are both identified from the map and appear in job listings.
100

Appendix Figure A.2: Sample EmCare Job Listing Page
Notes: This screen grab is taken from EmCare’s job hiring page. (https://www.emcare.com/careers/clinical-job-search)
101

Appendix Figure A.3: The Distribution of Out-of-Network Billing Across Hospitals– 2011, 2013, and 2015
Notes: The figure shows the distribution of the prevalence of out-of-network billing across hospitalsin 2011, 2013, and 2015. There are 3,345 hospitals in each year of this data.
102
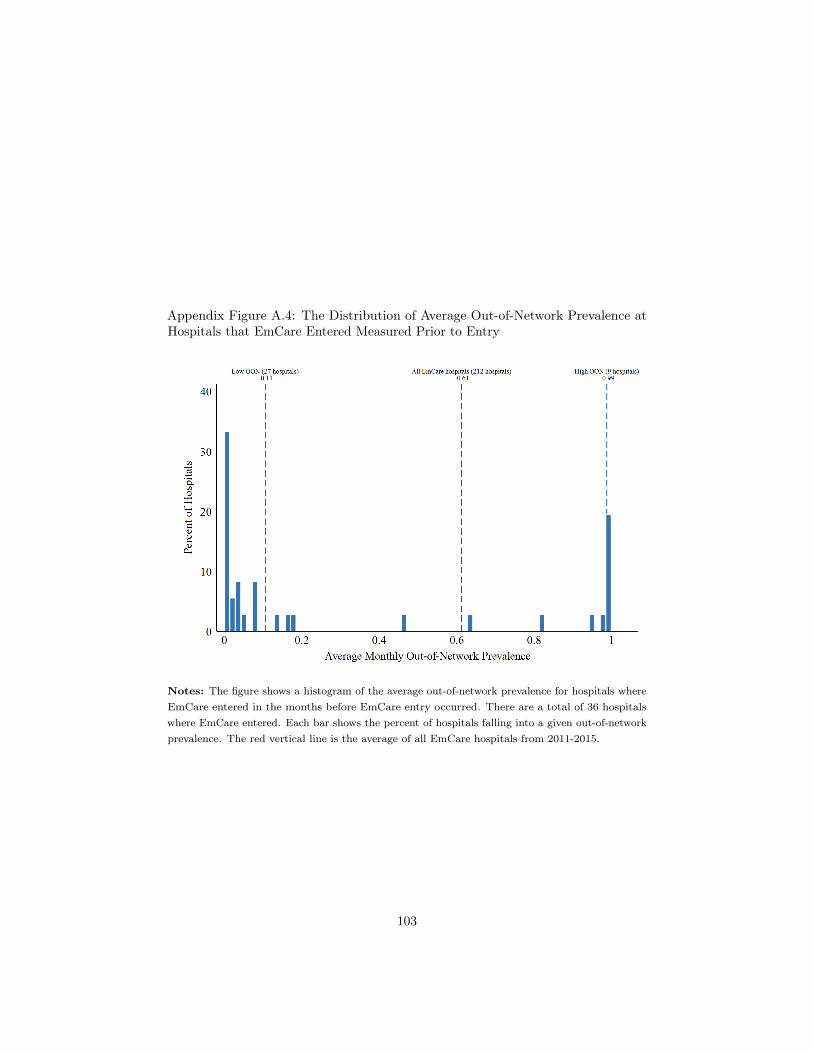
Appendix Figure A.4: The Distribution of Average Out-of-Network Prevalence atHospitals that EmCare Entered Measured Prior to Entry
Notes: The figure shows a histogram of the average out-of-network prevalence for hospitals whereEmCare entered in the months before EmCare entry occurred. There are a total of 36 hospitalswhere EmCare entered. Each bar shows the percent of hospitals falling into a given out-of-networkprevalence. The red vertical line is the average of all EmCare hospitals from 2011-2015.
103

Appendix Figure A.5: Out-of-Network Prevalence at Hospitals Where EmCareEntered and Exited
Panel A - Entry Panel B - Entry
Panel C - Entry Panel D - Entry
Panel E - Entry Panel F - Entry
104

Appendix Figure A.5: Out-of-Network Prevalence at Hospitals Where EmCareEntered and Exited (continued)
Panel G - Entry Panel H - Entry
Panel I - Entry Panel J - Entry
Panel K - Entry Panel L - Entry
105

Appendix Figure A.5: Out-of-Network Prevalence at Hospitals Where EmCareEntered and Exited (continued)
Panel M - Entry Panel N - Entry
Panel O - Entry Panel P - Entry
Panel Q - Entry Panel R - Entry
106

Appendix Figure A.5: Out-of-Network Prevalence at Hospitals Where EmCareEntered and Exited (continued)
Panel S - Entry Panel T - Entry
Panel U - Entry Panel V - Entry
Panel W - Entry Panel X - Entry
107

Appendix Figure A.5: Out-of-Network Prevalence at Hospitals Where EmCareEntered and Exited (continued)
Panel Y - Entry Panel Z - Entry
Panel AA - Entry Panel BB - Entry
Panel CC - Entry Panel DD - Entry
108

Appendix Figure A.5: Out-of-Network Prevalence at Hospitals Where EmCareEntered and Exited (continued)
Panel EE - Entry Panel FF - Entry
Panel GG - Entry Panel HH - Entry
Panel II - Entry Panel JJ - Entry
109

Appendix Figure A.5: Out-of-Network Prevalence at Hospitals Where EmCareEntered and Exited (continued)
Panel KK - Exit Panel LL - Exit
Panel MM - Exit
Notes: Each panel plots the average quarterly out-of-network billing prevalence at hospitals whereEmCare entered and exited. We present the data from the four quarters before and after an entryor exit event.
110

Appendix Figure A.6: The Impact of EmCare Entry on Patients’ 6- and 12-monthhospital spending and 6- and 12-Month Charlson Score
Notes: The panels plot the monthly average by hospital from 12 months before to 12 months afterEmCare entered the hospital. Panel A presents the impact of entry on 6-month historical spending,Panel B presents the impact of entry on 12-month historical spending, Panel C presents the impactof entry on the 6-month historical Charlson score, and Panel D presents the impact of entry on the12-month historical Charlson score. We exclude the top 1% observations in each panel. The localpolynomial is weighted by the number of episodes in each month. There is six month period ofuncertainty on either side of entry and exit dates, which we denote by shading the area gray.
111