issn: 2278-2427 comparison of propagation models for small
TRANSCRIPT

Integrated Intelligent Research(IIR) International Journal of Communication and Networking System Volume: 01 Issue: 01 June 2012,Pages No.36-42
ISSN: 2278-2427
36
Comparison of Propagation Models for Small Urban Cells in GSM Network
Naima Bouzera1,Abdelkrime Kheirddine2
1Geni electric laboratory, faculty of technology,University of Bejaia (06000), Algeria 2 Geni electric laboratory, faculty of technology,University of Bejaia (06000), Algeria
Email:[email protected],[email protected] Abstract— It was summed up purpose of this work is to compare the models of spread for the small urban cells in GSM, with objective to test their behaviour. Engineering radio constitutes one of the most important aspects during the deployment of a cell network as much as it is responsible for the quality level of service given to the subscribers. In environment to indoor, the sign is subjected to different weakening that can attain 30 dB. In effect, the spread in this middle depends on several characteristics to know the architectural data of buildings, in other words types of used building materials, the size of the windows, etc. We are interested in this paper to introduce different models of prediction of urban spread in environment. After different comparisons, we concluded that the model of COST-CNET is the most appropriate to make a prediction of weakening for a local zone with strong concentration. Keywords—prediction, propagation model, propagation measurements, radio propagation, urban area
I. INTRODUCTION In wireless communication the losses occurred in between transmitter and receiver is known as propagation path loss. Path loss is the unwanted reduction in power single which is transmitted. We measure this path loss in different area like rural, urban, and suburban with the help of propagation path loss models. Wireless communications provide high-speed high-quality information exchange between portable devices located anywhere in the world. These models can be broadly categorized into three types; empirical, deterministic and stochastic. Empirical models are those based on observations and measurements alone. These models are mainly used to predict the path loss, but models that predict rain-fade and multipath have also been proposed [3]. The deterministic models make use of the laws governing electromagnetic wave propagation to determine the received signal power at a particular location. Deterministic models often require a complete 3-D map of the propagation environment. An example of a deterministic model is a ray tracing model [4]. Stochastic models, on the other hand, model the environment as a series of random variables. These
models are the least accurate but require the least information about the environment and use much less processing power to generate predictions. Empirical models can be split into two subcategories namely, time dispersive and non-time dispersive [2,5].
II. CELL CONCEPT
A cell network divides the zone to be covered, in general a whole country, in small zones called cells. Each of the cells is served by a basic station (BS: Base Station) which accepts a party of available frequencies.It is with these basic stations that communicate all active mobile phones being in the concerned cell. Since two communications radio using the same frequency interfere the one with other one when they are between both transmitters, what puts in an obvious place that the same frequencies cannot be used by two neighbouring basic stations.
Two cells using the same frequencies
Cluster of 7 frequencies Figure1. Theoretical example of cellular coverage
III. MECHANISMS OF SPREAD
The mechanisms of radio-mobile spread in circles Indoor are principally linked to cogitation, transmission, and diffraction, broadcasting and basic structure of scenario. All these phenomena are at the origin of the distorsion and at the alleviation of the sign. For any receivers, displacements with small ladders generate at the level of the potency accepted from fluctuations since this last is the result of several elements caused by the various mechanisms of spread [1].

Integrated Intelligent Research(IIR) International Journal of Communication and Networking System Volume: 01 Issue: 01 June 2012,Pages No.36-42
ISSN: 2278-2427
37
IV. SPREAD RADIO
The radio electrical wave is subject to numerous changeability of temperature, to humidity, electromagnetic characteristics, etc. In other words of in fluctuations at time and in space. With this effect, we have the most persistent three phenomena in spread radio as an environment Indoor: cogitation, diffraction and broadcasting. It is to maintain at this stadium that the mass media of communication is uncontrollable. In effect, three types of variations of the radio-mobile channel come to light. In a first place, they find variations on a large scale or weakening of courses (Pathloss) which are losses of spread owed to the distance gone through by the wave radio. Then, they differentiate the effect of mask (Shadowing effect) which comes as being alleviations of potency of the sign owed to meet obstacles. The last type of variation of the channel mobile radio is linked to numerous itineraries. In what follows, we introduce different models of prediction of spread in middle indoor but we remind of spread in free space before.
V. THE SPREAD IN FREE SPACE
Spread in free space is a theoretical case which, in practice, is only seldom proved. In effect, it is cases where no obstacle is present between the transmitter and the receiver, they speak then about direct visibility which is determined from the ellipsoidsofFresnel. The equation of the weakening in free space is given by following expression [4]:
32.4 + 20 log (f) + 20 log(d)L
Withf:thefrequencyexpressedinMhz d: distance between the transmitter and the receiver, expressedinKm. The principle of the models of spread is to calculate alleviation in free space and add it a corrective factor. We are interested in what follows in different models of spread but we limit ourselves to those of circles indoor as much as our interest aims at environments inside.
VI. MODELS OF SPREAD
Engineering radio constitutes one of the most important aspects of the deployment of a cell network in quality of service given to the subscribers.In urban environment, the sign is subjected to different weakening. In effect, the spread in this middle depends on several characteristics: the height of LOW VOLTAGES (foundation transmitter station), their sites, the height of buildings, the breadth of streets etc. The radioelectrical wave is subjected of it made to numerous distortions caused by physical obstacles (building, transports, tree). In the field of radiocommunications, there are several models of spreads which can be used for the dimensionnement of the radioelectrical coverage. We are interested in this chapter to introduce different models of prediction of spread in urban environment; where we shall itemize the model of course more. Comprehension and installation of a mobile network such as GSM network require a definite characterization of the radio-mobile channel, In effect, the modelling of the channel radio can be assured by mathematical models which allow to predict the variation of the level of accepted sign. These models are also used to help us to determine the optimum positions of antennae and in the analysis of the quality of service. So, we can differentiate three big families:The empirical models (called still model statistical) which are based on analyses statistics a big number of experimental measurements and that take into account different parameters such as the height of buildings, basic stations, the terminal while taking into consideration various influence of environment. -The determinist models which are based on the fundamental laws of physics, and call complex mathematical relations which are difficult to use.
-Models semi determinists which combine both approaches. Au cours de ce papier, nous allons étudier les différents modèles déjà existants, pour la prédiction en milieu urbain.In the course of this paper, we are going to study the different already existent models, for prediction in urban middle. Of such models rest on the collection of a number mattering enough from data. After a statistical analysis of these data they extrapolate equations giving an average pathloss at a given distance. Equations which are deducted include there in general less dozen parameters. They are therefore easy to implement and express in implementer in a program. Their main advantage is that we not need a presentation specifies of the zone to be covered. [4]
VII. OKUMURA-HATA model [6]
It is the most used empirical model, it acts as foundation in a big variety of more refined models, he is based on measurements made by Okumura in Tokyo. The model of Hata was spread in 2GHz to allow planning radio of networks DCS on 1800. Medium losses are expressed according to: - the height of the antenna of program (basic station) hsb (there m);
(II.1)

Integrated Intelligent Research(IIR) International Journal of Communication and Networking System Volume: 01 Issue: 01 June 2012,Pages No.36-42
ISSN: 2278-2427
38
- the height of the antenna of reception motive) h m (there m);- Distance D between the basic station and the motive - frequency in MHz. The domain of validity is given as follows:
30m hsb 200m 1m h m 10m 1km D 20km 1500MHz f 2000MHz
The weakening is given by following expression:
1. In urbain area : Lu = 46.3 + 33.9 Log (f) – 13.82 Log (hsb) – a (h m) + (44.9 – 6.55 Log (hsb) Log (d) + Cm
A factor of correction is used to take into account the height of the antenna of mobile reception and the environment in which it is: a (hm) = (1.1 Log (f) – 0.7) h m – (1.56 Log (f) – 0.8 for a city of medium size
a (hm) = 3.2 (log1.54 h m) 4.97 for a big city (f >400 MHz) 0 dB for the cities of medium size Cm= 3 dB for the big cities
2. Suburbain area : Lsu = Lu 2
3. Rural area : Lr = Lu 4.78 (Log f) ² 18.33 Log f 40.94
VIII. BERTONI-WALFISCH model [1]
The model of BERTONI-WALFISCH takes into account positionings of buildings l 'influence on a communication mobile radio. He assumes that spread is made in most cases by diffraction at the top of buildings being in the neighbourhood of the mobile receiver. It considers that attenuation of course am composed of three parties: •Attenuation between two antennae in free space. • Attenuation sudden by the field at the top of building, who is owed to the losses of diffraction across a series of rows building. • The losses of diffraction at the top of building neighbour of the motive. The total attenuation is expressed as follows: Aff = Aff0 +Aff1 With: Aff0: is the attenuation in free space given by relation Aff0 = 32.4 + 20 log (f) + 20 log (D) Aff1: correction term which takes into account the curvature of the earth and the urban environment.
And :
Where: D:distanceinKm. f: frequency in MHz. d: distance between buildings in (m). hb: the medium height of buildings in (m). hsb: the height of the basic station. hm: height of the motive in (m). This model is applicable to urban areas and suburban. It assumes that the antenna heights of base stations are quite high and surrounded by rows of buildings of similar height and regularlyspaced apart by a distance d. In other words, it assumes that streets are perpendicular to the incident rays.
IX. IKEGAMI model[1]
It is based on the theory of geometric perspective, where they consider the spread of the wave restricted in two rays. He assumes moreover, an ideal structure of a city with an uniform height of buildings. It is expressed by following relation: Aff = Aff0 + Aff1 With: Aff0: free-space loss given previously (model of BERTONI-WALFISCH). Aff1: weakening of reflection, diffraction, it is given by:
With: φ: orientation of the street in comparison with the incidental ray (in degree) hb: medium height of buildings. L: the coefficient of cogitation of buildings is. Ikegami assumes that buildings introduce weakening of 6dB.
X. SAKAGAMI-KUBOI model [3]
This analysis is based on measurements performed in the Japan in urban circles. These measurements are analysed by the procedure of numerous declines to find the influence of parameters characterizing urban middle on the weakening of spread, such
(f) Log 20 log(hb) 6,1 (hmt) Log 1,4 0.023 (w) Log 7,1- 100Aff
Dlogdh3.1log43.42dhlog2
hsbhst3.724.37
3.23f13e

Integrated Intelligent Research(IIR) International Journal of Communication and Networking System Volume: 01 Issue: 01 June 2012,Pages No.36-42
ISSN: 2278-2427
39
Where : hsb : height of the basic station.. hb : the medium height of buildings. hm : height of the motive. D : distance between the motive and the basic station. hst : the height of the building in quoted by the basic station hmt : height of building along the road. W : breadth of roads. With : dh = hsb - hm w = 5- 50 m.
hmt = 5-80 m dh = 20- 100 m. h st < hsb D = 0.5 -5 Km.
XI. Model of COST-CNET : [1] The method of counting of the weakening comes from jobs of WALFISH and BERTONI on numerous diffraction by lined up bones and uniformly divided and on those of the IKEGAMI for the taking into account of the last diffraction at the level of the motive. Acquired complete losses decompose into four terms main representatives successively: • losses linked to distance between the transmitter and the receiver. • losses linked to numerous diffraction on bones. • losses linked to the last diffraction and to cogitation respectively on buildings and behind the motive. • losses linked to diffraction on a main bone. The total attenuation is modeled by the following formula:
deg Aff rts Aff msd Aff Aff0 Aff
1. Losses linked to distance between the transmitter and the receiver (Aff0):
It is an alleviation owed to spread in free space between the broadcasting antenna and the motive spaced out by a distance D. (weakening in free space given before (model of BERTONI-WALFISCH). 2. losses linked to numerous diffraction on bones (Aff msd) : The counting of this alleviation is based on the method of BERTONI and WALFISH reviewed by COST-231 [7]:
Affbsh =
d9logflogfKDlogdkkabshAffmsdAff
Ka=
The first two terms represent losses caused according to the height of the basic station to be known: Ka represents the increase of weakening when the antenna of the basic station is located under the niveaudes roofs of the adjacent buildings.Both terms K d and Kf control the dependency of weakening owed to numerous diffraction in function respectively of distance and frequency. .
bh bsh 18
bhbshifbh
bh - bsh 1518
Kdif
3. Osses from the last scattering and reflection on buildings and behind the mobile (Aff rts)
A hm) - (hb log 20 (f) log 10 (w) log 10 - 16.9- rts Aff
With :
Where : w : the breadth of the street
f : frequency φ : the orientation of the street from the radius.
4. losses due to diffraction of the main stops(Affdeg):
With : h : the height of clearing of the ellipsoid of Fresnel r : the ray of the ellipsoid of Fresnel.. These losses augment proportionately with distance between the basic station and the mobile receiver, and height of buildings.
90 55for )35 -(1140455 5for)35 -(07505235 0 for 354010-
A
r 'h1if
r 'h20 16
1r 'h5. 0if
r 'h88
5. 0r 'h5.0if
r'h126
5.0r 'hif0
Aff ge d

Integrated Intelligent Research(IIR) International Journal of Communication and Networking System Volume: 01 Issue: 01 June 2012,Pages No.36-42
ISSN: 2278-2427
40
XII. RESULTS AND SIMULATIONS
To implement the models of prediction of spread chosen, our approach consists in assuming data which characterize the zone nearly to study, to know the height of buildings, the breadth averages of streets and medium distance which separates two adjacent buildings Comparison of propagation models
With the intention of making a comparison of the different models studied in the previous chapter, we are going to take consideration the parameters of town planning there. So we Shall Compare the models which take count of these parameters to be known: Bertoni-Walfish, Ikegami, Sakagami and Cost-Cnet. However the model of Hata does not take into account it there, but he can be to apply to the babies or in the big cities, which we are going to use as mailman of comparisonconcerningthismodel. For the work we performed, we will use the following data according to our prediction:
Table.1 parameter values used in the simulation
We are going to start the first simulation by the simplest model, that of HATA .
Comparison without taking into account factors of town planning
0 50 100 150 200 250 300 350 400 450135
140
145
150
155
160
165
distance(x 0.01 Km)
affa
iblis
sem
ent e
n dB
moyennes villesgrandes villes
Comparison between the small and big cities in the model of Hata Figure3. Model of OKUMURA HASTENED, (level of variation of the weakening according to distance MS-BTS)
Comparison by taking into account factors of town planning The models of Bertoni-Walfish, Ikegami, Sakagami and Cost-Cnet take into account certain characteristics of the studied city
such as the orientation of streets, the height of buildings and spacing out between buildings. 1. Influence of the orientation of streets For this first comparison interest us to us to the first mailman who is the orientation of streets in comparison with the incidental wave coming from the basic station. Three models take into account this mailman to know COST-CNET, SAKAGAM and IKEGAMI.
0 50 100 150 200 250 300 350 400 450 50090
100
110
120
130
140
150
160
distance(x 0.01 Km)
affa
iblis
sem
ent e
n dB
20°55°75°100°
Figure4.Influence orientation of the street in the model IKEGAMI
Frequency of program f=1880Mhz
Height of antenna of program hub=30 m
Height of antenna of reception hm=2m
Distance between the transmitter and receiver D=3 à 5 km medium Breadth of streets w=10m
medium Height of buildings hb=15 m
Height of building along the street hmt=20 m
Height of building quoted of the basic station hst=15m medium Spacing out of buildings d= 12m Height antenna basic station of the motive h=28.5 m Coefficient of cogitation L=6 dB Orientation of the street in comparison with l 'axe principal of the beam Φ=55°
Integrated Intelligent Research(IIR) International Journal of Communication and Networking System Volume: 01 Issue: 01 June 2012,Pages No.36-42
ISSN: 2278-2427
41
0 50 100 150 200 250 300 350 400 450 50040
60
80
100
120
140
160
180
distance(x 0.01 Km)
affa
iblis
sem
ent e
n dB
20°55°75°100°
Figure5.Influence orientation of the street in the model SAKAGAMI
0 50 100 150 200 250 300 350 400 450 500100
120
140
160
180
200
220
distance(x 0.01 Km)
affa
iblis
sem
ent e
n dB
20°55°75°150°
Figure6. Influence orientation of the street in the model COST-CNET.
Figure7. Comparison between models SAKAGAMI, IKEGAMI et COST-CNET(Φ=55°)
0 50 100 150 200 250 3000
20
40
60
80
100
120
140
distance(x 0.01 Km)
affa
iblis
sem
ent e
n dB
d=10m
d=50md=100md=200m
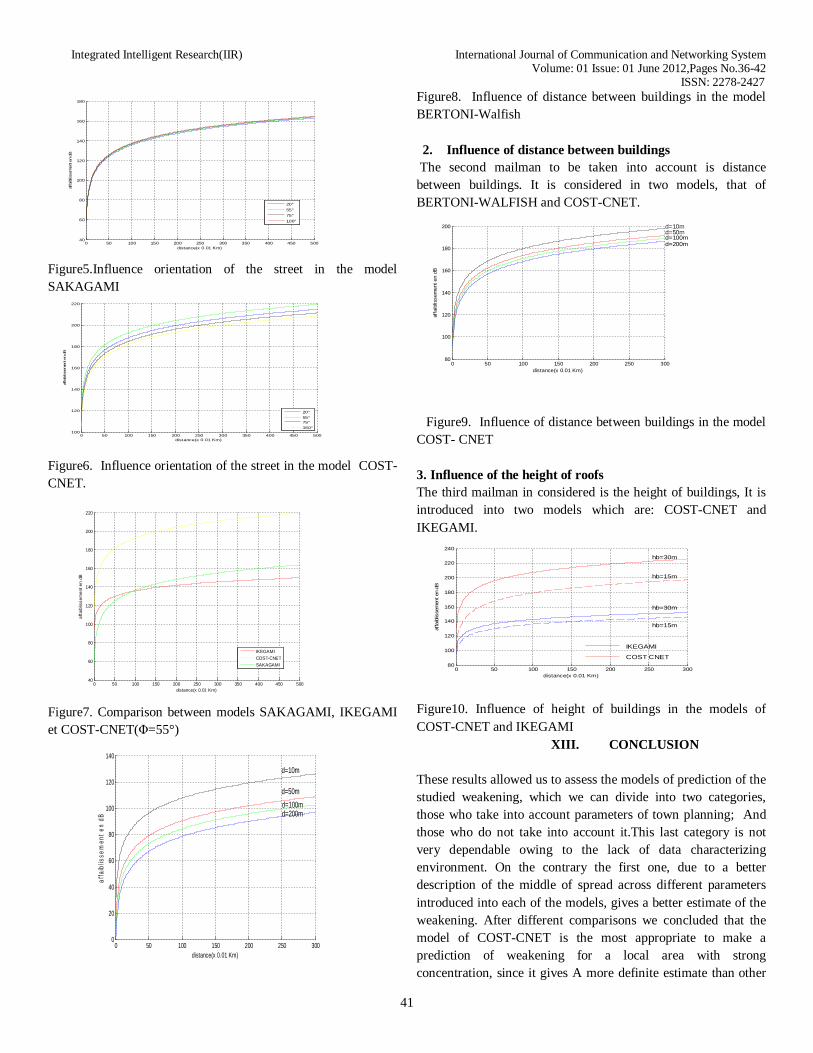
Figure8. Influence of distance between buildings in the model BERTONI-Walfish 2. Influence of distance between buildings
The second mailman to be taken into account is distance between buildings. It is considered in two models, that of BERTONI-WALFISH and COST-CNET.
0 50 100 150 200 250 30080
100
120
140
160
180
200
distance(x 0.01 Km)
affa
iblis
sem
ent e
n dB
d=10md=50m
d=200md=100m
Figure9. Influence of distance between buildings in the model COST- CNET 3. Influence of the height of roofs The third mailman in considered is the height of buildings, It is introduced into two models which are: COST-CNET and IKEGAMI.
0 50 100 150 200 250 30080
100
120
140
160
180
200
220
240
distance(x 0.01 Km)
affa
iblis
sem
ent e
n dB
COST CNET
IKEGAMI
hb=30m
hb=15m
hb=15m
hb=30m
Figure10. Influence of height of buildings in the models of COST-CNET and IKEGAMI
XIII. CONCLUSION
These results allowed us to assess the models of prediction of the studied weakening, which we can divide into two categories, those who take into account parameters of town planning; And those who do not take into account it.This last category is not very dependable owing to the lack of data characterizing environment. On the contrary the first one, due to a better description of the middle of spread across different parameters introduced into each of the models, gives a better estimate of the weakening. After different comparisons we concluded that the model of COST-CNET is the most appropriate to make a prediction of weakening for a local area with strong concentration, since it gives A more definite estimate than other
0 50 100 150 200 250 300 350 400 450 50040
60
80
100
120
140
160
180
200
220
distance(x 0.01 Km)
affa
iblis
sem
ent e
n dB
IKEGAMICOST-CNETSAKAGAMI

Integrated Intelligent Research(IIR) International Journal of Communication and Networking System Volume: 01 Issue: 01 June 2012,Pages No.36-42
ISSN: 2278-2427
42
models studied in this job, It characterizes at best the environment of spread.
REFERENCES [1] R.Charle House, Electronique appliquée : les antennes fondamentaux, 3éme édition, Dunod, Paris, 2006. [2] H.R.Anderson,Fixed Broadband Wireless System Design.John Wiley & co.2003 [3] R.K.Crane ˝Prediction of attenuation by rain,˝ IEEE Transactions on communications,vol.COM-28,pp.1727-1732,seotember 1980 [4].E.Athanasiadou,A.R.Nix,and, L.P.MeGeehan,˝A Microcellular raytracing propagation model and evaluation of its narrowband and wideband predictions,˝ IEEE journal on selected areas in comm..,wireless comm., series,vol.18 pp.322-355,march 2000 [5] Purnima K Sharma, R.K.Singh, “Comparative Analysis of Propagation Path Loss Models With Field Measured Data” IJEST, Vol.2(6)in 2010 at 2008-2013. [6] M. Hata, “Empirical formula for propagation loss in land mobile radio services,” IEEE Trans. Vehic. Technol., Vol VT-29, No. 3, pp. 317–325, Aug. 1980. [7] COST Action 231, “Digital mobile radio towards future generation systems, final report,” tech. rep., European Communities, EUR18957, 1999.