issue 6 - the centre for sustainable design
TRANSCRIPT

The Journal ofSustainable Product Design
ISSUE 6 : JULY 1998
ISSN 1367–6679
Re-THINK
Re-DESIGN
LEGO 1
LEGO 2
Li = 0Lq = 0Lf = 0Lt = 0
Re-PAIRRe-FINE

Re-THINK
Re-DESIGN
Re-PAIR
Re-FINERe-design will require looking at environmental issues in different ways through assembling new ideas and information
Recycled furniture designed by Meta Morf
Gallery, page 41
SS-BG30 Speakers made from ‘Tectan’,re-launched by Sony Wega Audio Group
Gallery, page 41
Baygen self-poweredlantern, designed by theBayGen Power Group
Gallery, page 41

5 EditorialMartin Charter, Joint Editor, The Journal of Sustainable Product Design
Analysis
7 Measuring product sustainabilityJoseph Fiksel, Jeff McDaniel and David Spitzley, Senior Director, Senior Consultant and Researcher, Battelle Memorial Institute, US
19 How important is environmental performance? A case study measuring the environmental preferences of ‘business to business’ consumersGraham Earl and Roland Clift, Research Engineer and Professor of Environmental Technology, Centre for Environmental Strategy, University of Surrey, UK
30 Design for Disassembly: a new element in product developmentDr Conrad Luttropp, Senior Research Associate, KTH Machine Design, Sweden
Gallery
41 Recycled furniture, Baygen self-powered lantern and SS-BG30 speakers
Analysis
42 Opportunities and constraints for product-oriented diagnosis toolsMarije Lafleur, René van Berkel and Jaap Kortman, IVAM Environmental Research, University of Amsterdam, the Netherlands
Interview
54 Professor Ezio ManziniMartin Charter, Joint Coordinator, The Centre for Sustainable Design, UK
Innovation
57 Sustainable ValueMartin Charter, Joint Coordinator, The Centre for Sustainable Design, UK
O2 news
60 Special feature: The Next Step event 98Martin Charter, Joint Coordinator, The Centre for Sustainable Design, UK
61 Reviews
63 Diary of events
© 1998 The Centre for Sustainable Design. All written material, unless otherwise stated, is the copyright of The Centre
for Sustainable Design, Surrey, UK. Views expressed in articles and letters
are those of the contributors, and not necessarily those of the publisher.
ISSN 1367–6679
The Journal ofSustainable Product Design
ISSUE 6 : JULY 1998

Editors
Martin Charter and Anne Chick, Joint Coordinators, The Centre for Sustainable, Design, UK
Articles, Interview, O2 News andJournal marketing: Martin Charter
Gallery, Reviews, Diary and Journal production: Anne Chick
The Journal of Sustainable Product Designencourages response from its readers to any of the issues raised in the journal. Entries for the Diary of events and materialto be considered for review should all besent to the Editors at the address below.
All articles published in the Analysissection are assessed by an externalpanel of business professionals,consultants and academics.
Subscription rates
The Journal of Sustainable Product Design is a quarterly journal appearing in themonths of April, July, October and Januaryeach year. Subscription rates for one year(four issues) are £90.00 (UK) and £100(non-UK) for the paper-based version, and£50.00 for the online version. Specialsubscription rates for developing countriesand students are available on application. Cheques should be made payable to TheSurrey Institute in £ sterling and sent to:
The Journal of Sustainable Product DesignThe Centre for Sustainable DesignFaculty of DesignThe Surrey Institute of Art & DesignFalkner RoadFarnhamSurrey GU9 7DSUKtel +44 (0)1252 892772fax +44 (0)1252 892747email: [email protected]: http://www.cfsd.org.uk
Editorial BoardAfricaGary OwenCEO, ResponseAbility Alliance (Zimbabwe)
AustralasiaProfessor Chris RyanDirector, Centre for Design, RoyalMelbourne Institute for Technology(Australia)
EuropeJacqueline Aloisi de LarderelDirector, Industry and Environment, UNEP(France)
Hans Peter BeckerManaging Director, Wilkhahn (UK) Ltd. (UK)
Professor Eric BillettWarden, Brunel University College (UK)
Professor Dr Michael Braungart Fachhochschule Nordostnierasachen(Germany)
Professor Han BrezetDirector, Section of Environmental ProductDevelopment, Faculty of Industrial DesignEngineering, Delft University of Technology(Netherlands)
Ian DumelowDean, Faculty of Design, Surrey Institute of Art & Design (UK)
Professor Dr Guenter FleischerDirector, Instit fuer TechnischenUmweltschutz, Technische UniversitatBerlin (Germany)
Peter JamesDirector, Sustainable Business Centre (UK)
Iris van de graaf de KeijserDirector, Kiva Product Ecology(Netherlands)
Professor Karl LidgrenDirector, The International Institute forIndustrial Environmental Economics, Lund University (Sweden)
Dorothy MacKenzieDirector, Dragon (UK)
Professor Ezio ManziniDirector, Facolta di Architettura, Unita di ricerca Progetto, Prodotto,Ambiente, Politecnico di Milano (Italy)
Dr Stefano MarzanoHead of Corporate Design, Philips International (Netherlands)
Dr Diana MontgomeryHead of Environment, AutomobileAssociation (UK)
Professor Jeremy MyersonContemporary Design, De Montfort University (UK)
Jonathan SmalesCEO, The Earth Centre (UK)
Sam TowleHead of Environmental Audit, The Body Shop International Plc (UK)
Dr Hans van WeenenDirector, UNEP Working Group on Sustainable Product Design,International Centre, University of Amsterdam (Netherlands)
Professor Jan-Olaf WillumsDirector, Foundation for Business andSustainable Development (Norway)
Dr Jonathan WilliamsDirector, Group for EnvironmentalManufacturing (UK)
USDr Brad AllenbyDirector, Environmental, Health & Safety, AT&T (US)
Professor Patricia DillonThe Gordon Institute, Tufts University (US)
Ralph Earle IIIDirector, The Alliance for EnvironmentalInnovation (US)
Professor John EhrenfeldDirector, Technology, Business andEnvironment Program, MassachusettsInstitute of Technology (US)
Dr Joseph FikselSenior Director, Strategic Environmental,Health & Safety Management, BattelleMemorial Institute (US)
James HartzfeldVice President, Interface ResearchCorporation (US)
Professor William McDonoughDean, Faculty of Architecture, University of Virginia (US)
Jacquelyn OttmanPresident, J Ottman Consulting Inc (US)
GENERAL INFORMATION
4 THE JOURNAL OF SUSTAINABLE PRODUCT DESIGN · JULY 1998

Factor 4 and beyond
The recent ‘Factor 4+’ confer-
ence in Klagenfurt, Austria high-
lighted that ‘Factor 4’ thinking
provides a goal and focus for
new product and service devel-
opment amidst huge uncertainty.
However, the transition towards
such solutions will not be easy.
The path towards a product or
service that incorporates a 400%
reduction in energy and material
consumption throughout its
lifecycle will require re-thinking
and new thinking through strate-
gies such as miniaturisation
and/or a shift from products to
services (de-materialisation).
These approaches are often
highlighted as routemaps for
environmental sustainability,
however, the practicalities are
often poorly thought through
and the impact on designers
and those managing ‘end of life’
issues is often ignored.
‘Factor 4+’ solutions will be
enabled through a mix of behav-
ioural change resulting from
better stakeholder education,
and innovative new technologies
and materials. Stakeholders will
need to ‘buy-in’ to the change.
Examples, can be derived from
sustainable city projects where
people have managed the transi-
tion from a dirty to a clean city
eg. Chattanooga, US. A major
success factor was recognising
and involving all major stake-
holders in envisioning a more
sustainable city, giving people a
stake in their future! Research
into green product development
indicates that companies often
do not involve external stake-
holders in the process for
competitive reasons and/or
because of ‘not invented here
syndrome’. To move ‘Factor 4’
forward will require smarter,
less inclusive thinking, and new
processes and systems.
Lifestyle shifts
This change will require lifestyle
shifts, with significant increases
in customer awareness and
understanding. As consumption
increases due to population
growth, it will not be enough
to focus solely on the materials
and energy efficiency in product
development. There will need
to be a move towards sufficiency
ie. less consumption. This will
require education, demand
management and potentially
reduced choice, which may
interfere with notions of free-
dom and freewill. How the
global society constructs a more
equitable consumption and
production system is the key
issue.
‘Since goods are finite, wants should be reduced to enhance happiness.’
Professor Dr Ryoichi Yamamoto,
Institute of Industrial Science,
University of Tokyo, Japan
‘Factor 4+’ conference in
Klagenfurt, Austria.
Happiness (increased ‘quality of life’) =Goods
Wants or wishes
Role of designers
Designers should play a major
role in ‘Factor 4+‘ process,
however cultural and profes-
sional awareness varies consider-
ably across the world. The
Netherlands have consistently
stimulated eco-design through-
out the nineties with central
government funding. For exam-
ple, in June 1998, Kaltalys was
launched, a joint venture
between TU Delft and TNO Delft
focusing on sustainable product
innovation. In Japan the focus
on energy efficiency was not
abandoned at the end of the ‘oil
crises’ in the seventies, but
rather it has continued and
extended to materials efficiency.
This has resulted in a range of
eco-design solutions from
EDITORIAL
5JULY 1998 · THE JOURNAL OF SUSTAINABLE PRODUCT DESIGN
Welcome to the sixth issue of The Journal of Sustainable Product Design
Martin Chartern
Joint Editor, The Journal of Sustainable Product Design

Japanese companies including
Sony, Canon and Fuji-Xerox.
However, many countries and
companies are still focusing on
‘middle of pipe’ issues eg. waste
minimisation, cleaner production
and ‘end of pipe’ solutions e.g.
air emission monitoring.
New tools
To enable eco-design will require
a recognition that ‘product
design’ is not generic and new
tools need to be developed. For
example, in designing a laptop
computer, there are a range of
designers involved, including
electronic and mechanical engi-
neers who are particularly inter-
ested in science and numerical
data, as well industrial designers
who are interested in aesthetics
and pictorial representations.
There is also a major need to
conceptualise the complete
product development process
from idea generation to launch
to ‘end of life’ and to develop a
portfolio of ‘green’ tools for the
range of stakeholders involved in
the process. Many of the existing
design tools have focused on
environmental evaluation eg.
LCA and have been costly and
time-consuming. There is a clear
and growing need for simpler
tools eg. ‘cut down’ and
simplified LCA’s that enable
quicker decision-making.
Innovation
A key opportunity is to use
environmental and/or broader
sustainability thinking as a
provocative device at the ‘front
of pipe’. For example, Philips
apply this process through its
EcoDesign programme and have
recently launched a range of
green(er) products. Extracts from
its ’Green to gold’ leaflet high-
light the companies approach:
Consumers throughout the world arelooking for innovative products while at the same time, reaching out for asustainable world… To integrate functionality and sustainability –balancing innovation with ecologicalimpact… We strive for intelligent products with sustainable design.Products with brains – that auto-matically switch on when you are homeand turn off when you are away.Products that will look great – thatyou’ll want to keep forever… We focuson five areas to enhance environmentalperformance: weight; hazardoussubstances; packaging; energy; andrecycling. These drivers led us to innovative options – options we imple-ment because they provide added valuefor our customers… We believe thatsustainable products are the productsthat will measure up in the future.
…and finally
The sixth issue of the Journal of
Sustainable Product Design high-
lights the importance of the need
for change: new tools, perspec-
tives and frameworks. Fiksel,
McDaniel and Spitzley of Batelle
Memorial Institute (US) focus on
the issue of measuring sustain-
able product performance,
incorporating the need to
explore social, as well as
economic, environmental and
considerations. Earl and Clift
from the University of Surrey
(UK) outline the results of a
research project amongst
purchasing managers which high-
lights obstacles to buying ‘green’
products, particularly printers
incorporating recycled plastic
and reusable ink jet cartridges.
Luttropp from ETH Machine
Design (Sweden) illustrates the
need to ‘factor in ‘ recycling and
disassembly considerations early
in the product development
cycle. Lafleur, van Berkel and
Kortman of IVAM Environmental
Research (Netherlands) outline
an eco-design tool aimed at link-
ing environmental evaluation to
environmental improvement,
using an example of a lighting
system. In the Innovation
section, the Editor considers
how SPDD relates to the process
of the delivery of the product or
service, as well as the final result
and the need to increase the
imbedded Sustainable Value of
final results. The interview with
Professor Ezio Manzini of
Politecnico di Milan (Italy) high-
lights opportunities resulting
from moving towards a more
systemic view of SPDD, and the
need to evolve a situation where
the customer takes a share of the
product’s eco-impact, alongside
the producer. Lastly, the O2 page
highlights papers from 02’s tenth
anniversary conference. •
EDITORIAL
6 THE JOURNAL OF SUSTAINABLE PRODUCT DESIGN · JULY 1998

7JULY 1998 · THE JOURNAL OF SUSTAINABLE PRODUCT DESIGN
ANALYSIS
Is our product or service sustain-able? Many industrial firms areposing this question as they beginto embrace the long-term goal ofsustainable development. Whileoperational definitions of sustain-ability provide general guidance,the actual evaluation of sustain-ability for a specific product orservice has proven challenging. The authors review current practices of leading companies,and then propose a SustainabilityPerformance Measurement framework that embodies threeprinciples – separation of resourceand value measures, explicit representation of the ‘triple bottomline’, and consideration of the fulllife cycle.
Introduction
Sustainability is a compelling
concept – who can resist the
argument that all products of
commerce should contribute to
preserving the quality of the
societal and ecological environ-
ment for future generations?
However, putting this concept
into practice has baffled some of
the best minds in leading global
corporations. How does one
distinguish a ‘sustainable’ prod-
uct from one that is not? This
question poses new challenges
for the design community,
extending far beyond the
traditional scope of product
development. Some of the
difficulties that arise are the:
· lack of consensus on a
pragmatic definition of
sustainability
· breadth of scope of sustain-
ability issues, many of which
are beyond the firm’s control
· potentially large amounts of
information required to
evaluate product sustainability
· difficulty in quantifying the
societal and ethical aspects
of sustainability.
Perhaps one of the most formi-
dable difficulties is the challenge
of business integration. To
successfully develop sustainable
products, a company must learn
how to effectively integrate
sustainability concepts into its
product development process.
Sustainable product design
cannot be practiced in isolation;
rather it must be one facet in a
multi-faceted approach that
considers cost, ease of use,
functional performance,
manufacturability, and other key
product requirements.
However, trying to achieve this
type of integration raises both
organisational and technical
Dr Joseph Fiksel is Senior Director ofBattelle’s Life Cycle Management
(LCM) group, with a 20-year manage-ment consulting career. Dr Fiksel is an
active member of the IEEE TechnicalAdvisory Board on Environmental Healthand Safety, and numerous other profes-sional organisations. He holds a BSc in
Electrical Engineering from MIT and aPhD from Stanford University inOperations Research. He is the
principal author and editor of Design for Environment: Creating Eco-Efficient
Products and Processes.
Jeff McDaniel is a Senior Consultant inthe LCM group of Battelle Memorial
Institute (BMI). Upon graduation fromTexas A&M University with a BS in
chemical engineering, he joined GeneralElectric. Jeff then completed the
Corporate Environmental ManagementProgramme at the University of Michigan
where he obtained a MBA and MS inEnvironmental Studies. Since joining
BMI, he has helped firms develop green accounting and performance
measurement programmes.
David Spitzley joined the LCM group atBMI as a researcher in January 1998.
Previously, he worked as a researchassistant and project leader in the areas
of life cycle design and LCA. at theUniversity of Michigan’s National
Pollution Prevention Center (NPPC)where he also obtained a BS degree in
chemical engineering.
Measuring productsustainability
Joseph Fiksel, Jeff McDaniel and David Spitzleyn
Senior Director, Senior Consultant and Researcher, Battelle Memorial Institute, US

8 THE JOURNAL OF SUSTAINABLE PRODUCT DESIGN · JULY 1998
ANALYSIS
issues. Organisational issues
include the establishment of
appropriate company policies
and incentives, modification
of existing business processes,
capture and dissemination of
sustainable design knowledge via
training and information tech-
nology, and achievement of
consistent practices across
diverse business units. Technical
issues include the implementa-
tion of various design strategies
– eg. modifying the material
composition of products so that
they generate less pollution and
waste, or changing the assembly
requirements so that fewer
material and energy resources
are consumed per product unit –
as well as systematic adoption
of sustainable design guidelines,
metrics, and tools.
These organisational and techni-
cal issues are equally important,
and must be addressed from the
strategic, tactical and operational
perspectives, as suggested in
Table 1. In reviewing this scope,
one fact becomes clear: a funda-
mental element of any successful
programme is the establishment
of measurable goals and perfor-
mance indicators. Without a
concrete basis for measuring
success, policy statements are
ineffectual, accountabilities are
ambiguous, and design evaluation
remains subjective and imprecise.
Therefore, this paper focuses
upon the emerging field of
sustainability performance
measurement.
While a number of performance
indicators have recently been
developed to measure eco-
efficiency, little work has been
done on less tangible aspects of
sustainability; namely, measuring
the socio-economic impacts of
products. Most organisations that
have published sustainability
indicators have focused upon
macro-environmental features
for a community or a society as
a whole. In contrast, product
developers need more focused
indicators that address the
beneficial or adverse impacts
associated with particular design
innovations.
To address that need, this article
first characterises the current
state of the art with respect to
sustainability performance
measurement, and then presents
a conceptual framework that will
support systematic development
of performance indicators for
virtually any type of product.
Although sustainability as a
business practice is still at an
embryonic stage, a viable
approach toward measuring
sustainability can be forged by
building on the general princi-
ples of performance measure-
ment and on the lessons learned
by companies during the past
decade in establishing environ-
mental performance evaluation
systems.
Review of sustainabilitymeasurement practices
‘Meeting the needs of the present with-out compromising the ability of futuregenerations to meet their own needs.’ –Brundtland Commission, 1987.
The original definition of sustain-
able development, provided by
the Brundtland commission,
proved to be too ambiguous to
allow organisations interested in
pursuing sustainability to estab-
lish meaningful goals and
metrics. Therefore, several
groups have revised this
definition to include three key
aspects of business performance
– economic, environmental and
societal.
Efforts to evaluate each aspect
of this ‘triple bottom line’ of
sustainability have progressed
somewhat independently, and
have reached different levels
of sophistication. As shown in
Figure 1, corporate reporting
practices for these three aspects
have evolved over vastly
Strategic Tactical Operational
Organisational Company policy Reward systems Performance and commitment and accountability indicators and targets
Technical Next-generation Key design concepts Design evaluation andR&D strategy and features improvement tools
Table 1: Scope of sustainable product design issues

9JULY 1998 · THE JOURNAL OF SUSTAINABLE PRODUCT DESIGN
ANALYSIS
different time frames. Corporate
financial reporting has been
providing information on
economic performance since the
beginning of the 20th century,
while corporate environmental
reporting has been practiced for
less than a decade. Corporate
social reporting was first
attempted in the 1970s, and has
recently been revived. Corporate
sustainability reporting, which
combines elements of all three
aspects, has been attempted only
in the last few years, and is still
in an exploratory phase. The
sections that follow discuss the
current ‘state of the art’ in
each of the three aspects of
sustainability performance
measurement.
Economic performance evaluation
Economic performance
evaluation has been practiced
for almost a century, although,
it is perhaps better known as
financial reporting. Standards for
externally reporting financial
results are highly developed, and
a variety of rigorous guidelines
and standards exist for these
financial indicators. In contrast
to this high level of standardisa-
tion for external financial
accounting, firms can choose
from a wide variety of manager-
ial accounting practices to
support internal decisions. Over
the last 20 years, the introduc-
tion of new accounting methods
such as activity-based accounting
and economic value added (EVA)
accounting has helped to reveal
the underlying drivers of
economic performance and
shareholder value (Blumberg,
1997).
To address the full scope of
sustainability, economic perfor-
mance evaluation must evolve
beyond traditional techniques
based solely on profitability and
cash flow. Specific issues include
(Epstein, 1996):
· quantification of hidden costs
associated with the utilisation
of material, energy, capital,
and human resources
· estimation of uncertain future
costs associated with external
impacts of industrial produc-
tion and consumption
· understanding the costs and
benefits incurred by various
stakeholders (customers,
employees, communities,
interest groups, etc.) across
the life cycle of a product or
process.
A host of new research into life
cycle accounting, environmental
accounting, and full cost
accounting has introduced new
techniques that serve to high-
light costs and benefits that are
not explicitly addressed with
conventional approaches. One of
the leading practitioners of these
new approaches is Chrysler
Corporation. In designing several
new automotive components,
Chrysler considered the direct,
potentially hidden and contin-
gent costs associated with each
design option. Direct and poten-
tially hidden costs were evalu-
ated with activity-based costing
methods, and contingent costs
were estimated with proprietary
risk factors developed by
Chrysler.
As an example, when Chrysler
developed an oil filter for a new
line of vehicles, they estimated
the direct material costs, some
of the potentially hidden manu-
facturing expenses, and possible
liabilities associated with waste
disposal (Armstrong and White,
1997). This evaluation revealed
that the design option with the
lowest direct costs (materials and
production labour) did not have
the lowest overall life cycle cost
because the hidden and liability
costs were greater than the
direct costs. Chrysler’s experi-
ence illustrates how these new
life cycle accounting methods
can help design teams to assess
Financial
1900 1920 1940 1960 1980 1998
Environmental
Social
Sustainability
Figure 1: Comparative time frames of triple bottom line reporting

10 THE JOURNAL OF SUSTAINABLE PRODUCT DESIGN · JULY 1998
ANALYSIS
product sustainability in
economic terms.
Environmental performanceevaluation
As shown in Figure 1, corporate
environmental performance
reporting has been practiced for
at least the past decade. Recent
research has demonstrated a
plausible connection between
improved environmental perfor-
mance and increased shareholder
value (Feldman, Soyka and
Ameer, 1997), and a growing
number of corporations have
begun to voluntarily report their
product and company environ-
mental performance (Blumberg,
1997). These reporting efforts, in
turn, have led to an increased
demand for standard environ-
mental reporting criteria, similar
to those for financial reporting.
For example, in 1992 the Public
Environmental Reporting
Initiative (PERI), a consortium
of global firms, developed an
influential set of guidelines for
environmental reporting. The
types of performance indicators
typically presented in conven-
tional environmental reports
include wastes and emissions,
employee lost-time injuries,
notices of violation, spills and
releases, etc.
With the introduction of the ISO
14000 series of standards, an
international consensus was
developed on the elements of an
Environmental Performance
Evaluation process, documented
in ISO 14031 (Fiksel, 1997). An
even more recent standardisation
initiative is the Global Reporting
Initiative (GRI). Launched by the
Coalition for Environmentally
Responsible Economies (CERES)
in the fall of 1997, the objective
of the GRI is to standardise the
methodology and format of
corporate environmental and
sustainability reports, and GRI
hopes to propose standard indi-
cators by the year 2000 (BATE,
1998). Although the standardisa-
tion debate continues, one indi-
cator of environmental perfor-
mance has been used by over
twenty companies to measure
environmental/economic rela-
tionships – eco-efficiency.
Eco-efficiency is generally
defined as a measure of environ-
mental performance relative to
economic input or output, and
has been implemented in a vari-
ety of ways, as illustrated in
Table 2. There are currently
several initiatives seeking to
standardise eco-efficiency
measurement; for example,
Canada’s National Round Table
on the Environment and
Economy (NRTEE) has enlisted
a number of firms in a pilot test
of material and energy intensity
indicators (NRTEE, 1997). Such
eco-efficiency indicators,
whether intended for enterprise-
level goal setting or for product
design, will be essential
components of any quantitative
evaluation of sustainability.
Societal performance evaluation
In the 1970s, many organisations
began developing standards for
Company Current eco-efficiency practice
Novo Nordisk Novo Nordisk has implemented an eco-efÞciency indicator that is calculated as the ratio of indexed turnover in constant prices to indexed resource consumption (NRTEE, 1997).
Northern Telecom Nortel has developed a composite Environmental Performance Indicator (EPI) that is (Nortel) annually tracked and reported relative to baseline 1993 performance (NRTEE, 1997).
Sony Europe Sony is utilising an EPI for batteries that is calculated as economic value added over the product life time divided by the sum of the non-recyclable material consumption and the production energy use (Lehni, 1998).
Dow Chemical Dow utilises a unique EPI in their product environmental assessments Ð the Eco-Compass. This structure includes evaluations of mass intensity, risk potential, energy intensity, reuse, resource conservation, and extent of service. Each of these compass directions is evaluated using product life cycle analysis data and the results are intended for use in design decision making (Lehni, 1998) (James, 1997).
Table 2: The use of eco-efÞciency indicators

11JULY 1998 · THE JOURNAL OF SUSTAINABLE PRODUCT DESIGN
ANALYSIS
corporate social accounting
(Epstein, 1996). While interest
in social evaluation faded in the
1980’s, efforts to measure and
report social performance have
resurfaced in the last few years.
This change is due partially to
the need for societal indicators
in the evaluation of sustainabil-
ity, and partially to the increased
media interest in the social
impacts of corporate operations.
Companies such as Nike and
Shell have discovered that stake-
holder concerns about manage-
ment policies and practices can
rapidly generate adverse public-
ity, damage brand image, and
alienate customers.
One company that has pursued
social reporting aggressively is
The Body Shop. The UK-based
hair and skin care product manu-
facturer and retailer released its
first Social Report in 1995. In this
and in the 1997 Values Report (a
combined social-ecological
performance report), The Body
Shop presents performance
results on over 200 stated targets
grouped into nine stakeholder
categories. Although impressive
in scope, The Body Shop’s
performance results are generally
derived from surveys and results
are presented as percentages of
stakeholder responses. This type
of information is no doubt
useful in policy setting and
internal performance tracking;
however, it does not directly
address the issue of sustainabil-
ity. British Petroleum (BP) has
attempted to evaluate its social
performance in a slightly differ-
ent manner. BP’s 1997 Social
Report provides case studies in
social impact assessment. Despite
being generally non-quantitative,
BP’s report acknowledges that an
important aspect of their social
performance is creating value in
the communities where they
operate. As companies advance
toward more sophisticated
sustainability performance
measurement, the value created
by products and operations will
become increasingly important.
With the emergence of efforts
like those of BP and the Body
Shop, there is an increased need
for social performance evalua-
tion methodologies and tools.
Responding to this need, the
Council on Economic Priorities
(CEP) has proposed SA 8000, a
social accountability standard
designed to follow in the path of
other ‘quality’ standards. CEP
hopes that like ISO 9000 and
ISO 14000, SA 8000 will become
the de facto standard for evaluat-
ing the quality of a company’s
social performance. Although SA
8000 makes significant advances
in standardising the evaluation of
corporate commitment to
human rights issues, such as
worker safety and equality, the
issues covered by the standard
include only a limited subset
of the issues implied by sustain-
ability (Ranganathan, 1998).
Recognising that existing
approaches do not address the
full scope of sustainability
concerns, a coalition has
recently formed to develop
appropriate societal performance
measures. The group, led by
Shell, plans to develop indicators
that enable a firm to evaluate its
societal impact. Although the
effort will be specific to Shell,
the results are likely to have
implications for sustainability
evaluation in other organisations
as well.
Sustainability performancemeasurement (SPM)
As standards and accepted
methodologies have evolved in
economic, environmental and
societal performance evaluation,
a few companies have begun to
publish integrated sustainability
reports. In 1997, Interface, a US
carpet manufacturer, published
what is believed to be the first
sustainability report. This early
reporting effort demonstrates
that Interface is committed to
sustainable development and has
taken initial steps to identify
potential sustainability indica-
tors. However, this initial report
does not clearly indicate a
framework which will be utilised
in future performance measure-
ment and progress evaluation.
Monsanto, the newly emerged
life-sciences company, has also
published a sustainability report.
The Monsanto report provides
an initial framework for product
sustainability evaluation.
However, Monsanto admits that
this framework has yet to be
implemented.
The lack of quantified perfor-
mance indicators in the Interface
and Monsanto sustainability
reports is not surprising, SPM is
still in its infancy and these
companies are attempting to
expand the boundaries of
available methodologies. These
early attempts at integrated
sustainability measurement high-
light the need for a framework
that facilitates meaningful indi-
cator development.

12 THE JOURNAL OF SUSTAINABLE PRODUCT DESIGN · JULY 1998
ANALYSIS
The Sustainable Business Centre
in the UK has developed a prod-
uct design tool to address the
need for sustainability measure-
ment – the ‘Sustainability Circle’
(James, 1997). The circle is a
graphical representation of prod-
uct performance based on the
results of 16 indicators. These
indicators are grouped into
categories which encompass the
‘triple bottom line’ perspective.
The Sustainable Business Centre
uses five categories to evaluate
product sustainability, they are:
physical environmental impacts,
product attributes, social
impacts, transport, and customer
value. Indicator scores are
provided to the decision-maker
by shading the appropriate
section of the circle a specific
colour.
For example, if the design team
determines that the product has
excessive energy use, the corre-
sponding section of the circle
would be red. If the product has
a major sustainability advantage,
such as elimination of hazardous
waste, another section of the
circle would be shaded dark
green. This process continues
until each section of the circle
has been assigned a colour, thus
providing decision-makers with
an easy to grasp visual display
of the ‘trade offs’. This type of
graphical representation is
universally understandable, and
leaves it up to the product
development team to determine
what specific performance
indicators would be most
meaningful within each category
of sustainability.
Influencing the productdevelopment process
As described above, a number of
pioneering companies are adopt-
ing sustainability goals and
beginning to introduce sustain-
ability considerations into the
product development process.
Influencing this process is essen-
tial if a company is to achieve
‘step changes’ in performance,
as opposed to incremental
improvements. A first step
toward sustainable product
development is practicing
eco-design, or ‘Design for
Environment’ (DfE), which may
be defined as systematic consid-
eration of design performance
with respect to environmental,
health and safety (EH&S) objec-
tives over the full product life
cycle (Fiksel, 1996). This
definition encompasses not only
environmental protection issues
but also traditional health and
safety concerns that may be
important considerations in
product design. Indeed, many
practitioners of eco-design find
it a useful ‘umbrella’ concept
that integrates a variety of
related disciplines, including
environmental risk management,
product safety, occupational
health and safety, pollution
prevention, resource conserva-
tion, accident prevention and
waste management.
The boundaries associated with
eco-design are broader than
those in the usual definition of
a ‘product system.’ Rather than
merely considering how the
product interacts with its physi-
cal environment, it considers the
entire supply chain – upstream
processes that produce the
components, raw materials and
energy to fabricate the product,
as well as downstream processes
involved in its distribution, use
and disposal. DfE also addresses
how by-products might be
beneficially used and how waste
products may affect humans or
the environment. A key
approach in eco-design is the
pursuit of eco-efficiency,
enabling simultaneous improve-
ments in resource productivity
(which contributes to profitabil-
ity), and environmental conser-
vation (which contributes to
sustainability). In other words,
by eliminating waste and using
resources more wisely, eco-
efficient companies can reduce
costs and become more compet-
itive. However, the scope of
sustainable product design must
move beyond efficiency to also
consider the societal aspect of
the ‘triple bottom line’, includ-
ing issues such as ‘quality of life’
and social equity.
The need for integration
For sustainable design to be
adopted in a meaningful way, it
must be fully integrated into the
product development process.
This requires an understanding
of the primary product design
drivers, including reduction in
product development cycle time,
continuous improvement in
product quality, and responsive-
ness to the ‘voice of the
customer.’ As an example,
certain sustainability characteris-
tics – eg. durability, modularity,
waste elimination – are naturally
synergistic with cost of owner-
ship, which is an increasingly

13JULY 1998 · THE JOURNAL OF SUSTAINABLE PRODUCT DESIGN
ANALYSIS
important customer criterion.
However, to capture these types
of synergies, a design organisa-
tion must incorporate sustain-
ability awareness systematically
into the daily work of develop-
ment teams. This is a logical
extension of the modern
practice of Integrated Product
Development (IPD), whereby
cross-functional teams begin at
the conceptual design stage to
consider life cycle issues includ-
ing quality, manufacturability,
reliability, maintainability,
environment and safety. Many
companies use a ‘stage gate’
process, requiring that a product
satisfy a variety of performance
criteria before passing on to the
next stage of development.
Clearly, sustainability considera-
tions need to be woven into this
‘stage gate’ process and the
associated criteria.
The eco-design tools that are
being used today tend to be
relatively simple, ranging from
rudimentary ‘advisory’ systems
that provide on-line design guid-
ance to performance tracking
tools that represent multi-
dimensional indicators. A
number of companies have
developed internal systems,
although they are seldom fully
integrated into the design
automation environment. For
example, a ‘Green Index’ soft-
ware tool was developed by
AT&T to assess a product’s over-
all environmental performance.
Hughes Aircraft has implemented
a similar system called the
‘Green Notes Environmental
Rating and Measurement
System’, which is used to auto-
matically provide ratings as
designers develop their product
and process specifications. A few
companies are using streamlined
life cycle assessment (LCA) tools
to provide somewhat more
rigorous product evaluations.
In today’s exploratory phase,
simple tools are preferable to
help the rapid establishment of
sustainable product design with
minimal disruption to existing
business processes. Eventually,
new types of information tech-
nology, such as ‘intelligent assis-
tant’ design tools, will facilitate
the transformation from tradi-
tional ways of doing business to
a more integrated approach.
Once sustainability principles
become embedded into decision
support software tools, they will
become more accessible to the
vast majority of companies that
are extremely busy meeting the
needs of their stakeholders and
do not have the time or
resources for developing new
processes and systems. These
companies will be primarily
interested in practical applica-
tions of sustainable product
design, to the extent that it
contributes to their success
in the marketplace.
Creating a measurementframework
An essential element in the prac-
tice of sustainable product
design is the capability to evalu-
ate and predict product perfor-
mance in objective, measurable
terms. In this context, one of the
key challenges is to incorporate
a life cycle view of sustainability
performance into measurement
tools that can be easily imple-
mented. The remainder of this
article suggests how decision-
makers can design and imple-
ment a Sustainability
Performance Measurement (SPM)
framework for their products,
processes, or services. This
framework is built upon the
following three principles:
Resource and value
A sustainable product should
minimise resource consumption
while maximising value creation
in the ‘triple bottom line’ sense.
Here, resources are defined
broadly to be natural or anthro-
pogenic stocks that are required
for the creation, use and disposi-
tion of a product. Examples of
resources include materials,
energy, labour, and land. Value is
defined as a condition, attribut-
able to a product, that benefits
one or more of the enterprise’s
stakeholders. Examples of value
creation include increased
profitability, reduced pollution,
improved nutrition, and libera-
tion of time.
The first principle of sustain-
ability measurement is that
evaluations must address the
dual perspectives of resource
consumption and value creation.
Three aspects
Effective sustainability measure-
ment should consider the
complete ‘triple bottom line’
as it relates to the product in
question. This means that both
resource consumption and value
creation should be considered in
terms of economic, environmen-
tal, and societal aspects. For
example, an automobile
consumes economic resources
in terms of operation and main-

14 THE JOURNAL OF SUSTAINABLE PRODUCT DESIGN · JULY 1998
ANALYSIS
tenance costs, environmental
resources in terms of fossil fuel,
and societal resources in terms
of personal time spent driving.
Most product indicator frame-
works focus exclusively on
economic or environmental
performance, and very few
address societal concerns (James,
1997). Based on the resurgence of
attention to companies’
societal performance, we
anticipate an increased focus
on the societal impacts of
products and services.
The second principle of
sustainability measurement is
that evaluations must include
economic, environmental, and
societal aspects.
Life cycle
Finally, resource consumption
and value creation, in terms of
all three aspects, take place
throughout the life cycle, includ-
ing the supply, manufacturing,
use and disposal of a product.
An evaluation that focuses
exclusively on one life cycle
stage (eg. manufacturing) may
fail to capture significant product
benefits or impacts that occur in
either upstream or downstream
stages (Fiksel, 1996). Referring
again to the automobile exam-
ple, it is only recently that
designers have begun to consider
the ‘end of life’ stage, and the
potential impacts of disassembly,
recycling, recovery, refurbish-
ment and re-use.
The third principle of sustain-
ability measurement is that
evaluations must systematically
consider each stage in the
product life cycle.
Holistic framework
These three principles can be
integrated visually to create the
framework depicted in Figure 2.
The sustainability of a product
can be evaluated by considering
the economic, environmental
and societal aspects of resource
consumption and value creation
throughout its life cycle. (In
Figure 2 the halves of the circles
represent resource consumption
and value creation.)
This framework can be used to
graphically depict the results of
performance analyses. For exam-
ple, once performance indicators
have been evaluated (as discussed
in the following section), specific
half circles could be filled in
Environmental
Economic
Societal
Supply Manufacturing Use Distribution
Figure 2: Sustainability Performance Measurement (SPM) framework
An evaluationthat focuses
exclusively onone life cycle
stage may fail to capture
signiÞcantproduct
beneÞts orimpacts that
occur in eitherupstream ordownstream
stages

15JULY 1998 · THE JOURNAL OF SUSTAINABLE PRODUCT DESIGN
ANALYSIS
with a pre-determined colour
or incrementally darkened to
convey relative product
performance. This would create
a visually appealing, readily
understandable representation
of results.
Performance indicators and metrics
Once a SPM framework has been
established, design teams can
proceed to select appropriate
performance indicators and
accompanying metrics that best
represent the contributions of
their product to sustainability.
A recommended approach to
selecting indicators and metrics
is discussed briefly below.
Basic concepts
A performance indicator is a
specific, measurable product
attribute that characterises its
contribution to some aspect of
sustainability (Fiksel, 1997).
Performance indicators can be
grouped into two categories:
lagging and leading. Commonly
used lagging indicators, also
known as ‘result’ indicators,
include air emissions released,
environmental costs incurred,
and customer benefits provided.
These indicators can only be
validated in a retrospective
fashion once the product has
been released. In contrast,
leading indicators, also known
as ‘process’ indicators, measure
internal practices or efforts that
are expected to improve perfor-
mance; eg. employee training or
quality control. Thus, the
purpose of process indicators is
not to measure results but rather
to encourage a focus on product
or service performance drivers.
Each selected performance indi-
cator must be associated with at
least one metric that defines a
specific means of tracking and
reporting that indicator. Metrics
should ideally be verifiable,
objective, and meaningful to
decision-makers and stakehold-
ers. A variety of metrics can be
chosen for most indicators; eg.
potential metrics for solid waste
generation include annual
volume (tons/yr.), annual
improvement (% weight reduc-
tion), cost ($/yr.), or quantity
avoided (tons recycled/yr.). Two
broad categories of metrics exist:
the first is quantitative metrics
that rely upon empirical data and
characterise performance numer-
ically, eg. dollars of revenue ($).
The second category is qualita-
tive metrics that rely upon
semantic distinctions based on
observation and judgment. For
example, to track a product’s
societal performance, a company
could survey its stakeholders to
determine how its performance
was perceived. An illustration of
the above indicator and metric
categories is provided in Table 3.
Selecting indicators andmetrics
The SPM framework, shown in
Figure 2, can provide a starting
point for designers when select-
ing the most appropriate set of
performance indicators and
metrics. One approach would be
to qualitatively characterise each
aspect of the product’s perfor-
mance (as done in the sustain-
ability circle discussed earlier) as
1) an area of concern, 2) an area
without significant weakness or
strength, or 3) one of possible
sustainability advantage. Under
this approach, the design team
Table 3: Examples of indicators and metrics
Sustainability training(number of employees trained)
Sustainability training(employees evaluation
of training courses)
Product eco-efficiency(lbs. product/total lbs. input)
Product eco-efficiency(stakeholder satisfaction
or number of awards)
Leadingindicator
Laggingindicator
Quantitativemetric
Qualitativemetric
note: lbs = pounds (weight)

16 THE JOURNAL OF SUSTAINABLE PRODUCT DESIGN · JULY 1998
ANALYSIS
Societal Employee injuries Public health risk(number/year) (qualitative)
Environmental Material Toxic Genetic transferenceintensity emmissions risk (qualitative)(lbs/year) (lbs/year) Pesticide use
(gal/bushel)Fuel consumption(gal/bushel)
Economic Economic Farmer productivity Food costsvalue added (bushels/year) ($/bushel)
Supply Manufacturing Use Distribution
Figure 3: Sustainability indicators for a biotech agricultural product
Economic Environmental Societal
Direct Material consumption Quality of lifeá Raw material cost á Product & packaging mass á Breadth of product availabilityá Labour cost á Useful product lifetime á Knowledge or skill á Capital cost á Hazardous materials used enhancement
Potentially hidden Energy consumption Peace of mindá Recycling revenue á Life cycle energy á Perceived riská Product disposition cost á Power use during operation á Complaints
Contingent Local impacts Illness & disease reductioná Employee injury cost á Product recyclability á Illnesses avoidedá Customer warranty cost á Impact upon local streams á Mortality reduction
Relationship Regional impacts Accident & injury reductioná Loss of goodwill due á Smog creation á Lost time injuries
to customer concerns á Acid rain precursors á Reportable releasesá Business interruption due á Biodiversity reduction á Number of incidents
to stakeholder interventions
Externalities Global impacts Health & wellnessá Ecosystem productivity loss á CO2 emissions á Nutritional value providedá Resource depletion á Ozone depletion á Food costs
Table 4: Illustrative categories of sustainable product indicators
note: gal = gallonlbs = pounds (weight)

17JULY 1998 · THE JOURNAL OF SUSTAINABLE PRODUCT DESIGN
would assess subjectively how
their product will create value
and consume resources
throughout its life cycle. Such
a qualitative assessment can be
conducted through a workshop
session involving an expert team,
and the results can be displayed
visually using the framework
presented earlier.
The obvious advantage of this
approach is its relative simplicity
compared to the data-intensive
steps required to quantify the
entire life cycle performance.
A more rigorous and demanding
approach would focus on the
critical aspects of product
performance and devise either
leading or lagging indicators that
could be quantitatively evaluated.
In this case, the primary benefit
of the framework is helping
ensure that all relevant aspects
are addressed. Table 4 illustrates
a number of different categories
of sustainability peformance
indicators that could potentially
be quantified. Generally, practi-
tioners are advised to select as
few indicators as necessary to
address the most important
aspects of product performance.
Efforts to track numerous indica-
tors (more than 12) have often
proven burdensome and have
eventually been scaled back.
In many cases, practical limita-
tions of data, resources or
methodology may hinder the
ability of a development team
to evaluate indicators over the
full life cycle. In other cases,
companies may wish to exclude
certain life cycle stages from
consideration because they are
not relevant to business deci-
sion-making. Therefore, the
intended scope and rationale
for indicators should always be
clarified. For example, rather
than speaking of ‘energy use
reduction’ we should specify
‘reduction in energy use during
manufacturing and distribution’
or ‘reduction in power consump-
tion during product end use’.
Finally, a mixed approach uses
quantitative indicators when the
measurement data can be
obtained cost effectively, and
then relies upon qualitative indi-
cators for the other critical
aspects of sustainability. The
application of this approach is
shown in the following example.
A biotechnology example
Life science companies are
currently developing a host of
biotechnology-based products
that they claim will enable a
shift to sustainable agriculture.
One class of these new agricul-
tural products is pest-resistant
crops; biotechnology enables the
insertion of genetic material into
the crops that can help deter a
variety of harmful pests.
Proponents claim that this tech-
nology will increase agricultural
productivity and lower consumer
costs, while opponents are
concerned about possible health
and environmental impacts. The
three measurement principles
proposed earlier can help
internal and external decision-
makers compare the sustain-
ability of these biotechnology-
based product systems to
alternatives.
· How do these ‘product
systems’ create value and
consume resources?
· How will customers or
stakeholders be affected
economically, environmentally,
and socially?
· What are the most significant
impacts across the full life
cycle of these ‘product
systems?’
In comparison to a conventional
crop, biotechnology-based
products create value by reduc-
ing pesticide use during crop
production, with corresponding
reductions in toxic emissions
during pesticide manufacture.
Similarly, both the raw materials
required to produce the pesti-
cides and fuel required to apply
them are reduced. These indica-
tors and several others that were
derived using the afore-
mentioned sustainability
measurement principles are
provided in Figure 3.
Conclusion
This paper has set forth a general
framework for sustainability
performance measurement and
illustrated how it can be applied.
The framework provides a
comprehensive organising
scheme for reviewing the many
different ways that a ‘product
system’ can have adverse or
beneficial impacts upon the
‘triple bottom line’. The frame-
work embodies three principles
– separation of resource and
value measures, explicit repre-
sentation of the ‘triple bottom
line’, and consideration of the
full life cycle.
Already, many companies have
begun to incorporate sustain-
ability measurement into their

18 THE JOURNAL OF SUSTAINABLE PRODUCT DESIGN · JULY 1998
product development and perfor-
mance evaluation processes,
and we believe that the use of
an organising framework will
help to ensure consistency and
thoroughness in the practice
of sustainability measurement.
Looking ahead, we anticipate
that a number of trends will
emerge:
· those companies that have
committed in principle to
sustainable development will
begin developing practical ways
of assessing the sustainability
of specific products and
services.
· in pursuing sustainability
performance measurement,
these companies will develop
or adopt frameworks such as
the one presented here to
ensure that they address the
full spectrum of relevant
impacts or benefits.
· the implementation of product
sustainability indicators will
require some ‘short cuts’ such
as relying upon qualitative
instead of quantitative metrics.
Many companies will choose to
track and report leading indica-
tors that are likely to
contribute to sustainability.
The practices for measuring
product sustainability will
continue to evolve rapidly during
the next several years. By under-
standing the principles of
sustainability performance
measurement, practitioners can
design a process that is best
suited to the needs of their
organisation. •
Armstrong, Laura A., and Wendy S.White, ÔCase Study: ChryslerCorporation Life Cycle ManagementComparison of Three Engine OilFilters,Õ International BusinessCommunications EnvironmentalCost Accounting, ConferenceProceedings, Washington, DC,(November 17-19, 1997).
Blumberg, Jerald; Korsvold, Age;Blum, George; ÔEnvironmentalPerformance and ShareholderValue,Õ World Business Council forSustainable Development, (1997).
Business and the Environment(BATE), ÔFocus Report: CorporateEnvironmental Reporting MovesAhead,Õ Cutter Information Corp.,(May 1998), pg. 2.
Epstein, M. J., MeasuringCorporate EnvironmentalPerformance: Best Practices forCosting and Managing an EffectiveEnvironmental Strategy, Institute ofManagement Accountants, Irwin,Chicago, IL, (1996).
Feldman, S.J., Soyka, P.A., andAmeer, P., ÔDoes Improving a FirmÕsEnvironmental ManagementSystem and EnvironmentalPerformance Result in a HigherStock PriceÕ, Journal of Investing,(January 1997).
Fiksel, J., Design for Environment,Creating Eco-EfÞcient Products andProcesses, McGraw-Hill, NY (1996).
Fiksel, J., ÔPractical Issues inEnvironmental PerformanceEvaluationÓ, in Tibor, T. and I.Feldman, Implementing ISO 14001,Irwin, (1997).
James, Peter, ÔThe SustainabilityCycle: A New Tool for ProductDevelopment and Design,Õ Journalfor Sustainable Product Design,Issue 2, (July 1997).
Lehni, Markus, ÔWBCSD Project onEco-efÞciency Metrics andReporting: State-of-Play Report,ÕWorld Business Council forSustainable Development,(February 1998).
National Round Table on theEnvironment and the Economy(NRTEE), ÔMeasuring Eco-efÞciencyin Business,Õ (1997).
Ranganathan, Janet, ÔSustainabilityRulers: Measuring CorporateEnvironmental & SocialPerformance,Õ World ResourcesInstitute Ð Sustainable EnterpriseInitiative, (May 1998).
References

Increasing awareness of environ-mental performance, especiallyamongst customers, has not gone unnoticed by designers ofelectrical and electronic products.Unsurprisingly this has resulted inenvironmental performance becom-ing increasingly emphasised inmarketing such products. Despite a wealth of research on ‘greenconsumerism’, it is not clear howenvironmental concerns stand inrelation to other product attributes.
One potentially important group is‘business to business’ consumers. In order to determine the importanceof environmental performance tothis group, a conjoint analysismethodology has been applied toinvestigate the buying preferencesof company purchasing managersfor two different products, an inkjet printer and inkjet cartridge.
This study shows the importance ofprice for most purchasing managers.Environmental performance is alsoshown to be an important productfeature. However, perhaps surpris-ingly, the research shows that inkjet
printers which use recycled plasticare not routinely preferred to equiv-alent printers made from virginmaterial, while inkjet cartridgeswhich are reusable are notpreferred to disposable cartridges.The principal drivers for this behav-iour are investigated, as well as the implications for manufacturers.
Introduction
The growth in stakeholder
interest in industry’s environ-
mental performance, especially
amongst consumers, has not gone
unnoticed by designers of electri-
cal and electronic products.
Unsurprisingly this has resulted
in environmental performance
becoming increasingly empha-
sised in marketing such products.
A graphic illustration of this
trend is the burgeoning number
of electrical and electronic
consumer products which are
now being ‘badged’ with
so-called ‘green labels’.
ANALYSIS
19JULY 1998 · THE JOURNAL OF SUSTAINABLE PRODUCT DESIGN
Graham Earl is a Research Engineerwith the University of Surrey’sEngineering Doctorate (EngD)
programme and is sponsored by theCentre for Environmental Strategy (CES)
and Paras Ltd. His doctoral researchproject has involved extensive liaison
and test case applications with leadingmulti-national companies and has
resulted in the development of theStakeholder Value Analysis Toolkit.
This is a hybrid model which linkstogether a collection of decision
support tools and aims to support decision-makers in identifying,
measuring and linking the stakeholdervalues driving environmental invest-
ment decisions. The results of hisresearch have been widely presented
in leading journals and conferences.
Roland Clift is Professor of Environmental Technology and
Founding Director of the CES at theUniversity of Surrey. CES was set up
in 1992 as multi-disciplinary researchcentre concerned with long-term
environmental problems. In addition to its research activities, CES runs MSc, PhD and EngD programmes,
the last of these being an innovative D Eng programme in EnvironmentalTechnology. He is a member of the
Royal Commission on EnvironmentalPollution and the UK Ecolabelling
Board. Professor Clift is a Fellow of the Royal Academy of Engineering and
the Institution of Chemical Engineers.
How important isenvironmental performance?A case study measuring theenvironmental preferences of ‘business to business’consumers
Graham Earl and Roland Cliftn
Research Engineer and Professor of Environmental Technology,Centre for Environmental Strategy, University of Surrey, UK

In some instances manufacturers
have designed their products to
meet ‘green label’ criteria in
direct response to purchasing
requirements, for example to
meet a public sector organisa-
tion’s buying guidelines.
However, in many instances the
pursuit of environmental claims
has been carried out without
independent verification, as a
way to differentiate a product
from its close competitors.
There is evidence that consumers
not only desire to purchase
products which minimise their
impact on the natural environ-
ment, but are also willing to pay
more for them (Coddington,
1993). Taken from a company
perspective, Earl et al (1998) has
shown through specific industry
case studies that investments
which improve a company’s
environmental performance,
and hence public image, can
produce significant financial
benefits for the company.
Despite these findings, what is
not clear, and what the study
(below) hoped to investigate,
is how environmental concerns
stand in relation to other
product attributes.
Project aims
A research project was developed
that aimed to investigate the
relative ‘trade offs’ company
purchasing managers make when
purchasing electronic and electri-
cal products. More specifically
it aimed to answer the question
‘Are ‘business to business’
consumers willing to forego
performance or pay higher prices
to improve a product’s environ-
mental performance, and if so
by how much?’
To meet this aim the study chose
to investigate two closely related
products. The first, inkjet print-
ers, are relatively long-lasting
and involve an element of
investment. The second product,
inkjet cartridges, are much more
frequently purchased and involve
significantly lower per trans-
action cost. At the same time
both products belong to a fast
moving office equipment and
consumables market which is
increasingly being subjected to
environmental performance
pressures from stakeholders.
Indeed both products share
attributes which have significant
potential to impact the environ-
ment, either through using up
valuable resources (eg. energy,
materials) or by creating large
amounts of waste and potential
contamination.
Essentially, customers can be
classified into three broad
categories:
· domestic
∑· intermediate, ie. retailers
∑· ‘business to business’ (includes
both the public and private
sectors).
This study chose to investigate
the ‘business to business’
category, more specifically the
behaviour of purchasing
managers from the private sector.
From the demand side, purchas-
ing decisions from corporate
buyers send strong signals to
manufacturers. On the other
hand, purchasing behaviour also
indicates the company’s own
attitude towards the ‘greenness’
of suppliers’ products, which is
an important influence on atti-
tudes within the purchasing
company itself. Because of the
uniqueness and purchasing
influence of the purchasing
managers approached, this study
has not attempted to achieve the
sample rate of other studies
which have examined general
consumer behaviour.
Conjoint analysis – a tool for measuring trade-offs
Conjoint analysis is a market
research tool which can be used
to measure consumers’ ‘trade
offs’ among products with many
attributes. Conjoint analysis
relies on the ability of respon-
dents to make judgements about
stimuli. For example, it is easier
for a consumer to answer the
question ‘are you prepared to
pay £1000 to upgrade from a
similar Ford to a similar BMW?’
rather than ‘what is the relative
importance to you of a car’s
brand and price?’ This is exactly
the type of question asked of
the respondents by the conjoint
methodology.
In conjoint analysis, the stimuli
represent some predetermined
combinations of attributes, and
respondents are asked to make
judgements about their prefer-
ence for the various combina-
tions of attributes. Conjoint
analysis attempts to handle the
problem of determining
preferred features by systemati-
cally estimating how much each
attribute is valued on the basis
of the respondents’ choices
between alternative product
concepts. Because questions
are ‘framed’ closely and made
concrete, conjoint analysis is
ANALYSIS
20 THE JOURNAL OF SUSTAINABLE PRODUCT DESIGN · JULY 1998

distinct from the broad
eco-nomic approach of
contingent valuation. Also since
the conjoint method converts
consumer preferences for
different performance attributes
to a single variable, utility, it is
possible to quantify the relative
importance of these to the
respondent.
Methodology and results
In line with the study’s aim a
conjoint experiment was
designed to measure the relative
‘trade offs’ purchasing managers
make when choosing inkjet
printers and inkjet cartridges.
Data from the study was analysed
using conjoint analysis software
developed by Bretton Clark. The
methodology used covered the
following basic stages:
Specification of separateconjoint experiments for each product
Appendix 1a and 1b summarise
the performance attributes and
levels used to describe the inkjet
cartridge and inkjet printer
experiments. Cartridge reusabil-
ity and printer casing recycled
content are the environmental
performance attributes included
in each design. The performance
levels specified for these attrib-
utes were defined so that they
did not imply any direct financial
or operational gain or loss to
the respondent (eg. purchasing
manager). The idea was that
utility values measured for these
performance attributes would
indicate only the respondent’s
preference for environmental
performance.
Stimuli design
Conjoint analysis works by
asking respondents to rank in
order of preference a set of
product scenarios which have
been specified using a common
set of performance attributes and
performance levels (in this case
those described in Appendix 1a
and 1b). Whilst each product
scenario is specified by the same
set of performance attributes, the
performance levels defined for
each attribute will differ on at
least one of the attributes. The
most common way to display
the product scenarios to the
respondent (eg. purchasing
manager) is through a set of
cards. Each card carries a descrip-
tion of the product using the
pre-defined performance attrib-
utes and performance levels.
Data gathering
The inkjet printer and inkjet
cartridge conjoint experiments
were carried out with 22
purchasing managers selected
from 13 companies. On average
two individuals were interviewed
from each company; in each case
these were chosen for their
responsibility for purchasing IT
equipment. The companies
approached covered a wide spec-
trum in terms of size (ranging
from small and medium sized
companies to multinationals) and
area of operation (consultancy to
production and manufacturing).
Produce output results
Appendix 2a and 2b summarise
the average utility and attribute
importance calculated for the
two experiments. A useful repre-
sentation of this data is achieved
by comparing utility levels with
performance levels for each
attribute. Figures 1 and 2 show
the utilities for the environ-
mental attributes for
each of the two product groups.
Results
Price is invariably and not
surprisingly an important
attribute. However the detailed
results show that, all other things
constant, the lower priced inkjet
printers and cartridges are on
average not routinely preferred
over higher price versions. For
example, for inkjet printers only
22% of respondents consistently
placed higher utilities on lower
priced printers compared to
higher priced ones, and for inkjet
cartridges this figure was 14%.
This behaviour suggests that
respondents are inferring some
kind of benefit associated with
higher prices which are not
defined on the conjoint card.
Alternatively they may doubt the
credibility of the lower priced
products described on the
conjoint cards.
The recycled content of the
inkjet printer is on average an
important negative feature. The
utility function and data analysis
shows that 85% of respondents
prefer lower over higher recycled
content. This behaviour implies
that respondents simply do not
wish to buy inkjet printers made
from recycled plastics or that
they associate some kind of
product performance loss, to
printers with a casing with higher
recycled content (not defined
on the conjoint cards)
The spent cartridge option
attribute was deliberately defined
so that the possible performance
levels would not offer any
JULY 1998 · THE JOURNAL OF SUSTAINABLE PRODUCT DESIGN
ANALYSIS
21

ANALYSIS
THE JOURNAL OF SUSTAINABLE PRODUCT DESIGN · JULY 199822
financial incentive to the
respondents. The value of each
performance level would there-
fore relate solely to the impor-
tance placed on the cartridge’s
environmental performance. The
detailed results show that nearly
two thirds of respondents, all
other things equal, prefer dispos-
able cartridges over refillable or
recyclable ones. The conclusion
is that the purchasing managers
prefer disposable inkjet
cartridges: although they offer
poorer environmental perfor-
mance, they are easier to use,
requiring no refilling or storing
for recycling.
Conclusions and implications
The analysis has deliberately
focused on the spent cartridge
option and recycled content
attributes, since these were
introduced to ‘capture’ environ-
mental performance as
a selling attribute for the two
products studied. In both cases,
the environmental attributes
were defined so that they did not
directly imply financial benefits
to the purchasing managers, and
therefore did not elicit any pref-
erence for environmental perfor-
mance.
In this study, purchasing
managers were required to think
about and articulate their ‘trade
offs’. Whereas a preference for
environmental performance is
often assumed, it is only possible
to measure real preferences via
‘trade off’ decisions which
include environmental perfor-
mance as one decision criterion
among several. The results from
both conjoint experiments show
that price and operational
criteria are important for most
purchasing managers. The
recycled content of the casing
and cartridge re-usability were
shown to be important product
features. To the extent that re-
cycled content and re-usability,
and therefore improved environ-
mental performance, represent
lower rather than higher perfor-
mance is preferred.
Greenness is not enough
For inkjet printers, reference to
Figure 1 shows that purchasing
managers place lower utilities
on (ie. are less satisfied with)
printers with higher recycled
materials content. This means
that for two printers with equal
cost, each offering the same
operational performance, the
printer made from ‘virgin’ mater-
ial offers more utility (ie. is
preferred) over the same printer
made from recycled materials.
There are two likely reasons for
this behaviour;
· the purchasing managers
misunderstood the
experiment’s definition
of recycled.
· the purchasing managers
perceive recycled products
as inferior to new products.
The first reason is thought
unlikely since a great deal of
care was taken to fully define
and explain each performance
attribute. It was made very clear
that the term recycled referred
only to the material used to
produce the printer’s casing.
Respondents were told they
were comparing ‘printers with
different amounts of recycled
casing content’ and not ‘recycled
verses new printers’. It was also
made clear that this attribute
was totally independent of the
printer’s other attributes, ie. the
printer’s recycled content is not
in any way linked with and can
therefore not affect any of the
other attributes used to describe
a printer.
The second reason, driven by
the purchasing manager’s own
perception of what recycled
means, appears to be more
likely. So, rather than acknowl-
edging that recycled means ‘as
good as new’, purchasing
managers are more likely to
perceive them as ‘second hand’.
Given that the purchase of a
printer is longer term and can be
seen as an ‘investment decision’,
it is plausible to think that
purchasing managers would be
reluctant to invest in products
perceived as ‘second hand’.
This type of behaviour is not
unusual. For years, Xerox have
been marketing re-manufactured
photocopying machines and have
struggled to dispel the miscon-
ception that these machines are
refurbished, use old components
and are in some way inferior to
‘brand new’ products. In fact
Xerox have found that the great-
est resistance to their re-manu-
factured machines stems from
public sector buyers. In some
cases this is borne out by
governmental selection protocol,
which may stipulate that only
‘brand new’ products may be
considered for tender. Even if
this is not the case, Xerox have
found that buyers using public
money, who are therefore
accountable to tax payers, are

JULY 1998 · THE JOURNAL OF SUSTAINABLE PRODUCT DESIGN
ANALYSIS
23
-1.2-1
-0.8-0.6-0.4-0.20.00.20.40.60.8
0% 50% 100%
Util
ity
Recycled content
1
Figure 1a: Recycled content utility function for inkjet printers
reluctant to risk public disap-
proval by spending money on
goods which are not ‘brand
new’.
Perhaps this partly explains why
ICL prefer to market their prod-
ucts as ‘second life’ rather that
‘Re-whatever’, anticipating that
the products are less likely to be
devalued by the purchaser.
However, the analysis suggests
that the problem is deep-rooted,
not merely semantic. As
suggested earlier, it is much
more likely to be driven by
purchaser perceptions. The
answer therefore is not simply
to change the name of goods or
hide the fact that a product is
re-manufactured or incorporates
recyclate; rather, it must address
the cause, which seems to be
a lack of understanding.
The preference drivers for
printer cartridges seem to be
slightly different. Because the
purchase of an inkjet cartridge is
unlikely to be seen as an invest-
ment, it is more likely that oper-
ational and logistical criteria
drive the purchase decision. The
conjoint analysis results (see
Figure 1b) show that purchasing
managers actively prefer dispos-
able cartridges to refillable and
recyclable ones. Given no
financial benefit then the easiest
and most convenient option is
shown to be preferred. If the
preference for disposable
cartridges is seen as a proxy for
convenience, then the analysis
shows this is a much more
important factor for the purchas-
ing managers than any potential
environmental gain.
Other supporting evidence
This behaviour is not altogether
surprising. Although Kärnä and
Heiskanen (1998) report that
some manufacturers of
electronic and electrical products
claim to have noticed greater
environmental awareness
amongst ‘business to business’
consumers compared to domes-
tic consumers. This type of
behaviour has generally been
limited to more aware countries
such as Germany and Sweden
where there are more social
pressures to emphasise environ-
mental performance. The
implication is that ‘business to
business’ consumers in countries
such as the UK, where these
pressures are weaker or absent,
suffer the same misconceptions
and lack of awareness as inter-
mediary and domestic
consumers.
Business in the Environment
(BiE) in the UK carried out
research on the level of environ-
mental engagement of the FTSE
100 top UK companies and found
a disappointing level of supply
chain management amongst the
UK’s top companies (BiE 97). In
reply to the question, ‘Does your
company have an environment-
focused supplier programme in

ANALYSIS
THE JOURNAL OF SUSTAINABLE PRODUCT DESIGN · JULY 199824
place?’ the survey found that
only 38% of the companies
interviewed responded with a
positive answer.
The solution for manufacturers
wishing to specify and sell their
products using ‘green creden-
tials’ is clearly not simple.
Manufacturers see a diffuse and
unspecified demand for environ-
mental solutions, as well as very
little hard evidence to show
reward for their environmental
improvement endeavours.
Obviously there are exceptions
to his rule, as identified by John
Carew from Business in the
Environment (Carew, 1997),
for example:
· BT report that they use
environmental considerations
in their purchasing decision-
making process
· IBM carry out eco-risk analyses
of strategic suppliers
· Nortel work with suppliers on
specific environmental issues –
currently they are trying to
tackle packaging issues by
working together with
Motorola
· B&Q uses environmental
management in the supply
chain to increase market share
· Sainsbury’s is developing joint
ventures in crop management.
Nevertheless the assumption that
‘business to business’ consumers
are going to be the ‘forerunners
of the environmentally
conscious generation of
customers of the future’ (Kärnä
and Heiskanen, 1998) appears to
be ill-founded. A major challenge
suggested by this study is that
there is confusion and lack of
understanding even amongst
purchasing managers of what
some environmental claims
actually mean, especially their
implications for the product’s
performance and for the
business in general. This problem
is not helped by what also
appears to be a lack of generally
accepted environmental criteria
for electrical and electronic
products.
Barriers to greener purchasing
BiE have identified two funda-
mental barriers faced by
‘business to business’ purchasers
wishing to improve their
company’s supply chain manage-
ment. The first is gaining policy
commitment and the associated
mechanisms and procedures to
back it up. The second barrier is
the application of the poorly
understood approach of ‘whole
life costing’. There is little or no
evidence that ‘whole life cost-
ing’, which implies including the
environmental imperatives of
longevity, lower running costs
and disposal costs, has been
applied properly and as a matter
of course in private and public
sector procurement.
Underlying these barriers is a
scarcity of available and reliable
-1-0.8-0.6-0.4-0.2
00.20.40.60.8
1
disposable
Util
ity
Spent cartridge option
refillable recyclable
Figure 1b: Spent cartridge option utility function for inkjet cartridges

JULY 1998 · THE JOURNAL OF SUSTAINABLE PRODUCT DESIGN
ANALYSIS
25
information about the environ-
mental characteristics of prod-
ucts and services. In fact, Jean
Cinq-Mars, Head of the Pollution
Prevention and Control Division
Environment Directorate, OECD,
speaking at the ‘Greening
Government’ conference (Cinq-
Mars, 1997) suggests that lack of
information is sometimes
considered to be the major
obstacle to greener purchasing
initiatives as it limits the devel-
opment of multi-criteria
specification of environmental
characteristics of products.
Eco-labels and regulation
Although third party labelling
schemes may seem to offer a
part solution, the role and
significance of labelling are still
unclear, especially since there
seems to be little agreement on
an internationally acceptable
label. Recent analysis by the
OECD (Cinq-Mars, 1997) on a
few selected eco-labelling
schemes concludes that such
schemes have had little effect
on consumer behaviour, except
in those countries where
consumers express strong
environmental awareness.
Underlying all of this is an
evolving regulatory environment.
In the electronics sector the law
is moving towards enforcing
producer responsibility, with
emphasis on ‘end of life’
management (EOLM) rather than
eco-design. An example support-
ing this trend is the draft
Directive on the management
of waste from electrical and
electronic equipment issued by
the European Commission
(1998). However, this European
Union (EU) initiative does have
considerable implications for the
development and design of elec-
trical and electronic products.
The draft Directive outlines
specific responsibilities for
producers of electronic and
electrical equipment, which
taken together aim to:
∑· eliminate toxic materials
∑∑· increase recyclability
∑· increase dismantability
∑· increase the amount of
recycled material
∑· improve the reverse logistics
associated with these products.
For example, broad ranges have
been proposed for a reuse
and/or recycling minimum for all
IT equipment. The responsibility
for achieving this target is placed
firmly with the producer. To
achieve it, producers will need
to provide users of electrical and
electronic equipment, in particu-
lar consumers, with the neces-
sary information about the
return, collection and recovery
systems available to them, and
also to emphasise their role in
contributing to the recovery and
re-use and recycling of ‘end of
life’ electrical and electronic
equipment.
A basic strategy for effective green marketing
Taken together the picture for
producers seems somewhat
bleak. On the one hand the
regulatory framework is looking
to impose the responsibility for
EOLM on the producer, to
encourage the uptake of reusable
and recyclable products and
materials. On the other hand,
this and other similar studies
show that consumers, even
supposedly better informed
‘business to business’ consumers
show an unwillingness to switch
to greener designs and products.
On the positive side the elec-
tronics sector is leading the way
in the implementation of the
international environmental
management standard, ISO 14001.
Because this standard aims to
push companies to greater
understanding of the direct and
indirect environmental effects of
products throughout their life
cycle, it should help with the
marketing of greener products.
It would however be foolish to
rely solely on ISO 14001 and
emerging international eco-
labels to solve the perception
problems associated with
recycled or reused products.
Form relations withstakeholders to reducemisconceptions
It is more sensible for manufac-
turers to become more proactive
and start to develop in-house
strategies for the specification,
design and marketing of their
products. As a starting point,
conclusions drawn from this
study suggest that any
strategy must aim to reassure
purchasing managers of the
validity and implications of
‘green claims’. Advice should be
relayed back to potential manu-
facturers of products or compo-
nents, that ‘recycled’ does not
mean ‘second hand’, and that
eco-innovations are needed.
Since customers (domestic or
‘business to business’) often
distrust environmental claims,
because they are perceived to be
used to gain competitive advan-
tage and can not easily be tested
by customers themselves, it is
critical that manufacturers are
able to demonstrate their credi-

ANALYSIS
THE JOURNAL OF SUSTAINABLE PRODUCT DESIGN · JULY 199826
bility and develop an honest and
trusting relationship with their
stakeholders. To help achieve
this, the company must aim to
identify what kind of informa-
tion is used and needed by its
different stakeholders, and then
be pro-active in ensuring that
this information and the way it
relates to their products reaches
the stakeholders in a systematic
way.
Demonstrate the whole life value of the product
Secondly, and probably just as
important, the strategy must
ensure that if green claims are
being made, these are linked
wherever possible to overall
environmental policy and associ-
ated financial and operational
gains for the ‘business to busi-
ness’ consumer. This means
working together with the
purchaser to show the benefits
of using ‘whole life costing’ to
differentiate between products.
Using this approach, the manu-
facturer will be much better
placed to demonstrate any ‘down
the line’ cost reductions associ-
ated with improved environmen-
tal performance and, perhaps
most importantly, the risk reduc-
tion benefits which
can result through increased
confidence amongst its stake-
holders. This analysis confirms
the views expressed, for exam-
ple, by Stevels (1997).
Taking the example of inkjet
cartridges, using ‘whole life
costing’ principles will help to
reinforce that reusable cartridges
can in fact be cheaper for the
purchasing company if potential
disposal costs are factored in, or
if the company is struggling with
its environmental image. This
research has shown that, unless
links such as these are made, it
is unlikely that purchasing
managers will be willing to
sacrifice convenience for the
sake of environmental perfor-
mance.
Education, training andcommunication
All of this must be underpinned
through a basic platform of
education, training and clear
communications. No matter how
good the eco-improvements that
designers make to products, their
potential to reduce environmen-
tal impacts is usually contingent
on the behaviour of others, not
least of which is customer
demand which makes it possible
to compete and sell into the
market place. The best ‘green’
products can only reduce our
environmental footprint if they
are actually purchased and used
in preference to products with
poorer environmental perfor-
mance.
Future research
This study represents a starting
point in trying to quantify the
importance of environmental
performance as a decision-
making criterion in purchasing.
In this case, the research has
concentrated on the importance
of environmental performance
to ‘business to business’
customers.
There are of course many other
stakeholders who are interested
in not only the environmental
performance of the products but
also of the manufacturing
companies themselves. For
example, as Stevels (1997)
observed, company designers
will benefit immensely and be
better placed to develop sustain-
able product designs if they can
integrate stakeholder priorities
into the design process. So,
rather than incremental product
improvements, the aim must be
to move towards radically re-
thinking the way stakeholders’
needs are provided for. ‘Trade
offs’ have to be made between
environmental and other criteria.
To increase the credibility of
these choices stakeholders must
be involved in the decision-
making process.
Future research must therefore
look at ways to quantify the
priorities, values and needs of a
wider set of stakeholders, and to
design decision-making
processes which will allow these
factors to be integrated into the
traditionally closed, internal
processes by which companies
reach their decisions. •
Acknowledgements
This paper summarises part of
the work carried out by Graham
Earl for the degree of Doctor of
Engineering at the University of
Surrey. Financial support from
EPSRC and Paras Ltd. is gratefully
acknowledged.
The authors also wish to thank
Ms Zoe Jackson and Mr Tom
Davies of Hewlett Packard, who
helped with the design of the
conjoint experiments. Special
thanks are also extended to all
those research engineers on the
Engineering Doctorate who
assisted with gathering data for
the conjoint experiments.
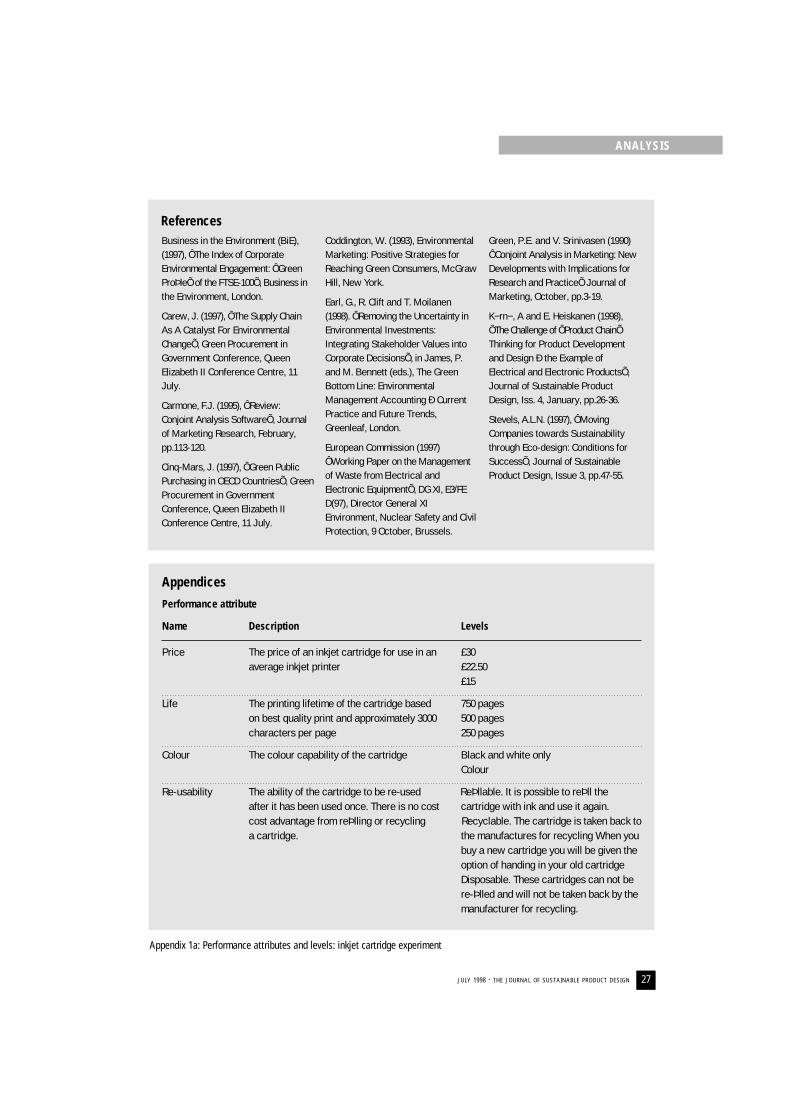
JULY 1998 · THE JOURNAL OF SUSTAINABLE PRODUCT DESIGN
ANALYSIS
27
Business in the Environment (BiE),(1997), ÔThe Index of CorporateEnvironmental Engagement: ÔGreenProÞleÕ of the FTSE-100Õ, Business inthe Environment, London.
Carew, J. (1997), ÔThe Supply ChainAs A Catalyst For EnvironmentalChangeÕ, Green Procurement inGovernment Conference, QueenElizabeth II Conference Centre, 11July.
Carmone, F.J. (1995), ÔReview:Conjoint Analysis SoftwareÕ, Journalof Marketing Research, February,pp.113-120.
Cinq-Mars, J. (1997), ÔGreen PublicPurchasing in OECD CountriesÕ, GreenProcurement in GovernmentConference, Queen Elizabeth IIConference Centre, 11 July.
Coddington, W. (1993), EnvironmentalMarketing: Positive Strategies forReaching Green Consumers, McGrawHill, New York.
Earl, G., R. Clift and T. Moilanen(1998). ÔRemoving the Uncertainty inEnvironmental Investments:Integrating Stakeholder Values intoCorporate DecisionsÕ, in James, P.and M. Bennett (eds.), The GreenBottom Line: EnvironmentalManagement Accounting Ð CurrentPractice and Future Trends,Greenleaf, London.
European Commission (1997)ÔWorking Paper on the Managementof Waste from Electrical andElectronic EquipmentÕ, DG XI, E3/FED(97), Director General XIEnvironment, Nuclear Safety and CivilProtection, 9 October, Brussels.
Green, P.E. and V. Srinivasen (1990)ÔConjoint Analysis in Marketing: NewDevelopments with Implications forResearch and PracticeÕ Journal ofMarketing, October, pp.3-19.
K−rn−, A and E. Heiskanen (1998),ÔThe Challenge of ÔProduct ChainÕThinking for Product Developmentand Design Ð the Example ofElectrical and Electronic ProductsÕ,Journal of Sustainable ProductDesign, Iss. 4, January, pp.26-36.
Stevels, A.L.N. (1997), ÔMovingCompanies towards Sustainabilitythrough Eco-design: Conditions forSuccessÕ, Journal of SustainableProduct Design, Issue 3, pp.47-55.
References
Appendices
Performance attribute
Name Description Levels
Price The price of an inkjet cartridge for use in an £30 average inkjet printer £22.50
£15
Life The printing lifetime of the cartridge based 750 pageson best quality print and approximately 3000 500 pagescharacters per page 250 pages
Colour The colour capability of the cartridge Black and white only Colour
Re-usability The ability of the cartridge to be re-used ReÞllable. It is possible to reÞll the after it has been used once. There is no cost cartridge with ink and use it again.cost advantage from reÞlling or recycling Recyclable. The cartridge is taken back to a cartridge. the manufactures for recycling When you
buy a new cartridge you will be given the option of handing in your old cartridgeDisposable. These cartridges can not be re-Þlled and will not be taken back by themanufacturer for recycling.
Appendix 1a: Performance attributes and levels: inkjet cartridge experiment

ANALYSIS
THE JOURNAL OF SUSTAINABLE PRODUCT DESIGN · JULY 199828
Performance attribute
Name Description Levels
Price The purchase price of the printer £300£225£150
Printer quality The maximum print quality of the printer Laser quality to describe a printer that can print up to 600 x 600 dot per inch
Good quality to describe a printer that prints up to 600 x 300 dots per inch
Average quality to describe a printer that prints up to 300 x 300 dots per inch
Printer speed The maximum print speed of the printer 6 pages per minutewhen working in top quality mode, ie. 4 pages per minutenot in draft output 2 pages per minute
Service and The service and support that comes Lifetime service/support.support as standard with the printer One year service/support
No service/support
Reliability The printer's intrinsic reliability performance High reliability described through a 2% chance of breakdown in a year
Medium reliability described through 6% chance of breakdown in a year
Low reliability described through a 10% chance of breakdown in a year
Printer casing Total amount of recycled plastic material used 100% recycled plastic contentrecyclate content in the manufacture of the printerÕs casing 50% recycled plastic content
0% recycled plastic content
Colour capability The colour capability of the printer Black and white printing only Colour printing capability.
Appendix 1b: Performance attributes and levels: inkjet printer experiment

Attribute Level Average utility Relative importance
Price £30 -0.35 19%£23 0.72£15 -0.37
Lifetime 750 pages -0.26 36%500 pages 1.19250 pages -0.93
Spent cartridge option Disposable 0.86 29%ReÞllable -0.06Recyclable -0.80
Colour No 0.47 16%Yes -0.47
JULY 1998 · THE JOURNAL OF SUSTAINABLE PRODUCT DESIGN
ANALYSIS
29
Appendix 2b: Conjoint analysis results. Utility and relative importance results for inkjet printer experiment
Appendix 2a: Conjoint analysis results. Utility and relative importance results for inkjet cartridge experiment
Attribute Level Average utility Relative importance
Price 150 -0.17 20%225 0.89300 -0.73
Print quality 300x300 -0.49 16%600x300 0.81600x600 -0.32
Print speed 2p/m 0.23 9%4p/m -0.496p/m 0.26
Recyclate content 0% 0.66 21%50% 0.38100% -1.04
Reliability Low -0.17 10%Medium 0.50High -0.32
Service and support None 0.61 16%Limited -0.73Extended 0.12
Colour capability No -0.38 9%Yes 0.38

30 THE JOURNAL OF SUSTAINABLE PRODUCT DESIGN · JULY 1998
Recycling is one of several essen-tial factors that are needed to reacha more environmentally sustainablesociety. However, environmentaldemands together with economicreality and technical possibilitiesmust be balanced. Recycling is notpossible without the separation andsorting of waste. There is much togain if this thinking is incorporatedat the beginning of the productdevelopment process when there isstill some design freedom and thepossibility to make major changes.In this context, Design forDisassembly means design effortsin order improve the performance of a product with a focus on separation and sorting of waste.
Introduction
Sustainability as defined by
the Bruntland Commission
depends on many factors and
recycling or ‘industrial circula-
tion’ is one of them. Recycling
must be based upon a compre-
hensive view so that sub-
optimisations can be avoided.
Before recycling is possible,
waste products must be sepa-
rated, sorted and transformed
into flows of materials and
components. Components must
be good enough for recondition-
ing or instant reuse and materials
must be clean/pure enough, or
upgradeable, for the manufactur-
ing of new products.
Sorting is only possible if parts
and different materials can be
identified – without identifi-
cation, even energy recovery
may be a problem. If the materi-
als contain harmful or polluting
components they must be effec-
tively sorted to ensure that they
are properly treated. (Luttropp):
· sorting is a key function in all
reuse or recycling activities
· sorting is not possible without
identification
· sorting is not possible without
separation except in single
material products
· separation and sorting, must
be balanced against environ-
mental, economic and
technological considerations.
Product development and recycling
If a product is to be recycled or
partly reused after its first service
life, it is beneficial to take this
into account in the early phases
of product development when
there is still a high degree of
design freedom. However, it is
difficult to make the best recy-
cling decisions during early
Dr Luttropp is Senior Research Associateat the Royal Institute of Technology(KTH) in Stockholm, Department of
Machine Design. He is the leader of aresearch group, ‘Product Design for
Sustainability’ with special interest indisassembly and recycling as well as life cycle thinking and processes and
also human behaviour and decisionmaking in these contexts. He has been
at KTH since 1990 as manager of educational programmes, as lecturer
and as researcher. He holds an MS degree in Naval Architecture
and a Tech. Dr. in Machine Design.
Design for Disassembly: a new element in productdevelopment
Dr Conrad Luttroppn
Senior Research Associate, KTH Machine Design, Sweden
ANALYSIS

31JULY 1998 · THE JOURNAL OF SUSTAINABLE PRODUCT DESIGN
ANALYSIS
design phases. Even if there is a
lot of design freedom, the infor-
mation about the emerging prod-
uct is limited.
Another problem is decision-
making. The designer cannot
decide to spend more time and
perhaps use more sophisticated,
more environmentally friendly
materials in the product without
acceptance from the product
manager. Eco-performance will
therefore depend on the ability
of designers and management to
cooperate (Luttropp).
The most common way of
approaching the product devel-
opment process is by seeing it as
a chain of tasks with milestones
and decisions at occasional
points. This traditional and linear
way of looking at the design
process is still relevant, espe-
cially when the product itself is
the focus.
Without going into detail the
design process always starts with
a conceptual/product planning
phase with three typical steps.
The first step is an analytical
phase where the problem needs
to be understood. What do the
customers want? What price is
he or she willing to pay for these
functions? etc. In this phase the
baseline for future work is estab-
lished. In the second step – the
creative phase – concepts are
generated which are very difficult
to guide. The third step is the
evaluation of the concepts
and this must be done very
thoroughly and if necessary new
analyses must be carried out.
Typically these three steps are
repeated in an iterative way
several times before a plan for
the product design phase is
decided upon. In the product
design phase the concepts from
earlier phases are developed
through drafting, dimensioning,
prototyping, further market
analysis, etc.
The conceptual design work is
focused on the designer where
understanding the problem,
analysis, concept generation and
evaluation of possible design
solutions are blended in a
randomised sequence (Luttropp_).
In Figure 1 the hatched areas
inside the thick arrow aims to
illustrate this ‘designer’s patch-
work’. The thick arrow illustrates
the total design process and the
hatched areas illustrate what has
been done in different down-
stream activities, up to the ‘intel-
lectual break-even’. This should
include information concerning
basic principles, customer needs,
prototypes, manufacturing
concepts and preliminary
materials selection from differ-
ent areas of product design.
When the product is on the
market the information is
complete and the thick arrow
then completely hatched imply-
ing that all information covering
the new product has been deter-
mined. One of the elements in
the figure shows the growth of
knowledge over time and the
other elements show how, at the
same time, design freedom will
lower.
In the end of concept design and
before product design there is a
very important ‘milestone’. At
this point substantial informa-
tion concerning the product is
present but there are still
possibilities to make major
changes. This is illustrated in
Figure 1 by the two graphs
passing one another. This situa-
tion may be looked upon as the
Figure 1: The ‘patchwork’ of creative design work and the milestone where the‘intellectual break-even’ is situated

32 THE JOURNAL OF SUSTAINABLE PRODUCT DESIGN · JULY 1998
‘intellectual break-even±’ in the
product development process
(Luttropp).
This is the perfect point for
strategic decisions concerning
the separation and sorting
structures for the forthcoming
product. The exact location of
this ‘break- even’ is impossible
to establish since it is more of an
interval rather than a strict point.
However, it is a good point to
establish both the functional
parameters connected to the use
of the product, and ‘end of life’
considerations. This way, envi-
ronmental demands will be
balanced in the basic design
concept against other functional
and economical requirements.
Management and design must
co-operate since designers
cannot spend additional design
effort on developing more recy-
cling friendly products if this is
not sanctioned by the managers
who are in charge of the addi-
tional costs that these design
efforts will raise.
Recycling and designmethods
A variety of methods have been
established as aids to product
development, including Quality
Function Development (QFD),
Fail Mode Effect Analyses (FMEA)
and Life Cycle Assessment (LCA).
LCA assesses the environmental
impact of a product from ‘cradle
to grave,’ from raw materials
used to manufacturing processes,
usage and ‘end of life’ treatment.
Since the scope of a detailed LCA
is very large, the procedure can
be complicated and time
consuming.
One other problem with LCA is
that it doesn’t account for the
preferences. If several product
design concepts are environmen-
tally evaluated in a LCA process,
the customer benefit from the
different versions of the product
should be constant to make the
comparison valid. In practice, it
is almost impossible to do this
eg. there may be three solutions
to a design problem with radi-
cally different ‘LCA values’ and
customer benefits? For example
an engine bonnet for a car may
be evaluated in a LCA process
and the material choices may be
between steel, aluminium, ther-
moplastics or glass reinforced
thermosetting plastic. These
alternatives may not necessarily
be perceived as possessing equiv-
alent value to the customer – an
engine bonnet is not universal.
Even the sound of it when you
knock on the bonnet is a part of
the impression!
Customers may accept a slightly
lower performance from a prod-
uct if the environmental impact
is radically lowered. But the
benefit to the customer must be
measured, evaluated,
documented and compared to
the environmental impact. Eco-
performance should be measured
by both environmental perfor-
mance and customer benefit.
Structure of products from a recycling viewpoint
To achieve functions and princi-
ples that will allow for recycling
it is important to prepare for this
during early design phases
(Luttropp):
· recycling of a product starts
Managementand design
must co-operate since
designerscannot spend
additionaldesign effort
on developingmore recycling
friendlyproducts
if this is notsanctioned bythe managers
who are incharge of the
additional coststhat these
design effortswill raise.
ANALYSIS

33JULY 1998 · THE JOURNAL OF SUSTAINABLE PRODUCT DESIGN
with disassembly
∑· in complex products
sorting must be performed
after disassembly/separation
eg. into useful parts, useful
materials and materials for
energy recovery
· if this sorting is possible the
product must be separated in
such a way that identifiable
fractions are created
· if these fractions or sub-
assemblies are to be useful,
they must be pure enough
to use or possess upgrading
possibilities.
The structure of a product from a
recycling point of view consists
of pieces of homogenous materi-
als, useful sub-assemblies, parts
for energy recovery, etc. The
product can be regarded as a set
of modules or ‘sorting objects’
with one or several separating
surfaces where the object is
connected or joined to other
objects. These surfaces indicate
where disassembly will take place
when the product is scrapped
(Luttropp).
From a recycling point of view,
focusing on, for example, a
personal computer (PC) monitor
(Figure 2), this consists of pieces
of homogenous materials, useful
sub-assemblies, parts for energy
recovery and nothing else. The
fact that these objects have had a
function earlier before the disas-
sembly event is not particularly
important except for objects that
can be reused in their former
function. Other parts
are just pieces of material or
amounts of energy.
In recycling, the sorting proper-
ties of the disassembled product
are particularly relevant informa-
tion. If it is possible to identify
the different objects, then each
of these objects are surrounded
by a ‘sorting border’, which will
have the following characteristics
(Luttropp):
· ‘sorting borders’ enclose
something that can be
identified and if necessary
upgraded, a sub-assembly, a
labelled piece of material, etc.
· ‘sorting borders’ must be
congruent with a ‘separating
surface’ eg. products incorpo-
rating more than one material,
otherwise the border will not
appear
ANALYSIS
Figure 2: Example of a simple disassembly case
Resting loadcaseWhen opening eg. a PET bottleof water, a seal has to bebroken by turning the cap anti-clockwise with a torqueat some level. This is called a ÔloadcaseÕ: torque at somelevel in a certain direction,applied to, in this case, a cap.During transportation thereare other ÔloadcasesÕ present,like for example the internalpressure from carbon dioxide(CO2). The Ôresting loadcaseÕrelated to breaking the seal iswaiting for the consumer andresting before the Ôseal-breakÕand is released afterwards.
Separating surfaceThe seal has breaking points where the material is separated destructively; an irreversible ÔseparatingsurfaceÕ. There is a contactbetween the cap and thebottleneck when the cap isclosed. This contact surface is separated every time thecap is opened; a reversibleÔseparating surfaceÕ.
Sorting borderThe cap of a PET bottle is of a known single material. It ispossible to make a correctsorting of the cap and also of the bottle; both are surrounded by ÔsortingbordersÕ.

34 THE JOURNAL OF SUSTAINABLE PRODUCT DESIGN · JULY 1998
· ‘sorting borders’ are dependent
on which order the different
‘separating surfaces’ are
realised.
‘Separating surfaces’ can arise at
several different joints such as
screw-joints, snap-fits, glue-joints
and also through a drop in
strength somewhere inside the
part. All joints that can be
released during disassembly are
‘resting loadcases’ since these
joints are released by applying a
force of some kind in a new way
that is not present during the
service life of the product. A
‘resting’ disassembly function can
be used at the scrapping event in
disassembly actions. In the case
of the PC monitor, there are only
two ‘resting loadcases’. The first
is four snapfits in combination
and the second is one screw joint
in a hose hinge that holds the
electronics round the neck of the
tube. These concepts also can
be integrated into CAD systems
(Andersson and Luttropp).
Disassembly actionscombined with productstructure
Many products have a similar
disassembly structure which
means that overall layout does
not differ very much. Products,
such as spanners and watering
cans, consist of only one
material. The main task for the
scrappers is to identify and sort
the materials into fractions.
Other products, such as comput-
ers and toasters, are built with
separate components on a carrier
with a cover. In this case, it will
Figure 3: Five different disassembly structures
can be observed. Top from left toright: ‘Shell’, ‘Hamburger’, ‘Twin’;
and bottom from left to right:‘Rod’ and ‘Dressed design’.
(Luttropp)
ANALYSIS

35JULY 1998 · THE JOURNAL OF SUSTAINABLE PRODUCT DESIGN
be more complex to identify and
separate objects which are valu-
able and/or environmentally
dangerous.
The PC monitor mentioned
earlier has a main structure
that can be visualised as a
‘hamburger’ with two halves, the
front and the back, held together
with four snap-fits. When
released the rest of the parts
free themselves.
Other PC monitors or for exam-
ple toasters or computers are
made with a central carrier
where everything is mounted and
finally there is a cover for elec-
tric security or simply for
aesthetic appeal. These products
can be visualised as ‘dressed’
designs.
Some products contain fluids or
are meant to be waterproof and
for that reason mostly have to be
disassembled in a destructive
way. Electric toothbrushes,
ammunition and gasoline tanks
are example of these ‘shell’
designs.
Many products contain only one
material, such as a watering can
or a spanner and from a recycling
point of view these are like a
‘rod’. Other products have
several easy identifiable fractions
like a combination of ‘rod’ of
different materials like a ‘twin’
design.
More complicated products are
usually combinations of these
five concepts and often have sub-
assemblies in several steps which
have a structural variety of these
five basic structures.
In disassembly the first actions
will be the most important ones
and the five product categories
mentioned above can be organ-
ised in a matrix (Table 1) where
the first two levels of action are
noted. For example, the
Hamburger which is
characterised by an initial non-
destructive loadcase which opens
the casing and then everything is
free and ready for sorting which
is then the second step in disas-
sembling Hamburger designs. The
main objective of this approach
is to get a better understanding
of recycling layouts and concep-
tual disassembly principles. Each
type of design has its own char-
acteristics but inside each family
the recycling strategies can be
quite similar. The focus of this
concept of design families is on
what are the first and second
steps when disassembling differ-
ent products. (Luttropp).
The above concepts aim to help
designers adapt products to
increase recycling potential in
early design phases. Even if many
products don’t fit perfectly into
one of the product families, a
ANALYSIS
Hamburger Shell Rod Twin Dressed
1st step sep-ND sep-D sort sep-ND/D sep-ND/D
2nd step sort sort sort sep-sort
Sorting objects (S_o)>2 (S_o)>2 (S_o)=1 (S_o)=2 (S_o)>2
Table 1: Properties concerning disas-sembly. Separating can be destructive
(D) or non destructive (ND) and thenumber of Sorting object (S_o) vary
from family to family. This table of thefive product structures shows how the
activities differ on 1st and 2nd level

36 THE JOURNAL OF SUSTAINABLE PRODUCT DESIGN · JULY 1998
conceptual recycling structure
such as this will be helpful in
early design activities. To a large
extent, the benefits of recycling
will be connected to the costs of
disassembling and sorting. The
first scrapping activities must be
considered as the most impor-
tant. In this model of five prod-
uct families, each family has a
pronounced difference when it
comes to the first 1–2 events in
scrapping (Luttropp).
Collaboration betweendesigners and management
The structure of products, as
described earlier, requires a
system for evaluation of different
design solutions and for collabo-
rative decision-making between
designers and management.
Loadcase indices and border
indices are used to put scores or
marks on different design solu-
tions and for practical reasons
the scale is mostly simplified to
an interval 0–1. The numerical
values are uncertain as they are
based on subjective estimations.
There are four loadcase indices
and four border indices. The
loadcase indices give information
on how a specific loadcase is
organised, what kind of action is
necessary to operate the loadcase
and the border indices give
information on specific sorting
objects that are surrounded by
sorting borders.
The four loadcase indices are
(Luttropp):
· Loadcase information Li=0
[0;1] Easy to understand=0
and almost impossible to
understand the loadcase = 1
· Loadcase equipment Le=[0;1]
No tools=0 and if special tools
are needed to release the load-
case =1
· Loadcase force Lf=[0;1] How
much force is needed to release
the loadcase? Hands and fingers
=0 and help from ie. power
tools =1.
∑· Loadcase time Lt=[0;1]
How much time is needed to
release the loadcase? A lot of
time =0, very little time =1.
In Figure 4 a simple example of
loadcase indices on two LEGO
pieces put together is presented.
The loadcase is simple (Li=0), no
equipment is needed (Lq=0), no
extra force (Lf=0) and very little
time (Lt=0).
Loadcases will look quite differ-
ent to a professional scrapper
and a consumer. Through this
index system it is possible for
designers and management to
make decisions together
concerning the disassembling
functionality of eg. a new mobile
phone. If the ‘hamburger’
concept is to be preferred and
the initial loadcase to separate
the two halves is to be made by
the consumers the opening of
the two halves must be easy to
carry out and easy to understand.
If then the product manager puts
low understanding for the load-
case index when opening the
two halves this is a signal to the
designer that this special action
must be easy to understand for
consumers since consumer
ANALYSIS
LEGO 1
LEGO 2
Li = 0Lq = 0Lf = 0Lt = 0
Figure 4: Two pieces are put together and the ‘resting loadcase’ between them isgiven loadcase indices.

37JULY 1998 · THE JOURNAL OF SUSTAINABLE PRODUCT DESIGN
collaboration in disassembly is
a part of the strategy with this
product.
The inexperienced consumer
needs much easier loadcases,
with lower loadcase indices than
the experienced scrapper.
Sometimes it will be preferable
that the consumer does not
disassemble or even try to dis-
assemble because of security etc.
There are also four ‘sorting
border’ indices for the contents
of the ‘sorting objects’ and the
ease that ‘sorting border’
appears.
· ‘Sorting border’ information
Bi=[0;1] Good understanding of
what is in the ‘sorting border’
=0 and bad understanding=1
· ‘Sorting border’ economy
Be=[0;1] Valuable object =0 and
objects connected to costs =1
· ‘Sorting border’ destiny
Bd=[0;1] Possible reuse in same
position =0 and deposit =1
· Separating surface efficiency
Bs=[0;1] The surface follows the
‘sorting border’ perfectly =0
and the surface does not follow
the ‘sorting border’ at all=1.
In Figure 5 the system of indices
is used on the PC monitor and
the indices are organised in a
connection map.
Product planning
One way of contributing to ‘eco-
performance’ is to forecast the
scrapping event at the ‘intellec-
tual break-even’. This forecast
should be a plan concerning
which parts of the new product
are realistic to reuse in order to
optimise the eco-performance
(Luttropp).
To achieve the best eco-perfor-
mance, economic, technical and
environmental considerations
must merge into a compromise.
This complex situation could be
looked upon as a disassembly
structure of sub-assemblies and
materials, in this way forming a
modular structure of ‘sorting
objects’. The necessary ‘separat-
ing surfaces’ and ‘resting load-
cases’ are all functional possibili-
ties to be used during scrapping
after service life.
Modules consisting of materials
for energy recovery can be, and
for economic reasons should be,
assembled and joined without
‘resting loadcases’ since these
parts will probably not be disas-
sembled at the end of service
life; just incinerated. There is no
use in putting design effort into
components that eco-manage-
ment has forecasted as suitable
for energy recovery.
Modules defined as having a valu-
able ‘sorting border’ should be
connected to the rest of the
design with great care because
this is a module that might be
reused or recycled at the end of
product life. Suppose this valu-
able module is an electrical
motor intended for reuse. There
are of course a lot of borders and
surfaces inside this motor that
could be designed to be ‘quick
and dirty’, since the motor
anyhow will not be disassembled
down to materials fractions; it
will be reused as motor not as
material. In upgrading strategies
there should be good ‘sorting
borders’ around modules which
might be replaced during the
service life (Luttropp).
A procedure like this must be
carried out in different ways
depending on the circumstances,
the structure of the company,
type of product, etc. But the
following description may be
helpful in establishing a company
and product-specific conceptual
scrapping plan or ‘scrapping
forecast.’
The proposed plan divides in
four main parts. The first step
would be to collect information
through a questionnaire. This can
be done together in a meeting
where management and the
design group exchange informa-
tion. The second step will be to
document and organise known
facts, together with knowledge
and assessments that are not
fully established. This ‘scrapping
forecast sheet’ will contain facts
as well as conceptual assessments
and maybe even include guesses.
At the third and fourth steps, a
‘connection map’ (see Figure 5)
of the possible ‘sorting objects’
should be established together
with indices on loadcases and
‘sorting borders’. This map is just
a concept and may be carried out
in several versions depending on
different design solutions.
The main goal of the map is to
guess a scenario for the ‘end of
(service) life’ for a specific
product.
Step A: Collect available data
A questionnaire should be
completed in a meeting with
the design group and business
and environmental management.
ANALYSIS

38 THE JOURNAL OF SUSTAINABLE PRODUCT DESIGN · JULY 1998
Question 1: What kind of product isit? ‘a hamburger’, ‘a shell’, ‘a rod’,‘a twin’ or a ‘dressed’ design?
If the product contains fluids or
materials in the form of gas there
must be at least one sub-assem-
bly with a ‘shell’ layout. If the
product is supposed to be water
or gas resistant then it is likely to
be a ‘shell’ design.
Products containing electronics
or electric motors are likely to
be ‘hamburger’ or ‘dressed’
designs. When the product must
be larger than the interior, due to
aesthetic, handling or layout
reasons, this will call for the
‘dressed’ design concept. If the
product needs all the space inside
the cover for sub-assemblies and
parts, the ‘hamburger’ design is
advantageous.
It is also possible with designs
where for example the main
layout is like a ‘dressed’ design
and where sub-assemblies inside
are carried out like ‘hamburgers’
or ‘shells’.
For example, consider a product
containing several parts including
the cover – all suitable for incin-
eration – and also a printed
circuit board (PCB) – suitable for
metal recovery and perhaps a
Nickel-cadmium (Ni-Cd) battery
that must be safely disposed of.
One way of optimising this
design from a recycling perspec-
tive would be to screw or glue
the incineration candidates to
the cover. This might be called a
partly ‘dressed’ concept. The PCB
and the Ni-Cd battery could be
locked in by the cover in a
‘hamburger’ concept. This way
there will be a concept with
three ‘sorting objects’ (four if
the cover fully divides into two
ANALYSIS
BushingBi= 0
Be = 0,5Bd = 0,75
Bs = 0
Tube IBi= 0
Be = 0,5Bd = 0,5Bs = 0
TubeBi= 0
Be = 0,5/1,0Bd = 0,75
Bs = 0
FrontBi= 0,25Be = 1,0Bd = 0,75
Bs = 0
HousingBi= 0,25Be = 1,0Bd = 0,75
Bs = 0
Removinga screw
Li = 0Lq = 0.5Lf = 0,5Lt = 0
PCBBi= 0
Be = 1,0Bd = 0,5Bs = 0
Release4 snapfits
Li = 0Lq = 0.5Lf = 0,5Lt = 0
Sorting_border
Resting_loadcase
Loadcase freeconnection
Figure 5: A connection map with indices on sorting objects
and resting loadcases on the PCmonitor in Figure 2 (Luttropp)
note: I = electronic

39JULY 1998 · THE JOURNAL OF SUSTAINABLE PRODUCT DESIGN
ANALYSIS
Info. econ. dest. Surf.
N:o Module Bi Be Bd Bs Note
M1 Housing 0,25 1,0 0,75 0 ßame inhibitants
M2 Front 0,25 1,0 0,75 0 ßame inhibitants
M3 PCB 0 1,0 0,5 0
M4 Tube 0 0,5/1,0 0,5/1,0 0
M5 Tube electronics 0 0,5 0,5 0
M6 Bushing 0 0,5 0,75 0
parts) all surrounded by ‘sorting
borders’.
In this case even a ‘shell’ design
is possible as long as the product
clearly indicates where to break
the cover to get the PCB and the
Ni-Cd battery out without
damage.
Question 2: Are there any ‘sortingobjects’ in the design with a positiveeconomic value to the company? Forexample, an electric motor that can be reused, a housing of engineeringpolymers etc.
A conceptual bill of materials
can be of help when answering
this question, especially when
the forthcoming product might
be a ‘rod’ or a ‘twin’ design. In
these cases it will of course be
advantageous to minimise the
number of materials used.
‘Dressed’ designs or ‘hamburgers’
often hold PCBs, electric motors,
wiring, heavy metal batteries,
etc. and each of them should
be thought of as ‘sorting objects’.
This is also the time to start a
list of expected materials.
Question 3: What must be managedbecause of its environmental impacts?Rechargeable batteries, toxic fluids etc.
A list of ‘sorting objects’ should
be produced that is connected
with special waste handling,
environmental taxes etc. This list
should contain all the objects
that the company, in the future,
will be forced to take responsi-
bility for. Toxic fluids are often
present in products in a ‘shell’
concept. Rechargeable batteries
may be provided by suppliers and
may therefore often be attached
to the working parts in a
‘hamburger’ concept.
Question 4: What will be the mostlikely scrapping scenario for this prod-uct? Consumer disassembly and thenenergy recovery? professional disassem-bly and sorting? re-take?
Try to consider the first 2–3 steps
a scrapper has to carry out to
disassemble the forthcoming
product. The following combina-
tions will give some alternatives
and will be very important for
decisions during the product
design phase.
Disassembly and sorting will be
carried out by:
· consumer (initial sorting)
· maintenance company
· scrapper
· original manufacturer (re-take).
What is the possible destiny of
the different sorting objects;
what will be reused, recycled,
incinerated etc.? This
classification should later be
transformed into indices and
functional requirements suitable
for designers to handle when
evaluating different demands on
loadcases, separating surfaces and
sorting borders derived from
manufacturing, the market etc.
Question 5: Would it be possible tochange some of the parts and in thisway give the product a longer orshorter life and this way achieve abetter eco-performance?
Estimate the product’s length of
life as a whole and all its major
sub-assemblies. Try also to esti-
mate if any parts could benefit
from a shorter or a longer length
of life. Will there be any service
relevance, etc?
Step B: Establish a ScrappingForecast Sheet (SFS)
In this procedure the next step
will be to map the forthcoming
design through its ‘sorting
objects’ by establishing a
‘Scrapping Forecast Sheet’ (SFS).
Below is a table of the main
sorting objects of recycling
Table 2: Scrapping Forecast Sheet (SFS) for a PC monitor

40 THE JOURNAL OF SUSTAINABLE PRODUCT DESIGN · JULY 1998
interest and a list of the elevant
‘sorting objects’ (M1-6 in Table
2). Estimate the Bi, Be, Bd and Bs
indices, c.f. page 36 left column,
for each ‘sorting object’.
An example of this has been
completed in Table 2 for the
PC monitor which is illustrated
in Figure 2. The Bs column is
empty since there are no
demands for a perfect
separating surface.
This table highlights the example
of a PC and the aim of the SFS is
mainly to determine crucial facts
about new products in the
conceptual phase.
Step C: Establish a connectionmap of ‘sorting borders’
The relevant ‘sorting objects’,
M1-Mx, should be represented in
a flowchart where the modules
are, for example, circles and the
connections are straight lines. If
there is a loadcase between the
modules use a straight line and
use a dotted line if there is just
contact.
A typical ‘hamburger’, ie. the
PC monitor discussed earlier has
one initial loadcase which opens
the design and then the rest will
be free and ready for sorting.
This kind of design will typically
have one straight line represent-
ing the opening of the cover and
several dotted lines representing
the separating surfaces that are
locked in by the cover. A map of
this PC monitor connection is
presented in Figure 5.
Step D: Put relevant indices on ‘resting loadcases’
The fourth step would be to
define indices for connections
between different ‘sorting
objects’ and consider how and by
whom the loadcases should be
released and in what way the
sorting is likely to take place.
The indices will be different
depending on who disassembles
the product and what is to be
done with the remains of the
product.
Sometimes the end user
(consumer) would be the best
stakeholder to perform a certain
separation eg. removal of Ni-Cd
batteries, which means that the
loadcase information index in
this case should be low. The rest
of the product may have higher
indices suitable for professional
waste handling or retake.
Conclusion
Products with a well designed
set of ‘sorting borders’,
‘separating surfaces’ and ‘resting
loadcases’ will have improved
recycling capability. If scrapping
is made cheaper and more effec-
tive, and sorting made possible,
this will affect the ‘bottom line’
in cases where products have to
be managed from ’cradle to
cradle’. This can be achieved in
the product development process
after the concept design phase
and before more specific design-
ing and drafting tasks. A struc-
tural viewpoint and collabora-
tions between designers and
management are essential for
rethinking in product develop-
ment for sustainable products.
These decisions must be
transformed into instructions,
functional requirements and
constraints for designers. The
proposed procedure should
inform management and design-
ers about forecasting the appro-
priate recycling history of a new
product, as it provides the
opportunity to choose a basic
recycling layout before the
embodiment design has started.
These concepts with ‘sorting
borders’, ‘separating surfaces’
etc. should be incorporated into
CAD systems and drawing and
modelling work as an integrated
part of design work. An initial
attempt at such integration is
made by Luttropp & Andersson
(Andersson). Matching indices
and scrapping forecasts can serve
as means for this integration. •
References
Andersson K., Luttropp C.,Design for disassemblyÐcomputer aid for separatingsurfaces and sorting borders,Proceedings of ICED Ô97, v 1, p351-354, ISBN 951-722-788-4,Tampere, Finland, 1997
Luttropp C., Design forDisassembly-EnvironmentallyAdapted Product DevelopmentBased on Prepared Disassemblyand Sorting, Doctoral ThesisKTH Machine Design,Stockholm, Sweden, 1997
Z st R., Sustainable Productsand Processes, Proceedings ofCIRP 3rd Int. Sem. on Life CycleEngineering, ISBN 3-85743-985-8, Z rich, Switzerland, 1996
ANALYSIS

41JULY 1998 · THE JOURNAL OF SUSTAINABLE PRODUCT DESIGN
GALLERY
Baygen self-powered lantern
BayGen Power Group
BayGen Power Group, the company which is synonymous with Trevor Baylis and hisobjective of producing electrical appliances powered by alternative sources, has listed
up to 150 domestic and industrial appliances which could use 'wind-up' power. Thecompany has launched the second generation Freeplay wind-up radio and Freeplay self-powered lantern. This torch has a combination of rechargeable batteries and a wind-up
generator and, while the batteries provide up to two hours shine time on their own,one single twenty second wind of the generator gives around four minutes of immedi-ate light. Alternatively, the power generated can be used to re-charge the battery unit.
Recycled furniture
MetaMorf
American industrial designer Colin Reedy, partner in the design companyMetaMorf, aims to demonstrate through their own practices how individualdesigners and small design companies can assist in minimising their impactin the environment. In Reedy's case this is through developing innovativefurniture using recycled materials, predominantly plastic and steel. ‘We are in a position to take many recycled materials and translate them intoproducts for the marketplace.’ The first generation of chairs and tables wasmade with primitive plastic 'lumber', but now a more thin and sturdy plastic sheet has been developed which allows more modernistic designs.
The plastic panels are made using a similar method to particle board –specific types of plastic debris are sorted by colour, turned into chips andplaced into a particle board press which has been modified to handle plastic. Although still at an early stage of development, Reedy's ideal is to use regional waste to make regional products.
SS-BG30 speakers
Sony Wega Audio Group, Germany
Sony Wega Audio Group has recently re-launched the SS-BG30 speakersmade from recycled material called ‘Tectan’ and made with low environ-mental impact. Tectan is produced from used drink cartons, and consists of5% aluminium foil, 75% paper and 20% polyethylene. The returned drinkcartons are cleaned, shredded and heated until they form a pulp which isthen compressed into Tectan boards. The result is a consistent, colourfuland bright surface which takes on the colour of the original cartons. Thedensity and absorption capacity of this material offer a good acousticresponse. The German edition of the magazine ‘Audio’ said: ‘Respect forthe environment and achieving maximum sound quality are not necessarilyincompatible goals’.

42 THE JOURNAL OF SUSTAINABLE PRODUCT DESIGN · JULY 1998
At present, opportunities for theenvironmental improvement ofproducts are identified in twophases: analysis of the environmen-tal problems caused by the productand the generation of improvementoptions. A major bottleneck is thatthe environmental informationgenerated in the first phase doesnot provide specific guidance forthe identification of improvementopportunities, since this would callfor technical information on productfeatures. In other words, environ-mental analysis does not revealwhich product functions and/orproduct components account for thelargest share of the environmentalburden. This reveals the need for astructured assessment of the rela-tionship between product functions,components and materials on theone hand and their contribution tothe overall environmental burdencaused by the product on the otherhand. A product-oriented diagnosistool is proposed here, which isbased on the allocation of parts ofthe environmental burden of theproduct to so-called product-related cause factors. The amountof energy used by a lighting systemis for instance caused by thechosen source of energy (electric-ity), and the chosen electronic
system and its specific efficiency.These cause factors in turn aredivided in functional, physical andproduction factors. The applicationof this product-oriented diagnosistool is illustrated with an example.This tentatively shows that theapplication of the tool eases thetransition from environmentalanalysis to product re-design bytargeting re-design efforts to keyimprovement opportunities and byproviding an estimate of the poten-tial reduction of the environmentalburden of the product through re-design. The application of this toolfor new product development hasnot been researched, but it is hopedthat the implementation of this toolwill provide greener solutions.
Introduction
Industrial Ecology (IE) aims to
balance industrial develop-
ment with the sustainable use
of natural resources. It takes a
systems view of design and
manufacturing processes in order
to eliminate or at least minimise
the environmental impact of
manufacturing processes and the
use and disposal of products. At
the enterprise level IE aims to
integrate environmental
Marije Lafleur is a senior researcher andconsultant at IVAM Environmental
Research, an environmental research,training and consultancy firm at the
University of Amsterdam in theNetherlands. Her main research interest is in the development of methodologies
for environmental improvement of industrial products. She is also under-
taking life cycle assessments (LCA) and the development of the LCA methodology.
Rene (C.W.M.) van Berkel (PhD) is researchdirector of IVAM Environmental Research at the University of Amsterdam. Over the
last decade, Mr. van Berkel conductedcleaner production studies in various indus-try sectors worldwide. His recent research
interests relate to policy frameworks for thetransfer of environmentally sound technolo-
gies to developing countries and method-ological aspects of the identification of
environmental improvement opportunitiesfor products, processes and services.
ir. Jaap (J.G.M.) Kortman is coordinator Sustainable Building project
and member of the management team of IVAM Environmental Research. He has managed projects in the field of
sustainable building, the development andimplementation of the LCA methodology,
and green product development. One of his main activities is the development
of instruments (Eco-Quantum) that can beused to calculate the environmental effects
of a building based on LCA methodology.
Opportunities andconstraints for product-oriented diagnosis tools
Marije Lafleur, René van Berkel and Jaap Kortmann
IVAM Environmental Research, University of Amsterdam, the Netherlands
ANALYSIS

43JULY 1998 · THE JOURNAL OF SUSTAINABLE PRODUCT DESIGN
considerations into all aspects of
the business operation, including
the environmental improvement
of products and production
processes. Several product and
process-oriented tools have been
developed to facilitate the intro-
duction of IE in enterprises. It
has been proposed (van Berkel,
Willems and Lafleur) that an IE
toolbox includes four functional
groups: inventory, improvement,
prioritisation and management
tools. The application of this
toolbox by designers, has been
illustrated in two case studies
(van Berkel, Lafleur and
Willems). The ultimate goal of
such a toolbox is to provide
guidance for enterprises to select
those tools which, given the type
of operations and products, will
most likely facilitate the efficient
and effective achievement of the
product and process-related envi-
ronmental objectives. The
present stage of development of
product-oriented IE tools,
however, still hampers the
smooth application of the IE
toolbox to products (van Berkel
and Lafleur). An important
deficiency is for instance the
incompleteness of the toolbox.
This paper focuses on one major
issue; the ‘missing link’ between
the results of a product-oriented
environmental analysis and the
improvement of a specific prod-
uct. For example, the amount of
energy used during the ‘use’
phase of a fax modem is for
example caused by its electronic
system and its efficiency. A key
question is therefore: why is
a specific electronic system
chosen? Other authors have
addressed this issue in other
research (Wenzel et al). This
paper therefore seeks to
contribute to the development of
a (new) product-oriented diagno-
sis tool. In section 2 the present
development status of product-
oriented tools is reviewed in
order to define the framework
for the tool. In section 3 the tool
is explained and its application is
illustrated with an example of a
lighting fixture (section 4). This
in turn provides a preliminary
insight into the opportunities
and constraints for the applica-
tion of product-oriented diagno-
sis tools in ‘Design for the
Environment’ (DfE) projects
(section 5).
Review of present tools and practices
At present there are two stages in
the environmental improvement
of products. The first phase
consists of an analysis of the
environmental problems caused
by the product over its entire life
cycle (from raw material extrac-
tion to final disposal at the end
of its useful application). In the
second phase options to improve
the product from an environ-
mental point of view are gener-
ated.
The analysis of environmental
problems generally consists of an
inventory of the environmental
impacts (eg. energy use, amount
of resources, emissions to air,
water and soil), the calculation
of the overall environmental
impact of the product over its
entire life cycle and an evalua-
tion of the relative importance
of the various environmental
effects. Various tools are avail-
able to perform this analysis.
Examples of product-oriented
inventory tools are the MET-
matrix, the abridged Life Cycle
Inventory or the Life Cycle
Inventory (van Berkel, Lafleur
and Willems). These inventory
tools enable a systematic and
comparatively standardised
inventory and allocation of the
environmental problems associ-
ated with the production, use
and disposal of a product.
However achieving a complete
set of data and data of acceptable
quality is still a major problem.
Examples of prioritisation tools
are the Life Cycle Evaluation or
the Product Summary Matrix (van
Berkel, Lafleur and Willems).
At present the improvement
tools used in the second phase
may be categorised as either
'design guidance' or 'design
requirements' (van Berkel).
Guidance-type tools provide the
design team with general or
more specific strategies to
improve the product from an
environmental point of view.
Requirement-type tools contain
specifications on eg. the use of
certain hazardous substances.
The application of these tools
depends on the stage of the
product design process. Figure 1
shows a schematic presentation
of an idealised design process
with the suggested improvement
tools to be used at each respec-
tive stage. In the figure it is
shown that during the design
process the total number of
design alternatives decreases
slowly. However, the level of
detail of the design increases as
one moves closer to the final
product. At each step important
decisions are taken, then a new
phase of the design process
starts. At first many different
ANALYSIS

44 THE JOURNAL OF SUSTAINABLE PRODUCT DESIGN · JULY 1998
ANALYSIS
design alternatives will be gener-
ated. On the basis of environ-
mental, social, legal and other
considerations the alternatives
can be prioritised and the most
promising design alternatives will
be chosen, which means the
number of design alternatives
decreases.
Examples of product-oriented
improvement tools are (Behrend
et al, and van Berkel, Willems
and Lafleur):
∑ · the ecological principles
checklist (a guidance-type):
in this list a division is made
between thirteen ecological
design strategies (design for
disassembly, saving resources,
etc.).
· the criteria checklist (a mixture
of a guidance-type and requirement-type): later in the product design
process more specific guidance
is needed to operationalise
strategies for a particular
product or component. Each
strategy is expanded into
a list of generally applicable
improvement directions or
criteria.
· negative or positive material
checklists (requirement-type): in
the product specification phase
only detailed specifications can
be used.
· product improvement
approaches (a guidance-type): seven improvement approaches
are identified which are used as
a starting point for brain-
storming sessions.
The above mentioned improve-
ment tools have proven to be
useful in the product design
process. They can, for example,
perceivedbusiness
opportunities
programme ofrequirements
designspecification
finalproductdesign
designalternatives
productstrategy
productdevelopment
productspecification
guidance type guidance andrequirement type
requirement type
product design
milestone
designcycle
designcycle
designcycle
Figure 1: An idealised product design process [modified from (8)]

45JULY 1998 · THE JOURNAL OF SUSTAINABLE PRODUCT DESIGN
be used as checklists for the
generation of product ideas in
brainstorming sessions after the
completion of the analysis of the
environmental impacts. A major
bottleneck is, however, that the
environmental information
generated through the applica-
tion of the environmental analy-
sis tools (inventory and prioriti-
sation) does not directly result in
information that can be used for
the identification of product
improvement opportunities,
since this calls for technical
information on product features,
especially for complex products.
For example, a major problem
identified with an environmental
analysis of a modem is the
amount of energy necessary
during ‘use’. An environmental
analysis does not reveal which
product function and/or product
component accounts for the
largest share of this energy
consumption. Therefore one
needs additional information on
the various components and
functions of the product and
why these components have
been chosen. Since the link
between the results of the
environmental analysis and the
product function(s) is not usually
completed, research into the
environmental problems of a
product is often not followed by
an inventory of improvement
opportunities.
At present, this 'missing link’
is partially addressed in brain-
storming sessions through the
involvement of both environ-
mental and technical experts. If
tools were available to compen-
sate for this 'missing link’, it is
expected that this would greatly
boost the generation of both
obvious product improvement
opportunities and radical product
innovation opportunities.
The ‘missing link’ reveals the
need for a diagnostic tool: a
structured assessment of the
relationship between product
functions, components and
materials and their contribution
to the overall environmental
burden caused by a (complex)
product. From this perspective,
we may define product functions
and components causing an envi-
ronmental impact as 'causes'.
Once the causes are known, the
generation of improvement
options can focus on these
causes. This improved product-
oriented IE tool will be referred
to as a product-oriented
diagnosis tool.
Lessons learnt from cleaner production
Some lessons can be drawn from
the cleaner production activities.
For example on the basis of the
results of a process anlaysis, (van
Berkel, van Berkel and Molier)
the generation of improvement
options could be improved if a
diagnostic step or cause evalua-
tion was included. Therefore,
lessons can be learnt from a
cleaner production model where
existing production processes are
evaluated by first executing a
‘source identification’, followed
by a ‘cause evaluation’ and
‘option generation’. For the
source identification an inven-
tory should be made of the
material flows entering and leav-
ing the company. This results in
a process flow diagram, allowing
for the identification of sources
of waste and emissions. The
‘source identification’ for
production processes can be
compared to the product-
oriented inventory tools aimed
at the identification of the envi-
ronmental interventions caused
by the product. The ‘cause evalu-
ation’ is an investigation into the
factors that influence the volume
and composition of the waste
and emission generation. Five
categories are distinguished
which can be used as a checklist
to identify all possible factors
influencing the volume and/or
composition of the process
waste streams and emissions. The
option generation means that a
vision is created on how each
cause of emissions or waste
generation can be eliminated or
controlled. The ‘option genera-
tion’ for production processes is
comparable to the product-
oriented improvement tools.
It can be concluded that for
product improvement the inclu-
sion of a diagnostic step or eval-
uation of causes might optimise
this improvement step in the
same way as has happened for
the identification of cleaner
production options.
Development of a product-oriented diagnosis tool
The ‘cause evaluation’ for
production processes is based on
an analysis of the possible factors
influencing the volume and/or
composition of the material,
energy, waste and emissions
output on the basis of the five
major cause categories. These
factors have to be modified to
achieve environmental improve-
ment of the process. The ‘cause
evaluation’ for complex products
is based on an analysis of factors
ANALYSIS

46 THE JOURNAL OF SUSTAINABLE PRODUCT DESIGN · JULY 1998
ANALYSIS
which influence the environmen-
tal performance of a product
during all stages of its life cycle.
It is proposed to differentiate
between two categories of
product-related cause factors,
respectively:
· functional category: impact
of product function(s) on the
environmental profile of the
product (for example: a front
door in a house is there to
keep warmth inside the house
and unwanted people outside
the house).
· physical category: impact of
materials choice and design of
the product on the environ-
mental profile of the product
(for example: the front door is
made out of wood or steel and
the thickness is 40 mm).
Each category consists of various
factors. It is thought that these
two categories cover the most
important elements of a product.
The function(s) of a product can
be defined as the specific
purposes for which the product
is being designed, manufactured
and marketed. The physical
factors can be described as the
geometrical and physio-chemical
form of a product: in other
words the components and the
materials of which the product
consists, the design of the prod-
uct and the necessary production
processes. It is assumed that
performing a life cycle assess-
ment (LCA) where results are
linked directly to the functional
and physical factors will generate
a detailed insight into the rela-
tionship between these factors
and the environmental impact
that these factors cause.
The execution of a life cycle
inventory, however, also leads to
information on the environmen-
tal problems caused by the
production, delivery and packag-
ing of the product. These
processes are necessary to enable
the functioning of the product.
Therefore it is suggested that a
third category is added, ie.:
· production category: the
environmental impact related
to the production process,
packaging, logistics, etc. of the
product (for example: to make
a door the right size, part of
the wood will be lost and the
door may be packaged in
plastic film, etc.).
A key issue is how to determine
the physical and especially the
functional factors. An important
element of the process of
designing a product is the
determination of a design
specification statement: the goal
of the development process,
which incorporates the function-
ality of the product. It consists of
the definition of all relevant
objectives of the product (scaling
and non-scaling objectives,
requirements, wishes, standards,
performance specification
(Rozenburg and Eekels)). These
objectives arise from stakehold-
ers involved in the design
process (consumers, producers,
governmental organisations, etc.)
and are thus a compilation of
functional demands as well as
safety, legal and economic
demands. The 'environment'
could also be part of these addi-
tional requirements, but for most
products this is not yet the case
(Keoleian). The specifications do
not necessarily define which
material has to be used, but it
can at least be used to determine
the functional factor and to a
lesser extent the physical factor.
The physical factor can also be
determined by just looking at the
product, talking to the techni-
cians involved in an early stage
of the research or by reading the
design specification. The design
specification can also be a useful
instrument in other stages of a
product-oriented diagnosis tool,
for instance to enable the direct
implementation of improvement
options.
As indicated above, the analysis
of environmental problems over-
comes the ‘missing link’ between
the environmental analysis of
the product and the generation
of improvement options. A
‘cause evaluation’ can now auto-
matically follow the environ-
mental analysis and makes the
identification and implementa-
tion of improvement options the
next logical step. Figure 2 illus-
trates the ideas presented above.
The first step of the product-
oriented diagnosis tool consists
of the determination of the
functional and physical factors
(A) of the product from the
existing design specification. The
next step is the environmental
LCA (B). The combination of
step A and B results in an
overview of the environmental
burden caused by the product for
each relevant part of its life
cycle, divided between the func-
tional and physical factors. These
results provide a starting point
for the diagnosis (C). The divi-
sion of the environmental
burden over the functional
factors of the product leads to
better insight into the share each

47JULY 1998 · THE JOURNAL OF SUSTAINABLE PRODUCT DESIGN
A:Determination of functional and
physical factors of a product
B: Environmental lifecycle analysis (LCA)
C: Diagnosis:Which factors have a major share in the total environmental burden?
D: Functional review
E: Physical review
F: Production review
D1: Does thefunction have tobe performed?
E1: Does the materialchoice and/or
construction adverselyimpact on the
environmental profileof the product?
F1: Does productmanufacturing and/ordelivery and service
adversely impact on theenvironmental profile
of the product?
Yes Yes
Checkliston material
choice
Checkliston
construction
Checkliston product
manufacturing
Checkliston packagingand logistics
Yes
D2: Can the samefunction be performedin an alternative way?
No
D3: Can thefunction be optimised?
Yes
Checklist onoptimisation ofthe functioningof the product
No
Re-design on thebasis of newprogramme
of requirements
Yes
Newproduct design
No
The functioning ofthe product
is optimised.The application ofthis product might
be restricted asmuch as possible
Figure 2: Schematic presentation of a product-oriented diagnosis tool
functional factor has in the total
environmental burden. The
division of the environmental
burden over the physical factors
gives insight into the share each
physical factor has of the total
environmental burden. The allo-
cation to the various functional
and physical factors will also
generate insight into the life
cycle stages in which improve-
ments are most likely to
significantly reduce the overall
environmental burden of the
product being assessed.
The next step consists of a more
detailed review of the environ-
mental burden caused by func-
tional, physical and production
factors in the functional (D),
physical (E) and production
review (F). The first step in the
functional review (D) which
consists of an assessment of
whether the product function
has to be performed at all. If the
function appears not to be
necessary, it might be decided to
exclude the function and to re-
design the product on the basis
of a new programme of require-
ments. This will also result in a
new design specification. If the
function has to be performed
one might ask whether or not
the function might be performed
in alternative ways. If there
appear to be opportunities to
ANALYSIS

48 THE JOURNAL OF SUSTAINABLE PRODUCT DESIGN · JULY 1998
ANALYSIS
Criteria Relevant Characteristics Score Data Explanationfor saving for the resources product A B C
Material input minimum material input
size of productin accordance with function
over-sized
Refurbishment fully refurbishedproduct
use of refurbished parts
completely newproduct
Use of recycled high percentagematerials recycled material
medium percentagerecycled materials
low percentage recycled materials
perform the function in a
(fundamentally) different way, a
new product design can be
produced in the product design
process. For the elaboration of
this concept, standard proce-
dures for product design can be
utilised. Ultimately this process
results in a new design
specification, with environmental
requirements being an integral
part. When it appears that the
product functions cannot be
completed in an alternative way,
the question regarding the extent
to which the functioning of the
product can be optimised has to
be posed. From this perspective
it is important to look at all the
stages of the life cycle which
have a share in the total environ-
mental burden caused by the
functions of the product. This
means that improvement options
might be generated that lead to,
for example, reduction of the
amount of materials used in a
product.
After the re-assessment of the
functions of the product system,
the environmental problems
related to the physical factors are
reviewed. The extent to which
the material choice and design,
negatively affect the environ-
mental profile of the product
Product or part size is a measure of the extentto which material inputreduction has beenachieved. A potential for material saving canbe found in the designand selection of materials for the casing of a model.
An efficient way to savematerials is to refurbisha product for reuse. Most products are, until now, not designedfor that purpose.
Recycling only makessense from an environ-mental point of view if a market exists andcompanies are willing touse recycled materials intheir products. Recycledmaterials can usually besubstituted for new oneswithout any problems.
Figure 3: An example of a checklist on material choice (Behrend et al)

49JULY 1998 · THE JOURNAL OF SUSTAINABLE PRODUCT DESIGN
system is reviewed. Based on this
analysis and with the help of a
checklist on material choice
(including for instance minimisa-
tion of material content, use of
renewable materials, design for
recycling, etc) and a checklist on
the design of the product
(including for instance design for
product reuse, design for recy-
cling, design for durability design
for disassembly, etc.), improve-
ment options regarding the
physical factors of the product
can be generated. In Figure 3 an
example of a materials choice
checklist is given.
In the last step the share of the
other parts of the product
system, that is production and
delivery and service, is deter-
mined in relation to the total
environmental burden of the
product system. Production is
that part of the life cycle in
which the product is manufac-
tured. Therefore checklists on
cleaner production and also
packaging and delivery can be
applied. The checklist on cleaner
production contains elements
such as preventing the genera-
tion of waste during the manu-
facturing process and minimising
the amount of energy necessary
for the manufacturing of the
product.
The environmental improvement
options generated through rele-
vant checklists can be used for
modification of the entire prod-
uct chain, by re-writing the
design specification, and through
changes in production and
delivery and service processes.
The implementation of these
improvement options should
result in reductions in the envi-
ronmental burden caused by the
product over its entire life cycle.
In this section a general proce-
dure has been presented which
enables the integration of exist-
ing tools and instruments
Case study on a lighting fixture
Description
The environmental problems
related to a lighting fixture were
analysed to identify opportuni-
ties to improve the product from
an environmental point of view.
The results of this project
(Behrend et al) illustrate oppor-
tunities and constraints of the
application of the product-
oriented diagnosis tool outlined
above.
First the functional & physical
factors (A) were determined. The
functional factor consisted of
one main function, namely to
‘give light’. To perform this
function two components are
necessary: a light bulb and an
electronic system. These compo-
nents, together with an electric-
ity plant, provide electricity
which results in light. Other
components such as the ‘hanging
system’ or the protecitve cover
are not part of the main func-
tion. Without a protective cover
or a ‘hanging system’ the func-
tion of ‘giving light’ still remains.
To determine the physical
factors, the product is first sub-
divided in its main components.
The product consisted of three
components: the ‘hanging
system’, the protective cover and
the lighting system. Next all the
materials were identified per
component. The next step
consisted of the execution of the
environmental LCA (B), which
analysed the environmental
burden caused by the product
during production, use and
disposal. For this product the
analysis focused on four aspects
which were considered to be
most relevant to the measure-
ment of the product’s total envi-
ronmental burden, in particular;
· exhaustion of resources which
are used for the materials of
the product
· the amount of energy necessary
for the production of the
product, during ‘use’, etc.
· the amount of waste which is
generated during production,
use, after disposal, etc.
The functional unit which was
used is the lighting efficiency
(Lumen/Watt) from a fixture for
an average amount of 4015 light-
ing hours per year during an
average fixture-lifetime of 10
years. The fixture has a total
weight of 865 grammes.
In Table 1 the results of step A
and B are presented. The envi-
ronmental burden over the
entire life cycle is allocated to
the functional factor, the physi-
cal factors and the production
factors. It appears that in each
case there is a so-called remain-
ing category. When allocating
the total environmental burden
to the functional factors it
turned out that the entire
environmental burden could not
be allocated to a defined func-
tion. An example is the environ-
mental burden related to the
production of the ‘hanging
system’ for which steel is used.
ANALYSIS
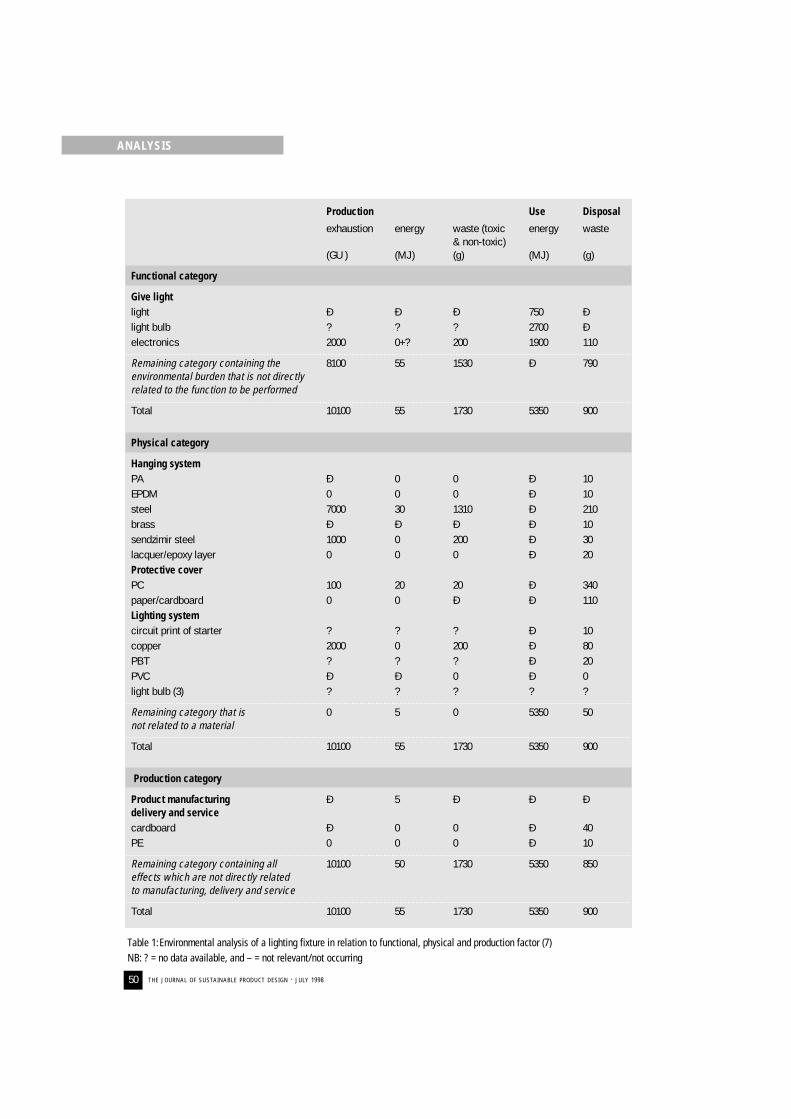
50 THE JOURNAL OF SUSTAINABLE PRODUCT DESIGN · JULY 1998
ANALYSIS
Production Use Disposal
exhaustion energy waste (toxic energy waste& non-toxic)
(GU ) (MJ) (g) (MJ) (g)
Functional category
Give lightlight Ð Ð Ð 750 Ðlight bulb ? ? ? 2700 Ðelectronics 2000 0+? 200 1900 110
Remaining category containing the 8100 55 1530 Ð 790environmental burden that is not directlyrelated to the function to be performed
Total 10100 55 1730 5350 900
Physical category
Hanging systemPA Ð 0 0 Ð 10EPDM 0 0 0 Ð 10steel 7000 30 1310 Ð 210brass Ð Ð Ð Ð 10sendzimir steel 1000 0 200 Ð 30lacquer/epoxy layer 0 0 0 Ð 20Protective coverPC 100 20 20 Ð 340paper/cardboard 0 0 Ð Ð 110Lighting systemcircuit print of starter ? ? ? Ð 10copper 2000 0 200 Ð 80PBT ? ? ? Ð 20PVC Ð Ð 0 Ð 0light bulb (3) ? ? ? ? ?
Remaining category that is 0 5 0 5350 50not related to a material
Total 10100 55 1730 5350 900
Production category
Product manufacturing Ð 5 Ð Ð Ðdelivery and servicecardboard Ð 0 0 Ð 40PE 0 0 0 Ð 10
Remaining category containing all 10100 50 1730 5350 850effects which are not directly related to manufacturing, delivery and service
Total 10100 55 1730 5350 900
Table 1:Environmental analysis of a lighting fixture in relation to functional, physical and production factor (7)NB: ? = no data available, and – = not relevant/not occurring

51JULY 1998 · THE JOURNAL OF SUSTAINABLE PRODUCT DESIGN
The ‘hanging system’ is not part
of the defined functional factor
of the lighting system, namely to
‘give light’. To function the
lighting system might also stand
on the floor and still give light.
This means that part of the envi-
ronmental burden, that is the
production, use and disposal of
steel, is not caused by the func-
tion itself. It might be concluded
that from an environmental
point of view the part of the
product that causes this environ-
mental burden is over empha-
sised as it does not contribute
to the function of the product.
There is also a remaining cate-
gory when the environmental
burden is allocated to the physi-
cal or the production factors.
The results of Table 1 are used
for the diagnosis (C).
Evaluation
It can be concluded that a major
part of the environmental
burden related to the functional
category is caused during ‘use’.
Table 1 shows that only approxi-
mately 15% of the required
energy is used to give direct,
functional light, which is the
main function of the product.
Most energy is lost as a result of
the process which has been
chosen to perform this function
(an electronic system that trans-
forms electricity) and the kind of
light source (a light bulb) which
has been chosen. The consumer
has a major influence on the
total energy that is used over the
life time. Copper has the largest
share in the environmental
burden caused by the materials
used for the electronic system.
However, data on the production
of the printed circuit board and
the light bulb are not included in
the analysis and the use of fuels
for the production of electricity
is not accounted for. Therefore
energy use does not score on
exhaustion of resources. If fuels
for electricity production were
included, the exhaustion due to
the use of these fuels during the
‘use’ phase of the product,
would have been approximately
a factor 1000–1500 higher than
the total exhaustion related to
materials use (10,100).
The environmental burden
caused by the production of
materials is part of the physical
category. The ‘hanging system’
has the largest share, with steel
and copper used in the lighting
system with major shares. Due to
application of so many different
materials and the combination
of these materials in its final
components, it is difficult to
reuse any parts of the product
after its useful life has ended.
This explains the large share of
the physical factor in the
disposal phase.
The total environmental burden
of the production of the lighting
system is relatively small, as in
this case the producer is an
assembly company. It is notice-
able, however, that the transport
distance for such a relatively
small product is enormous, as
the components and parts are
imported from all over the
world. The production of these
components and parts takes
place elsewhere and therefore
the environmental burden
related to that production is
included in the physical factors.
It is assumed that the environ-
mental problems due to the
assembly are negligible in
relation to the total environ-
It might beconcluded
that from anenvironmental
point of viewthe part of the
product thatcauses this
environmentalburden is
ÔoverdoneÕ,since it does
not contribute tothe functioning of the product.
ANALYSIS

52 THE JOURNAL OF SUSTAINABLE PRODUCT DESIGN · JULY 1998
ANALYSIS
mental burden. In addition,
exhaustion of resources due to
the use of fuels from transporta-
tion has not been taken into
account, as data on transport is
not complete. The production of
the materials used as packaging
materials is included in the
production category. These
materials are dumped after use.
After this analysis it was decided
to review the function of the
product, since the functional
factor has a large share of the
environmental burden caused
during ‘use’. The first question
asked was whether the defined
function is really necessary (D1
in Figure 2). Clearly, the function
to ‘give light’ has to remain,
which means the second ques-
tion that has to be asked is
whether the functions could be
performed in a different way (D2
in Figure 2). It might be possible
to think of a completely different
product, like for instance a hole
in the wall and the use of
reflection mirrors to spread
natural light. However, it was
very unlikely that the producer
would approve of this idea.
Therefore the only possibility is
to optimise the functioning of
the product (D3 in Figure 2). It
might be possible to highlight
technical ideas to improve the
efficiency of the device (a differ-
ent light bulb for instance, time
switch or another primary energy
source (gas, solar)), as well as
ideas to influence the behaviour
of the user, since this might
enable the reduction of the
energy demand.
In a next phase the physical
factor was reviewed (E). It was
useful to identify options that
would reduce the environmental
impact of chosen materials. This
would also produce a major
influence on the possibilities to
reuse the product as a whole,
parts of the products, or
materials from the product (for
instance: ease of disassembly
of fixture parts, material
identification, etc.)
It seemed sensible not to put any
effort into the identification of
opportunities to reduce the
environmental burden resulting
from manufacturing and delivery
and service. As the only option
that might be considered was
to find suppliers that were
geographically closer, eg.
reducing the transport distance.
Conclusion
This paper reviewed the present
development stage of environ-
mental product inventory, priori-
tisation and improvement tools.
It was argued that environmental
product improvement efforts
might benefit from the inclusion
of a diagnostic step in product-
oriented tools. An outline for
such a tool has been described
and applied to a lighting fixture.
The approach is based on the
allocation of parts of the envi-
ronmental burden of the product
to so-called product-related
cause factors. A division in func-
tional factors and physical factors
is made. Next, these cause factors
were reviewed in order to focus
the generation of product
improvement options on those
functional and physical elements
of the product, which contribute
most to the overall environmen-
tal profile of the product.
The inclusion of a diagnostic step
in the product-oriented tools is
thought to bridge the gap
between the results of the envi-
ronmental analysis of a product
and its re-design process, thereby
simplifying ‘cause evaluation’ and
the identification and implemen-
tation of improvement opportu-
nities. It does so by pointing to
those functional and physical
features of the product which
should be modified (providing
directions for such modifications)
in order to reduce the overall
environmental performance of
the product. The application
of such a product-oriented diag-
nosis tool calls for additional
information on product func-
tionality and design; in addition
to material and energy input and
output data regularly used for an
environmental product analysis.
Such information is often avail-
able or can be easily collected
from design specifications, tech-
nical drawings, etc. The inclusion
of the diagnostic step is thought
to ease the transition from envi-
ronmental product analysis to
product re-design and thereby
increase the efficiency and
success of DfE activities.
The case study revealed that if
the results of environmental
analysis are allocated to the
different cause factors, it high-
lights the extent to which the
environmental burden caused by
the product can be reduced. On
the other hand it reveals which
part of the total environmental
burden cannot be reduced. If, for
instance, the producer of the
lighting system cannot change
the process/ technique (elec-
tronic system with light bulb) for

53JULY 1998 · THE JOURNAL OF SUSTAINABLE PRODUCT DESIGN
ANALYSIS
van Berkel, R, E. Willems and M.Laßeur, Development of an IndustrialEcology Toolbox for the Introductionof Industrial Ecology in Enterprises,paper accepted for publication inJournal of Cleaner Production, Vol. 4,1996.
van Berkel, R, M. Laßeur and E.Willems, Case study: Lovink Terborg,article in: Pollution PreventionReview; Winter 1997, p. 55-67; 1997.
van Berkel, R, M. Laßeur and E.Willems, Case study: Olland,published in: Pollution PreventionReview; 1997.
van Berkel, R and M. Laßeur,Application of an Industrial EcologyToolbox for the Introduction ofIndustrial Ecology in Enterprises,published in Journal of CleanerProduction, 1997.
Wenzel, H. et al, Life CycleDiagnosis, Institute for ProductDevelopment, Danish TechnicalUniversity.
van Berkel, R, J. Kortman and M.Laßeur, Issues in the Development of Improvement Tools forEnvironmental Design of ComplexProducts, paper presented atElectronics and the Environment,Dallas, May 6Ð9, 1996. Institute forElectric and Electronic Engineering.
Behrend, et al, Life Cycle Designmanual, Institut f r Zukunftstudienund Technologiebewertung (Berlin)in cooperation with IVAMEnvironmental Research(Amsterdam), Institut f r –kologischeWirtschaftsforschung (Vienna) andInstituto Nacional de Engenharia eTecnologia Industrial (Lisbon), 1996.
van Berkel, R, Introduction toCleaner production assessmentswith applications in the foodprocessing industry, article in: UNEPIndustry and Environment,JanuaryÐMarch 1995.
van Berkel, R, T Molier, Developmentof a Diagnostic Tool forEnvironmental Improvement ofProcesses, IVAM EnvironmentalResearch, University of Amsterdam,1996.
Rozenburg, N.F.M., Eekels, J.,Product Design: Fundamentals andMethods, Wiley & Sons, 1995.
Keoleian, G. et al, Life Cycle DesignGuidance Manual, EPA, USA,EPA600/R-92/226, January, 1993.
producing light, a major part of
the total environmental burden
(approximately 85%) caused
during ‘use’ cannot be reduced.
The case study tentatively illus-
trated that the application of a
product-oriented diagnosis tool
may help to target the product
re-design efforts to those envi-
ronmental improvement options
which are likely to result in a
major reduction of the overall
environmental impact of the
product. The case study also
showed that application of
such tools is likely to identify
promising short-term improve-
ment opportunities and long-
term innovative options at the
same time.
Some elements of the analysis
are problematic. For example,
it is often difficult to define the
main function of a product. A
second problem is the choice of
environmental impact categories
(eg. greenhouse effect, exhaus-
tion of resources, energy use,
etc.). The case study also high-
lighted that important informa-
tion was missing, eg. exhaustion
of resources (oil, coal, gas)
resulting from the use of fuels for
electricity production and trans-
port. Therefore it is important to
develop a method in which the
‘right’ environmental impact
categories can be chosen. In
addition, there needs to be more
research into the ‘added value’
that can be provided by product-
oriented diagnosis tools in
comparison to existing analysis
and improvement tools. It is also
recommended that this diagnos-
tic tool is tested on new product
development and not only on
the improvement of existing
products. •
Acknowledgement
The authors acknowledge the
Lucent Technology Foundation
for awarding IVAM Environ-
mental Research with the Lucent
Technology Industrial Ecology
Faculty Fellowship 1994–1996,
which enabled them to conduct
research on development and
evaluation of IE tools.
References

54 THE JOURNAL OF SUSTAINABLE PRODUCT DESIGN · JULY 1998
INTERVIEW
What is your vision of a moresustainable world and theproducts and services thatmight exist in that world?
The most positive image of
a sustainable society is that
of a modern and sophisticated
sailing boat that utilises the best
of technology and uses the
crew's skills to sail according to
winds and currents, adjusting its
course sensitively, though with-
out losing sight of its goals. The
boat is resistant and light to
enable it to sail unscathed
through the worst of storms and
reach its port of destination.
However, it is not possible to
determine exactly how and how
long it will take for the boat
to arrive. Furthermore, since
it is driven by the wind, an
inexhaustible but non-
controllable energy, it can sail
only thanks to the experience,
attention and care of its sailors.
The problem now is how to
convince people that it may be
possible to switch from the big
oil-tanker, in which we are
living now, to this agile sailing-
boat. Dropping this metaphor, it
is about how we may turn from
the present pattern of develop-
ment to a different highly agile,
dematerialised and service
oriented system.
Within dematerialisationarguments of the movementfrom product to services thereis clearly a need to managethe transition. What are yourthoughts?
‘Dematerialisation’ is a learning
process in which, on a planetary
and on a regional level, we will
have to learn to live, and if
possible to live well, while rely-
ing on only 10% of the environ-
mental resources that we (in
industrialised societies) are
exploiting today. The transition
towards sustainability, in my
view, is this – probably long and
complex – learning process.
How could it happen?
We must consider the relation-
ship between the direction in
which we want to go, eg.
towards a sustainable system
of production and consumption
– the ‘sailing boat’ – to the
major dynamics of transforma-
tion in progress within business.
The keywords are flexibility and
globalisation.
Major restructuring of businesses
means environmental
reorientation (for example:
Ezio Manzini is an engineer and architect. He is a Professor of
Environmental Design, Director of CIRIS, an Interdepartmental Centre
of Research on innovation for sustainability and Coordinator of the
‘Dottorato in Disegno Industriale’ (PhD)in Industrial Design) at the Polytechnicof Milan. He is a former Vice-President
of Domus Academy, an internationalcentre of training and research in the
field of design. His work focuses oninnovative production and consumption
systems and, in particular, on therealtionship between product strategies
and environmental policies in relationto sustainable development. As
Director of CIRIS, he is responsible fora major project involved in developing
an Italian data bank for Life CycleAssessment (LCA), financed by the
National Environmental Agancy (ANPA).
Professor Ezio Manzini,Director, CIRIS, Politecnico di Milano, Italy
Martin Chartern
Joint Coordinator, The Centre for Sustainable Design, UK

55JULY 1998 · THE JOURNAL OF SUSTAINABLE PRODUCT DESIGN
INTERVIEW
zero defects becomes zero
waste, where waste becomes a
‘production defect’; total quality
becomes total productivity, as
it does not produce emissions,
refuse, scrap; just-in-time
production and mass-customisa-
tion become the organisational
formulae for flexibility that
adapts to the spatial and tempo-
ral variability of the environ-
ment, and customisation of
products becomes an approach
to localisation).
Are you saying that globalisa-tion and flexibilisation will‘naturally’ lead to an highlydematerialised and serviceoriented system of productand consumption?
No. Statistics tell us that the
combined effects of globalisation
of markets and greater flexibility
have caused a further increase
in the environmental impact
through increased production
and consumption. And this is in
spite of the fact that other statis-
tics show that the use of materi-
als and energy per product unit
has dropped greatly. We have
managed to ‘do better’ but, at
the same time, we have been
driven to ‘do more’. The result is
that to respond to the social
demand for well-being, we need
more materials and energy and
we produce more waste and
emissions, compared to the past.
The foundation concepts of the
new ‘paradigm of flexibility’, are
not structurally different from
the needs for sustainability: to
be lean, flexible, agile in
modifications, quick to supply
responses, skillful in the person-
alisation of products, and at the
same time to increase productiv-
ity and eliminate defects... these
are all qualities that could well
find a place in the profile of a
sustainable company. Or, more
precisely, the profile of a
company operating in a sustain-
able system of production and
consumption (a system which,
in turn, must necessarily be agile,
capable of making the best use
of resources and adapting to the
multiplicity of geographical vari-
ations).
In conclusion, what the perspec-
tive of sustainability asks for is
not to change this paradigm of
flexibility, but to extend it to the
whole production and consump-
tion system. An extension that
implies a shift from the present
product-oriented economy to a
new service-oriented one.
All these considerations aremainly related to a possiblerelationship between production flexibility andsustainability. Could you addsomething more preciselyrelated to the process of globalisation?
The process of globalisation
provides the capability of choos-
ing where to locate different
activities worldwide. However,
choices will need to be made
by considering the ‘intensity
of renewable resources and
regenerated materials’ and the
‘intensity of transport’ required
for each unit of service wherever
it is produced! And increasing
the former and decreasing the
latter will be a new fundamental
criterion for the localisation of
production activities.
This means that within the
scenario of sustainability it is
possible to imagine the develop-
ment of new businesses that are
simultaneously both global and
local: businesses that globalise
the flow of information by local-
ising the flow of material with
lower eco-impact. Combining
the global dimension of the
production and distribution of
certain semi-finished products or
components with the local,
‘service’ dimension related to
the management of regionalised
production activities and centres
of production.
It is interesting to observe that,
in this scenario, the global-local
service-oriented companies that
will appear, will have to localise
a significant part of their activi-
ties near cities (if not inside
them), and will also represent
a potential contribution to the
environmental and social
improvement of the urban fabric.
It appears that these perspec-tives depend on the fact thatthe environment will – or will not – be perceived as a‘scarce factor’. But when andhow do you think that it willhappen?
Unfortunately nobody really can
answer this question. This is the
contradictory character of the
‘transitionary scenario’: we
know – for sure – that a radical
change will happen. But we
don't now how and when.
In other words, the transition
toward sustainability appears to
be contradictory when viewed
over the short term, the medium
and the long term. In fact, over
the long term, it is clear that the
transition toward sustainability

56 THE JOURNAL OF SUSTAINABLE PRODUCT DESIGN · JULY 1998
INTERVIEW
will imply a radical environmen-
tal reorientation of the entire
society (this transformation will
also combine with other major
transformations in progress,
from the spread of IT to the
socio-cultural impact of
telecommunications).
Over the medium term,
certain characteristics of the
‘transitionary scenario’ can be
seen as highly probable (costs,
regulations and market demand
will become more sensitive to
environmental variables, evolv-
ing higher costs, stricter regula-
tions, greater responsibility, and
a focus, in the market, on envi-
ronmental quality). But, over the
short term, environmental issues
represents an area of uncertainty
for business (nobody knows
when and how changes will
happen).
It is why the re-orientation of
business (and of the society in
general) toward sustainability is a
complex strategic activity – and
not only a technical planning
issue.
What is the role of strategicdesign in the sustainabilitydebate?
We have seen that, in the short
term, the limits and opportuni-
ties presented by the environ-
mental question for businesses
still appear to be contradictory,
or difficult to interpret. The tran-
sition toward a clean and lean,
customised and localised produc-
tion system, therefore, this has
to be promoted at the strategic
level of companies, and in the
area of research and technologi-
cal innovation.
In this framework, the role
of strategic design is to help
companies to look at the
environmental question as an
‘opportunity for innovation’: the
opportunity to get away from
‘business-as-usual’ and to
propose win-win solutions,
based on new business ideas.
These ideas will require strategic
positioning: this means that they
have to be the result of options
that can be put into practice over
the short term, but which are
oriented towards the most
promising solution over the
medium and long term.
I like to add that many interest-
ing examples already exist of
companies that have successfully
adopted strategic positioning:
new business ideas based on
concepts such as on-site produc-
tion (for example: the produc-
tion at ‘point of sale’ of bulky
products), results-oriented
production (for example: the sale
of thermal well-being or photo-
copies instead of heating oil or
photocopiers) or utility-oriented
production (for example: innov-
ative services for urban mobility,
clothes washing or food prepara-
tion). In all these cases the role
of strategic design is to propose
– and to develop – new ideas for
‘product systems’ (ie. the inte-
grated packages of products,
services and communication)
that produce intrinsically more
sustainable solutions socially and
economically, ie. packages that
‘invent’ a new market possibility
of reorganising the system,
introducing new technologies
and/or changing the roles of the
involved social actors.
How do you move designers'mindset from the ‘micro-management’ to a morestrategic approach?
In my view the designer’s mind-
set is changing. And this change
is largely towards a more strate-
gic approach which simply
comes from the necessity to face
the new context in which busi-
ness operates: if competition is
tough and the market unclear,
you have to be able to continu-
ously redefine your offer
considering ‘product, services
and communication’ as a whole.
In my view, a strategic design
approach to promote new busi-
ness ideas is not so far from the
one needed to develop new
sustainable business ideas. You
have to shift from imagining a
product to imagining a solution.
The only problem is to be able
to imagine new solutions orien-
tated in the right direction, ie.
where success is proportional to
the reduction of the consump-
tion of environmental resources.
This means new business ideas to
enable people to live better,
consuming less: this slogan, in
my view, synthesises the chal-
lenge the designer will face in
the future. And it is, mainly, a
strategic design challenge! •

57JULY 1998 · THE JOURNAL OF SUSTAINABLE PRODUCT DESIGN
INNOVATION
Shell's recent experience withBrent Spar has highlighted theimportance of societal sensitivity,alongside eco-efficiency, in thesustainable business debate. The‘soft agenda’ is emerging but theissues are complex. This articlepresents some thoughts about thisnew agenda for sustainable productdevelopment and design (1). Theissues relate not only to the physi-cal product and service, but alsothe improvement of SustainableValue and the reduction of negativesustainability impacts in the overallvalue creation process. This meansconsidering not only economic andenvironmental issues, but alsoethical and social implications in the delivery of products andservices.
Balancing impacts and value
Every product or service
has a sustainability impact.
The aim of product developers
should be to maximise the
Sustainable Value embedded in
the product, and minimise the
negative impacts. Strictly speak-
ing one cannot have a sustain-
able business or product, in an
unsustainable world (2) but the
company will have to define and
understand its context, and
explore strategies to maximise
Sustainable Value. Each artifact
or service should be designed to
satisfy a human need. Traditional
marketing focuses on the
‘customer’, however various
stakeholders have a relationship
with products or services, eg.
suppliers have a social and
economic stake in the process
through employment and
profitability. What individuals
buy, in reality, is not only the
function but also all the
processes used to deliver that
product or service. For example,
if a consumer buys a solar
powered calculator in the US,
and the US company sources the
product from a company in
Sweden who purchases the
components from an Indonesian
company, whose factory has high
environmental standards but
employs child labour, but by
employing children it allows a
family of ten to live. These are
some of the hugely complex
relationships and issues involved
in the process of delivering
sustainable products or services
or Sustainable Value.
The problem with sustainability is thatit has come to represent maintainingthe status quo. It sounds like the objective is zero, ie. ‘I’ll be less badtoday than I was yesterday’. The goalought not to be ‘less bad’, but ‘howgood?’, or 100% sustainability. The way to 100% sustainability isinnovation.
Professor William McDonough,
University of Virginia, US.
Sustainable Value
Martin Chartern
Joint Coordinator, The Centre for Sustainable Design, UK
Martin Charter has held strategicplanning, product development and
marketing positions for Save &Prosper, Reed Exhibition Companies,
the Creative Marketing Group,Greenleaf Publishing and The Earth
Centre. He has over a decade of experience in ‘buisness and
environment’ including publishing,consulting, training and research. He
has an MBA from Aston UniversityBusiness School and a postgraduate
diploma in marketing. His publications include ‘Greener
Marketing’ (Greenleaf Publishing,1992), the forthcoming ‘Greener
Marketing 2’ (Greenleaf Publishing,1999), ‘The Green Management
Gurus’ (Epsilon, 1996), ‘Managingeco-design: a training solution’
(The Centre for Sustainable Design,UK, 1997) and ‘Environmental
Management Websites’ (Epsilon,1996). He is currently the EuropeanEditor of ‘The Journal of CorporateEnvironmental Strategy’ (Elsevier,
UK) and The Journal of SustainableProduct Design (The Centre for
Sustainable Design, UK), and was the former editor of ‘Greener
Management International’ (Greenleaf Publishing) and ‘The
Green Management Letter’(Euromanagement, the Netherlands).
His training and research interestsinclude eco- and sustainable product
innovation, business creativity and electronic publishing.

58 THE JOURNAL OF SUSTAINABLE PRODUCT DESIGN · JULY 1998
INNOVATION
Opportunity focus
If one is going to influence this
process it is essential to be aware
of sustainability issues early in
the product or service creation
process ie. at the idea generation
phase. Therefore if one provokes
the process at its earliest stage
by introducing sustainability or
environmental issues then one
has an opportunity to explore
how the overall sum of the
Sustainable Value (in the product
and process) might be made
greater than the negative
impacts. However, it is a ques-
tion of balance, with many of
the considerations being highly
judgemental. If one starts to
incorporate environmental
considerations at the evaluation
phase then one has missed a
chance to stimulate new ideas.
The process is beyond eco-
efficiency and ‘Factor X' (3)
thinking that focuses on primar-
ily on materials and energy
efficiency, but ignores ethical
and social considerations.
The importance of ‘soft' issues
has been highlighted by Shell’s
Brent Spar and Ogoni experi-
ences, and Monsanto's position-
ing of biotechnology as a
sustainable solution. Existing in
a ‘CNN world’ (4) means that
companies are more exposed to
societal scrutiny and those that
ignore these issues, ignore them
at their peril!
Shell: six issues and dilemmas
· human rights
· climate change
· globalisation/MNCs
· politically sensitive regions
· industrial legacies
· renewable resources.
Stakeholder orientation
A major issue in the creation
of Sustainable Value will be the
need to satisfy stakeholders (see
Figure 1) in the process of the
delivery of the functional unit
through the product or service.
For example, customers may be
satisfied but if employees and
suppliers are poorly treated, new
ideas and improved productivity
will not be generated, and the
company may fail, therefore
reducing ‘quality of life’ for
stakeholders. Therefore it is
essential to aim to improve
the ‘quality of life' of all
stakeholders in the process.
The toolbox
Companies are starting to get
more comfortable with eco-
efficiency, but are not comfort-
able with the impact of the ‘soft
agenda'. The tools available to
those in the product develop-
ment process reflect this, and are
highly limited. The majority of
tools revolve around Life Cycle
Assessment (LCA), which is in
effect an environmental evalua-
tion device. Many existing LCA
methodologies are starting to
receive some criticism from
business as being too time-
consuming, costly and complex
for use in the product develop-
ment process. The demands at
the level of eco-design are
increasing focusing on simpler
tools that enable decisions to
be made, and don’t slow the
product development process.
However, these tools are not
designed for use in the idea
generation phase and ignore
the ‘soft’ issues.
Systems view
Within the eco-efficiency
paradigm, a model has been
developed by Stevels, Brezet
and Cramer (see Figure 2) that
illustrates some of the complex
issues of progressing from
eco-design to ª(environmentally)
sustainable design.
customers
societyshareholders
employees suppliers
increasedvalue
decreasedimpact
process
product/service
Figure 1: Sustainable Value
Source: Martin Charter, The Centre for Sustainable Design, UK

59JULY 1998 · THE JOURNAL OF SUSTAINABLE PRODUCT DESIGN
INNOVATION
It illustrates that the bigger the
shift, the greater change that will
be required and the greater need
for multi-stakeholder partner-
ships. For example, ‘Factor 4'
product innovations will require
strong partnerships with suppli-
ers of components, sub-assem-
blies or materials to reduce the
mass of materials and energy
used throughout each life cycle
stage. ‘Factor 10’ products or
services and those with greater
intensity of Sustainable Value
will require both customer
(‘business to business’, interme-
diary and domestic) and supplier
partnerships with significantly
higher levels of education and
involvement amongst each group
in the value delivery process.
Screening for sustainability
Part of the move towards the
development of more sustainable
products and services will be a
process of understanding the
sustainability impacts, and look-
ing for opportunities to increase
the overall Sustainable Value.
After the idea generation phase,
a ‘Sustainability Screen’ (see
Figure 3) should be used that
takes account of e3s considera-
tions in the delivery of the
product or service, at each stage
of the lifecycle: extraction,
manufacturing, transport,
use and disposal – this is well
beyond LCA! Adding in the
‘soft issues' will mean balancing
qualitative judgements, alongside
quantitative measures used to
determine economic and
environmental criteria.
Future
Shifting societal concerns are
changing the sustainability
agenda. Clearly, this means that
there will be winners and losers,
ie. those that produce cleaner
products and those who don’t!
Part of the broader landscape
will be how you manage the
transition, particularly in rela-
tion to the move from products
to services (dematerialisation).
Understanding holistic sustain-
ability impacts and increasing
Sustainable Value will be a
key challenge for product
developers. •
References
(1) Martin Charter in 'Design forEnvironmental Sustainability', Foresight, OfÞce of Science andTechnology, UK, May 1998
(2) Martin Charter interviews Dr Brad Allenby, Journal ofSustainable Product Design,Issue 2, July 1997
(3) Editorial, Martin Charter,Journal of Sustainable ProductDesign, Issue 2, July 1997
(4) 'ProÞts and Principles Ðdoes there have to be achoice?', The Shell Report 1998
Level Eco-design Example Time horizon
4 sustainability ? 0Ð30 years
3 product alternatives LCD TV 0Ð10 years
2 green limits Ôgreen TVÕ 0Ð5 years
1 improvements current better TV 0Ð2 years
Source: Philips Consumer Electronics/Philips Centre for Manufacturing Technology
Sustainability Screen
Economic (e1)
á costá revenue á corporate image
Environmental (e2)
á energy use á materials use á use of renewables
Ethical (e3)
á use of child labour á links to oppressive regimes á equal rights
Social (s)
á direct employment generated
á indirect employment generated
á quality of employment
Source: Martin Charter, The Centre for Sustainable Design, UK
Figure 2: Levels of eco-design
Figure 3: Sustainability screen (e3s)

60 THE JOURNAL OF SUSTAINABLE PRODUCT DESIGN · JULY 1998
O2 NEWS
In April 1998 O2 celebrated its
tenth anniversary by organis-
ing a conference at the Danish
Design school in Copenhagen,
Denmark. The speakers included
designers from the O2 Global
Network worldwide and was
sponsored by O2 Denmark and
The Danish Design Foundation.
http://o2.jones.dk/
The event produced a range of
fascinating papers, some are
highlighted below. Conny
Bakker (Netherlands Design
Institute) presented NDI’s work
on stimulating designers and
industry to develop long-term
views towards sustainability
based on scenarios focusing on
systemic thinking rather than
the physical product. Kerstin
Maxe (02 Sweden) discussed the
need to recognise the impor-
tance of knowledge, care and
quality imbedded in old artifacts
through craftsmanship.
Sustainable products must seek
to incorporate these values.
‘Speaking to the public about ecologicalissues may not be the best way to con-vince them to think ecologically. Thebest way is to present them with vari-ous ecologically sound design options’.
Sally Beardsley (designer)
and Niels Peter Flint (design
producer) discussed this impor-
tance of re-thinking design.
‘“Mind over Matter” is a way of think-ing, where immaterial design, exten-sive dematerialisation of products
and processes, respect for nature, and awareness of ‘immaterial' valuesbecome a way of life… (it is)… a way of thinking ethically, aesthetically,holistically and sustainably in a spiritof experimentation, discovery andrespect.’
Ursula Tischner (Econcept,
Germany) discussed eco-design
and the green purchasing
‘awareness-action' gap amongst
consumers in Germany ie. rela-
tively high awareness but little
action at the ‘check-out'! She
highlighted the existing
obstacles to buying eco-efficient
products, which included:
· higher prices
· poor distribution
· habitual use of conventional
products
· lower effectiveness
· lower aesthetic appeal of
eco-products
· perception that individual
consumption does not affect
the whole!
Finally, she also illustrated
how the eco-design culture has
shifted in Germany and the
implications for designers and
industry.
· Past: Bauhaus (design
functionalism) and ‘end of
pipe' solutions
· Seventies: recycling design
(provoked by the oil crisis)
· Present: recycling and energy
efficiency
· Future: lifecycle design. •
Special feature: The Next Step event 98
Martin Chartern
Joint Coordinator, The Centre for Sustainable Design, UK
The Journal of Sustainable ProductDesign has developed a partnership
with the O2 Global Network to furtherdisseminate information and ideas on
eco-design and sustainable productdesign. O2 Global Network is an
international network of ecologicaldesigners. The O2 Global Network is
organised into national O2 groups which work together to provide variousservices such as: O2 Broadcasts, whichreport live from O2 events using emailand the Worldwide Web (WWW); O2
Text meetings, a meeting place on theWeb; the O2 WWW pages, which
provides an overview of activities; O2Gallery, an exhibition of eco-products on the Web; and, an O2 mailing list.
For further information on the aboveactivities and the O2 Global Network
contact: O2 Global NetworkTourslaan 39
5627 KW EindhovenThe Netherlands
tel/fax: +31 40 2428 483
O2 Global Network new homepage:http://www.hrc.wmin.ac.uk/o2/
e-mail: [email protected]: http://ma.hrc.wmin.ac.
uk/lists.o2global.db
‘O2 News’ will update readers of the Journal on the latest eco-design
issues from around the world and on O2’s national activities.

61JULY 1998 · THE JOURNAL OF SUSTAINABLE PRODUCT DESIGN
REVIEWS
Clean and Competitive? explores the challenge of motivating
industry to address environmental issues, drawing on work under-
taken by Sussex University’s Science Policy Research Unit (SPRU) and
the Centre for the Exploitation of Science and Technology (CEST). The
authors explore in some detail industry responses to some prominent
environmental issues. They have provided a thoughtful, useful and
high quality addition to publications on the subject.
The stated goal of the book is fairly modest – to understand what can
be achieved in terms of reduced environmental impact within current
patterns of organisation. Within this context it raises some key ques-
tions: Have environmental challenges been absorbed and mastered by
industry as successfully as was hoped? What is the role of public
policy? Can technology succeed in squaring the environment-
economic circle and generate ‘win-win’ situations which promote
environmental progress? While considering some of the issues relating
to sustainability, it deliberately does not seek to answer the ultimate
question – whether industrial activity, with its primary focus on
profitability and regulated by fallible political institutions, is compati-
ble with sustainable development.
The book addresses these and other questions by reviewing industry’s
response to seven environmental issues which have greatly concerned
business during the 1990s and by assessing specific examples of differ-
ent approaches to the management of environmental issues. The focus
is on UK industry in the European policy and regulatory context.The
book is divided into four parts:
The first part (Chapters 1 and 2) reviews evidence on how companies
are managing environmental issues, for example whether they are seen
as threats or opportunities, including drivers for improved
performance and what companies are doing. It critically examines
assumptions and hypotheses about business behaviour.
The second part (Chapters 3, 4 and 5) reviews the seven key problems.
Chapter 3 covers global issues (stratospheric ozone depletion,, global
warming and climate change), Chapter 4 covers transboundary and
regional issues (air quality and transport, acid rain and emissions of
volatile organic compounds (VOCs)), and Chapter 5 two key local
environmental issues – water quality and contaminated land. Each of
the last three chapters provides an overview of the issues, the present
position on legislation, and examples of industry responses.
The third part (Chapters 6 to 9) examines four approaches to environ-
mental management using case studies on regulation (specifically
integrated pollution control), company-public sector partnership (the
Clean and Competitive?Motivating Environmental
Performance in IndustryBy Rupert Howes,
Jim Skea and Bob WhelanLondon, UK
Earthscan Publications Ltd,1997
ISBN 1 85383 490 4 paperbackISBN 1 85383 491 2 hardback
194 pages£14.95
Book

62 THE JOURNAL OF SUSTAINABLE PRODUCT DESIGN · JULY 1998
REVIEWS
Aire and Calder project), voluntary industry initiatives ( the Industry
consortium for Electrical and Electronic Waste Recycling) and
economic instruments.
The final part of the book draws together the conclusions. Not
surprisingly, it concludes that progress is being made but that success
is patchy and much more is needed to put society and industry itself
on a path of sustainable development.
Minor criticisms are that part and section numbering would make
it easier to use the book as a reference, and some significant environ-
mental issues are not covered, or only covered in passing, for
example waste regulation, nuisance, resource conservation, nature
conservation and biodiversity. It barely touches on the development
of environmental management standards. Furthermore, since it is
based on UK research it only refers to international experience to a
limited extent. In its defence, however it does not set out to cover
every issue or provide a global analysis. Also, when it was published
ISO 14001 and EMAS had only just been launched.
These limitations aside, the book is well-written and informative.
It provides a succinct overview and analysis of the issues covered
while also providing a good level of detail and information. It is
therefore of potential value to existing practitioners as well as those
new to the subject. It is a useful reference not only for students
and policy makers but also for environmental managers seeking to
influence policy in a positive ’win-win’ rather than negative way.
In spite of its UK focus, it is broad enough in its scope to deserve
a wider audience. •
Tom Clark is a freelance environmental consultant within the EnvironmentalManagement Advisory Group (EMAG). He has worked on a wide range of environmental projects and issues in the UK and internationally and has helped over 25 companies and sites gain ISO 14001.

63JULY 1998 · THE JOURNAL OF SUSTAINABLE PRODUCT DESIGN
DIARY OF EVENTS
Managing eco-design 1: onlineconference
Managing eco-design 2: onlineconference
Textiles, design and environment:online conference
Towards Sustainable ProductDesign 2: online conference
✉ Martin CharterThe Centre for Sustainable DesignThe Surrey Institute of Art & DesignFalkner RoadFarnhamSurrey GU9 7DSUK+ 44 1252 892772+ 44 1252 [email protected]
20–21 August 1998
Renewable Energy for the 21st Century Trade Exhibition and ConferenceGloucestershire, UK
✉ Jo BadhamTrade Fair Co-ordinatorEnergy 21PO Box 154StroudGloucestershire GL6 6YPUK+ 44 1453 752 277+ 44 1453 756 571
26–28 August 1998
NordDesign ‘98Stockholm, Sweden
✉ Prof. Jan-Gunnar Persson+ 46 8 7907868Kjell Andersson+ 46 8 7906374Jesper Brauer+ 46 8 7907447Royal Institute of TechnologyDepartment of Machine DesignSE-100 44 StockholmSweden+ 46 8 [email protected]
30 August – 2 September 19983rd International Symposium onEnvironmental Software Systems(ISESS 1999)Dunedin, New Zealand
✉ Linda RobsonISESS 1999 Conference ManagerE 11 CanadaDepartment of Computing & Information ScienceUniversity of GuelphGuelphNIG 2W1Canada+ 1 519 824 4120 ext (3760)+ 1 519 837 [email protected]
31 August – 4 September 1998Cleaner Production and Sustainable Product Development: Summer CourseAmsterdam, The Netherlands
✉ Bridgette HertzInter-faculty Department ofEnvironmental ScienceUniversity of AmsterdamThe Netherlands+ 31 20 620 0225+ 31 20 624 [email protected]
5–8 September 1998TERENA Networking conference’98‘Are you ready for the Year 2001?’Dresden, GermanyTNC’98 Secretariat
✉ c/o TERENA SecretariatSingel 466-468NL-1017AW AmsterdamThe Netherlands+31 20 639 1131+31 20 639 [email protected]
6–8 September 1998Energy Efficiency Business Week ’98Prague, Czech Republic
✉ SEVEnSlezska 7120 56 PrahaCzech Republic+ 420 2 2424 7552/2425 2115+ 420 2 2424 [email protected]
6–9 September 1998
Environmental Responsibility in World TradeLondon, UK
✉ International Seminars1 Beaumont PlaceOxford OX1 2PJUK+ 44 1865 316636+ 44 1865 557368
14–15 September 1998
8th European EnvironmentConference ‘Advances in European Environmental Policy’Leeds, UK
✉ The Conference Manager ERP EnvironmentPO Box 75 ShipleyWest Yorkshire BD17 6EZUK+ 44 1274 530 408+ 44 1274 530 409
16–17 September 1998
Third International Symposium onGlobal Accords for SustainableDevelopment focusing onInnovative Mechanisms andEnabling TechnologiesCambridge, USA
✉ Prof. Nazli ChoucriMassachusetts Institute of TechnologyMIT E53 - 49377 Massachusetts AvenueCambridgeMA 02139 - 4307USA+ 1 617 253 6198+ 1 617 258 [email protected] Conference Services+ 1 617 253 1700+ 1 617 253 [email protected]

THE JOURNAL OF SUSTAINABLE PRODUCT DESIGN · JULY 1998
16–18 September 1998
Life Cycle Design’98 5th CIRPSeminar on Life Cycle EngineeringStockholm, Sweden
✉ Dr Conrad LuttroppKTH MaskinkonstruktionSE-10044 StockholmSweden+ 46 8 7907497+ 46 8 [email protected]
17–18 September 1998
Business Strategy and theEnvironmental ConferenceLeeds, UK
✉ The Conference ManagerERP EnvironmentPO Box 75ShipleyWest Yorkshire BD17 6EZUK+ 44 1274 530 408+ 44 1274 530 409
23–25 September 1998
Euro Environment ‘98: Pan-EuropeanConference on Industry andPerformanceAalborg, Denmark
✉ The Conference ManagerAalborg Congress & Kultur centerEurpa PladsPO Box 149DK-9100 AalborgDenmark+ 45 99 35 5555+ 45 99 35 [email protected].
24–26 September 1998
Perspectives and Employment on Environmental Engineering in EuropeHamburg, Germany
✉ Prof. Walter Leal FilhoTechnical University Hamburg HarburgEnvironmental TechnologyEissendorfer Strasse 40D-21073 HamburgGermany+ 49 40 7718 3327+ 49 40 7718 2155 [email protected]
24–27 September 1998
Perspectives and Employment onEvironmental Engineering in EuropeHamburg, Germany
✉ Prof. Walter Leal FilhoT U Hambrg HarburgEnvironmental TechnologyEissendorfer Strasse 40D-21073 HamburgGermany+ 49 40 7718 3327+ 49 40 7718 [email protected]
28 September – 1 October 1998
UNEP fifth International High-levelSeminar on Cleaner ProductionSeoul, Republic of Korea
✉ Kristina ElvebakkenCleaner production programmeUNEP Industry and Environment39–43 Quai Andre Citroen75739 Paris Cedex 15France+ 33 1 4437 3006+ 33 1 4437 [email protected]
28 September 1998
The Tomorrow ExchangeInteractive: Video Conference
✉ Asrid von SchmelingTomorrow Publishing AB+ 46 8 33 52 90+ 46 8 32 93 [email protected] Chris TuppenBT+ 44 171 356 5729+ 44 171 356 [email protected]
30 September – 2 October 1998
Environment Engineering &Management ConferenceBarcelona, Spain
✉ Liz KerrConference SecretariatWessex Institute of TechnologyAshurst LodgeAshurstSouthampton SO40 7AAUK+ 44 1703 293 223+ 44 1703 292 [email protected]
6–8 October 1998
Recycling Council of OntarioConference & Trade ShowToronto, Canada
✉ Cara HenryMembership and Events Co-ordinator489 College StreetSuite 504TorontoOntario M6G 4A5Canada+ 1 416 960 1025+ 1 419 960 [email protected]
7 October 1998
The Business of the Future –Turning Visions into Reality, 3rdAnnual Greenpeace BusinessConferenceLondon, UK
✉ Centaur Conferences50 Poland StreetLondon W1V 4AXUK+ 44 171 970 4797+ 44 171 970 [email protected]
15–16 October 1998
European Waste Forum 2Madrid, Spain
✉ Claudia OlazabalEuropean Waste ClubCapitan Haya 23 esc 1, 60428020 MadridSpain+ 34 915 569 334+ 34 915 568 [email protected]
26–27 October 1998
Towards Sustainable ProductDesign 3 conferenceincorporating: Managing eco-design 3conferenceLondon, UK
✉ Martin CharterThe Centre for Sustainable DesignThe Surrey Institute of Art & Design Falkner RoadFarnham Surrey GU9 7DSUK+ 44 1252 892772+ 44 1252 [email protected]
64
DIARY OF EVENTS

JULY 1998 · THE JOURNAL OF SUSTAINABLE PRODUCT DESIGN
28–30 October 1998
The Demanufacturing of ElectronicEquipment: Second Annual Seminarand ExhibitFlorida, USA
✉ Florida Educational Seminars, Inc2300 Glades Road, Suite 307EBoca RatonFL 33431 FloridaUSA+ 1 561 367 0193+ 1 561 367 8429
29 October 1998
Electronics R & D Needs: eco-design and ‘end of life‘ managementLondon, UK
✉ Martin CharterThe Centre for Sustainable DesignThe Surrey Institute of Art & Design Falkner RoadFarnham Surrey GU9 7DSUK+ 44 1252 892772+ 44 1252 [email protected]
4–6 November 1998
ENTREE ‘98 Innovation Strategies for Economy and EnvironmentDeventer, The Netherlands
✉ Sirkka PoyryUETP-EEEAv. de L’Oree 191050 BruxellesBelgium+ 32 2 6390 391 + 32 2 6390 [email protected] Erik BuggeHogeschool IjsellandFaculty of Chemistry, Environment & TechnologyPO Box 6577400 AJ DeventerThe Netherlands+ 31 570 663 106+ 31 570 663 [email protected]
5–7 November 1998
O2 Sustainable Business ConceptsChallenge International DesignWorkshopRotterdam, The Netherlands
✉ The Conference ManagerO2 NetherlandsP.P. Box 5193000 AM RotterdamThe Netherlands+ 31 10 411 8102+ 31 10 404 9395
15–18 November 1998
Partnership & Leadership: 7thInternational Conference of the Greening of Industry Network‘Building Alliances for aSustainable Future’Rome, Italy
✉ Kurt FischerUSA Co-ordinatorThe George Perkins Marsh InstituteClark University950 Mani StreetWorcesterMassachusetts+ 1 508 751 4607+ 1 508 751 [email protected]
16–18 November 1998
Care Innovation ‘98 Eco-efficientConcepts for the ElectronicsIndustry towards SustainabilityVienna, Austria
✉ Mr Bernd KopacekInternational CARE ‘Vision 2000’ Officec/o SAT, Aldergasse 3/1A-2700 Wiener NeustadtAustria+ 43 2622 27367+ 43 2622 [email protected]
19–20 November 1998
International NWO Conference‘Beyond Sustainability’Amsterdam, The Netherlands
✉ Gerard Barendse/Helais Udo de HaesCMLLeiden UniversityPO Box 9518NL 2300 RA Leiden The Netherlands+ 31 71 5277 489/461+ 31 71 5275 [email protected]
20–21 November 1998
Ecologizing Societal Metabolism:Designing Scenarios forSustainable Materials ManagementAmsterdam, The Netherlands
✉ Rene Kleijn/Ester van der VetCMLLeiden UniversityPO Box 95182300 R A LeidenThe Netherlands+ 31 71 5277 480+ 31 71 5277 [email protected]
25–27 November 1998
Third International Conference on EcobalanceTsukuba, Japan
✉ Ms Shoko TsudaEcomaterials ForumThe Society of Non-TraditionalTechnologyKotoharia Kalkan Building 3F1-2-8 ToranomonMinato-kuTokyo 105 Japan+81 3 3503 4681+81 3 3597 [email protected]
DIARY OF EVENTS
65

THE JOURNAL OF SUSTAINABLE PRODUCT DESIGN · JULY 199866
The Journal of Sustainable ProductDesign is targeted at Environmentaldirectors, managers, Design managers,Product designers, Academics andEnvironmental coordinators in local and central government worldwide.
Submissions Three copies and a 31/2” Macintosh – orIBM compatible disk should be sent to: Martin CharterThe Journal of Sustainable Product DesignThe Centre for Sustainable DesignFaculty of DesignThe Surrey Institute of Art & DesignFalkner RoadFarnhamSurrey GU9 7DSUK.Email submissions should be sent to: [email protected].
A black and white photograph of theauthor(s) should be supplied.
Presentation Articles submitted to the Analysissection (peer reviewed) should bebetween 2,500–5,000 words. Shorterarticles of 1,000–1,500 words are alsorequested for the Case Study andInnovation sections. Manuscripts shouldbe typed in journal style, double spaced(including footnotes and references)with wide margins, on one side only of good quality A4-size paper.
Manuscripts should be arranged in thefollowing order of presentation.
First sheet: Title, subtitle (if any),author’s name, affiliation, full postaladdress and telephone, fax number and email. Respective affiliations andaddresses of co-authors should beclearly indicated. Please also includeapproximately 100 words of biographi-cal information on all authors.
Second sheet: A self-containedabstract of up to 150 words summaris-ing the paper and its conclusions.
Subsequent sheets: Main body oftext, footnotes, list of references,appendices, tables (on separate sheets),and illustrations.
Authors are urged to write as conciselyas possible. The main title of the articleshould be kept short, but may be accom-panied by a subtitle. Descriptive orexplanatory passages, necessary asinformation but which tend to break theflow of the main text, should beexpressed as footnotes or appendices.
Bibliographic references: All bibliographical references should be complete and comprising of authorsand initials, full title and subtitle, placeof publication, publisher, date, and pagereferences. References to journal arti-cles must include the volume andnumber of the journal. The layout mustadhere to the following convention:
Author, A., and B. Author, ‘Title of book:Subtitle’ (Place of publication: publisher,date), pp.xx–xx. or
Author, A., and B. Author, ‘Title ofJournal Article: Subtitle’, in Journal,Vol.x No. x (January 19xx), pp. xx–xx.
These should be listed, alphabetically by author surname, at the end of thearticle.
If referring to works in the main body ofthe article, please use the ‘short title’method in parentheses.
Footnotes: These should be numberedconsecutively in Arabic numerals andplaced before the list of bibliographicalreferences. They should be indicated inthe text by use of parentheses, eg. ‘(see Note 1)’.
Tables, graphs, photographs etc. All graphs, diagrams and other drawingsshould be referred to as Figures, whichshould be numbered consecutively inArabic numerals and placed on separatesheets at the end of the manuscript.Their position should be indicated in thetext. All figures must have captions.Authors should minimise the amount ofdescriptive matter on graphs and drawings, and should refer to curves,points, etc. by their symbols and placedescriptive matter in the captions. Scalegrids should not be used in graphs,unless required for actual measurement.In all figures taken or adapted fromother sources, a brief note to that effectis obligatory, below the caption. Pleaseensure any photographs taken are ofgood quality. They may be supplied asprints or transparencies, in black andwhite or in colour.
Copyright Before publication, authors arerequested to assign copyright to The Centre for Sustainable Design. This allows The Centre for SustainableDesign to sanction reprints and photo-copies and to authorise the reprint ofcomplete issues or volumes according to demand. Authors traditional rightswill not be jeopardised by assigningcopyright in the manner, as they willretain the right to re-use.
Proofs Authors are responsible for ensuringthat all manuscripts (whether original or revised) are accurately typedbefore final submission. One set ofproofs will be sent to authors beforepublication, which should be returnedpromptly (by Express Air Mail if outsideUK).
Copy deadlines
Issue 7: 11 September 1998Issue 8: 11 December 1998Issue 9: 19 March 1999
Contributor guidelines
NOTES

Typography: [email protected]
Environmentally printed by The Beacon Press (BS7750, ISO 9002 and EMAS accredited).
Text pages printed on Sherwood Offset, a paper made from100% genuine waste with no chlorine bleaching, carrying both the NAPM and Blue Angel environmental awards.
Covers printed on Conservation Bright White, a NAPMand EUGROPA approved board which is 100% recycled.
Printed with vegetable based inks.

The Journal ofSustainable Product Design
ISSUE 6 : JULY 1998
5 EditorialMartin Charter, Joint Editor, The Journal of Sustainable Product Design
Analysis
7 Measuring product sustainabilityJoseph Fiksel, Jeff McDaniel and David Spitzley, Senior Director, Senior Consultant and Researcher, Battelle Memorial Institute, US
19 How important is environmental performance? A case study measuring the environmental preferences of ‘business to business’ consumersGraham Earl and Roland Clift, Research Engineer and Professor of Environmental Technology, Centre for Environmental Strategy, University of Surrey, UK
30 Design for Disassembly: a new element in product developmentDr Conrad Luttropp, Senior Research Associate, KTH Machine Design, Sweden
Gallery
41 Recycled furniture, Baygen self-powered lantern and SS-BG30 speakers
Analysis
42 Opportunities and constraints for product-oriented diagnosis toolsMarije Lafleur, René van Berkel and Jaap Kortman, IVAM Environmental Research, University of Amsterdam, the Netherlands
Interview
54 Professor Ezio ManziniMartin Charter, Joint Coordinator, The Centre for Sustainable Design, UK
Innovation
57 Sustainable ValueMartin Charter, Joint Coordinator, The Centre for Sustainable Design, UK
O2 news
60 Special feature: The Next Step event 98Martin Charter, Joint Coordinator, The Centre for Sustainable Design, UK
61 Reviews
63 Diary of eventsThe Surrey Institute of Art & Design
The Centre for Sustainable Design
an initiative of