issue december 2015 ingeniousnews - scion …...ingeniousnews 06/2015 3 determination of iodoform in...
TRANSCRIPT

IngeniousNewsIssue 6December 2015
www.palsystem.com
Determination of iodoform in drinking water by PAL SPME Arrow and GC/MS
page 3
Determination of C2-C12 aledhydes in water by SPME Arrow on-fiberderivatization and GC/MS
page 11

Imprint
IngeniousNews 06/2015
Date of print: 12.2015
CTC Analytics AGIndustriestrasse 20CH-4222 ZwingenSwitzerland T +41 61 765 81 00Contact: [email protected]
Legal Statements
CTC Analytics AG reserves the right to make improvements and/or changes to the product(s) described in this document at any time without prior notice.
CTC Analytics AG makes no warranty of any kind pertaining to this product, including but not limited to implied warranties of merchantability and suitability for a particular purpose.
Under no circumstances shall CTC Analytics AG be held liable for any coincidental damage or damages arising as a conse-quence of or from the use of this document.
© 2015 CTC Analytics AG. All rights reserved. Neither this publication nor any part hereof may be copied, photocopied, reproduced, translated, distributed or reduced to electronic medium or machine readable form without the prior written permission from CTC Analytics AG, except as permitted under copyright laws.
CTC Analytics AG acknowledges all trade names and trademarks used as the property of their respective owners.
PAL is a registered trademark of CTC Analytics AG | Switzerland

3IngeniousNews 06/2015
Determination of iodoform in drinking water by PAL SPME Arrow and GC/MS
Peter Egli, Beat Schilling, BGB Analytik AG, Adliswil, SwitzerlandGuenter Boehm, CTC Analytics AG, Zwingen, Switzerland
Introduction
Chlorine is frequently used to disinfect drinking water. Despite the benefits of this procedure there are also a number of im-portant disadvantages to it. The process of chlorination leads to disinfection byproducts (DBPs), such as chloroform and other trihalomethanes. These compounds are formed from the interaction of aqueous free chlorine with natural organic matter present in the raw water. Many of these DBPs are suspected carcinogens and are regulated by the U.S. Environmental Protec-tion Agency (EPA) as well as other agencies worldwide.Iodinated trihalomethanes (ITHMs) can also be formed as a consequence of this process when iodide (i.e., from natural sources, seawater, or brines) is present. ITHMs are usually associated with characteristic pharmaceutical or medicinal odors and tastes in drinking water. The taste and odor threshold concentrations (ref.2, 3) of iodoform of 0.02 - 5 µg/L, is significantly lower than that of chloroform or bromoform, 100 and 300 µg/L, respectively. Odors and tastes in drinking water are a matter of concern for water suppliers and a frequent source of complaints from consumers. The EEC Drinking Water Directive (Euro-pean Council Directive 80/778 EE), related to the quality of water intended for human consumption, includes taste and odor parameters. Hence water suppliers have to monitor iodoform levels quantitatively.
Analytics
Older methods for the analysis of chlorination and iodination DBPs are based on solvent extraction. These methods are time- and labor-intensive and require the use of hazardous organic solvents. Solid-phase microextraction (SPME) presents a simple, fast, and sensitive method of sample preparation that is also solvent-free. Currently there is no published standard analytical method for iodinated DBPs like iodoform. Here we describe the quantitative analysis of iodoform in tap water by PAL SPME Arrow extraction combined with GC/MS. Im-mersion as well as headspace SPME has been performed on two different fiber types. The PAL SPME Arrow is a new technol-ogy for microextraction, combining trace level sensitivity with high mechanical robustness. The PAL SPME Arrow has an outer diameter of 1.1 or 1.5mm, resulting in large sorption phase surfaces and volumes (fig.1). The arrow-shaped tip allows smooth penetration of vial and injector septa. In contrast to traditional SPME fibers, the Arrow design fully protects the sorptive materi-al, minimizing adverse influences and loss of analytes during transfer processes.
Short summary
With PAL SPME Arrow detection limits for iodoform in tap water of 15 ng/L (S/N > 3) have been achieved in immersion mode and 2 ng/L in headspace mode (S/N > 3), with DVB as sorption phase. At 50 ng/L a standard deviation of 3.8% (n=5) was achieved. This is sufficiently low to reliably detect iodoform well below the odor threshold of 30 ng/L.

4 IngeniousNews 06/2015
Sorption phase surface
Sorption phase volume
a 62.8 mm2 11.8 µL
b 44.0 mm2 3.8 µL
c 9.4 mm2 0.6 µL
Fig. 1: Dimension of a PAL SPME Arrow 1.5 mm (a), 1.1 mm (b) and SPME Fiber (c) in comparison
Experimental
Chemicals
Water: Sartorius arium ultrapure with UV lamp (water according to ISO 3696)Tap water: Communal water supply from Adliswil, SwitzerlandIodoform, CHI3: puriss. p.a. Fluka CAS# 75-47-8Toluol: puriss Fluka 89681Standard stock solution: 50 mg CHI3 in 50 mL toluolStandard working solution: 10 µL stock in 10 mL toluol (equivalent to 1 ng), solutions have to be kept at 4°C in the dark,
working solutions were prepared freshly every day
Procedure
Sampling SPME Arrow: PAL SPME Arrow Tool with PDMS 20 mm x 100 µm, or DVB 20 mm x 120 µm fibers, 1.1 mm diameterSampling SPME: PAL SPME Tool with DVB 10 mm x 65 µm Supleco fiber (PN 57311) Immersion extraction: 19 mL water in 20 mL headspace vialsIncubation temp: 25°CAgitation: PAL Heatex Stirrer Module @ 1600 rpm (200 cycloidal loops)Extraction time: 60 minDesorption: 200°C ; 2minHeadspace extarction: 10mL water in 20 mL headspace vials with 4 g Na2SO4
Pre conditioning: 0:30 minPre incubation time: 1:00 minIncubation temp: 70°CAgitation: PAL Agitator Module @ 250 rpmNeedle penetration: 22 mmFiber penetration : 30 mmExtraction time: 60 minDesorption: 200°C ; 2 minGC: Varian 3400 MS: Varian Saturn Ion Trap Column: 30 m x 0.25 mm; 0.25 µm BGB-5 Carrier gas: Hydrogen 2.0 psi Temperature program: 50°C for 1min, then 10°C/min -> 280°C Injector: 200°C Mass range: 100 - 300 m/z
5IngeniousNews 06/2015
Results
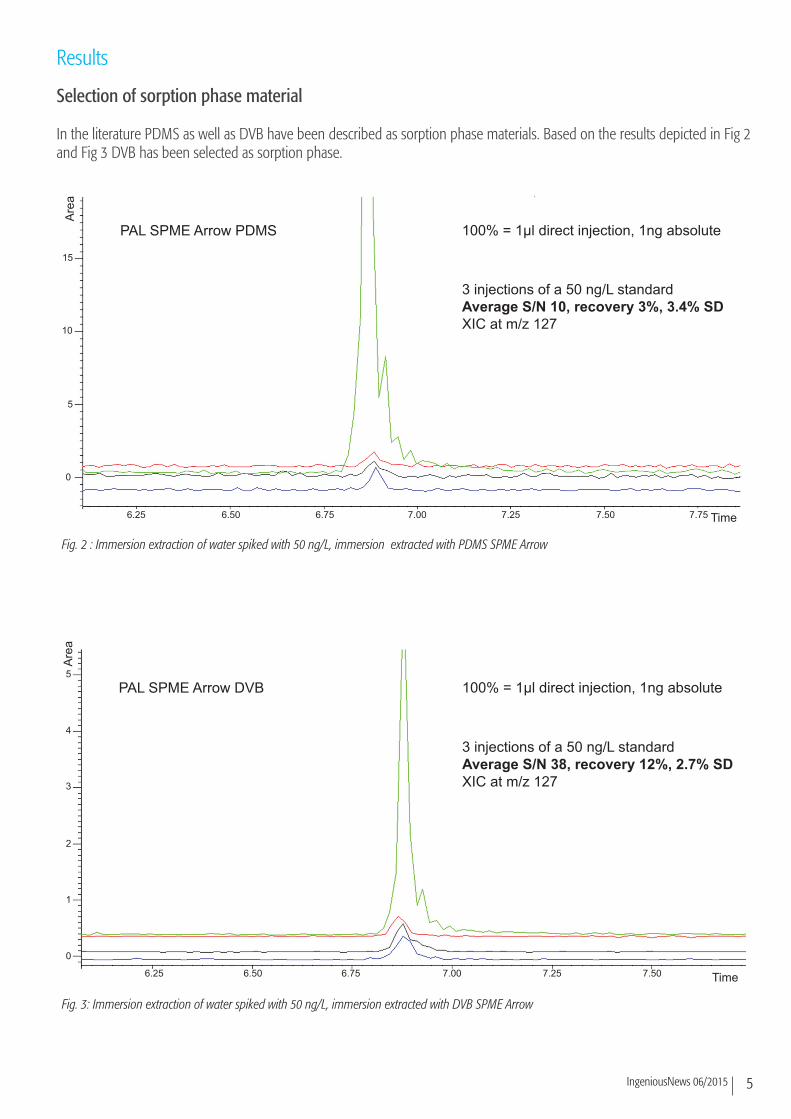
Selection of sorption phase material
In the literature PDMS as well as DVB have been described as sorption phase materials. Based on the results depicted in Fig 2 and Fig 3 DVB has been selected as sorption phase.
Are
a
Time
0
5
10
15
6.25 6.50 6.75 7.00 7.25 7.50 7.75
PAL SPME Arrow PDMS 100% = 1µl direct injection, 1ng absolute
3 injections of a 50 ng/L standardAverage S/N 10, recovery 3%, 3.4% SDXIC at m/z 127
Fig. 2 : Immersion extraction of water spiked with 50 ng/L, immersion extracted with PDMS SPME Arrow
Are
a
Time
0
1
2
5
6.25 6.50 6.75 7.00 7.25 7.50
PAL SPME Arrow DVB 100% = 1µl direct injection, 1ng absolute
3 injections of a 50 ng/L standardAverage S/N 38, recovery 12%, 2.7% SDXIC at m/z 1273
4
Fig. 3: Immersion extraction of water spiked with 50 ng/L, immersion extracted with DVB SPME Arrow

6 IngeniousNews 06/2015
Optimization of extraction parameters
Based on the results depicted in fig. 4 the extraction time for immersion was set to 60 min.
With desorption temperatures between 160°C and 220°C little decomposition of iodoform has been observed (fig. 5,). A desorption temperature of 200°C has been selected for all experiments. Frazey et al. (ref. 1) report noticeable decomposition above 160°C.
0
2000
4000
6000
8000
10000
12000
14000
16000
0 50 100 150Temperature [°C]
Are
a [m
/Z 1
27]
Fig. 4 : Immersion extraction time course for a 100 µm DVB SPME Arrow : water spiked @ 50 ng/L
0
50000
100000
150000
200000
250000
300000
350000
160 180 200 220Temperature [°C]
Are
a [m
/Z 1
27]
Fig. 5: Optimization of desorption temperature for a 100 µm DVB SPME Arrow

7IngeniousNews 06/2015
Are
a
Time
7.5
10.0
12.5
15.0
5 6 7 8 9 10
PAL SPME ArrowSPME
Fig. 6 : Comparison SPME Arrow DVB /SPME DVB fibers for the immersion extraction of water spiked @ 50ng/L after 60 min
Fig. 7: Calibration curve of iodoform in water 50-1000 ng/L , immersion extraction

8 IngeniousNews 06/2015
Immersion vs. Headspace Extraction
In the literature both immersion (e.g. stir bar extraction) and headspace extraction have been applied for iodoform. Based on the results described in fig. 6 headspace extraction has been chosen. Interestingly the difference between headspace and immersion extraction is much less pronounced for the SPME fiber.As shown in fig. 8 and 9 SPME Arrow shows a 26x higher recovery in headspace mode than the corresponding SPME fiber.
Are
a
Time
0
50
100
150
4 5 6 7 8
Headspace 39%
PAL SPME Arrow
9
Recovery in %
Immersion 9.8%
Are
a
Time0.0
2.5
5.0
7.5
5 6 7 8
Headspace 1.5%
SPME
9
Recovery in %
Immersion 1.2%
10.0
12.5
Fig. 8 : Comparison of immersion extraction vs. headspace extraction for DVB SPME Arrow @ 1 µg/L
Fig. 9 : Comparison of immersion extraction vs. headspace extraction for DVB SPME fiber @ 1 µg/L
Are
a
Time
10
20
30
40
5.50 5.75 6.00 6.25 6.50 6.75 7.00
100 ng/L
75 ng/L
50 ng/L
25 ng/L10 ng/L (s/n=27)
Fig. 10: Chromatograms of of iodoform in water, headspace extraction wit a DVB SPME Arrow, at different concentrations

9IngeniousNews 06/2015
Fig. 11: Calibration curve of iodoform in water 10-1000 ng/L , headspace extraction
Conclusions
With a DVB PAL SPME Arrow detection limits of 15 ng/L (S/N > 3) have been achieved in immersion mode and 2 ng/L in headspace mode (S/N > 3). At 50 ng/L the standard deviation was 3.8% (n=5). This is sufficiently low to detect iodoform well below the odor threshold of 30 ng/L.
DVB as sorption phase shows roughly a 3 x better recovery for iodoform than PDMS.
With immersion extraction the recovery of iodoform is 8 x higher with the PAL SPME Arrow than with the corresponding SPME fiber. With headspace extraction the recovery for SPME Arrow is 26 x higher.
With desorption temperatures between 160°C and 220°C little decompositon of iodoform has been observed (ref. 1 reports noticeable decomposition above 160°C). A desorption temperature of 200°C has been selected for all experiments.
References
[1] Solid-Phase Microextraction with Temperature-Programmed Desorption for the Analysis of Iodination Disinfection Byproducts Paul A. Frazey, Robert M. Barkley, and Robert E. Sievers Anal. Chem. 1998, 70, 638-644[2] Determination of the Odor Threshold Concentrations Of Iodinated Trihalomethanes in Drinking Water Beatriz Cancho, Cristina Fabrellas, Alfredo Diaz, and Francesc Ventura, Teresa Galceran J. Agric. Food Chem. 2001, 49, 1881-1884[3] Simultaneous analysis of 10 trihalomethanes at nanogram per liter levels in water using solid-phase microextraction and gas chromatography mass-spectrometry
Sebastien Allard*, Jeffrey W.A. Charrois, Cynthia A. Joll, Anna Heitz J. Chromatography A, 1238 (2012) 15– 21[4] An Optimized Analytical Method for the Simultaneous Detection of Iodoform, Iodoacetic Acid, and Other Trihalomethanes and Haloacetic Acids in Drinking Water Xiaolin Liu, Xiao Wei, Weiwei Zheng, Songhui Jiang, Michael R. Templeton, Gengsheng He, Weidong Qu* PLoS ONE 2013, 8(4) e60858. doi:10.1371/journal.pone.0060858

10 IngeniousNews 06/2015
PAL SPME Arrow Ordering Information
System requirements
• PAL RTC or RSI with firmware 2.3 or higher• PAL SPME Arrow Tool• PAL Heatex Stirrer Module • Adaptation of GC-injector (see page 11)• A PAL SPME Arrow Conditioning Module is highly recommended, the PAL SPME Fiber Conditioning Module cannot be used with SPME Arrow.• For overlapped extraction, the Agitator Module is required
The PAL SPME Arrows are available in order quantities of one, three or five SPME Arrows per box.For method development, a set of each fiber type (set of five) is available.
Diameter Phase Thickness Color Code Set of 1 SPME ArrowDescription PNo.
Set of 3 SPME ArrowsDescription PNo.
Set of 5 SPME ArrowsDescription PNo.
PDMS SPME Arrow (Polydimethylsiloxane)
1.1 mm 100 µm Red ARR11-P-100/20-P1 ARR11-P-100/20-P3 ARR11-P-100/20-P5
Acrylate SPME Arrow (Polyacrylate)
1.1 mm 100 µm Grey ARR11-A-100/20-P1 ARR11-A-100/20-P3 ARR11-A-100/20-P5
Carbon WR SPME Arrow / PDMS (Carbon Wide Range / PDMS)
1.1 mm 120 µm Light Blue ARR11-C-WR-120/20-P1 ARR11-C-WR-120/20-P3 ARR11-C-WR-120/20-P5
DVB SPME Arrow / PDMS (Divinylbenzene / PDMS)
1.1 mm 120 µm Violet ARR11-DVB-120/20-P1 ARR11-DVB-120/20-P3 ARR11-DVB-120/20-P5
PDMS SPME Arrow (Polydimethylsiloxane)
1.5 mm 250 µm Black ARR15-P-250/20-P1 ARR15-P-250/20-P3 ARR15-P-250/20-P5
SPME Arrow Collection – Development Kit
One of each type of SPME Arrows above | set of five ARR1115-SEL5-S1
(Detailed user information can be found in the SPME Arrow Instruction Leaflet.)

11IngeniousNews 06/2015
Determination of C2-C12 aldehydes in water by SPME on-fiber derivatization and GC/MS
Peter Egli1, Beat Schilling1, Guenter Boehm2
1 BGB Analytik AG, Adliswil, Switzerland, 2 CTC Analytics AG, Zwingen, Switzerland
Aldehydes
Aldehydes are widely found in nature. Natural sources for aldehydes are, e. g., the alcoholic fermentation, lipid oxidation or atmospheric processes. Aldehydes have also been identified as by-products of drinking water disinfec-tion, particularly ozonation. The primary aldehydes that have been measured are formaldehyde, acetaldehyde, glyoxal, and methyl glyoxal, but aldehydes with higher molecular weights have also been reported. Total aldehyde concen-trations in drinking water disinfected with ozone range from less than 5 µg/L to 300 µg/L.
Some aldehydes are important flavor compounds, in some cases unde-sirable off flavors. The formation of aldehydes is a major contributor to the deterioration in flavor of beer upon storage. Certain aldehydes have extremely low odor thresholds, such as (E)-alkenals or (E,E)-alkadienals. The means to detect the presence of such compounds is therefore important for a large variety of food samples as they contribute considerably to flavor quality or cause off-flavors, such as the known cardboard note in beer or packaging materials.
A non-natural source of aldehydes in food, particularly beverages is the wide-spread use of polyethylene terephthal-ate (PET) containers. It is assumed that aldehydes are formed during the
production of the PET container and then slowly released into the food.
Furthermore, aldehydes are considered as markers for enhanced oxidative stress in biological systems, and have also been proposed as a diagnostic marker of cancer status.
Although no legislation has been established for their control, the World Health Organisation has published a drinking water guideline value of 900 µg/L for formaldehyde.
In order to monitor treatment prac-tices, assess exposure to consumers, and control health risks that might be associated with this class of by-prod-ucts, a reliable and sensitive monitoring method is required.
SPME with on-fiber derivatization
Since a publication by Martos and Pawliszyn in 1998 (ref.1) a significant number of publications on this topic have appeared, dealing with environ-mental, clinical, flavor, and chemical topics. Procedures for a wide range of analytes have been established apply-ing both headspace and immersion derivatization.
Here we describe the on SPME fiber derivatization and subsequent anal-ysis of a number of aldehydes with O-(2,3,4,5,6-pentafluorobenzyl)- hy-droxylamine hydrochloride (PFBHA) in aqueous solution to form pentafluoro-benzyl oxime derivatives (Fig. 1).PFBHA reacts quantitatively, even with conjugated aliphatic aldehydes.
SPME fiber max. 0.6 µL sorption phase
SPME Arrow max. 15.3 µL sorption phase
Arrow shaped tip foreasy penetration of septa
Figure 2: PAL SPME Arrow compared to a conventional SPME fiber. Size and position of the sorptive phases
are shown in red.
OR
R
FF
FF
F C NH2OH2 +
FF
FF
F C NOH2
R
R+ H2O
Figure 1: Reaction of O-(2,3,4,5,6-pentafluorobenzyl)- hydroxylamine hydrochloride (PFBHA) with aldehydes and
ketones in aqueous solution

12 IngeniousNews 06/2015
The resulting oximes (E- and Z-iso-mers) do not decompose at elevated temperatures, neither do they require a time-consuming clean-up step and can easily be resolved by GC. The detection is achieved by either electron capture, thermionic or mass-selective detec-tion. EPA method 556 is based on this reaction, but applying derivatization in solution rather than on-fiber.
The SPME “fibers” used in this work are PAL SPME Arrows. Besides the greatly improved mechanical stability SPME Arrows feature a much larger surface area/sorption phase volume than SPME fibers, which is beneficial for achieving good sensitivities (Fig. 2,4).
Experimental
Chemicals:
Water:Sartorius arium ultrapure with UV lamp (water according to ISO 3696), further purified by heating to 90°C for 60 minAldehydes analyzed:Acetaldehyd (C2), propanal (C3), bu-tanal (C4), hexanal (C6), heptanal (C7), octanal (C8), nonanal (C9), decanal (C10), undecanal (C11), dodecanal (C12), (Fluka, puriss. purity > 99%)
Internal standard (Int Std):10 µl 2,3,5,6-Tetrafluorobenzaldehyd (Fluka 328936, purity > 97%) in 10 ml methanol (Carlo Erba HPLC Grade, 412383)
Derivatization reagent:100 mg PFBOA O-(2,3,4,5,6-Pentaflu-orobenzyl)hydroxylamin hydrochlorid (Fluka 76735, purity > 99%) dissolved in 10 ml 0.05 M H2SO4 (Fluka, purity > 90%), further purified by heating to 90°C for 60 min
Procedure:
The PAL Arrow is dipped into the derivatizating reagent (s. above). Then the fiber is exposed for 30 min to the headspace of a 5 mL water sample (60°C) in a 20 mL headspace vial.
Extraction/derivatization conditions: Sampling Tool: PAL SPME
Arrow 1.15 mm diameter
Phase type: PDMSPhase length: 20 mmPhase thickness: 100 µmPre conditioning: 0:30 minPre incubation time: 1:00 minIncubation temp: 60°CAgitation speed: 500 rpmNeedle penetration: 22 mmFiber penetration: 30 mmExtraction time: 30:00 minDesorption time: 2:00 min
Analytical conditions:
GC: Varian 3400MS: Varian Saturn Ion
TrapColumn: 30 m x 0.25 mm
0.25 µm BGB-5Carrier gas: Hydrogen 5.0 psiTemp. program: 70°C for 1min, then
5°C/min > 280°CInjector: PI 250°C, isothermalMass range: 75 - 230 m/z
Figure 3: Optimization of extraction/reaction time, reaction temperature was 60°C. Note that the reaction yields
stereoisomers, hence the doublets in the chromatogram.
Figure 4: PAL SPME Arrow Tool for PAL RTC
and PAL RSI.

13IngeniousNews 06/2015
Results:
Reaction conditions:
After dipping the SPME Arrow into the derivatizaion reagent the extraction/derivatization was performed at 60°C on the fiber exposed to the headspace. An extraction time of 30 min was cho-sen because longer times showed no further increase of the extraction yield (see Fig. 3).
Salting out with 1.5 g of NaCl/10 mL showed a small increase of signals for the smaller aldehydes (C2-C4), as would be expected. However, since the effect was limited salting out was not used for further experiments.
Conclusions:
The method employing a SPME Arrow allows for the quantitation of water samples down to 50 ng/L for most of the described aldehydes with good pre-cision. A previous publication applying traditional standard SPME fibers and GC/MS achieved sensitivities down to 120-340 ng/L in spiked samples for C1, C3-C5 (ref. 3).Blank water samples as well as the sam-ples of the higher aldehydes contain C2 (acetaldehyde) and other contaminants in amounts high enough to hamper the analysis at levels below 50 ng/L.The sensitivity of the method could be increased further by applying selected reaction monitoring (SIM).The robustness of the PAL SPME Arrow allowed for the uninterrupted analysis of several hundred samples with one single SPME Arrow.
Aldehyde #1 #2 #3 #4 #5 Mean Std. Dev. %RSD
C2 1368761 1410756 1512509 1432007 1476145 1440036 45749.51 3.17
C3 684295 801885 806476 875981 915465 816820 72022.9 8.81
C4 1980129 2026277 1950798 2125312 2129706 2042444 67113.44 3.28
C6 2108728 2143327 2080365 2161982 2175526 2133986 31910.76 1.49
C7 1940569 1953331 1930925 2044924 1965753 1967100 37104.58 1.88
C8 1144195 1192141 1185666 1262568 1181341 1193182 35147.13 2.94
C9 820606 852812 824028 903949 835834 847446 27763.91 3.27
C10 501254 528851 529842 562818 529545 530462 17813.1 3.35
C11 2459892 1566813 1478380 1857195 2522259 1976908 400358.3 20.25
C12 506797 507374 559419 571990 532635 535643 24244.17 4.52
Table 1: Reproducibility and standard deviation at 10 µg/L. Note that the signals for C11 are disturbed by
co-eluting compounds.
Reproducibility and calibration data:
Figure 5: Calibration without Int Std. It can be seen that the background level of C2 (acetaldehyde) is rather
high and could not be eliminated. The values for C11 are not included because of co-eluting compounds.
20 µg/L 10 µg/L 8 µg/L 6 µg/L 4 µg/L 2 µg/L 1 µg/L 0.5 µg/L R2
C2 2266627 1476145 1232841 1118940 966230 911115 803863 769740 0.996
C3 1559080 895465 694653 509554 335235 183452 106914 60730 0.995
C4 4153541 2229706 1764289 1347615 903684 486444 239342 142822 0.992
C6 4310253 2475526 2047288 1567859 1053491 512852 248795 131511 0.992
C7 3991048 2165753 1786319 1402977 930288 448971 198072 97556 0.994
C8 2171225 1181341 966167 741344 469938 208754 92831 48914 0.994
C9 1685269 835834 727871 540683 344514 158269 81931 45430 0.997
C10 1163606 529545 465284 349988 221618 92857 50759 22330 0.997
C12 1148210 532635 437879 317742 219795 87271 43249 20597 0.998
Table 2: Calibration data: good linearity was achieved.

14 IngeniousNews 06/2015
Figure 6: Reproducibility and siganl/noise (s/n) ratios of the different aldehydes at 160 ng/L
Figure 7: Sample @ 160 ng/L (orange) compared to a blank water sample (green).
References: [1] Sampling and Determination of Formaldehyde Using SPME with On-Fiber Derivatization. P. Martos, J. Pawliszyn; Anal. Chem. 1998, 70, 2311-2320.
[2] Determination of aldehydes in drinking water using penta-fluorobenzylhydroxylamine derivat-ization and solid-phase microextraction. F.Ventura, B. Cancho, M. T. Galceran; J. Chromato-gr. A. 2002, 943, 1-13.
[3] Analysis of aldehydes in water by solid-phase microextraction with on-fiber derivatization. S.W. Tsai, C.M. Chang; J. Chromatogr. A. 2003, 1015, 143.
[4] Evaluation of solid-phase microextraction meth-ods for the determination of trace concentration aldehydes in aqueous solution. J. Beranek, A. Kubatova; J. Chromatogr. A. 2008, 1209, 44-54.


www.palsystem.comVisit our homepage for more information.