issue of january 10, 1966 printed in u.s.a. · pdf filethe journal of brouxxcar. chemistry...
TRANSCRIPT

THE JOURNAL OF Brouxxcar. CHEMISTRY Vol. 241, No. 1, Issue of January 10, 1966
Printed in U.S.A.
Comparative Study of Tadpole and Frog
Glutamate Dehydrogenases*
(Received for publication, June 28, 1965)
BARBARA 0. WIGGERT AND PHILIP P. COHEN
(From the Department oJr Physiological Chemistry, University of Wisconsin, Madison, Wisconsin 53706
SUMMARY
1. There is approximately a IO-fold increase in the specific activity of liver glutamate dehydrogenase during the spon- taneous metamorphosis of tadpoles (Rana cafesbeiana).
2. Compara.tive studies of glutamate dehydrogenases from premetamorphic tadpole liver and adult frog liver revea.led differences in kinetic constants for DPN and TPN, in the effect of temperature on initial rates with DPN as coenzyme, in the crude molecular weights estimated from sucrose density centrifuga.tion, and in relative reactivities with L-amino acids other than glutamate.
3. An antibody produced in rabbits against crystalline frog liver glutamate dehydrogenase precipitates glutamate dehy- drogenase preparations from frog, tadpole, beef, and chicken liver and affects their reaction kinetics in a similar manner.
Frog liver glutamate dehydrogenase has been crystallized and characterized (1, 2), and it has been determined that the activ- ity of this enzyme increases significantly during thyroxine-in- duced metamorphosis of tadpoles (3). The present studies were undertaken to determine whether or not any differences exist between glutamate dehydrogenase derived from premeta- morphic tadpoles, which are ammonotelic, and that from adult frogs, which are ureotelic. Frieden (4) has recently reported some experiments in which tadpole liver glutamate dehydrogen- ase was compared with glutamate dehydrogenase from other sources.
EXPERIMENTAL PROCEDURE
Enzymes and Reagents-Frog liver glutamate dehydrogenase was crystallized and prepared for assay as previously described (1). Glutamic acid-HCl was obtained from the Nutritional Biochemicals. All other enzymes, substrates, and purine nu- cleotides were obtained from Sigma. yz-Globulin, prepared from rabbits immunized with human plasma and purified by chromatography on DEAE-cellulose, was a gift from Dr. H. F. Deutsch of this department.
Initial Velocity Measurements-Yeast alcohol dehydrogenase
* This study was supported in part by Grant C-3571 from the National Cancer Institute, National Institutes of Health, United States Public Health Service, and by Grant 21237 from the Na- tional Science Foundation.
assays were carried out in 0.05 M Tris-HCI (0.05 M with respect to Tris), pH 8.5, containing 0.17 M ethanol and 0.015 M DPN. Glutamate dehydrogenase assays were performed in 0.01 M
Tris-acetate (0.01 M with respect to Tris), pH 8.0, containing 1 X 1OV M EDTA at 23” unless otherwise indicated. For ex- periments at different temperatures, water of the desired tem- perature was circulated through the spectrophotometer chamber, and the assay mixtures were brought to the same temperature by previous incubation. The reactions were followed spectro- photometrically at 340 rnE.1 with the use of a Brown recorder with an expanded scale (5). An amount of enzyme was em- ployed which resulted in an optical density change per min of not less than 0.004. Initial rates were calculated from the linear reaction velocities which occurred during the interval between 10 and 30 set after addition of the enzyme.
Protein and hritrogen Determinations-Protein concentration was determined by the method of Warburg and Christian (6). The protein concentration of crystalline frog glutamate dehy- drogenase was determined by measuring the absorbance at 280 rnp and the use of a previously determined extinction coefficient of 0.95 ML1 cm-l (1). Nitrogen was determined by the method of Minari and Zilversmit (7).
Preparation of Glutamate Dehydrogenase from Premetamorphic Tadpole Liver-Tadpoles (Rana catesbeiana) were purchased from the Lemberger Company, Oshkosh, Wisconsin, and from the North Carolina Biological Supply Company, Elan, North Carolina. Glutamate dehydrogenase was prepared from 35 g of liver from 130 premetamorphic tadpoles by the method pre- viously described for the preparation of frog liver glutamate dehydrogenase (I), except that a glass homogenizer equipped with a Teflon pestle was used instead of a Waring blendor. Re- peated efforts to crystallize the enzyme have not been success- ful to date. The tadpole liver enzyme preparation was stored as a 40% ammonium sulfate precipitate in 0.02 M Tris-chloride buffer (0.02 M with respect to Tris), pH 7.5. The specific ac- tivity of the preparation in an assay system consisting of 0.01 M Tris-acetate, pH 8.0; 1 X 10-s M EDTA; 2 X 1O-2 M cr-keto- glutarate; 5 x lo+? M NH&l; and 5 x 1OV M DPNH was 2.5 x
lop4 mmoles of DPN produced per min per mg of protein, or about lOTo of the specific activity found with the first fraction of crystals of frog liver glutamate dehydrogenase (1).
Glutamate Dehydrogenase from Liver of Metamorphosing Tad- poles-Tadpoles were allowed to metamorphose spontaneously in tap water at 24” in plastic containers and were fed canned spinach. The water was changed daily. The stage of meta- morphosis was determined by the criteria established by Taylor
210
by guest on May 21, 2018
http://ww
w.jbc.org/
Dow
nloaded from

Issue of January 10, 1966 B. 0. Wiggert and P. P. Cohen 211
and Kollros (8). In order to study glutamate dehydrogenase from animals at a particular stage in metamorphosis, an indi- vidual tadpole liver, weighing 400 to 600 mg and freed of the gall bladder, was cut into small pieces and homogenized in 2.0 ml of cold 0.15 M KC1 by means of a small glass homogenizer equipped with a hand-operated Teflon pestle. The homogenate was centrifuged for 15 min at 12,000 x g in a Servall centrifuge with microtubes and adaptors. The supernatant fraction was discarded and the particulate fraction was homogenized as before in 2.0 ml of cold, doubly distilled water. The homogenate was centrifuged for 15 min at 34,000 x g. The clear supernatant fraction was used for assay of glutamate dehydrogenase activity.
Sucrose Density Gradient Centr$ugation-The sucrose density gradient centrifugation method of Martin and Ames (9) for determining the approximate molecular weights of enzymes in crude extracts was used to compare frog and tadpole glutamate dehydrogenases. The enzyme samples, containing 0.12 to 0.39 mg of protein in 0.1 M Tris-acetate with 1 X lop4 M EDTA, pH 8.0, were layered on 4.9 ml of a linear sucrose gradient (5% to 20%, w/v, in 0.1 M Tris-acetate containing 1 X 1O-4 M EDTA, pH 8.0). Centrifugation was carried out at 37,000 rpm for 3 hours in the SW-39 swinging bucket rotor of a model L Spinco centrifuge at 22”. After centrifugation, a hole was punched in the bottom of the tube and successive fractions were collected and assayed for enzymatic activity. Yeast alcohol dehydrogen- ase was chosen as the reference protein.
Preparation of Antibody to Crystalline Frog Liver Glutamate Dehydrogenase-Two adult male albino rabbits weighing ap- proximately 6 pounds each were each twice treated by subcu- taneous injection with 3 mg of crystalline frog liver glutamate dehydrogenase dissolved in 0.3 ml of complete Freund’s adjuvant at intervals of 2 weeks. Two weeks after the second subcu- taneous injection, a series of five intravenous injections, con- taining 2 mg of crystalline frog glutamate dehydrogenase dis- solved in 0.5 ml of 0.15 M NaCl, were administered 2 to 3 days apart. At suitable intervals, samples (approximately 1 ml) of blood were withdrawn from an ear vein and the serum was tested for the presence of anti-frog glutamate dehydrogenase. Five days after the last intravenous injection, another subcutaneous injection was administered, followed 1 week later by two more intravenous injections given 5 days apart. One week later the rabbits were exsanguinated by means of cardiac puncture. The serum was collected by centrifugation of the clotted blood, and the ye-globulin fraction was isolated according to the method of Deutsch (10). The y,-globulin fraction was dissolved in 0.15 ml of NaCl solution to give a concentration of 13.3 mg per ml.
In order to determine approximate equivalence points and to test for cross-reaction of the anti-frog glutamate dehydrogenase with glutamate dehydrogenases from different sources, 0.2-ml aliquots of the undiluted y,-globulin solution were incubated at 37” for 15 min with various concentrations of a particular gluta- mate dehydrogenase preparation in a total of 1 ml of 0.15 M
NaCl. The mixture was then allowed to stand at 5” for 48 hours. Approximate equivalence points were determined by testing the clear supernatant fraction after centrifugation for the presence of antibody and antigen. Controls were without anti- body or without antigen.
RESULTS
Increase in XpeciJic Activity During Spontaneous Metamorpho- sis-It has been previously reported by DeGroot and Cohen (3)
TABLE I
Increase in specific activity of glutamate dehydrogenase during spontaneous metamorphosis
Enzymatic assays were performed in 0.01 M Tris-acetate, pH 8.0, with 1 X 10e5 M EDTA, 5 X 10e6 M DPNH, 2 X lo+ M cu-keto- glutarate, and 5 X 1O-2 M NH&I at 23”. Control assays were carried out in the absence of substrate
stage
Premetamorphic XI. Premetamorphic XVII. Metamorphic XVIII.. Metamorphic XIX. Metamorphic XX. Metamorphic XXII.. Metamorphic XXIII..
Ratio of length of hind leg to length of tail
Specific activity*
0.0 1.7 x 10⁻⁴ 0.4 3.9 x 10-b 0.6 3.0 x 10-d 0.7 2.4 X lO+ 0.9 1.0 x 10-s 1.6 1.9 x IO-3 2.6 1.4 X 10-Z
* Specific activity is defined as millimoles of DPN produced per min per mg of protein nitrogen.
that glutamate dehydrogenase activity in the liver increases during thyroxine-induced metamorphosis of tadpoles. Table I shows the specific activity of glutamate dehydrogenase in the particulate fraction of the liver at different stages during spon- taneous metamorphosis of Rana catesbeiana tadpoles. There is approximately a lo-fold increase in glutamate dehydrogenase activity in the late stages of metamorphosis as compared with the premetamorphic stage.
Kinetic Studies-It has been demonstrated that frog (2) and beef (11) liver glutamate dehydrogenases have a qualitatively similar behavior with DPN and DPNH. Nonlinear double reciprocal plots are obtained with both coenzymes and the re- sults are consistent with the interpretation that there are two sites for DPN and DPNH, an active site, and a second site which modifies the rate at the active site. Equation 1, derived by Frieden (II), expresses these results
K‘2 vz + Vl (A)
v= K‘2 K&z
I+ (A) + (0
(1)
K1 and KS represent the Michaelis constants of the coenzymes at the active and modifier sites, respectively; VI represents the velocity when the coenzyme is saturating at the active site; and VZ represents the velocity when the coenzyme is saturating at both sites. With DPN as coenzyme, Vs is greater than VI, which indicates that DPN on the modifier site increases the rate of DPN reduction on the active site. With DPNH as co- enzyme, Vz is equal to 0, which indicates that DPNH on the modifier site inhibits the rate of DPNH oxidation on the active site.
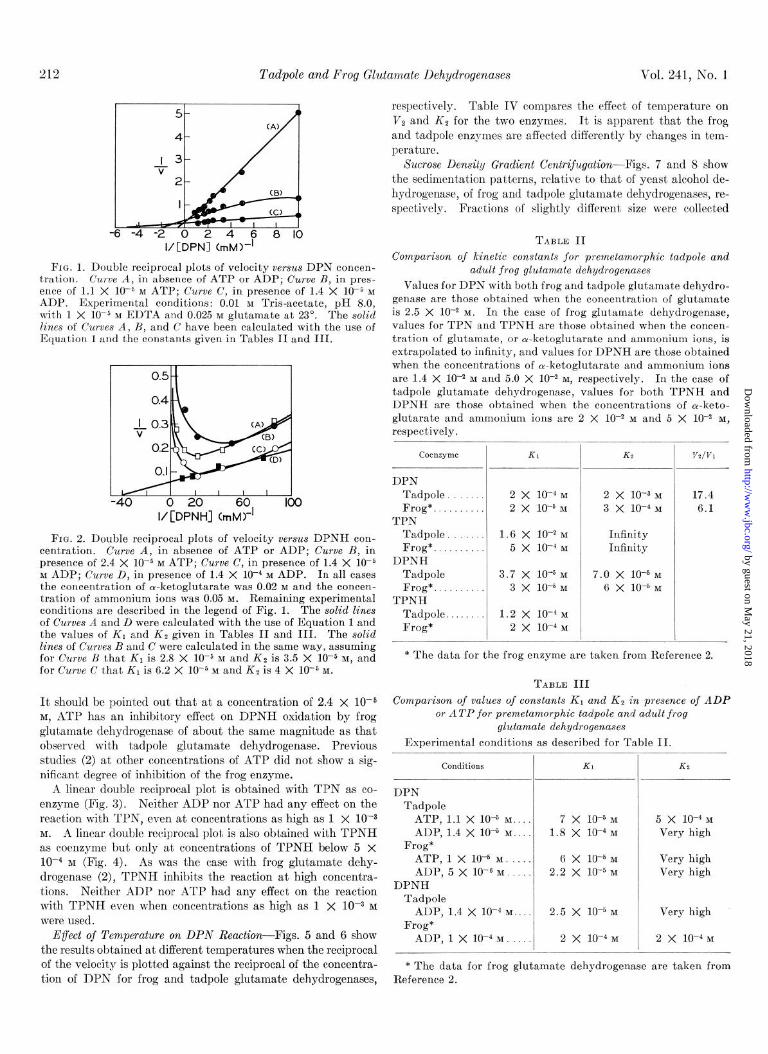
Glutamate dehydrogenase derived from premetamorphic tad- pole liver behaves in a manner similar to the frog and beef en- zymes with DPN and DPNH. Figs. 1 and 2 rrpresent double reciprocal plots obtained with DPN and DPNH alone and in the presence of ADP or ATP. Thr solid lines were calculated with the use of Equation 1 and the values of the constants given in Tables II and III. It is apparent that both ADP and ATP are activators of tadpole glutamate dehydrogenase with DPN, and that ADP is an activator and ATP an inhibitor with DPNH.
by guest on May 21, 2018
http://ww
w.jbc.org/
Dow
nloaded from
212 Tadpole and Frog Glutalnate llehydrogenases Vol. 241, No. 1
-6 -4 -2 0 2 4 6 8 IO I/[DPNI (rnM)-’
Fro. 1. Double reciprocal plots of velocity versus DPN concen- tration. Curve A, in absence of ATP or ADP; Curve B, in pres- ence of 1.1 X 1O-5 M ATP; Curve C, in presence of 1.4 X 10-b M ADP. Experimental conditions: 0.01 M Tris-acetate, pH 8.0, wit,h 1 X 10m5 M EDTA and 0.025 M glutamate at 23”. The solid lines of Curves A, B, and C have been calculated with the use of Equation 1 and the constants given in Tables II and III.
-40 0 20 60. 100 I/[DPNH] (ITIM)-
FIG. 2. Double reciprocal plots of velocity versus DPNH con- centration. Curve A, in absence of ATP or ADP; Curve B, in presence of 2.4 X 10e5 M ATP; Curve C, in presence of 1.4 X lo-& M ADP; Curve D, in presence of 1.4 X 1O-4 M ADP. In all cases the concentration of cu-ketoglutarate was 0.02 M and the concen- tration of ammonium ions was 0.05 M. Remaining experimental conditions are described in the legend of Fig. 1. The solid lines of Curves A and D were calculated with the use of Equation 1 and the values of K1 and KP given in Tables II and III. The solid lines of Curves B and C were calculated in the same way, assuming for Curve H that KI is 2.8 X 10e6 M and Kg is 3.5 X 10-s M, and for Curve C that K1 is 6.2 X low5 M and KB is 4 X 10m5 M.
It should be pointed out that at a concentration of 2.4 x 10F5 M, ,4TP has an inhibitory effect on DPNH oxidation by frog glut’amate dehydrogenase of about the same magnitude as that observed with tadpole glutamate dehydrogenase. Previous studies (2) at other concentrations of ATP did not show a sig- nificant degree of inhibition of the frog enzyme.
A linear double reciprocal plot is obtained with TPN as co- enzyme (Fig. 3). Neither ADP nor ATP had any effect on the reaction with TPN, even at concentrations as high as 1 X 10-a M. A linear double reciprocal plot is also obtained with TPNH as coenzyme but only at concentrations of TPNH below 5 X low4 M (Fig. 4). As was the case with frog glutamate dehy- drogenase (Z), TPNH inhibits the reaction at high concentra- tions. Neither ADP nor ATP had any effect on the reaction with TPNH even when concentrations as high as 1 X 10-S M
were used. Effect of Temperature on DPN Reaction-Figs. 5 and 6 show
the results obtained at different temperatures when the reciprocal of the velocity is plotted against the reciprocal of the concentra- tion of DPN for frog and tadpole glutamate dehydrogenases,
respectively. Table IV compares the effect of temperature on VZ and K$ for the two enzymes. It is apparent that the frog and tadpole enzymes are affected differently by changes in tem- perature.
Sucrose Density Gradient Centrifugation-Figs. 7 and 8 show the sedimentation patterns, relative to that of yeast alcohol de- hydrogenase, of frog and tadpole glutamate dehydrogenases, re- spectively. Fractions of slightly different size were collected
TABLE II Comparison of kinetic constants for premetamorphic tadpole and
adult frog glutamate dehydrogenases
Values for DPN with both frog and tadpole glutamate dehydro- genase are those obtained when the concentration of glutamate is 2.5 X 1OW M. In the case of frog glutamate dehydrogenase, values for TPN and TPNH are those obtained when the concen- tration of glutamate, or a-ketoglutarate and ammonium ions, is extrapolated to infinity, and values for DPNH are those obtained when the concentrations of a-ketoglutarate and ammonium ions are 1.4 X 10M2 M and 5.0 X lo+ M, respectively. In the case of tadpole glutamate dehydrogenase, values for both TPNH and DPNH are those obtained when the concentrations of cu.keto- glutarate and ammonium ions are 2 X 10” M and 5 X 10” M,
respectively.
DPN Tadpole. Frog*.
TPN Tadpole. Frog*.
DPNH Tadpole Frog*.
TPNH Tadpole. Frog*
-
Kl K2 VdVl
2 x 1o-4 M 2 x 10-a M 17.4 2 x lo+ M 3 x lo-4 M 6.1
1.6 X lo+ M
5 x lo- M
Infinity Infinity
3.7 x lo+‘M
3 x lo-” M
7.0 x lo+‘M
6 X lo+ M
1.2 x 10⁻⁴M
2 x 10-d M
* The data for the frog enzyme are taken from Reference 2.
TABLE III Comparison of values of constants KI and Kz in presence of ADP
or ATP for premetamorphic tadpole and adult frog glutamate dehydrogenases
Experimental conditions as described for Table II.
Conditions
DPN Tadpole
ATP, 1.1 X lo+ M
ADP, 1.4 X 1O-b M....
Frog* ATP, 1 X 10” M
ADP, 5 X lo-” M
DPNH Tadpole
ADP, 1.4 X 1O-4 M
Frog* ADP, 1 X 1O-4 M.
Kl
7 x 10-M
1.8 X 1O-4 M
6 X lo-5 M
2.2 x lo-5 M
2.5 X 1’F M
2 x 10⁻⁴ M
K2
5 x lo-4 M
Very high
Very high Very high
Very high
2 x lo-4 M
* The data for frog glutamate dehydrogenase are taken from Reference 2.
by guest on May 21, 2018
http://ww
w.jbc.org/
Dow
nloaded from

Issue of January 10, 1966 B. 0. Wiggert and P. P. Cohen 213
alcohol dehydrogenase (9): values of ~20,~ of 10.6 for the frog and 12.8 for the tadpole enzyme were calculated.
A crude estimation of the molecular weight may also be ob- tained (12)
I/ CTPNI
FIG. 3. Double reciprocal plot of velocity wwus TPN concen- tration. Other experimental conditions are the same as described in the legend of Fig. 1.
where Jfl and Ma represent the molecular weights of the en-
TABLE IV Effect of temperature of reaction rates of frog and tadpole glutamate
dehydrogenases with DPN
/ -10 0 IO 20 30 40 50
I/[TPNH] hM)-’
FIG. 4. Double reciprocal plot of velocity versus TPNH con- centration. The concentrations of a-ketoglutarate and ammo- nium ions were 0.02 M and 0.05 M, respectively. Remaining ex- perimental conditions are as described in the legend of Fig. 1.
-10 DCBA 0 5 I/[DPN] hM)-’
IO 11 CDPNI hi)-l
FIG. 5 (left). Double reciprocal plots of velocity versus DPN concentration for frog glutamate dehydrogenase at different tem- peratures. Curve A, at 30”, Curve B at 5” and lo”, Curve C at 15”, Curve D, at 23”. Experimental conditions: 0.01 M Tris-acetate, pH 8.0, with 1 X 10e5 M EDTA and 0.025 M glutamate.
FIG. 6 (right). Double reciprocal plots of velocity versus DPN concentration for tadpole glutamate dehydrogenase at different temperatures. Curve A, at 5”, Curve B, at lo”, Curve C, at 15”, Curve D, at 23”, and Curve E, at 30”. Experimental conditions are the same as those given in the legend of Fig. 5.
for the two enzymes, hence the difference in the total number of fractions. The ratio, R, may be determined from the sym- metry of the curves (9)
Distance traveled from meniscus by unknown RI= .
Distance traveled from meniscus by standard (2)
In four separate experiments, consistent values for R were obtained of 1.4 with the frog enzyme and 1.7 with the tadpole enzyme. Assuming that the enzymes all have the same partial specific volume (9)
R= s20,W of unknown s20,W of standard
(3)
From this equation and a value of 7.6 for the szO,W of yeast
Vz relative to Vz at 23’* KZ* Temper-
ature Frog Tadpole Frog
I Tadpole
5” 0.91 0.35 4 x 1o-4 M 2 x 1o-3 M
10 0.91 0.65 4 x lo-* M 2 x lo- M
15 0.95 0.92 3.6 X lo+ M 2 x lo- M
23 1.00 1.00 3 x 1o-4 M 2 x 1o-3 M
30 0.87 1.50 5 x 1o-4 M 2 x lo-3 M
* Values of Vs and k’z were obtained from Figs. 5 and 6.
FIG. 7. Sucrose density gradient centrifugation of frog liver glutamate dehydrogenase. Yeast alcohol dehydrogenase (ADH) 0.097 mg, and frog glutamate dehydrogenase (GDH) 0.02 mg, were dissolved in 0.1 ml of 0.1 M Tris-acetate-l X 10e4 M EDTA, pH 8.0, and then layered on a sucrose gradient. After centrifugation at 22” for 3 hours at 37,000 rpm, the gradient was fractionated and analyzed.
31 29 27 25 23 21 I9 I7 FRACTION NUMBER
FIG. 8. Sucrose density gradient centrifugation of tadpole liver glutamate dehydrogenase. Yeast alcohol dehydrogenase (ADH) 0.16 mg, and glutamate dehydrogenase (GDH) 0.23 mg of 40% ammonium sulfate fraction of tadpole liver, were dissolved in 0.1 ml of 0.1 M Tris-acetate-l X low4 M EDTA, pH 8.0. The re- maining experimental conditions are identical with those de- scribed in the legend of Fig. 7.
by guest on May 21, 2018
http://ww
w.jbc.org/
Dow
nloaded from

214 Tadpole and Frog Glutamate Dehydrogenases Vol. 241, n-o. 1
TABLE V
Comparison of rates of oxidation of some L-amino acids by frog and
tadpole glutamate dehydrogenases at pH 8.0 and pH 9.0 relative to th.e r&e of oxidation of L-glutamate at pH 8.0
Experiments were performed in 0.01 M Tris-acetate at pH 9.0, with 1 X 10-a M EDTA, 1 X 10e3 M DPN, and 0.024 M amino acid. Measurements at, pH 9.0 were made in the presence of 0.057, bovine plasma albumin. Control assays were performed in the a,bsence of substrate.
L-Amino acid pH 8.0 pH 9.0
Norvaline a-Amino-n-butyrate Leucine ............ Valine .............. Norleucine ......... Isoleucine .......... Alanille ............ Ornithine .......... Lysine ............. Aspartate .......... Glutamine. .........
Relative rate of DPNH formation*
ITrogt Tadpole Fwt Tadpole
% YO 4 10 12 a; 30 10 44 14 19 14 18 18 19
2 36 2 18 16 25 4 11 5
25 21 26 7 11 8 7 18 5
36 13 34
7% 26 21 37 42 51 42 32 55 24 25 26
* Millimoles of DPNH formed per min with L-amino acid
Millimoles of DPNH formed per min with L-glutamate x 100.
t These data are taken from Reference 13.
TABLE VI
Reactivity of liver glutamate dehydrogenase with glutamine during spontaneous metamorphosis
Experiments were performed in 0.01 51 Tris-acetate, pH 8.0. Remaining experimental conditions are the same as those given in the legend to Table V.
Development stage Relative reactivity with glutsmine’
Premetamorphic. .,, .................... Metamorphic XX. ...................... Metamorphic XXII. .................... Adult frog., ............................
% 13 17 25 36
* Millimoles of DPNH formed per min with glutamine
Millimoles of DPNH formed per min with glutamate x 100
zymes. From this equation a molecular weight of 248,000 was calculated for frog glutamate dehydrogenase and one of 332,000 was calculated for the tadpole enzyme. The value of 248,000 for the frog enzyme agrees with light scattering data from which a molecular weight of 250,Wl was calculated for the monomeric form of the enzyme (I).
Substrate Xpecijkity--It has recently been estabilshcd that frog liter glutamate dehydrogenase will catnlyzr the oxidation of a rather wide range of L-amino acids (13). Table V gives a comparison of the rates of oxidation of some L-amino acids by frog and tadpole glutamate dehydrogenases. Although it, should be borne in mind that this is a comparison between a crystalline (frog glutamate dehydrogenase) and a relatively crude (tadpole glutamate dehydrogenase) enzyme preparation, it may still be
seen that the tadpole enzyme is also capable of oxidizing a wide range of L-amino acids.
Table VI shows that in the case of L-glutamine there is a pro- gressive increase in the relative rate of oxidation during spon- taneous metamorphosis.
Immunological Studies-The y,-globulin fraction from rabbits immunized against crystalline frog liver glutamate dehydrogen- ase precipitated the frog enzyme under the conditions outlined under “Experimental Procedure” with an approximate equiva- lence point of 28 mg of y,-globulin per mg of enzyme. The frog glutamate dehydrogenase antibody also precipitated tad- pole and beef liver glutamate dehydrogenases. The equivalence point for the crystalline beef enzyme was approximately the same as that for the frog enzyme. A partially purified prepara- tion of glutamate dehydrogenase from chicken liver was also precipitated by the frog glutamate dehydrogenase antibody.
It was found possible to test the effect of frog glutamate de- hydrogenase antibody on the enzyme reaction since no precipi- tate, as determined by measuring the AA at 700 rnp, was formed with the small amount of enzyme used in the assay system. (Ratios of antibody to enzyme were of the order of 1.3 mg of y,-globulin per 2 x 1O-4 mg of enzyme.)
Curves B and C (Fig. 9) show the effect of frog glutamate de- hydrogenase antibody. The antibody inhibited the reaction and apparently interfered to some extent with the activation of the reaction by high concentrations of DPN, since the plot ob- tained in the presence of the antibody is more nearly linear than that obtained in its absence. Curves B and D (Fig. 9) also show that the antibody has the same type of effect on tadpole gluta- mate dehydrogenase.
The effect of the antibody on the double reciprocal plot of velocity versus DPNH concentration in the case of frog glutamate dehydrogenase may be seen in Fig. 10, Curves C and D. At the lower DPNH concentrations the frog glutamate dehydrogenase ant’ibody inhibits the reaction, but at high concentrations of DPNH where there is strong inhibition of the reaction by the coenzyme, the rate is actually faster in the presence of the anti- body than in its absence. There is a cont,inuous increase in the
+re-ee- 0 IO
I/[DPN] (mM)-’
FIG. 9. Double reciprocal plots of velocity versus DPN concen- tration of frog and tadpole liver glutamate dehydrogenases in the presence and absence of antibody to frog glutamate dehydrogen- ase. Experiments were performed under the same conditions as those described in Fig. 1. In Curve A (tadpole glutamate dehy- drogenase) and Curve K (frog glutamate dehydrogenase) 0.1 ml of rz-globulin solution containing 1.3 mg of ys-globulin prepared from rabbits immunized against frog glutamate dehydrogennse was added to each of the reaction mixtures just before the addi- tion of the enzyme. In Curve C (frog glutamate dehydrogenase) and Czcrve D (tadpole glutamate dehydrogenase), 0.1 ml of 0.15 M NaCl solution Ras added in place of rz-globulin solution.
by guest on May 21, 2018
http://ww
w.jbc.org/
Dow
nloaded from

Issue of January 10, 1966 B. 0. Wiggert and P. P. Cohen 215
I,.’ CDPNHI (m~)-l
FIG. 10. Double reciprocal plots of velocity versus DPNH con- centration of frog and tadpole liver glutamate dehydrogenases in the nresence and absence of antibody to frog glutamate dehy- drogenase. Experiments were performed under the same condi- t>ions as those described in Fia. 2. In Curve n (tadpole glutamate dehydrogenase) 0.05 ml of qr-globulin solution and in Curve C (frog glutamate dehydrogenase) 0.10 ml of yz-globulin solution prepared from rabbits immunized a.ga.inst frog glutamate dehy- dronenase was added to the reaction mixture just before the addi- tionof enzyme. In Cuurve B (tadpole glutamate dehydrogenase) 0.05 ml of 0.15 M NaCl solution and in Curve D (frog glutamate dehydrogenase) 0.10 ml of 0.10 M NaCl solution was ad;d& in place of yz-globulin solution.
reaction rate with increasing DPNH concentration in the pres- ence of frog glutamate dehydrogenase antibody. Curves ,4 and B of Fig. 10 also show that the antibody has a somewhat similar effect on the tadpole enzyme, but there is not a continuous in- crease in the reaction rate with increasing DPNH concentration. Frog glutamate dehydrogenase antibody was also found to in- hibit the frog glutamate dehydrogenase reaction when TPN or TPNH were the coenzymes instead of DPN or DPNH.
Control experiments were performed in which y,-globulin from rabbits immunized against normal human plasma was sub- stituted for the anti-frog glutamate dehydrogenase y,-globulin. The results obtained were the same as those in experiments where a suitable aliquot of 0.15 M NaCl was used instead of yZ- globulin.
The frog glutamate dehydrogenase antibody had qualita- tively the same effect on the DPN and DPNH reactions cata- lyzed by beef and chicken liver glutamate dehydrogenases as those observed with frog and tadpole glutamate dehydrogenases.
UISCUSSION
The approximately IO-fold increase in the specific activity of liver glutamate dehydrogenase during the spontaneous meta- morphosis of the ammonotelic tadpole (Table I) is consistent with its important role in the ureotelic adult frog.
In addition to the increase in specific activity of the enzyme, there is approximately an order of magnitude decrease in the values of K1 and KP for DPN, and a 32-fold decrease in the value of K1 for TPN, whereas the values of Kl and Ka for DPNH and TPNH remain about the same (Table II). Thus, it would ap- pear that the relatively low glutamate dehydrogenase activity in premetamorphic tadpole liver is directed mainly t’oward the synthesis of glutamate from ammonia and cu-ketoglutarate. In this regard, it is of interest that the ammonia level in premeta-
morphic tadpole liver is about 2.6 times greater than that of frog liver.’
ADP and ATP have qualitatively the same effects on tadpole glutamate dehydrogenase as on the frog liver enzyme (Figs. 1 and 2) so that the regulation of glutamate drhydrogenase ac- tivity by means of these nucleotides is probably similar in the two cases. Table III shows that there are significant quantita- tive differences in the values of K1 and Kz for frog and tadpole glutamate dehydrogenases in the presence of ADP and ATP.
The different effects of temperature on the initial rates of re- action of tadpole glutamate dehydrogenase compared with the frog enzyme are of interest particularly in view of the fact that lowering the environmental water temperature to 5” or below profoundly reduces the rate of tadpole metamorphosis (14). Table IV shows that in the case of frog glutamate dehydrogenase, lowering the reaction temperature below 23“ has only a small effect on the values of Kz and VZ and that raising the tempcra- ture to 30” causes a decrease in the values of Kz and Vz. In contrast, in the case of tadpole glutamate dehydrogenase, the value of KB apparently does not change with temperature, but the value of Vz is much lower at 5” than at 23”, and it is greater at 30” than at 23”.
In addition to the differences noted above, tadpole glutamate dehydrogenase has a higher molecular weight than the frog en- zyme (Figs. 7 and 8), at least under the conditions used in the sucrose density centrifugation experiments. The significance of this will have to await final purification of the tadpole liver en- zyme.
Table V shows that in some cases there is a striking difference in the relative rate of oxidation of certain L-amino acids by frog and tadpole glutamate dehydrogenases. In general, the tadpole enzyme shows a greater increase in oxidation rate when the pH is raised from 8.0 to 9.0 than does the frog enzyme. The rate of oxidation of glutamine increases as spontaneous mctamor- phosis progresses (Table VI). In this regard, it is of interest that the level of glutamine in frog liver is about 3.5 times higher than that in premetamorphic tadpole 1iver.l
It was thought, in view of the differences observed between frog and tadpole glutamate dchydrogenases, that it might be possible to distinguish immunologically between the enzymes. It was found, however, that the antibody produced in rabbits against crystalline frog liver glutamate dehydrogenase behaved similarly not only with the frog and tadpole enzymes, but also with glutamate dehydrogenases derived from beef liver and from chicken liver. Despite its lack of specificity for frog gluta- mate dehydrogenase, this antibody is of interest in view of its interference with DPN activation on the one hand (Fig. 9) and DPNH inhibition on the other (Fig. 10).
Talal and Tomkins (15) reported that rabbit antiserum pre- pared against bovine glutamate dehydrogenase showed partial cross-reactions with liver glutamate dehydrogenasc preparations from different vertebrates but no cross-reactions with glutamate dehydrogenase preparations from microorganisms.
REFERENCES
1. FAHIEN, L. A., WIGGERT, B. O., AND COHEN, P. P., J. Biol. Chem., 240, 1083 (1965).
2. FAHIEN, L. A., WIGGERT, B. O., AND COHKN, 1’. I’., J. Biol. Chem., 240, 1091 (1965).
3. DEGROOT, N., AND COHEN, P. P., Biochim. et Biophys. Acta, 59, 588 (1962).
1 H. Nakagawa and P. P. Cohen, unpublished studies.
by guest on May 21, 2018
http://ww
w.jbc.org/
Dow
nloaded from

216 Tadpole and Frog Glutamate Dehydrogenases Vol. 241, No. 1
4. FRIEDEN, C., J. Biol. Chem., 240, 2028 (1965). 10. DEUTSCH, H. F., in A. C. CORCORAN (Editor), Methods in medi- 5. FAHIEN, L. A., AND COHEN, P. P., J. Biol. Chem., 239, 1925 cal research, Vol. 6, Year Book Publishers, Inc., Chicago,
(1964). 1952, p. 284. 6. WARBURG, O., AND CHRISTIAN, W., Biochem. Z., 310,384 (1941). 11. FRIEDEN, C., J. Biol. Chem., 234, 815 (1959). 7. MINARI, O., AND ZILVERSMIT, D. B., Anal. Biochem., 6, 320 12. SCHACHMAN, H. K., Ultracentrifugation in biochemistry, Aca-
(1963). demic Press, Inc., New York, 1959. 8. TAYLOR, A. C., AND KOLLROS, J. J., Anat. Record., 94,7 (1946). 13. WIGGERT, B. O., AND COHEN, P. P., J. Biol. Chem., in press. 9. MARTIN, R. G., AND AMES, B. N., J. Biol. Chem., 236, 1372 14. HUXLEY, J. S., Nature, 123, 712 (1929).
(1961). 15. TALAL, N., AND TOMHINS, G. M., Science, 146, 1309 (1964).
by guest on May 21, 2018
http://ww
w.jbc.org/
Dow
nloaded from

Barbara O. Wiggert and Philip P. CohenComparative Study of Tadpole and Frog Glutamate Dehydrogenases
1966, 241:210-216.J. Biol. Chem.
http://www.jbc.org/content/241/1/210Access the most updated version of this article at
Alerts:
When a correction for this article is posted•
When this article is cited•
to choose from all of JBC's e-mail alertsClick here
http://www.jbc.org/content/241/1/210.full.html#ref-list-1
This article cites 0 references, 0 of which can be accessed free at
by guest on May 21, 2018
http://ww
w.jbc.org/
Dow
nloaded from