issues in integration of supply chain - isahp sessions/developme… · integration is an important...
TRANSCRIPT

MODELLING THE BARRIERS OF INTEGRATION IN AN AGILE
SUPPLY CHAIN
Ashish Agarwal School of Engineering and Technology, Indira Gandhi National Open University New Delhi 110 068 (India) Ravi Shankar1 Department of Management Studies Indian Institute of Technology Delhi, Vishkarma Bhawan, Shaheed Jeet Singh Marg New Delhi 110 016 (India)
WORD COUNT: 8927 words in Full Text and 151 words in abstract
1 Corresponding Author: Dr. R. Shankar, Department of Management Studies, Indian Institute of Technology Delhi, Vishkarma Bhawan, Shaheed Jeet Singh Marg, New Delhi 110 016 (India) Email: [email protected]; [email protected] Phone: 91-11-26596421, 26564371 (R) Fax: 91-11-26862620 (O).
1

MODELLING THE BARRIERS OF INTEGRATION IN AN AGILE
SUPPLY CHAIN
ABSTRACT
Integration is an important desirable characteristic of agile supply chain. The difficulty in
achieving a total integration is due to dynamic and conflicting objectives employed by
different supply chain partners. There are some barriers in this process. These barriers
have influences on one another and also adversely affect the supply chain integration.
The aim of this paper is to understand the mutual influences so that those barriers which
are at the root of few more barriers (called driving barriers) and those which are most
influenced by others (called dependent barriers) are identified. Interpretive structural
modeling (ISM) methodology has been used to evolve such relationships. It is observed
that there are some barriers, which have both high driving power and dependency and
therefore need more attention. The study concludes with a discussion on these barriers
and the managerial implications.
Key words: Integration, supply chain agility, Barriers, Interpretive structural
modeling (ISM)
2

INTRODUCTION
The success of agile supply chain lies in the willingness of partner firms to share
information for their mutual benefits. Still, many firms are reluctant to share information
with their trading partners (Lee and Whang, 2000; Power et al., 2001). This reluctance
acts as barrier in integration of agile supply chain. Cooper et al., (1997) have suggested
that top management support, leadership, and commitment to change and innovation are
important antecedents to the integration of a supply chain. Handfield and Nichols (1999)
have discussed the integration risk in selecting a supply chain partner who is in poor
financial condition. By integrating supply chain, the original equipment manufacturers
can sharply reduce production lead-times, add flexibility in order modification, and speed
the supply chain (Mason et al., 2002). Time-based competition refers to the ability to
deliver products or services faster than other competitors. Management of time,
specifically lead-time, can be a competitive advantage. Naylor et al., (1999) have shown
the necessity for lead-time reduction and service level improvement as prerequisites to
agility. Collaboration improves trust among trading partners, which motivates them to
share business information and to work on the same data (Agarwal and Shankar 2003).
Trust among trading partners in inter organizational relationships improves
communication and dialogue and create common strategic visions (Sahay, 2003).
Reasons for the slow growth of integrated supply chain management include the
lack of guidelines for creating alliances with supply chain partners, failure to develop
measures for monitoring alliances, Inability to broaden the supply chain vision beyond
procurement or product distribution to encompass larger business processes, inability to
integrate the company's internal procedures, lack of trust inside and outside a company,
3

organizational resistance to the concept, lack of buy-in by top managers, lack of
integrated information systems and electronic commerce linking firms (Lummus and
Vokurka, 1999). A framework for supply chain integration is depicted in figure 1.
< Insert Figure 1>
IDENTIFICATION OF BARRIERS IN INTEGRATION OF AGILE SUPPLY
CHAIN
Growing evidence indicates that a higher level of integration with suppliers and
customers is expected to gain the greater potential benefit (Shankar and Agarwal 2004,
van Hoek et al., 2001; Goldman 1995; Stevens 1989). The eleven barriers considered in
this study have been identified after consulting related literature and industry experts in
the field of supply chain management. These are:
1. Lack of Top Management Commitment
Top management of the partner organizations in a supply chain play an important role in
developing policies, which may lead to healthy and collaborative relationship between
the buyers and suppliers (Akkermanns et al., 1999; LaLonde, 2000). The commitment of
the top management in SCM practices (such as improved buyer-supplier relationships,
information sharing etc) is a key component for the successful adoption of SCM (Moberg
et al., 2002).
2. Missing long term buyer supplier relationship (MSBSR) Effective supply chain integration and synchronization among partners can eliminate
excess inventory, reduce lead times, increase sales, and improve customer service
(Agarwal and Shankar 2002; Anderson and Lee 1999; Bal et al., 1999). Companies are
now moving towards collaborative SCM in an effort to reduce the information
imbalances that result in the dreaded “bullwhip effect” (Lee et al., 1997: Ellram, 1990
4

and 1991), while increasing their responsiveness to market demands and customer service
(Mentzer et al., 2000).
The result of collaborative SCM is not only the reduction of waste in the supply chain,
but increased responsiveness, customer satisfaction, and competitiveness among all
members of the partnership. Thus, collaborative SCM systems allow organizations to
progress beyond mere operational-level information exchange and optimization and can
transform a business and its partners into more competitive organizations (Christopher
and Jittner 2000).
3. Forecasting Problems
Forecasting is the art and science of making projections about what future demands and
conditions will be. Obtaining forecasting information frequently means using
sophisticated techniques to estimate future sales or market conditions. The forecast of
demand forms the basis for all strategic and planning decisions in a supply chain. When
each stage of the supply chain makes its own separate forecasts, these forecasts are often
very different. The result is a mismatch between supply and demand. In an integrated
supply chain, all stages of a supply chain produce a collaborative forecast, it tends to be
much more accurate (Chopra and Meindl, 2004).
4. Lack of Information Sharing (LIS)
The use of information technology to share data between buyers and suppliers is, in
effect, creating a virtual supply chain. Virtual supply chains are information based rather
than inventory based. Conventional logistics systems are based upon a paradigm that
seeks to identify the optimal quantities of inventory ands where it should be located.
Complex formulae and algorithms exist to support this inventory-based business model.
5

Paradoxically, what we are now learning is that once we have visibility of demand
through shared information, the premise upon which these formulae are based no longer
holds. Electronic Data Interchange (EDI) and the Internet have enabled partners in the
supply chain to act upon the same data (i.e. actual sales figures) rather than to rely on the
distorted and noisy picture that emerges in an extended supply chain (Jharkharia and
Shankar 2003; Lee et al. 2000).
5. Lack of Trust (LOT) Trust is defined as the binding force in most buyer-supplier transaction (Agarwal and
Shankar 2003). It is especially critical when two situational forces are present in a
transaction: uncertainty; and asymmetric product information. Many researchers have
proposed that trust is essential for understanding interpersonal behavior and economic
exchanges. Trust is perceived as a state of readiness for unguarded interaction with
someone or something (Ba 2001).
Handfield and Bechtel (2002) have stated that the primary relational requirement for
improved responsiveness is the development of greater levels of trust between purchasing
organizations and their suppliers. The nature of trust and the nature of business
transaction often temper the relationships. Trust among trading partners in inter
organizational relationships improves communication and dialogue and create common
strategic visions (Heide and John 1990).
6. Lack of Flexibility
With the emergence of a global economy that embraces ‘change’ as one of its
major characteristics, success and survival of business are becoming more and more
difficult. The emphasis is on adaptability to changes in a highly competitive business
environment and on proactively addressing market and customer needs. Changes in the
6

business environment due to varying needs of the customers lead to uncertainty in the
decision parameters. Flexibility is needed in the supply chain to counter uncertainty in the
decision-making. A supply chain can adapt to the changes if it is flexible and agile in
nature.
7. Resistance to Change and Innovation (RCI)
Resistance has been classically understood as a foundation cause of conflict that is
undesirable and detrimental to the health of any enterprise (Waddell and Sohal 1998).
Resistance to change has long been recognized as a critically important factor that can
influence the success or otherwise of an organizational change effort.
Similarly, resistance, among trading partners of supply chain, is an expression of
reservation, which normally arises as a response or reaction to change. Management of
SC normally witnesses this expression, as any trading partner’s actions are perceived as
attempting to stop, delay, or alter change (Handfield and Bechtel 2002). Thus resistance
is most commonly linked with negative trading partner attitudes or with counter-
responsive behaviours. Resistance to change can be handled when there is trust
development among trading partners and they are involved in the strategic planning.
8. Poor Infrastructural Facility
Infrastructure to deploy an integrated supply chain presents a set of challenges.
Infrastructure includes transportation facility available in the country of trading partners
of the supply chain. Legal constraints exist sometimes prevent integration of the supply
chain system. Shipments may be held in customs for interminable periods for any number
of reasons. Telecommunication systems are often unreliable. Workers of trading partners
7

in the supply chain may be not familiar with the latest technology and may destroy
equipment due to lack of training (Handfield R.B. and Nichols Jr. E.L, 1999).
9. Disparity in Trading Partners’ Capability
Getting the products to customers when, where, , how, and in the quantity that they want,
in a cost effective manner, presents a new challenge to supply chain integration. To meet
this challenge, organizations are focusing on their supply base and sourcing strategy.
Disparity in trading partners’ capability is a major barrier in integration of agile supply
chain because partnership fails due to poor capability at partner’s end (Yusuf et al., 1999
and 2004, Power et al., 2001). This poor capability implies poor inventory management,
poor logistics system, weak financial position, etc.
10. Non-availability of Cross Functional Work Force
Cross-functional work forces are distinguished from other working groups by their
commitment to a common purpose and goals. They are recognized by their ongoing
mutual accountability to achieve common goals. These cross functional groups are often
organized around a product or service, and may be responsible for all aspects of that
products or service from design and development to customer support.
11. Fund Non-availability
Funds availability helps finance, which provides costs forecasts related to inflation rates
and growth assumptions that need to be built into the planning process to project future
costs (Lockamy III and Smith, 2000),. Finance /accounting provide the cost data required
to perform the cost trade-off analysis. It is also responsible for capital budgeting, which
determines the availability of capital budgeting, which determines the availability of
8

capital to finance expenditures to improve logistics equipment and infrastructure
(Gunasekaran et al., 2001 and 2003). Capital budgets are used to control capital
expenditures, such as long-term investments in property, facilities, and equipment. In
logistics, this would include purchase of new trucks, computer equipment, material
handling and warehouse equipment, the building of new distribution centres, and similar
long-term investment.
QUESTIONNAIRE DEVELOPMENT
To address the issues related to integration of supply chains in Indian industry, a
questionnaire-based survey was undertaken. The questionnaire was designed keeping in
view the available literature and the previous surveys. The practicing managers and
academicians in the area of SCM were also consulted during the development of the
questionnaire.
As the response rates of such surveys are not enthusiastic and the respondents are
generally reluctant to spare time in responding to these questionnaires, the questionnaire
was designed as close-ended, so that lesser time and efforts are needed in filling the
questionnaire. The questions were framed on a five-point Likert-scale. However, some of
the questions contained an option of yes/no type. In order to perform the statistical
analysis, individual responses were coded 1 through 5 accordingly. The questionnaire was
divided into three sections. Section I dealt with the company’s profile, while Section II
dealt with issues related to agility, flexibility, responsiveness, customer relation, supplier
relation, and integration of supply chains, and Section III dealt with the performance
measurement related issues in SCM.
9

The questionnaire was tested for two main types of validity, which are content
validity, and construct validity. Content validity represents the adequacy with which a
specified domain of content is sampled (Nunally, 1978) and that the instrument item has
items that cover all aspects of the variables being measured. Content validity cannot be
determined numerically. Its determination is subjective and judgmental. It primarily
depends on an appeal to the propriety of content and the way it is presented (Nunally,
1978). The instrument developed in this study demonstrates the content validity as the
selection of measurement items was based on both, an exhaustive review of the literature
and evaluation by academicians and practicing managers during its pre-testing. The
content validity was further tested during pilot survey as per the guidelines provide by
Forza (2002). After a careful review of respondents’ answers to the questionnaire during
pilot survey, some questions were modified to convey their intended meaning, and few
questions were deleted from the questionnaire as per the suggestions received from the
respondents. The construct validity was conducted through an exploratory factor analysis.
Factor analysis was conducted to test the uni-dimensionality of the multi-items perceptual
measures. As per the suggestion of Kim and Muller (1978) only those items, which had a
factor loading of more than 0.40 were used in the questionnaire.
QUESTIONNAIRE ADMINISTRATION
Target Industries for Questionnaire Administration
Three sectors from the Indian industry were selected for the administration of the
questionnaire. These are:
(i) auto,
10

(ii) electrical and electronics goods, and
(iii) fast moving consumer goods (FMCG).
Improvement in Survey Instruments
Before sending the questionnaire to the companies, a pilot study was carried out in
few industries. The idea behind carrying out the pilot study was to:
(i) have a fruitful feedback from the executives working in the area of supply
chain management,
(ii) add missing questions,
(iii) delete any irrelevant question, and
(iv) refine/rephrase the language of the existing questions to bring in more clarity in
the questionnaire.
A total of fifteen executives in the area of supply chain management were personally
contacted. Accordingly the questionnaire was modified and a final questionnaire was
evolved. It was then mailed to different companies.
Questionnaire Administration
A total of 760 questionnaires were mailed to different companies of the selected
sectors throughout the country. These companies were carefully selected from the
directory of public sector, private sector, and government companies which also include
OEMs and suppliers in auto, fast moving consumer goods, and electrical and electronics
goods business.
11

SURVEY RESPONSES AND RESPONDENTS PROFILE
Out of the 760 questionnaires, mailed to the Chief Executives/ Managing Directors,
317 responses were received. Out of this 35 responses were found incomplete and 103
responses were received with regret in filling up the questionnaire. Therefore, only 179
questionnaires were found usable. This gives an effective response rate of 23.55% (Table
1).
This survey is designed with two main objectives, which are (i) to examine the
current practices and the issues related to agility and integration of Indian supply chains,
and (ii) to test the validity of some hypotheses, which have been formulated in the earlier
section of this paper. This is followed by the description of the methodology, adopted to
achieve the survey-oriented research objectives. Subsequent to this, observations from the
survey have been reported and discussed. Various other aspects of the survey such as
questionnaire development, its administration, validity, descriptive statistics, and summary
have been also discussed in this paper.
<Table 1>
Non-response Bias
A test of non-response bias is to compare the answers of the early and late
respondents (Lambert and Harrington, 1990). The logic behind this is that the late
respondents are more likely to answer the questionnaire like non-respondents than the
early respondents (Armstrong and Overton, 1977). Therefore, non-response bias was
assessed by comparing the responses, which were received late after sending two or more
12

reminders (total 60 respondents in this case) with the early respondents, which were
received either without a reminder or with a single reminder (119 in present case). The
results from the t-test on some key variables of this study suggest that the early
respondents do not significantly differ from the late responses. Therefore, non-response
bias in this study is ruled out.
Reliability of the Questionnaire Survey
For question gauging the impact of barriers on supply chain integration, Cronbach’s
coefficient (Alpha, α) was calculated to test the reliability and internal consistency of the
response (George and Mallery, 1999). Alpha, with a value of 0.88, is considered adequate
for such exploratory work (Nunally, 1978). The value of α for all the questions except
question 10 (d) and question 22 has been found to be more than 0.5. It implies that there is
a high degree of internal consistency in the responses to the questionnaire.
OBSERVATIONS FROM THE SURVEY
Issues covered in questionnaire include issues related to agility and integration of supply
chains. Questionnaire also covers issues related to market sensitiveness, centralized and
collaborative planning, information sharing, flexibility, responsiveness, customer
relationship, strategic partnership, supply chain performance measures, etc.
Figures 2 to 5 show the characteristics of the surveyed companies. From Figures 2 and 3,
it is clear that almost half of the surveyed companies have more than ten suppliers and
annual turnover of more than 100 crores.
<Figure 2>
<Figure 3>
The major portion of the respondents is from the automobile sector (47%), followed by
electrical and electronics goods (28%), and fast moving consumer goods (25%) (Figure 4).
13

<Figure 4>
Figure 5 shows the trend in profit/loss as reported by the companies. For 21.2% of
the companies, profit remained nearly the same as in the previous years, while for 25.1%
of the companies, the profit was up to 10%. Of the respondents, it was found that 34.6%
companies had profits more than 10%, and 12.8% companies had profit less than 10%.
6.1% of the respondents were unable to say anything regarding their profit trends.
<Figure 5>
Figure 6 shows that 90% of respondent companies believe that well integrated supply
chain improves market share of the business in which supply chain is involved.
<Figure 6>
From Figure 7, it has been observed that lack of top management commitment
(Mean = 4.56, Std Dev.= 0.704) is considered as the top most barrier in strengthening
integration of supply chain, followed by missing long-term buyer-supplier relationship
(Mean = 4.27, Std Dev.= 0.709), forecasting uncertainties (Mean = 4.26, Std Dev.=
0.886), lack of information sharing among partners (Mean = 4.21, Std Dev.= 0.916), lack
of trust in supply chain linkages (Mean = 4.12, Std Dev.= 0.915), lack of flexibility (Mean
= 4.06, Std Dev.= 1.06), resistance to change and adopt innovations (Mean = 3.98, Std
Dev.= 0.997), poor infra structural facilities (Mean = 3.94, Std Dev.= 1.03), disparity in
trading partners' capability (Mean = 3.86, Std Dev.= 1.03), non-availability of cross
functional workforce (Mean = 3.85, Std Dev.= 1.01), and fund unavailability (Mean =
3.81, Std Dev.= 1.18).
<Figure 7>
From the survey, one gets information about the relative impact of barriers on supply
chain integration, but one does not get information about the impact of one barrier on
14

other. Similarly survey result does not reveal about the driving and dependence power of
barriers. These barriers not only affect the process of integration but also influence one
another. It is, therefore, important to understand their mutual relationship so that those
barriers that are at the root of some more barriers (called driving barriers) and those
which are most influenced by others (called driven barriers) are identified. After this, it is
prudent for the management to accord appropriate attention to tackle these barriers.
ISM METHODOLOGY AND MODEL DEVELOPMENT
ISM is an interactive learning process whereby a set of different directly and
indirectly related elements are structured into a comprehensive systemic model. The
model so formed portrays the structure of a complex issue, a system of a field of study, in
a carefully designed pattern employing graphics as well as words. ISM methodology
helps to impose order and direction on the complexity of relationships among elements of
a system (Sage, 1977; Saxena et al., 1990; Mandal and Deshmukh, 1994; Sharma et al.,
1995; Singh et al., 2003). For complex problems, like the one under consideration, a
number of barriers may be affecting the IT-enablement of supply chains. However, the
direct and indirect relationships between the barriers describe the situation far more
accurately than the individual factor taken into isolation. Therefore, ISM develops
insights into collective understandings of these relationships.
The ISM is interpretive as the judgment of the group decides whether and how the
variables are related. It is structural as on the basis of relationship an overall structure is
extracted from the complex set of variables. It is a modeling technique as the specific
relationships and overall structure are portrayed in a graphical model. It is primarily
15

intended as a group learning process but can also be used individually. The various steps
involved in the ISM technique are:
(i) identification of elements, which are relevant to the problem or issues, this
could be done by survey or any group problem solving technique,
(ii) establishing a contextual relationship between elements with respect to which
pairs of elements will be examined,
(iii) developing a structural self-interaction matrix (SSIM) of elements, which
indicates pair-wise relationship between elements of the system,
(iv) developing a reachability matrix from the SSIM, and checking the matrix for
transitivity. Transitivity of the contextual relation is a basic assumption in
ISM which states that if element A is related to B and B is related to C, then A
is necessarily related to C,
(v) partitioning of reachability matrix into different levels,
(vi) based on the relationships given above in the reachability matrix draw a
directed graph (DIGRAPH), and remove transitive links,
(vii) convert the resultant digraph into an ISM, by replacing element nodes with
statements,
(viii) review the ISM model to check for conceptual inconsistency, and make the
necessary modifications.
The various steps (Figure 8), which lead to the development of ISM model, are
now illustrated as under.
<Figure 8>
16

Structural self-interaction matrix (SSIM)
In the present model, to identify relationship among supply chain integration
barriers, brainstorming sessions were conducted with experts having experience in the
area of materials and supply chain management.
Initial meeting was with the management of manufacturing organization. After
identifying the five experts, literature related to supply chain management had been
circulated among the experts. Within a period of fifteen days a brain storming session
was organized to identify the variables. In all, twenty variables had been identified in this
session. The number was reduced to eleven as some variables were of same nature. The
literature related to these eleven variables had been circulated among the experts. After
ten days, a session was organized to establish the relationship among the variables. Since
the relationships among all variables could not be identified in this session, another
meeting was conducted to complete this task. In this meeting experts were also asked
how these variables could be benchmarked. After four days, the list of variables and
diagram were circulated among the experts for any further modification. According to
experts’ opinion, the diagram was reconstructed. Though ISM methodology suggests the
use of expert opinions alone (based on management techniques such as brain storming,
nominal group technique etc) in developing the contextual relationship, the correlation
coefficients as obtained from the questionnaire survey have also been used to facilitate
the experts in identifying the nature of these relationships. For analyzing the barriers in
17

developing SSIM, the following four symbols have been used to denote the direction of
relationship between barriers (i and j):
V- Barrier i will help achieve barrier j;
A- Barrier j will be achieved by barrier i;
X- Barriers i and j will help achieve each other; and
O- Barriers i and j are unrelated.
The following statements explain the use of symbols V, A, X and O in SSIM.
(i) Barriers 1 and 11 are both related to each other (X)
(ii) Barrier 1 helps achieve barrier 10 (V)
(iii) Barrier 2 will be achieved by barrier 7 (A)
Based on contextual relationships the SSIM is developed (Table III)
<Take in Table II>
Reachability Matrix
The SSIM has been converted into a binary matrix, called the initial reachability matrix
by substituting V, A, X and O by 1 and 0 as per the case. The substitution of 1s and 0s are
as per the following rules:
(i) if the (i, j) entry in the SSIM is V, the (i, j) entry in the reachability
matrix becomes 1 and the (j, i) entry becomes 0,
(ii) if the (i, j) entry in the SSIM is A, the (i, j) entry in the reachability
matrix becomes 0 and the (j, i) entry becomes 1,
(iii) if the (i, j) entry in the SSIM is X, the (i, j) entry in the reachability
matrix becomes 1 and the (j, i) entry also becomes 1,
18

(iv) if the (i, j) entry in the SSIM is 0, the (i, j) entry in the reachability
matrix becomes 0 and the (j, i) entry also becomes 0.
Following these rules, the initial reachability matrix for the barriers is shown in Table III.
<Take in Table III>
After incorporating the transitivities as described in step (iv) of the ISM
methodology, the final reachability matrix is shown in Table IV. In the Table IV the
driving power and dependence of each barrier are also shown. Driving power for each
barrier is the total number of barriers (including itself), which it may help achieve. On the
other hand dependence is the total number of barriers (including itself), which may help
achieving it. These driving power and dependencies will be later used in the classification
of barriers into the four groups of autonomous, dependent, linkage and independent
(driver) barriers.
<Take in Table IV>
Level partitions
From the final reachability matrix, the reachability and antecedent set (Warfield, 1974)
for each barrier are found. The reachability set consists of the element itself and other
elements, which it may help achieve, whereas the antecedent set consists of the element
itself and the other elements, which may help achieving it. Then the intersection of these
sets is derived for all elements. The element for which the reachability and intersection
sets are same is the top-level element in the ISM hierarchy. The top-level element of the
hierarchy would not help achieve any other element above their own level. Once the top-
level element is identified, it is separated out from the other elements. Then, the same
process finds the next level of element. This process continues till the levels of each
19

element are found. These identified levels help in building the digraph and final model. In
the present case the barriers along with their reachability set, antecedent set, intersection
set and the levels are shown in Tables V to XII. The process is completed in seven
iterations (Table V to XI) as follows.
In table V, the barrier 3 (Forecasting Problems) and barrier 6 (Lack of Flexibility)
are found at the level I. Thus, it will be positioned at the top of the ISM model.
<Take in Table V>
In table VI, the barrier 4 (Lack of information sharing) and barrier 10 (Non
availability of cross functional work forces) are found at the level II.
<Take in Table VI>
In table VII, the barrier 8 (Poor Infrastructure) is found at the level III.
<Take in Table VII>
In table VIII, the barrier 11 (Fund non-availability) is found at the level IV.
<Take in Table VIII>
In table IX, the barrier 5 (Lack of trust) and barrier 9 (Disparity among trading
partners’ capability) are put at level V.
<Take in Table IX>
<Take in Table X>
Levels of eleven barriers are indicated in table XI.
<Take in Table XI>
A conical matrix is developed by clustering elements at the same level, across rows and
columns of the final reachability matrix, as shown in Table XII.
<Take in Table XII>
20

Driving Power and Dependence Power of barriers on the basis of one entry have been
calculated and shown in Table XIII.
<Take in Table XIII>
Classification of barriers
Based on the driver power and dependence, different barriers have been classified into
four clusters namely autonomous, dependent, linkage, and independent (Mandal and
Deshmukh, 1994). The driver power and dependence of each of the barrier are shown in
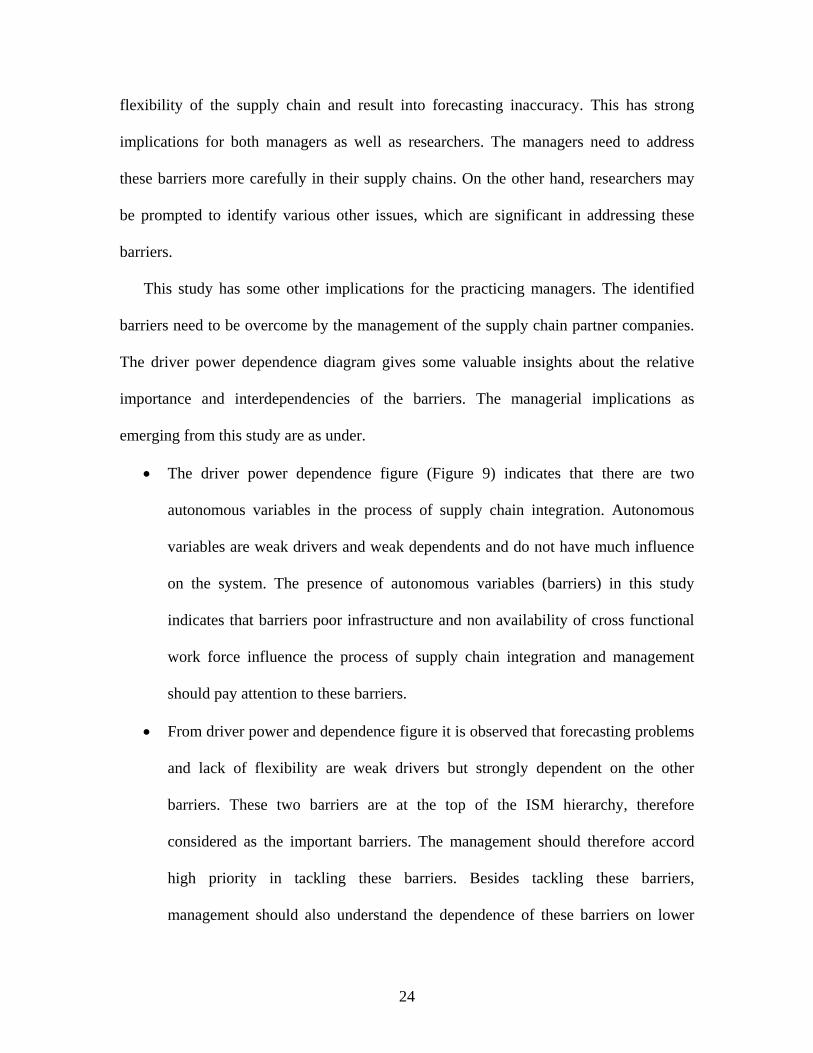
table V. Thereafter, the driver power-dependence diagram is shown in figure 9. To
illustrate this figure, it is observed from table V that the barrier one is having a driver
power of eight and dependence of one, therefore in figure 9 it is positioned at a place
which corresponds to driver power of eight and dependency of one. The objective behind
the classification of the barriers is to analyze the driver power and dependency of the
barriers.
<Take in Figure 9>
The first cluster includes ‘autonomous barriers’ that have weak driver power and
weak dependence. These barriers are relatively disconnected from the system. The
second cluster consists of the dependent variables that have weak driver power but strong
dependence. Third cluster has the linkage variables that have strong driver power and
dependence. Any action on these variables will have an effect on the others and also a
feedback effect on themselves. Fourth cluster includes independent variables with strong
driver power and weak dependence.
21

Formation of ISM-based model
From the final reachability matrix (Table V), the structural model is generated by means
of vertices or nodes and lines of edges. If there is a relationship between the barriers i and
j, this is shown by an arrow which points from i to j. This graph is called a directed graph
or digraph. After removing the transitivities as described in ISM methodology, the
digraph is finally converted into ISM as shown in Figure 10.
<Take in Figure 10>
DISCUSSION AND CONCLUSION
One of the major objectives of this study was to identify the barriers that
significantly affect the integration of a supply chain so that management may effectively
deal with these barriers. The results of the survey indicated that lack of top management
commitment, missing long term buyer-supplier relationship, and resistance to change and
innovation are among the first level barriers. Disparity in trading partners’ capabilities,
lack of trust, and fund non-availability are the second level barriers which are present due
to first level of barriers. These barriers result in to lack of information sharing, poor
infrastructure and non-availability of cross functional work forces as reflected in the
model. Lack of flexibility and forecasting problems are the depending barriers resulting
from driving barriers. These two barriers are at the lower level both in the survey as well
as in the model however, ISM model suggests that it has a very high depending power.
With reference to the disparity of trading partners’ capabilities, which has emerged as the
one of the important barrier in the survey, it is observed that it finds a low level in the
22

hierarchy of the ISM model. It could be attributed to the reason that disparity in trading
partners’ capabilities is caused by many socio-economic factors, which are not covered in
this research. Yet we get the insight through ISM approach that “disparity in trading
partners’ capability” has a high driving power. This may be the reason why most
respondents regarded it as significant barrier.
It is further observed from the ISM-based model that infrastructure issues such as
lack of top management commitment, missing long term buyer-supplier relationship,
resistance to change and innovation, and disparity in trading partners’ capabilities in
supply chains are at the bottom of the model with greater driving power. Therefore, the
management of the companies belonging to a supply chain should collectively develop
strategies to have long term buyer-supplier relationship. Top management of trading
partners should create awareness about the common objective of the supply chain to
minimize the resistance to change and innovation. Top management commitment help in
handling the disparity among trading partner’ capability by providing technological aids
and financial aids to their trading partners.
It is observed from Figures 9 and 4 that the barriers nos. 5, and 11 namely lack of
trust, and fund non-availability have strong driver power and dependence. Therefore,
these barriers are having a significant influence in integration of supply chain. These
barriers lie in the middle level, both in terms of rankings based on the results of
questionnaire survey and also on the basis of ISM. Further, these barriers influence other
barriers such as lack of information sharing, poor infrastructure and non availability of
cross functional work force as can be seen in the final ISM model (Figure 10). Barriers
lack of information sharing, and non availability of cross functional work force will effect
23
flexibility of the supply chain and result into forecasting inaccuracy. This has strong
implications for both managers as well as researchers. The managers need to address
these barriers more carefully in their supply chains. On the other hand, researchers may
be prompted to identify various other issues, which are significant in addressing these
barriers.
This study has some other implications for the practicing managers. The identified
barriers need to be overcome by the management of the supply chain partner companies.
The driver power dependence diagram gives some valuable insights about the relative
importance and interdependencies of the barriers. The managerial implications as
emerging from this study are as under.
• The driver power dependence figure (Figure 9) indicates that there are two
autonomous variables in the process of supply chain integration. Autonomous
variables are weak drivers and weak dependents and do not have much influence
on the system. The presence of autonomous variables (barriers) in this study
indicates that barriers poor infrastructure and non availability of cross functional
work force influence the process of supply chain integration and management
should pay attention to these barriers.
• From driver power and dependence figure it is observed that forecasting problems
and lack of flexibility are weak drivers but strongly dependent on the other
barriers. These two barriers are at the top of the ISM hierarchy, therefore
considered as the important barriers. The management should therefore accord
high priority in tackling these barriers. Besides tackling these barriers,
management should also understand the dependence of these barriers on lower
24

level barriers in the ISM. Fund non availability coming under this group has
higher driving power hence is kept in the middle level of the ISM model.
• Barrier namely lack of information sharing is the linkage variable and has strong
driver power as well as strong dependence. Though the lower level barriers
induce this barrier, this also have some driver power to influence some other
barriers, which are at the top of the model. The regular joint meetings of the
supply chain partners and developing IT network may help in overcoming this
barrier.
• From Figure 9 it is observed that five barriers namely lack of top management
commitment, missing long term buyer-supplier relationship, resistance to change
and innovation, disparity among trading partners’ capability, and lack of trust
have strong driver power and are less dependent on other barriers. Therefore,
these are strong drivers and may be treated as the root causes of all the barriers.
As these barriers involve all the entities of a supply chain therefore, the major
stakeholder in the supply chain (normally original equipment manufacturer,
OEM) should take the initiative to address these. The joint meetings of all the
entities of supply chain at regular interval may prove to be useful in this regard.
At the end, it would be interesting to examine the scope of future research. In this
research, through ISM, a relationship model among the barriers has been developed. This
model has been developed on the basis of input from two sources (i) discussion with the
experts as suggested in the ISM technique, and (ii) results of a questionnaire survey. Yet,
this model has not been statistically validated. Structural equation modeling (SEM), also
commonly known as linear structural relationship approach, has the capability of testing
25

the validity of such hypothetical model. Therefore, it may be applied in the future
research to test the validity of this model. It is to be mentioned here that while comparing
ISM and SEM, though SEM has the capability of statistically testing an already
developed theoretical model, it cannot develop an initial model for testing. On the other
hand, ISM has the capability to develop an initial model through managerial techniques
such as brain storming, nominal group techniques (NGT) etc. Normally, in many
situations the management may not have enough time to conduct a survey and therefore,
scope to have a statistically validated model to understand a problem. ISM is a supportive
analytic tool for this situation. However, it may be suggested that due to complimentary
nature of both of these techniques, the future research may be directed in first developing
an initial model using ISM and then testing it using SEM.
Acknowledgement
The authors would like to put on record their appreciation to the three experts for their
valuable contributions, which have helped in preparing this paper.
References: Agarwal A., and Shankar R., (2002), “Analyzing alternatives for improvement in supply
chain performance”, Work-Study, Vol. 51 No.1, pp.32-37. Agarwal A., and Shankar R., (2003), “On-line trust building in e-enabled supply chain”,
Supply Chain Management: An International Journal, Vol. 8 No.4 pp.324-334. Aitken J., Christopher M., and Towill D., (2002), “Understanding, implementing and
exploiting agility and leanness”, International Journal of Logistics: Research and Applications, Vol. 5 No.1, pp.59-74.
Akkermans, H., Bogerd, P. and Vos, B., 1999, Virtuous and vicious cycles on the road towards international supply chain management, International Journal of Operations and Production Management, 19, 5, 565-582.
Anderson D.L., and Lee H.L., (1999), “Synchronized supply chains: the new frontier, achieving supply chain excellence through technology”, Montgomery Research, San Francisco, CA.
Armstrong, J. S., and Overton, T.S., 1977, Estimating non-response bias in mail surveys, Journal of Marketing Research, 14, 3, 396-402.
26

Ba S., (2001), “Establishing on-line trust through a community responsibility system”, Decision Support System, Vol. 31 No.3, pp.323-36.
Bal J., Wilding R., and Goundry J., (1999), “Virtual teaming in the agile supply chain”, International Journal of Logistics Management, Vol. 10 No.2, pp.71-83.
Beamon B. M., and Ware T.M., (1998), “A process quality model for the analysis, improvement and control of supply chain systems”, Logistics Information Management, Vol. 11 No.2, pp.105-113.
Chopra, S. and Meindl, P. 2001, Supply chain management: Strategy, planning and operations, 2nd Edition, Prentice Hall, Upper Saddle River, NJ.
Christopher M., (2000), “The agile supply chain, competing in volatile markets”, Industrial Marketing Management, Vol. 29, pp.37-44.
Christopher M., and Towill D.R., (2001), “An integrated model for the design of agile supply chains”, International Journal of Physical Distribution and Logistics, Vol. 31 No.4, pp.235-246.
Christopher M., and Jittner U., (2000)., “Developing strategic partnerships in the supply chain: a practitioner perspective”, European Journal of Purchasing and Supply Chain Management, Vol. 6 No.2, pp.117-127.
Christopher M., Lowson R., and Peck H., (2004), “ Creating agile supply chains in the fashion industry”, International Journal of Retail and Distribution Management, Vol. 32 No. 8, pp. 367-376.
Cooper R., and Slagmulder R., (1998), “Cost management beyond the boundaries of the firm”, Management Accounting, pp.18–20.
Cooper, M.C., Lambert, D.M., and Pagh J.D., 1997, Supply chain management-more than a new name for logistics, International Journal of Logistics Management, 8, 1, 1-14.
Ellram L.M., (1990), “The supplier selection decision in strategic partnerships”, Journal of Purchasing and Materials Management, Vol. 26 No.4, pp.8-14.
Ellram L.M., (1991), “A managerial guide for the development and implementation of purchasing partnerships”, International Journal of Purchasing and Materials Management, Vol. 27 No.3, pp.2-8.
George D., and Mallery P., (1999), SPSS for Windows Step by Step: A Simple Guide and Reference, Allyn and Bacon, Massachusetts.
Goldman S., Nagel R., and Preiss K., (1995), “Agile Competitiors and Virtual Organizations, Van Nostrand Reinhold, New York.
Gunasekaran A., Patel C., and Tirtiroglu E., (2001), “Performance measures and metrics in a supply chain environment”, International Journal of Operations and Production Management, Vol. 21 No.1/2, pp.71-87.
Gunasekaran A., and McGaughey R. E., (2003), “TQM is supply chain management”, The TQM Magazine, Vol. 15 No.6, pp.361-363.
Handfield R.B., and Bechtel C., (2002), “The role of trust and relationship structure in improving supply chain responsiveness”, Industrial Marketing Management, Vol. 31, pp.367– 382.
Handfield R.B. and Nichols Jr. E.L, (1999), “Introduction to Supply Chain Management”, Prentice Hall ,New Jersey, N.J..
27

Handfield R.B., and Pannesi R.T., (1992), “An empirical study of delivery speed and reliability”, International Journal of Operations and Production Management; Vol. 12 No.2, pp.58-72.
Heide J.B., and John G., (1990), “Alliances in Industrial Purchasing: The Determinants of Joint Action in Buyer-Supplier Relationship”, Journal of Marketing Research, Vol. 27, pp.24-36.
Jayaram J., Vickery S.K., and Droge C., (1999), “An empirical study of time-based competition in the North America automotive supplier industry”, International Journal of Operations and Production Management, Vol. 19 No.10, pp.1010-1033.
Jharkharia S., and Shankar R., (2003), “IT-enablement of supply chains: Understanding the barriers”, Accepted: Logistics Information Management.
Kim, J.Q. and Mueller, C.W. 1978, Factor analysis: statistical methods and practical issues, Sage publications, London.
LaLonde, B.J., 2000, The Gap Creep, Supply Chain Management Review, 3, 4, 7-9. Lau H.C.W., Wong C.W.Y., Pun K.F., and Chin K.S., (2003), “Virtual agent modeling of
an agile supply chain infrastructure”, Management Decision, Vol. 41 No.7, pp.625-634.
Lambert, D. M., and Harrington, T.C., 1990, Measuring non-response bias in customer service mail surveys, Journal of Business Logistics, 11,2, 5-25.
Lee H.L., and Billington C., (1992), “Managing supply chain inventory: pitfalls and opportunities”, Sloan Management Review, pp.65-73.
Lee H.L., Padmanabhan V., and Whang S., (1997), “Information distortion in a supply chain: The bull whip effect”, Management Science, Vol. 43 No.4, pp.546-558.
Lee H.L., So K.C., and Tang C. S., (2000), “Value of information sharing in a two level supply chain”, Management Science, Vol. 46 No.5, pp.626-643.
Lee H.L., and Whang S., 2000, Information sharing in a supply chain, International Journal of Technology Management, 20, 3/4, 373-387.
Lockamy III A., and Smith W. I., (2000), “Target costing for supply chain management: criteria and selection”, Industrial Management and Data Systems, Vol.100 No.5, pp.210-218.
Lummus, R.R. and Vokurka, R.J., 1999, Defining supply chain management: a historical perspective and practical guidelines, Industrial Management and Data Systems, 99, 1,11-17.
Malhotra M.K., and Grover V., (1998), “An assessment of survey research in POM: from constructs to theory, Journal of Operations Management”, Vol. 16 No.4, pp.407-425.
Mandal A., and Deshmukh S.G., (1994), “Vendor Selection Using Interpretive Structural Modeling (ISM)”, International Journal of Operations and Production Management, Vol. 14 No.6, pp.52-59.
Mason S.J., Cole M.H., Ulrey B.T., and Yan L., (2002), “Improving electronics manufacturing supply chain agility through outsourcing”, International Journal of Physical Distribution and Logistics Management, Vol. 32 No.7, pp.610-620.
Mason-Jone R., Naylor B., and Towill D.R., (2000), “Engineering the Leagile Supply Chain”, International Journal of Agile Management Systems, Vol. 2 No.1, pp.54-61.
Mason-Jones R., and Towill D.R., (1999), “Total cycle time compression and the agile supply chain”, International Journal of Production Economics, Vol. 62, pp.61-73.
28

Mentzer J.T., Foggin J.H., and Golicic S.L., (2000), “Collaboration: the enablers, impediments, and benefits”, Supply Chain Management Review, September/October, pp.52-58.
Moberg, C. R., Cutler, B. D., Gross, A. and Speh, T. W., 2002, Identifying antecedents of information exchange within supply chains, International Journal of Physical Distribution and Logistics Management, 32, 9, 755-770.
Naylor J.B., Naim M. M., and Berry D., 1999, Leagility: Integrating the lean and agile manufacturing paradigms in the total supply chain, International Journal of Production Economics, 62, 107-118.
Nunally, J. C. 1978, Psychometric Methods, McGraw Hill, NewYork. Power D.J., Sohal A.S., and Rahman S., (2001), “Critical success factors in agile Supply
chain management: an empirical study”, International Journal of Physical Distribution and Logistics, Vol. 31 No.4, pp.247-265.
Sage A.P., (1977), “Interpretive structural modeling: methodology for large-scale systems”, McGraw-Hill, New York, NY.
Sahay B.S. and Mohan, R., 2003, Supply chain management practices in Indian industry, International Journal of Physical Distribution and Logistics Management, 33,7, 582-606.
Saxena J. P., Sushil, and Vrat P., (1990), “The impact of indirect relationships in classification of variables- a MICMAC analysis for energy conservation”, System Research, Vol. 7 No.4, pp.245-253.
Saxena J. P., Sushil, and Vrat P., (1992), “Scenario building: a critical study of energy conservation in the Indian cement industry”, Technological Forecasting and Social Change, Vol. 41, pp.121-146.
Shankar R., and Agarwal A., (2004), “Designing agile and responsive supply chain”, Winning Strategies of Supply Chains, ASSOCHAM, New Delhi, India. pp.12-22.
Sharma H. D., Gupta A.D., and Sushil, (1995), “The objectives of waste management in India: a future inquiry”, Technological Forecasting and Social Change, Vol. 48, pp.285-309.
Singh, M.D. Shankar R., Narain R., and Agarwal A., (2003), “Knowledge Management in engineering industries – An Interpretive Structural Modeling”, Journal of Advances in Management Research, Vol. 1 No.1, pp.27-39.
Stevens G., 1989, Integrating the supply chain, International Journal of Physical Distribution and Materials Management, 19, 1, 3-8.
Stevens G. C., (1990), “Successful supply-chain management”, Management Decision, Vol. 28 No.8, pp.25-30.
Tolone W.J., (2000), “Virtual situation rooms: connecting people across enterprises for supply chain agility”, Computer Aided Design, Vol. 32, pp.109-117.
Van Hoek R. I., Harrison A., and Christopher M., (2001), “Measuring agile capabilities in the supply chain”, International Journal of Operations and Production Management, Vol. 21 No.1/2, pp.126-148.
Waddell D., and Sohal A.S., (1998), “Resistance: a constructive tool for change management”, Management Decision, Vol. 36 No.8, 543-548.
Warfield J.W., (1974), “Developing Interconnected Matrices in Structural Modeling”, IEEE Transcript on Systems, Men and Cybernetics, Vol. 4 No.1, pp.51-81.
29

Yusuf Y. Y., Gunasekaran A., Adeleye E. O., and Sivayoganathan K., (2004), “Agile supply chain capabilities: determinants of competitive objectives”, European Journal of Operational Research, Vol. 159, pp. 379-392.
Yusuf Y. Y., Sarhadi M., and Gunasekaran A., (1999), “Agile manufacturing: The drivers, concepts and attributes”, International Journal of Production Economics, Vol. 62 No.1/2, pp.33-43.
30

Table 1: Description of Respondents Auto-Sector FMCG Electrical and Electronics
Manufacturer Supplier Manufacturer Supplier Manufacturer Supplier
Sample size 760 170 217 73 78 81 141
Responded 214 40 55 29 33 21 36
Rejected due to incomplete 35 05 07 09 08 03 03
Qualified respondents 179 35 48 20 25 18 33
Percentage (%) 23.55 20.58 22.12 27.4 32.05 22.22 23.4
Table II: Structural Self-interaction Matrix (SSIM) Elements
11 10 9 8 7 6 5 4 3 2
1 X V O V O O O V O V 2 O O V O A O X X V 3 O O O A O O A A 4 O O O A X V X 5 O O O O X V 6 A A A A A 7 V O O O 8 A O O 9 V O 10 A
Table III: Initial Reachability Matrix Elements 1 2 3 4 5 6 7 8 9 10 11
1 1 1 0 1 0 0 0 1 0 1 1 2 0 1 1 1 1 0 0 0 1 0 0 3 0 0 1 0 0 0 0 0 0 0 0 4 0 1 1 1 1 1 1 0 0 0 0 5 0 1 1 1 1 1 1 0 0 0 0 6 0 0 0 0 0 1 0 0 0 0 0 7 0 1 0 1 1 1 1 0 0 0 1 8 0 0 1 1 0 1 0 1 0 0 0 9 0 0 0 0 0 1 0 0 1 0 1
10 0 0 0 0 0 1 0 0 0 1 0 11 1 0 0 0 0 1 0 1 0 1 1
31

Table IV: Final Reachability Matrix
Elements 1 2 3 4 5 6 7 8 9 10 11 1 1 1 1* 1 1* 1* 1* 1 1* 1 1 2 0 1 1 1 1 1* 1* 0 1 0 1* 3 0 0 1 0 0 0 0 0 0 0 0 4 0 1 1 1 1 1 1 0 0 0 0 5 0 1 1 1 1 1 1 0 0 0 1* 6 0 0 0 0 0 1 0 0 0 0 0 7 1* 1 0 1 1 1 1 0 0 0 1 8 0 0 1 1 0 1 0 1 0 0 0 9 1* 0 0 0 0 1 0 1* 1 1* 1
10 0 0 0 0 0 1 0 0 0 1 0 11 1 0 0 0 0 1 0 1 0 1 1
Table V: Levels of SC Integration Barriers
Element (Pi)
Reachability Set: R (Pi) Antecedent Set: A (Pi) IntersectionR (Pi) A (Pi)
Level
1 1,2,3,4,5,6,7,8,9,10,11 1,7,9,11 1,7,9,11 2 2,3,4,5,6,7,9,11 1,2,4,5,7 2,4,5,7 3 3 1,2,3,4,5,8 3 I 4 2,3,4,5,6,7 1,2,3,4,5,7,8 2,4,5,7 5 2,3,4,5,6,7,11 1,2,3,4,5,7 2,4,5,7 6 6 1,2,3,4,5,6,7,8,9,10,11 6 I 7 1, 2,4,5,6,7,11 5,6,7 1,2,4,5,7 8 3,4,6,8 1,8,9,11 8 9 1,6,8,9,10,11 1,2,9 1,9
10 6,10 1,9,10,11 10 11 1,6,8,10,11 1,2,5,7,9,11 1,11
Table VI: Levels of SC Integration Barriers
Element (Pi)
Reachability Set: R (Pi) Antecedent Set: A (Pi) IntersectionR (Pi) A (Pi)
Level
1 1,2,4,5,7,8,9,10,11 1,7,9,11 1,7,9,11 2 2,4,5,7,9,11 1,2,4,5,7 2,4,5,7 4 2,4,5,7 1,2,4,5,7,8 2,4,5,7 II 5 2,4,5,7,11 1,2,4,5,7 2,4,5,7 7 1, 2,4,5,7,11 5,7 1,2,4,5,7 8 4,8 1,8,9,11 8 9 1,8,9,10,11 1,2,9 1,9
10 10 1,9,10,11 10 II 11 1,8,10,11 1,2,5,7,9,11 1,11
32

Table VII: Levels of SC Integration Barriers
Element (Pi)
Reachability Set: R (Pi) Antecedent Set: A (Pi) IntersectionR (Pi) A (Pi)
Level
1 1,2,5,7,8,9,11 1,7,9,11 1,7,9,11 2 2,5,7,9,11 1,2, 5,7 2,5,7 5 2,5,7,11 1,2,5,7 2,5,7 7 1, 2,5,7,11 5,7 1,2,5,7 8 8 1,8,9,11 8 III 9 1,8,9,11 1,2,9 1,9
11 1,8,11 1,2,5,7,9,11 1,11
TableVIII: Levels of SC Integration Barriers
Element (Pi)
Reachability Set: R (Pi) Antecedent Set: A (Pi) IntersectionR (Pi) A (Pi)
Level
1 1,2,5,7,9,11 1,7,9,11 1,7,9,11 2 2,5,7,9,11 1,2, 5,7 2,5,7 5 2,5,7,11 1,2,5,7 2,5,7 7 1, 2,5,7,11 5,7 1,2,5,7 9 1,9,11 1,2,9 1,9
11 1,11 1,2,5,7,9,11 1,11 IV Table IX: Levels of SC Integration Barriers
Element (Pi)
Reachability Set: R (Pi) Antecedent Set: A (Pi) IntersectionR (Pi) A (Pi)
Level
1 1,2,5,7,9 1,7,9 1,7,9 2 2,5,7,9 1,2, 5,7 2,5,7 5 2,5,7 1,2,5,7 2,5,7 V 7 1, 2,5,7 5,7 1,2,5,7 9 1,9 1,2,9 1,9 V Table X: Levels of SC Integration Barriers
Element (Pi)
Reachability Set: R (Pi) Antecedent Set: A (Pi) IntersectionR (Pi) A (Pi)
Level
1 1,2,7 1,7 1,7 VII 2 2,7 1,2, 7 2,7 VI 7 1, 2,7 7 1,2,7 VI
33

Table XI: Levels of SC Integration Barriers Element (Pi)
Reachability Set: R (Pi) Antecedent Set: A (Pi) IntersectionR (Pi) A (Pi)
Level
1 1,2,3,4,5,6,7,8,9,10,11 1,7,9,11 1,7,9,11 V 2 2,3,4,5,6,7,9,11 1,2,4,5,7 2,4,5,7 III 3 3 1,2,3,4,5,8 3 VI 4 2,3,4,5,6,7 1,2,3,4,5,7,8 2,4,5,7 II 5 2,3,4,5,6,7,11 1,2,3,4,5,7 2,4,5,7 VIII 6 6 1,2,3,4,5,6,7,8,9,10,11 6 VIII 7 1, 2,4,5,6,7,11 5,6,7 1,2,4,5,7 IX 8 3,4,6,8 1,8,9,11 8 IV 9 1,6,8,9,10,11 1,2,9 1,9 II
10 6,10 1,9,10,11 10 I 11 1,6,8,10,11 1,2,5,7,9,11 1,11 I Table XII: Conical Form of Reachability Matrix
Elements 1 2 5 7 4 9 11 8 10 3 6 1 1 1 1* 1* 1 1* 1 1 1 1* 1* 2 0 1 1 1* 1 1 1* 0 0 1 1* 5 0 1 1 1 1 0 1* 0 0 1 1 7 1* 1 1 1 1 0 1 0 0 0 1 4 0 1 1 1 1 0 0 0 0 1 1 9 1* 0 0 0 0 1 1 1* 1* 0 1
11 1 0 0 0 0 0 1 1 1 0 1 8 0 0 0 0 1 0 0 1 0 1 1
10 0 0 0 0 0 0 0 0 1 0 1 3 0 0 0 0 0 0 0 0 0 1 0 6 0 0 0 0 0 0 0 0 0 0 1
Table XIII: Driving power and Dependence in Reachability Matrix
Element 1 2 5 7 4 9 11 8 10 3 6 Driving power
Ranks
1 1 1 1* 1* 1 1* 1 1 1 1* 1* 2 V 2 0 1 1 1* 1 1 1* 0 0 1 1* 2 V 5 0 1 1 1 1 0 1* 0 0 1 1 2 V 7 1* 1 1 1 1 0 1 0 0 0 1 2 V 4 0 1 1 1 1 0 0 0 0 1 1 2 V 9 1* 0 0 0 0 1 1 1* 1* 0 1 3 IV
11 1 0 0 0 0 0 1 1 1 0 1 6 III 8 0 0 0 0 1 0 0 1 0 1 1 8 II
10 0 0 0 0 0 0 0 0 1 0 1 8 II 3 0 0 0 0 0 0 0 0 0 1 0 11 I 6 0 0 0 0 0 0 0 0 0 0 1 11 I
Dependence Power 4 5 5 5 6 3 6 4 4 6 10
Ranks VII VI III III IV III II IV IV V I
34

Figure 1: Framework for supply chain integration (modified from Christopher, 1998)
Early supplier involvement in
product development
Integrated information system
Supply base rationalization
Supplier development
programs
Centralization of inventory
Supply chain integration
Number of suppliers
2% 7%
17%
17%
57%
less than 3 suppliers
cannot say
between 3 and 5
between 6 and 10
more than 10 suppliers
Figure 2: Percent of Respondent Firms Employing Different Number of Suppliers
35

Annual Turnover
6%11%
13%
20%
50%
50-100 crore rupeesunder 5 crore rupees10-50 crore rupees5-10 crore rupeesover 100 crore rupees
Figure 3: Break-up of the Companies Participated in the Survey
Respondents Supply Chain Activity
47%
25%
28%
automobile
fast moving consumer goods
electrical & electronics goods
Figure 4: Percent of Respondents of the Survey across Different Sectors
36

Profit Trend
05
10152025303540
cannot say decreaseupto 10%
almostconstant
increaseupto 10%
increasemore 10%
ProfitTrend inlast threeyears
Figure 5: Profit Trend of Respondent Companies During Last Three Years
Well integrated supply chain improves market share
10%
90%
noyes
Figure 6: Respondent Companies believe that a well-integrated
Supply Chain improves Market Share
37

Figure 7: Barriers in Supply Chain Integration
0.00
0.50
1.00
1.50
2.00
2.50
3.00
3.50
4.00
4.50
5.00
Fund unavailability
Non-availability of cross functional w orkforce
Disparity in trading partners' capability
Poor infra-structural facilities
Resistance to change and adopt innovations
Lack of f lexibility
Lack of trust in supply chain linkages
Lack of information sharing among partners
Forecasting problems
Missing long-term buyer-supplier relationship
Lack of top management commitment Std. Deviation
Mean
38

No
Yes
Figure 8: Flow diagram for preparing ISM
Listing the barriers of supply chain integration
Establishing contextual relationship (Xi,j) between agility variables (i,j)
Developing a Structural Self-Interaction Matrix (SSIM)
Developing a Reachability
Matrix
Partitioning the Reachability Matrix into different levels
Developing the Reachability Matrix in its conical form
Developing digraph Removing transitivity from the diagraph
Replacing variables nodes with relationship statements Is there any
conceptual inconsistency?
Obtaining Expert opinion
Literature review on Barriers of supply chain
integration
Nec
essa
ry m
odifi
catio
n
Representing relationship statement into model for barriers of supply chain integration
39

8
10
1
2 5, 7 9
11 3 6
1 2 3 4 5 6 7 8 9 10 11 12
4
5
4
3
2
1
12 11 10 9 8 7 6
Dependence Power
Dri
ving
Pow
er
Cluster IV: Independent (Driver) variable
Cluster –I Autonomous
variable
Cluster III- Linkage variable
Cluster II- Dependent
variable
Figure 9: Cluster of variables for improving supply chain agility
40

Missing long term buyer supplier relationship (2)
Lack of Top Management Commitment (1)
Resistance to change and innovation (7)
Disparity among trading partners’ capability (9)
Lack of trust (5) Fund non-availability (11)
Poor Infrastructure (8)
Lack of information sharing (4)
Non availability of cross functional work forces (10)
Forecasting Problems (3)
Lack of Flexibility (6)
Figure 10: ISM-based model of barriers for supply chain integration barriers after removing indirect links
41

Vitae
Ashish Agarwal is a faculty at School of Engineering & Technology, Indira Gandhi National Open
University, New Delhi and earned his doctoral research from IIT Delhi, India. His areas of interest are
Cellular Manufacturing System, Agile Manufacturing System, Supply Chain Management and System
Dynamics Modeling. His research papers have appeared in European Journal of Operational Research,
Supply Chain Management: An International Journal, International Journal Information Systems and
Change Management, International Journal of System Dynamics and Policy-Making, and Work-Study,
Journal of Advances in Management Research, etc.
Email: [email protected]
Ravi Shankar is a faculty at Department of Management Studies, I.I.T. Delhi. His areas of interest are
Industrial Engineering/ Operations Management, Supply Chain Management, e-Business, Operations
Research, and Fuzzy Modeling. He is a Ph.D. from I.I.T. Delhi, India. He has over twenty years of teaching
and research experience. His research papers have appeared in European Journal of Operational Research,
International Journal of Production Research, Computers & Operations Research, International Journal of
Production Economics, Supply Chain Management: An International Journal, International Journal of
System Dynamics and Policy Making, International Journal of Productivity and Performance Measurement
(earlier known as Work Study), Productivity, Computers and Industrial Engineering, Journal of Advances
in Management Research, and Technological Forecasting and Social Change etc.
Email: [email protected]
42