ista’s position, experience and activities in the field of biotech trait detection ista gmo tf...
TRANSCRIPT

ISTA’s Position, Experience and Activities in the Field of Biotech Trait Detection
ISTA GMO TF
B.R. Kahlert
S. Grégoire, C. Haldemann, K. Remund, J.L. Laffont
and many others
International Seed Testing Association

Outline
What is ISTA?
ISTA and of GM Seed Testing
Accreditation
Proficiency Tests
Performance Data Evaluation
Audit
ISTA can help, ISTA helps to share
Workshops, Seedcalc, Website
Objectives of the International Seed Testing Association
• The primary purpose of the Association is to develop, adopt and publish standard procedures for sampling and testing seeds, and to promote uniform application of these procedures for evaluation of seeds moving in international trade.
• The secondary purposes of the Association are actively to promote research in all areas of seed science and technology, to participate in conferences and training courses aimed at furthering these objectives, and to establish and maintain liaison with other organisations having common or related interests in seed.
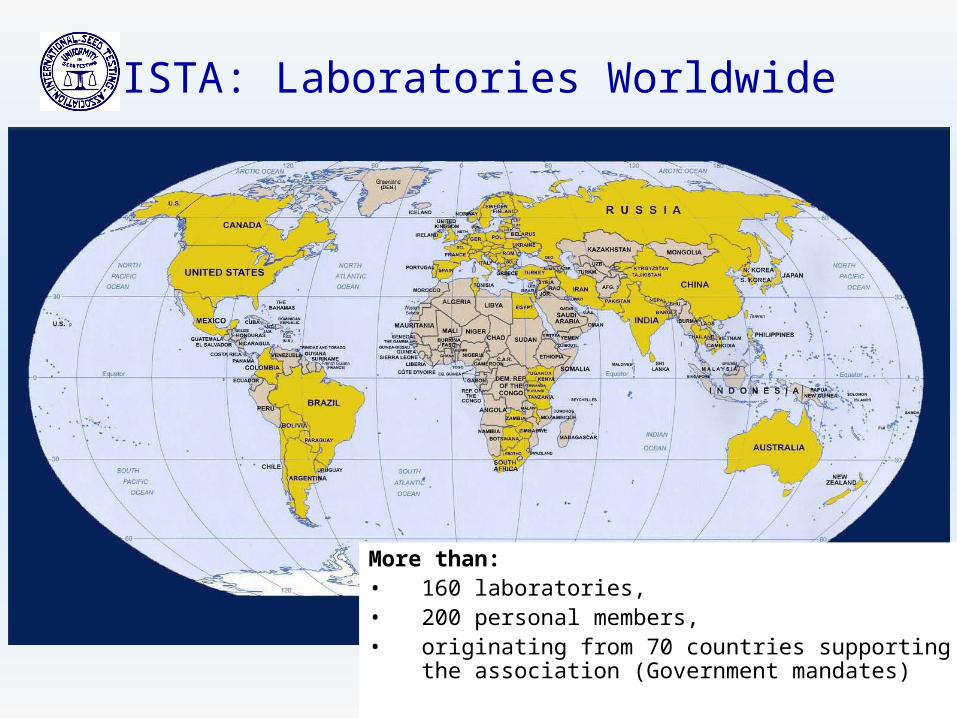
More than:• 160 laboratories,• 200 personal members, • originating from 70 countries supporting the
association (Government mandates)
ISTA: Laboratories Worldwide
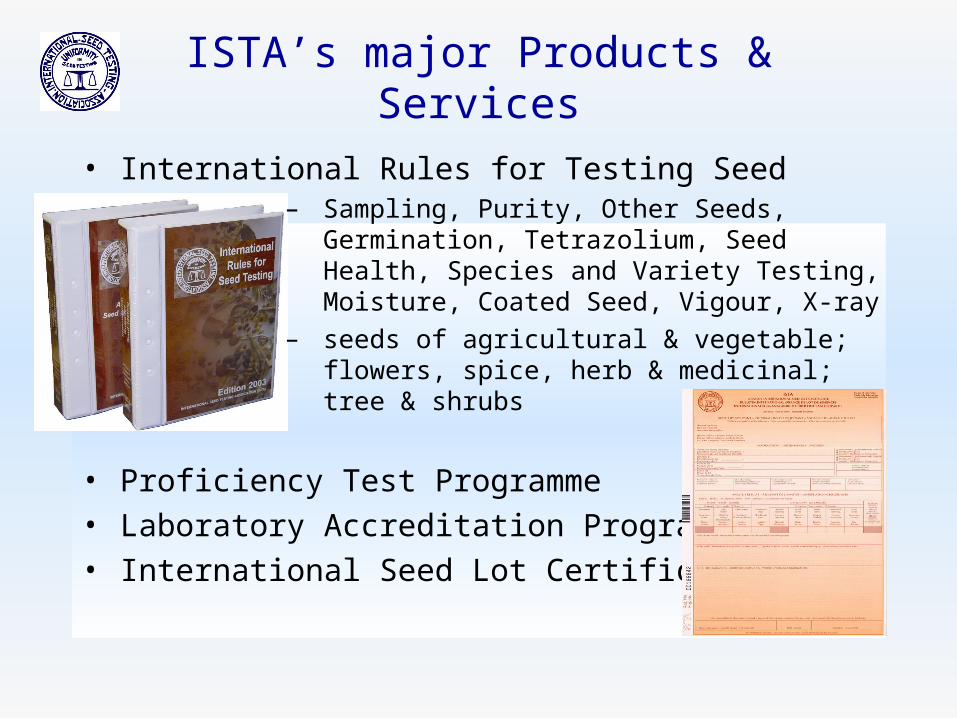
ISTA’s major Products & Services
• International Rules for Testing Seed– Sampling, Purity, Other Seeds, Germination,
Tetrazolium, Seed Health, Species and Variety Testing, Moisture, Coated Seed, Vigour, X-ray
– seeds of agricultural & vegetable; flowers, spice, herb & medicinal; tree & shrubs
• Proficiency Test Programme • Laboratory Accreditation Programme• International Seed Lot Certificates
ISTA’s Vision & Strategy inTesting of GM Seeds
• ISTA Seed Testing Laboratories are competence centres for detection, identification and quantification of GM seeds
• ISTA focuses its activity on developing and maintaining a system that ensures reliability and accuracy of results all over the world, when testing for GM seeds – Performance Based Approach
defined in the Position Paper:
ISTA’s Strategy Regarding Methods for the Detection, Identification and Quantification of Genetically Modified Seeds in Conventional Seed Lots
adopted by the Executive Committee Nov. 2001
ISTA’s Actions in Testing of Seed with Specified Trait(s)
1. Chapter in ISTA Rules for testing of seeds with specified trait(s)
2. Implementation of Laboratory Accreditation under Performance Based Approach
3. Organising proficiency tests on detection and quantification of GM seeds in conventional seed
4. Establishing a system for Performance Data Evaluation for the Presence of Seed with Specified Trait(s) in Seed Lots and Specified Trait Purity
5. Provide technical help for the laboratories (training courses, workshops, Seedcalc7, ...)
1. Chapter in the ISTA Rules
• Rules for the testing of seeds with specified traits including the detection, identification and quantification of GM seeds came into force in February 1st, 2006
• The Rules do not contain specific methods, but define the general principles in testing and reporting results of such tests
• Laboratories having methods for GM seed testing in their scope of accreditation can report the test results on the International Seed Analysis Certificate

2. Conditions for ISTA Accreditation under the Performance Based Approach
Laboratory ...• Has established method(s)• Defines scope of accreditation• Participates successfully in the ISTA Proficiency
Test Programme• Submits performance data• Has an audit

3. Organisation of Proficiency Tests
AIMS• to evaluate the performance of participating
laboratories• to collect data to be used to set performance
standards• To increase experience for ISTA and participating
laboratories
Satisfactory performance in proficiency tests is a prerequisite for attaining or maintaining the status as an accredited laboratory
Laboratories can participate to ISTA proficiency tests, even if they do not seek accreditation
Design of the 6th Proficiency Test
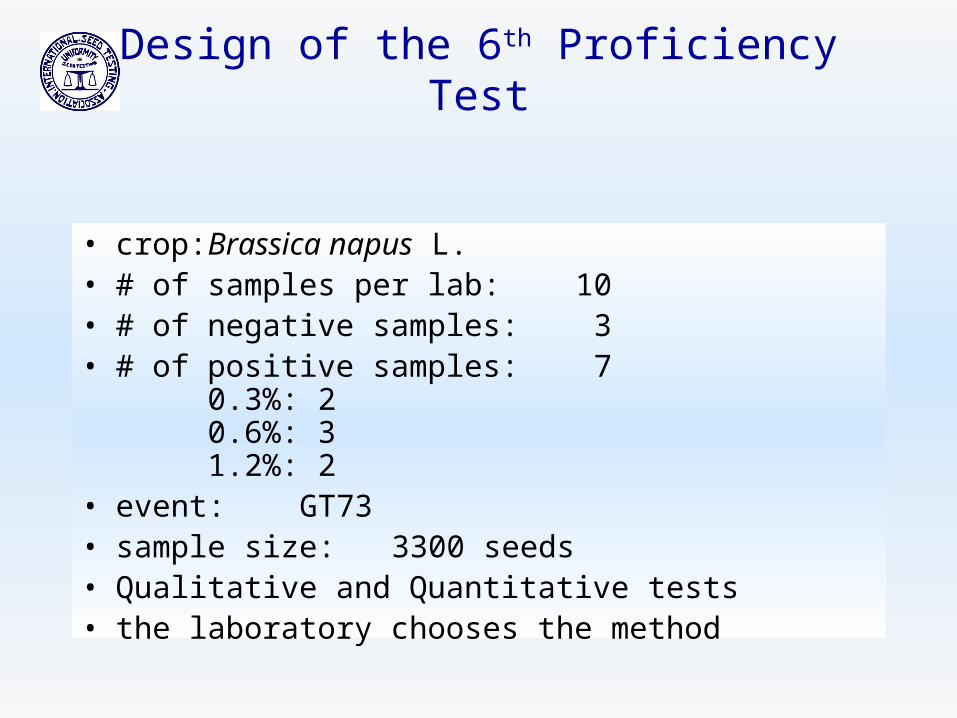
• crop: Brassica napus L.• # of samples per lab: 10• # of negative samples: 3• # of positive samples: 7
0.3%: 20.6%: 31.2%: 2
• event: GT73• sample size: 3300 seeds• Qualitative and Quantitative tests• the laboratory chooses the method
Qualitative Test: The detection of GM seeds in samples
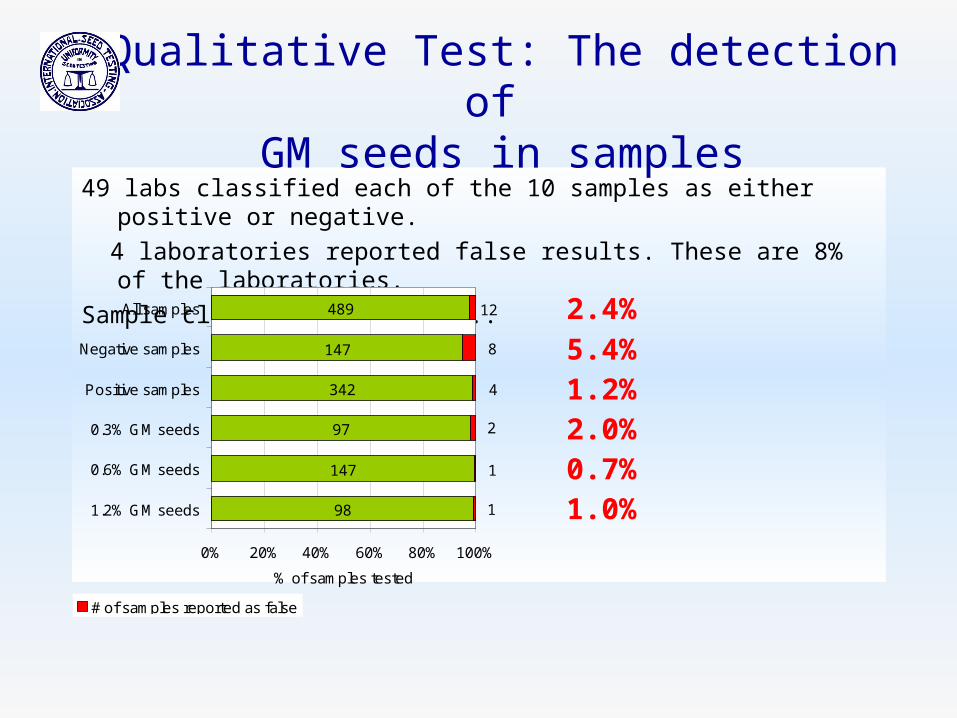
49 labs classified each of the 10 samples as either positive or negative.
4 laboratories reported false results. These are 8% of the laboratories.
Sample classified as false...
98
147
97
342
147
489
1
1
2
4
8
12
0% 20% 40% 60% 80% 100%
1.2% GM seeds
0.6% GM seeds
0.3% GM seeds
Positive samples
Negative samples
All samples
% of samples tested
# of samples reported as false
2.4%5.4%1.2%2.0%0.7%1.0%

Sub-sampling Quantification
Laboratory’s estimated results and its mean
Es
tim
ate
of
% G
M
se
ed
s
12 laboratories reported the test plan...
• the size of sub-samples (in number of seeds)
• the number of sub-samples tested
• the number of positive sub-samples
used to compute the result
Labs# of sub-samples
size ofsub-sample
1 ~300 102 ~90 30
3, 4 ~30 ~1105, 6 20-25 ~1507, 8 15 210-220
9, 10, 11 5-10 330-55012 2-3
Spiking level 0.3% Spiking level 0.6% Spiking level 1.2%
0.0
0.2
0.4
0.6
0.8
1.0
1.2
1.4
1.6
1.8
2.0
2.2
2.4
2.6
2.8
3.0
1 2 3 4 5 6 7 8 9 10 11 12
0.0
0.2
0.4
0.6
0.8
1.0
1.2
1.4
1.6
1.8
2.0
2.2
2.4
2.6
2.8
3.0
1 2 3 4 5 6 7 8 9 10 11 12
0.0
0.2
0.4
0.6
0.8
1.0
1.2
1.4
1.6
1.8
2.0
2.2
2.4
2.6
2.8
3.0
1 2 3 4 5 6 7 8 9 10 11 12
Quantitative Test
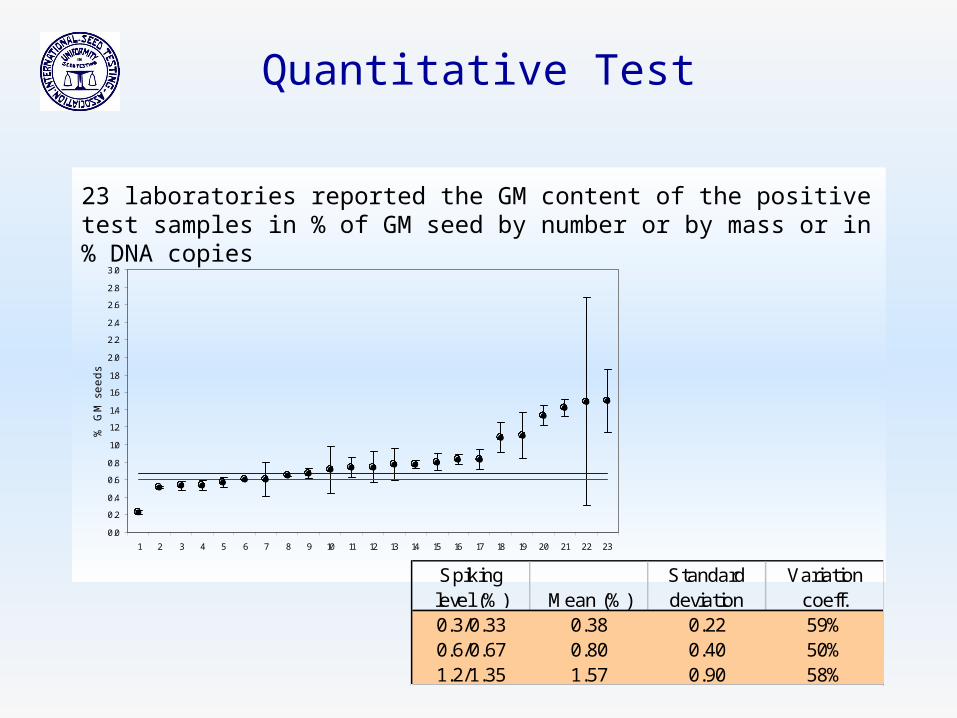
23 laboratories reported the GM content of the positive test samples in % of GM seed by number or by mass or in % DNA copies
0.0
0.2
0.4
0.6
0.8
1.0
1.2
1.4
1.6
1.8
2.0
2.2
2.4
2.6
2.8
3.0
1 2 3 4 5 6 7 8 9 10 11 12 13 14 15 16 17 18 19 20 21 22 23
% G
M s
ee
ds
Spiking level (%) Mean (%)
Standarddeviation
Variationcoeff.
0.3/0.33 0.38 0.22 59%0.6/0.67 0.80 0.40 50%1.2/1.35 1.57 0.90 58%

Summary PT06
PT06 - Qualitative Results:• The percentage of laboratories reporting correct
results for all samples is higher as in the previous tests
• >90% of labs made no missclassification, • >97% of samples are reported correctly
PT06 - Quantitative Results:• The results show similar variation for the the spiking
level (VC = ~50%)• Most laboratories overestimated the true level
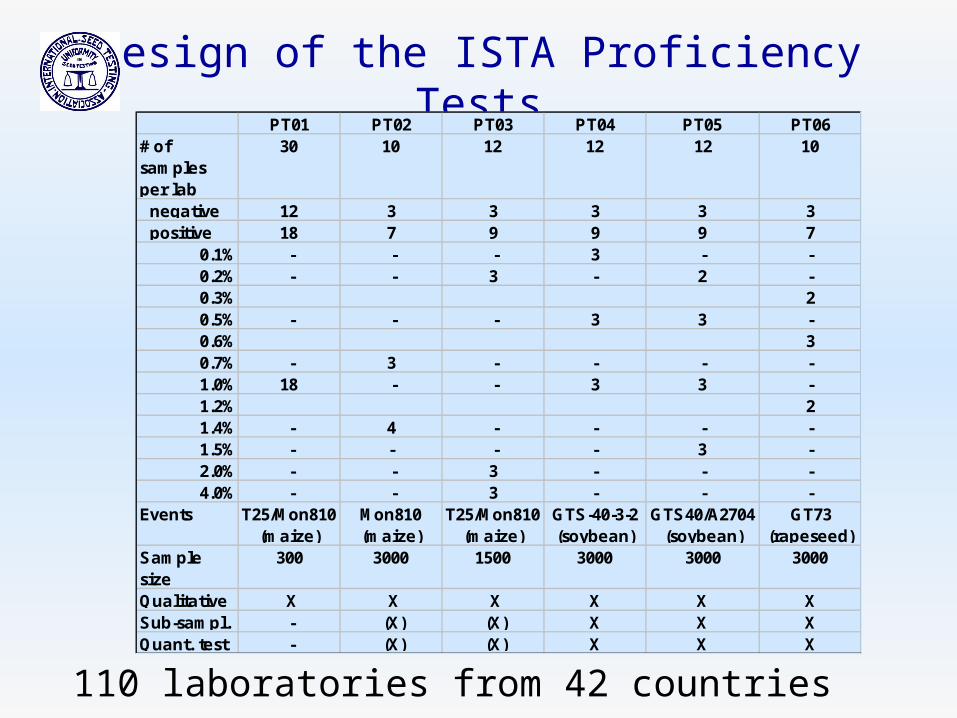
Design of the ISTA Proficiency TestsPT01 PT02 PT03 PT04 PT05 PT06
# of samples per lab
30 10 12 12 12 10
negative 12 3 3 3 3 3 positive 18 7 9 9 9 7
0.1% - - - 3 - -0.2% - - 3 - 2 -0.3% 20.5% - - - 3 3 -0.6% 30.7% - 3 - - - -1.0% 18 - - 3 3 -1.2% 21.4% - 4 - - - -1.5% - - - - 3 -2.0% - - 3 - - -4.0% - - 3 - - -
Events T25/Mon810 (maize)
Mon810 (maize)
T25/Mon810 (maize)
GTS-40-3-2 (soybean)
GTS40/A2704 (soybean)
GT73(rapeseed)
Sample size
300 3000 1500 3000 3000 3000
Qualitative X X X X X XSub-sampl. - (X) (X) X X XQuant. test - (X) (X) X X X
110 laboratories from 42 countries
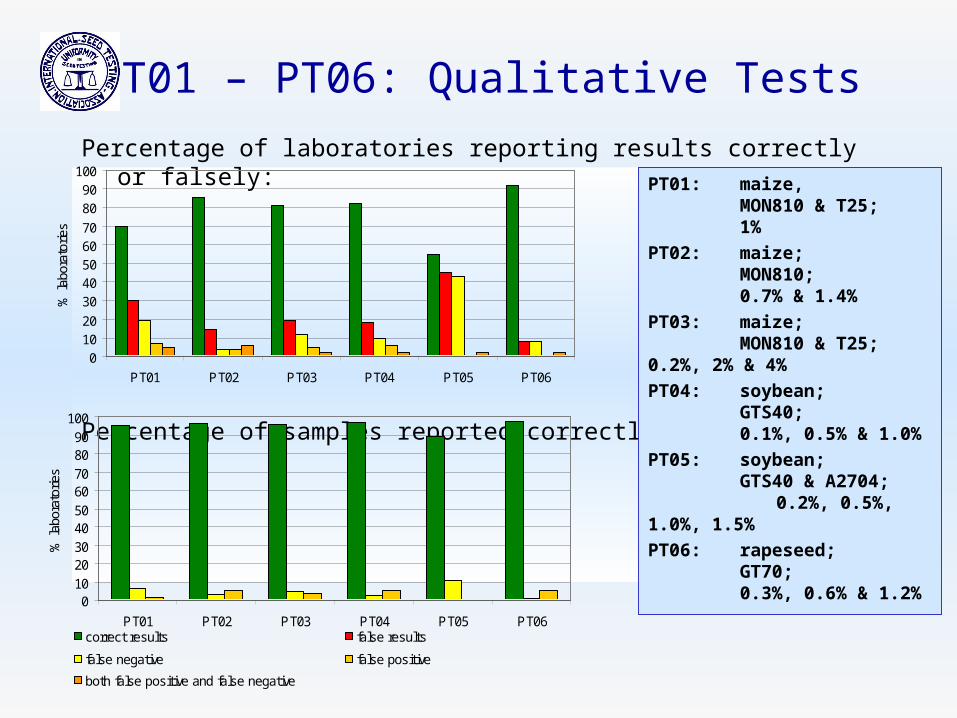
PT01 – PT06: Qualitative Tests
Percentage of laboratories reporting results correctly or falsely:
Percentage of samples reported correctly or falsely:
PT01: maize, MON810 & T25; 1%
PT02: maize; MON810; 0.7% & 1.4%
PT03: maize; MON810 & T25; 0.2%, 2% & 4%
PT04: soybean; GTS40; 0.1%, 0.5% & 1.0%
PT05: soybean; GTS40 & A2704;
0.2%, 0.5%, 1.0%, 1.5%
PT06: rapeseed; GT70; 0.3%, 0.6% & 1.2%
01020
3040506070
8090
100
PT01 PT02 PT03 PT04 PT05 PT06
% la
bora
torie
s
correct results false results
false negative false positive
both false positive and false negative
0102030405060708090
100
PT01 PT02 PT03 PT04 PT05 PT06
% la
bora
torie
s

PT01 – PT06: Quantitative Test
(Overall) mean of the quantitative test results for each spiking level
0.00
1.00
2.00
3.00
4.00
5.00
6.00
0.1 0.2 0.2 0.3 0.5 0.5 0.6 0.7 1.0 1.0 1.0 1.2 1.4 1.5 2.0 4.0
GTS40 MON810+T25
GTS40 GT70 GTS40 GTS40 GT70 MON810+T25
GTS40 GTS40 A2704 GT70 MON810+T25
GTS40 MON810+T25
MON810+T25
soya maize soya rape soya soya rape maize soya soya soya rape maize soya maize maize
PT04 PT03 PT05 PT06 PT04 PT05 PT06 PT02 PT04 PT05 PT05 PT06 PT02 PT05 PT03 PT03
% m
ean
GM
con
tent

PT01 – PT06: Quantitative Test
Variation coefficient of the quantitative test results
0%
10%
20%
30%
40%
50%
60%
70%
80%
90%
100%
0.1 0.2 0.2 0.3 0.5 0.5 0.6 0.7 1.0 1.0 1.0 1.2 1.4 1.5 2.0 4.0
GTS40 MON810+T25
GTS40 GT70 GTS40 GTS40 GT70 MON810+T25
GTS40 GTS40 A2704 GT70 MON810+T25
GTS40 MON810+T25
MON810+T25
soya maize soya rape soya soya rape maize soya soya soya rape maize soya maize maize
PT04 PT03 PT05 PT06 PT04 PT05 PT06 PT02 PT04 PT05 PT05 PT06 PT02 PT05 PT03 PT03
% m
ean
GM
con
tent

Summary PT01-PT06
Qualitative Results:Better results when• only one transgenic event involved• transgenic events are well known
Better results for negative samples than for positive samples
Quantitative Results:Reported values close to the true value• when spiking level between 0.2% and 1.5%• when transgenic event and reference material are well known

How to evaluate the performance of laboratories in ISTA Proficiency Tests?
A No problem has been detected in this test
B There are small problems, but no specific look or action is suggested to the participant
C Problems, ISTA indicates there might be things to consider by the laboratory to explain or correct things
BMP Below Minimum of Performance, ISTA indicates that the results were poor and the laboratory need to find explanations and to improve/correct
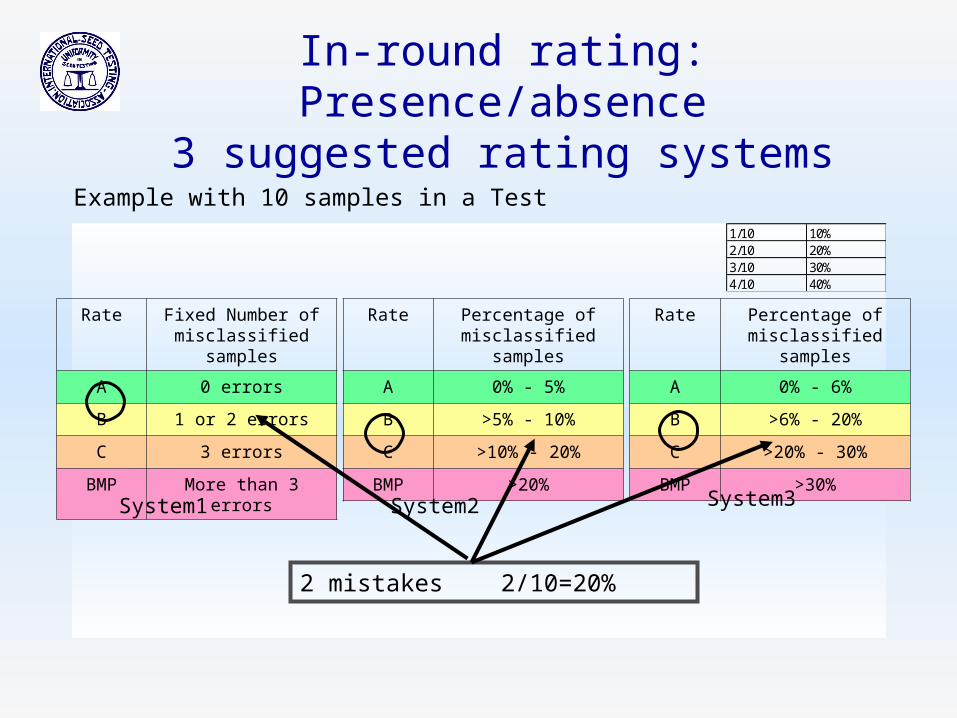
In-round rating: Presence/absence3 suggested rating systems
1/10 10%2/10 20%3/10 30%4/10 40%
Rate Fixed Number of misclassified samples
A 0 errors
B 1 or 2 errors
C 3 errors
BMP More than 3 errors
Rate Percentage of misclassified samples
A 0% - 5%
B >5% - 10%
C >10% - 20%
BMP >20%
Rate Percentage of misclassified samples
A 0% - 6%
B >6% - 20%
C >20% - 30%
BMP >30%
Example with 10 samples in a Test
System1 System2 System3
2 mistakes 2/10=20%

In-round Rating: Principles
for Quantification
More than ½ of the sample resultsoutside [½ true level; 2 x true level]
C Yes
Probability to observe amore extreme value of the sum
of absolute spiking levels z-scores whenassuming the laboratory provides
accurate resultsis 0.01
No
No
More than 1/6 (~17%) ofthe sample z-scores outside
[-2; +2] (missing sample values are
counted as outside)
BMP Yes
AB Yes No
Too many sample results aretoo far from truth
C Yes The average results by spiking level are not accurate
No
No
There are too manyinaccurate sample
results
AB Yes No
BMP Yes

Qualitative Test (49 labs) Quantitative and Sub-sampling Quantitative Tests (35 labs)
PT06 Rating
0
5
10
15
20
25
30
35
40
45
50
A B C BMP
# o
f L
abs
Rating System 1 Rating System 2 Rating System 3
0
5
10
15
20
25
30
35
40
45
50
A B C BMP
# o
f L
abs
Rating System 1 Rating System 2 Rating System 3
RS1: seed numberRS2: mass of seedRS3: median
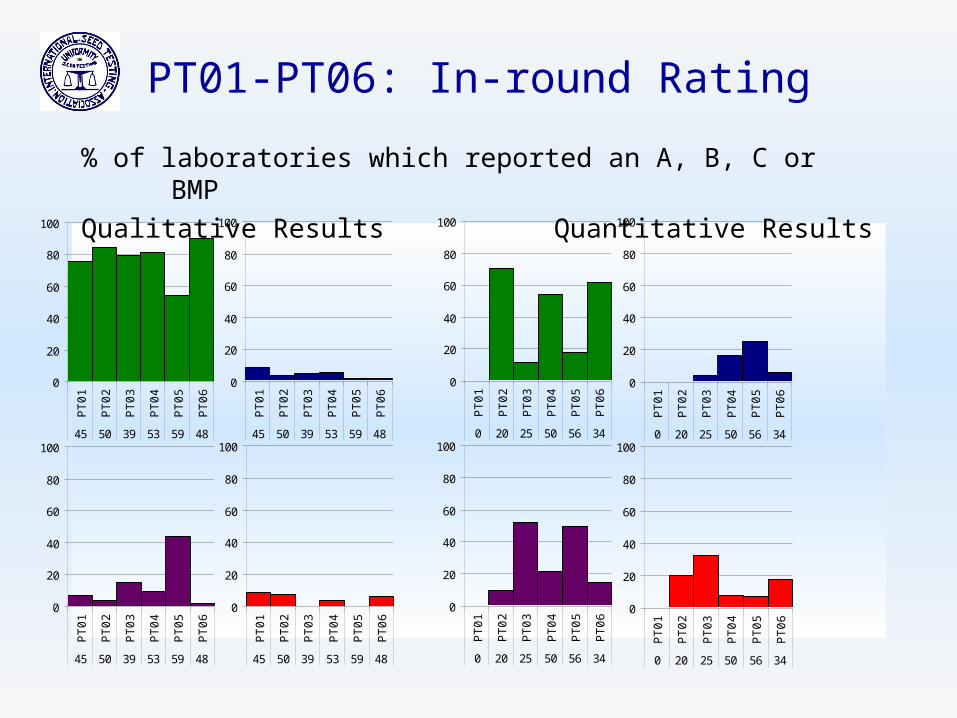
% of laboratories which reported an A, B, C or BMP
Qualitative Results Quantitative Results
PT01-PT06: In-round Rating
0
20
40
60
80
100
PT
01
PT
02
PT
03
PT
04
PT
05
PT
06
45 50 39 53 59 48
0
20
40
60
80
100
PT
01
PT
02
PT
03
PT
04
PT
05
PT
06
45 50 39 53 59 48
0
20
40
60
80
100
PT
01
PT
02
PT
03
PT
04
PT
05
PT
06
45 50 39 53 59 48
0
20
40
60
80
100
PT
01
PT
02
PT
03
PT
04
PT
05
PT
06
45 50 39 53 59 48
0
20
40
60
80
100
PT
01
PT
02
PT
03
PT
04
PT
05
PT
06
0 20 25 50 56 34
0
20
40
60
80
100
PT
01
PT
02
PT
03
PT
04
PT
05
PT
06
0 20 25 50 56 34
0
20
40
60
80
100
PT
01
PT
02
PT
03
PT
04
PT
05
PT
06
0 20 25 50 56 34
0
20
40
60
80
100
PT
01
PT
02
PT
03
PT
04
PT
05
PT
06
0 20 25 50 56 34

Rating System for 6 PTs based on the in-round rating values
Qualitative Results
Quantitative Results
PT01-PT06: Overall Rating
One testrating
One testScore Value
Overall ratingon six tests
Range onsix tests
# of labs (min. 4 rounds) 6 5 4
A 5 points A 28-30 points 10 10 - -
B 4 points B 27-21points 14 2 12 -C 3 points C 16-20 points 8 - 2 6
BMP 0 points BMP <16 points 2 - - 2
One testrating
One testScore Value
Overall ratingon six tests
Range onsix tests
# of labs (min. 4 rounds) 6 5 4
A 5 points A 28-30 points 0 - - -
B 4 points B 27-21points 5 - 5 -C 3 points C 16-20 points 5 - 1 4
BMP 0 points BMP <16 points 9 - 2 7
4. Performance Data Evaluation
for presence of seed with specified trait(s) in seed lots and specified trait purity
• Laboratory can choose an established and reliable method
• The «Performance Based Approach» is used instead of «one ISTA validated method»(not published in the ISTA Rules)
• Laboratory needs to demonstrate to ISTA accreditation team its ability to perform well with the method routinely used
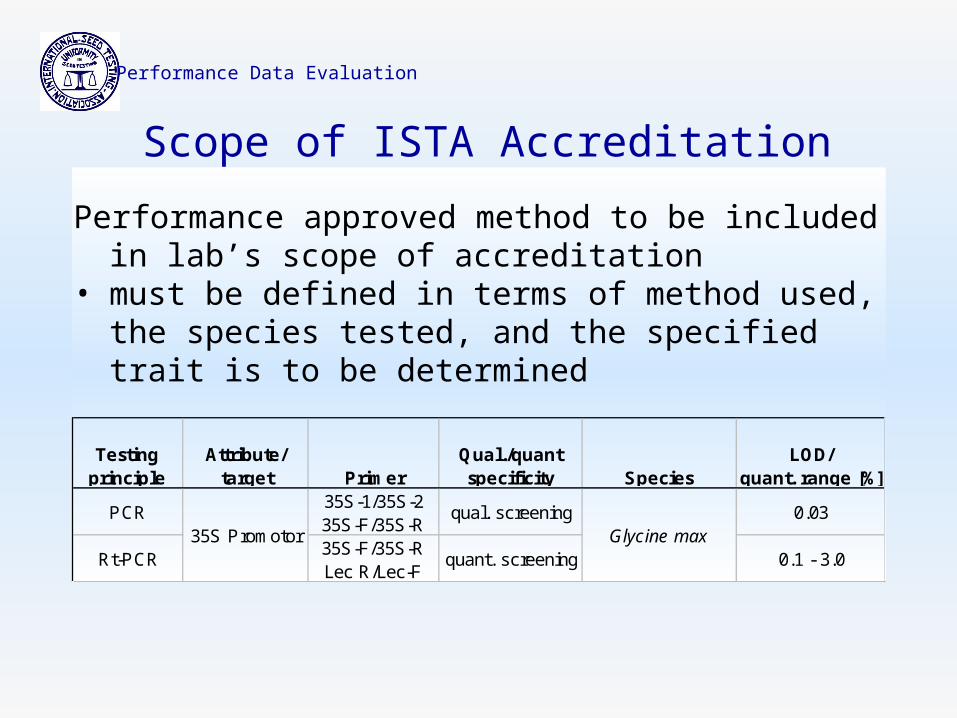
Performance approved method to be included in lab’s scope of accreditation
• must be defined in terms of method used, the species tested, and the specified trait is to be determined
Performance Data Evaluation
Scope of ISTA Accreditation
Testingprinciple
Attribute/target Primer
Qual./quantspecificity Species
LOD/quant. range [%]
PCR35S-1/35S-235S-F/35S-R
qual. screening 0.03
Rt-PCR35S-F/35S-RLec R/Lec-F
quant. screening 0.1 - 3.035S Promotor Glycine max

Evaluation of Performance Data for each combination species, test method and trait!
For some combinations a PD has to be performed (on seeds, defined number of samples, defined spiking levels)
For other combinations suitable alternative Performance Data may be used(any other data providing effidence that accuracy and repeatability criteria are met)
Performance Data Evaluation
Relevant PD Documents
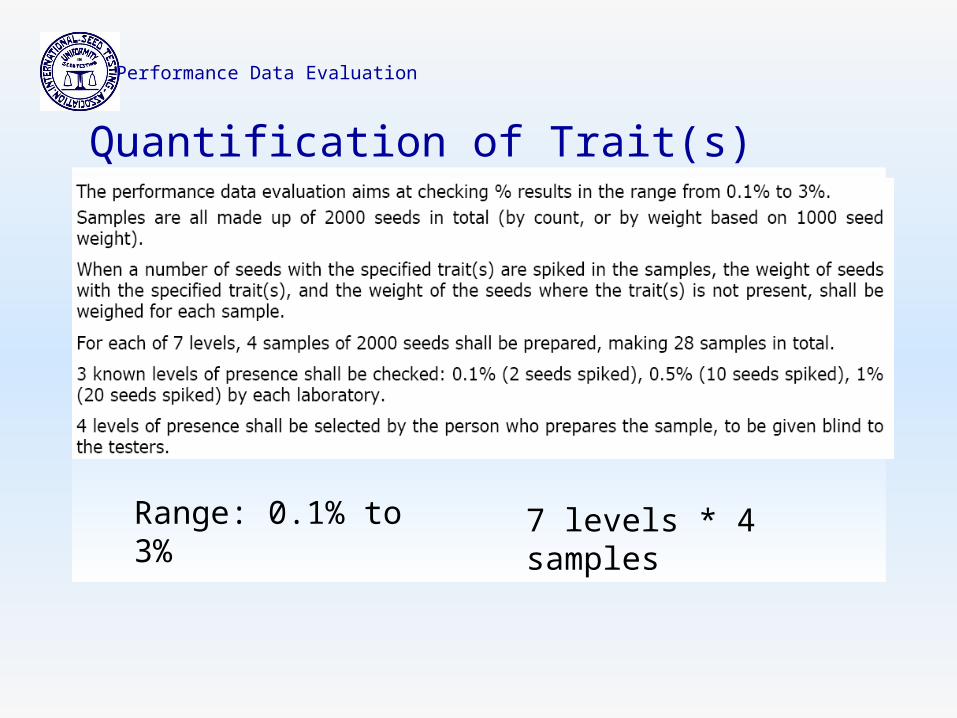
Quantification of Trait(s)
Performance Data Evaluation
Range: 0.1% to 3% 7 levels * 4 samples
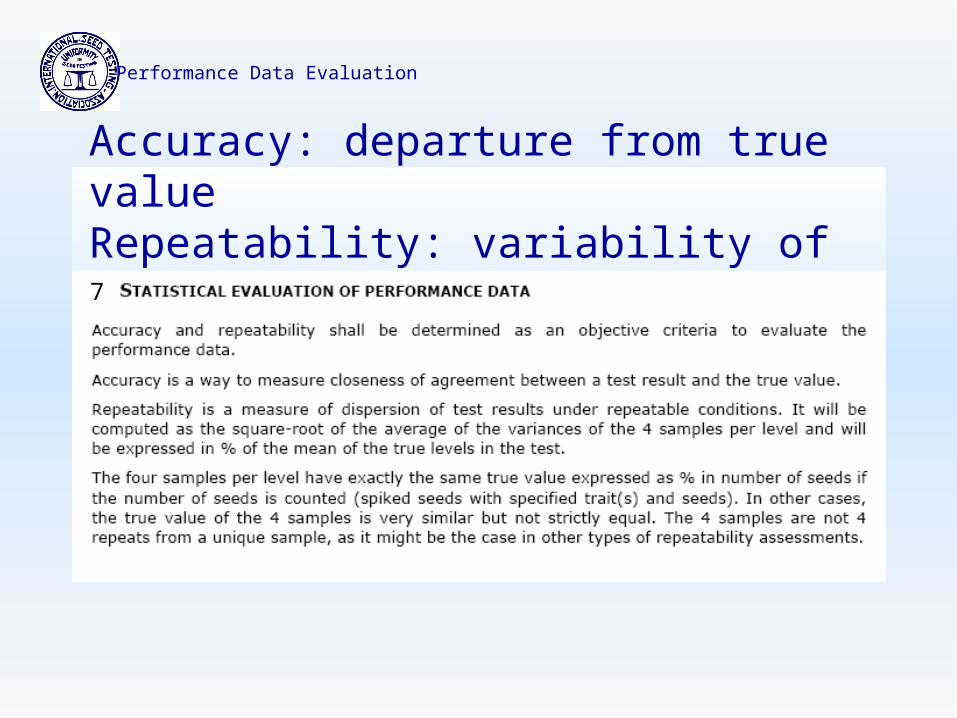
Accuracy: departure from true valueRepeatability: variability of results by level
Performance Data Evaluation
7
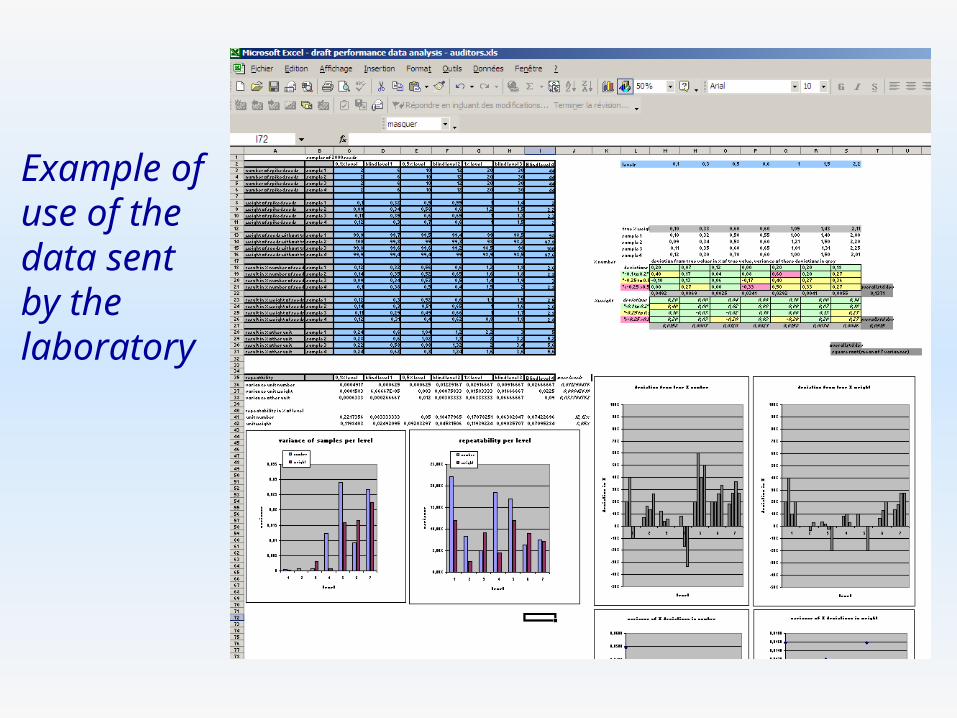
Example of use of the data sent by the laboratory
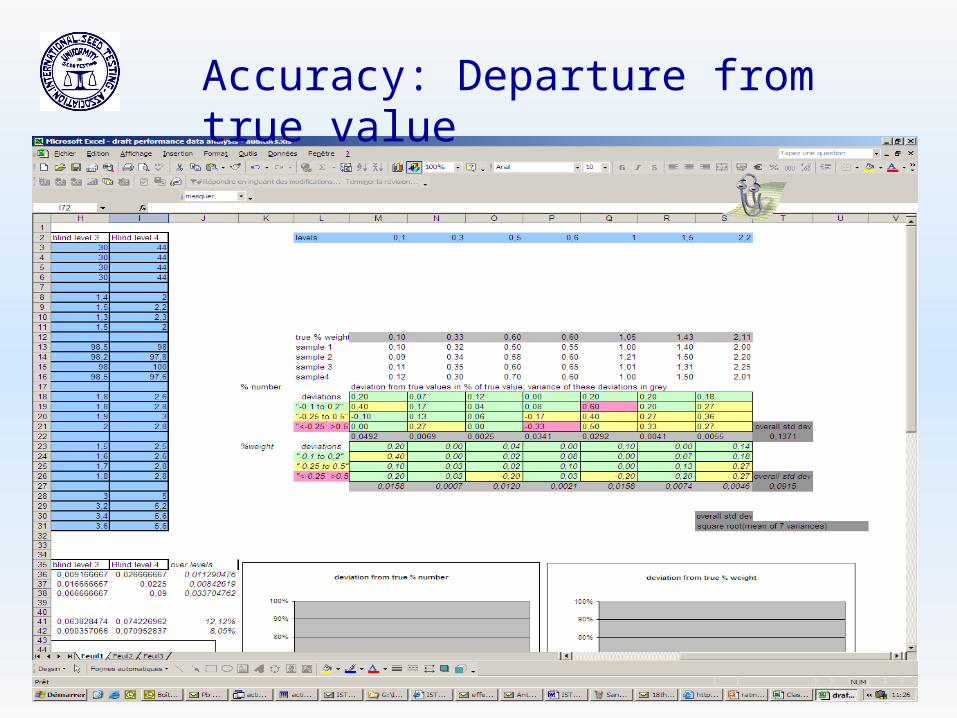
Accuracy: Departure from true value
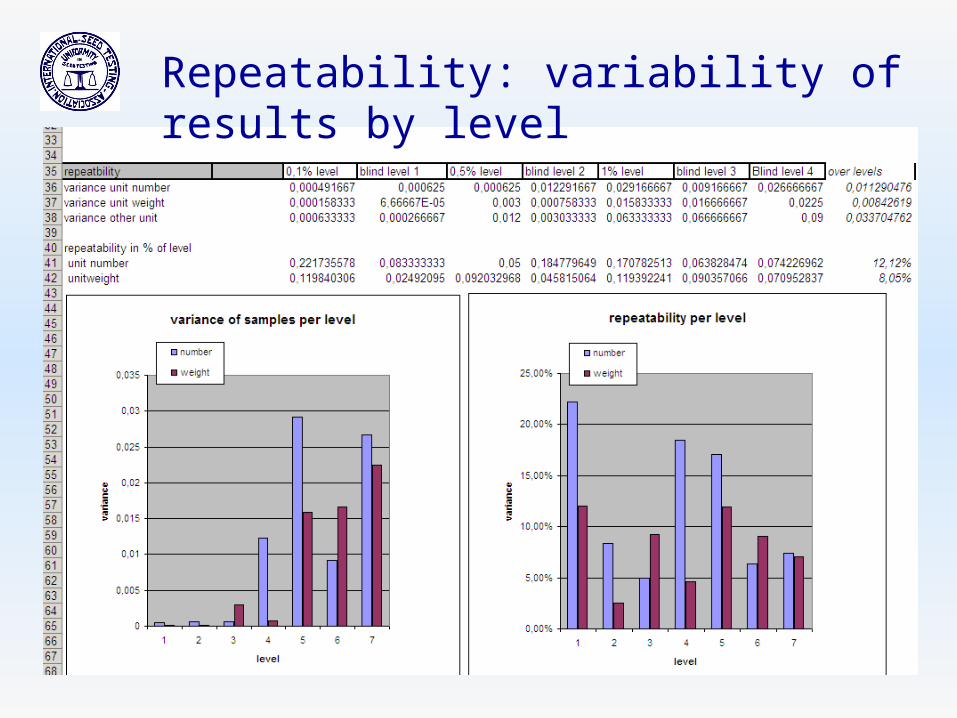
Repeatability: variability of results by level
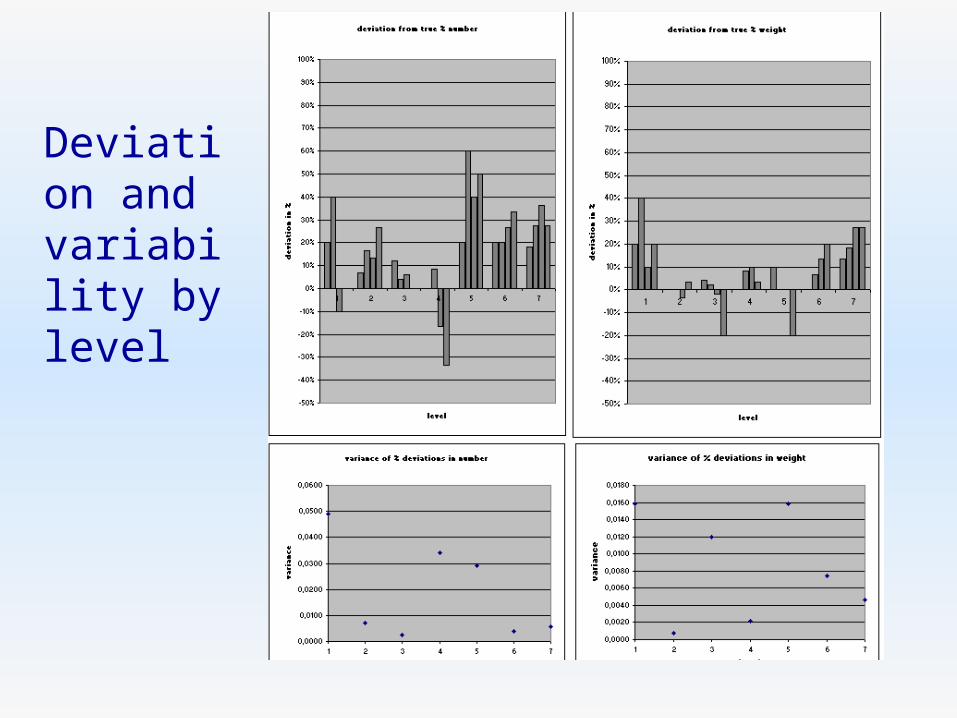
Deviation and variability by level
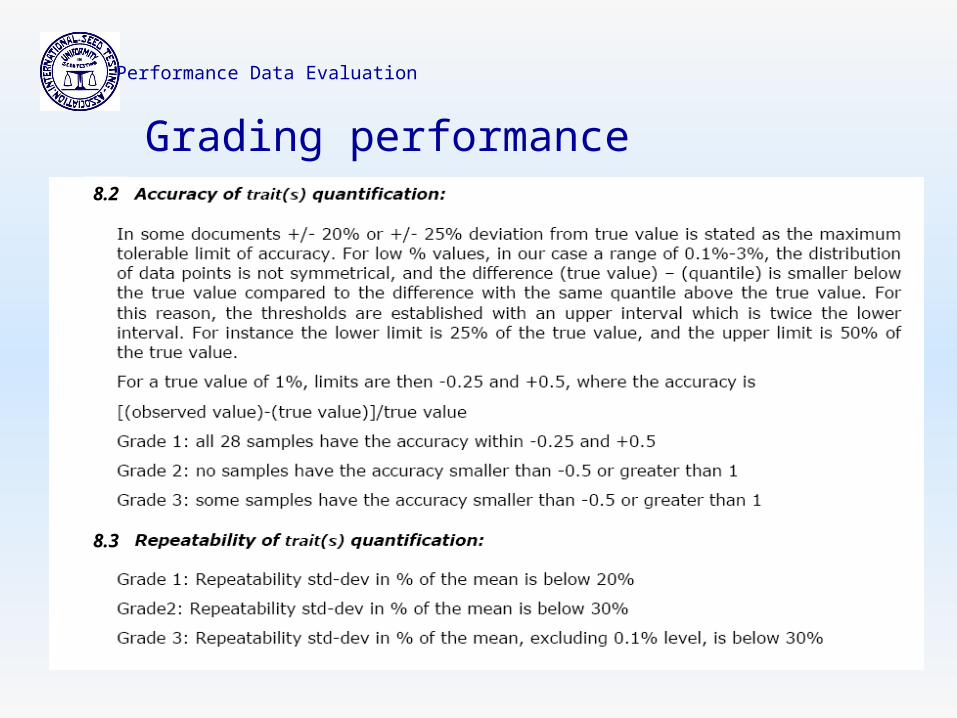
Grading performance
Performance Data Evaluation
8.2
8.3

Audit
• Auditors assess whether implementation aspects are appropriately addressed and whether practice complies with the documented procedures
• To that effect, training, equipment management, facilities, reporting and running the overall quality managements system will be assessed
• A complete practical demonstration of any performance approved method will not be required
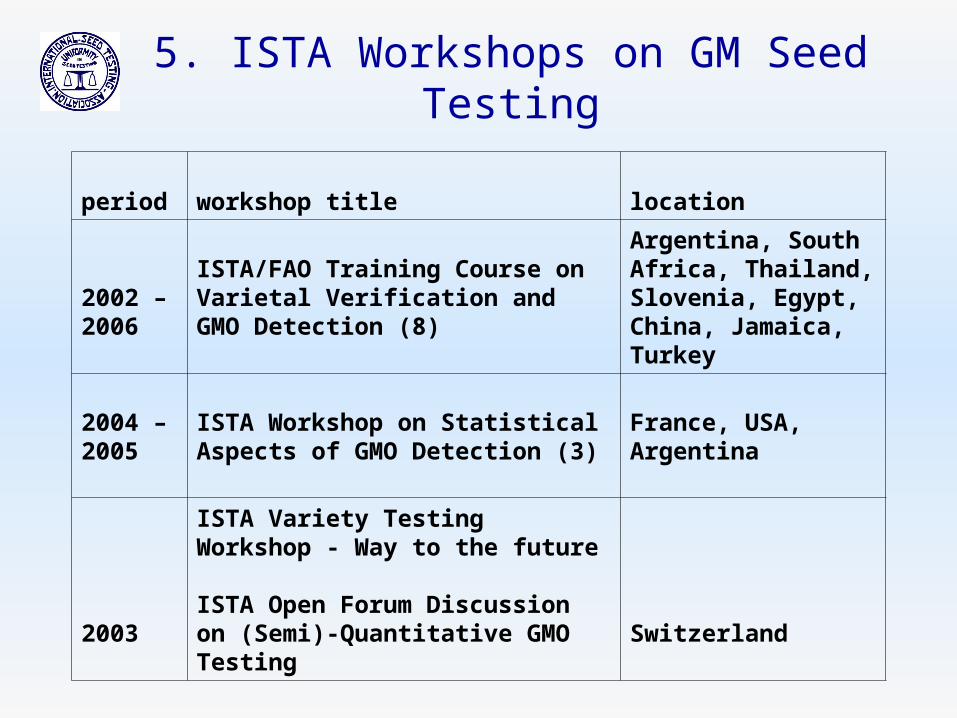
5. ISTA Workshops on GM Seed Testing
period workshop title location
2002 – 2006
ISTA/FAO Training Course on Varietal Verification and GMO Detection (8)
Argentina, South Africa, Thailand, Slovenia, Egypt, China, Jamaica, Turkey
2004 – 2005
ISTA Workshop on Statistical Aspects of GMO Detection (3)
France, USA, Argentina
2003
ISTA Variety Testing Workshop - Way to the future
ISTA Open Forum Discussion on (Semi)-Quantitative GMO Testing
Switzerland
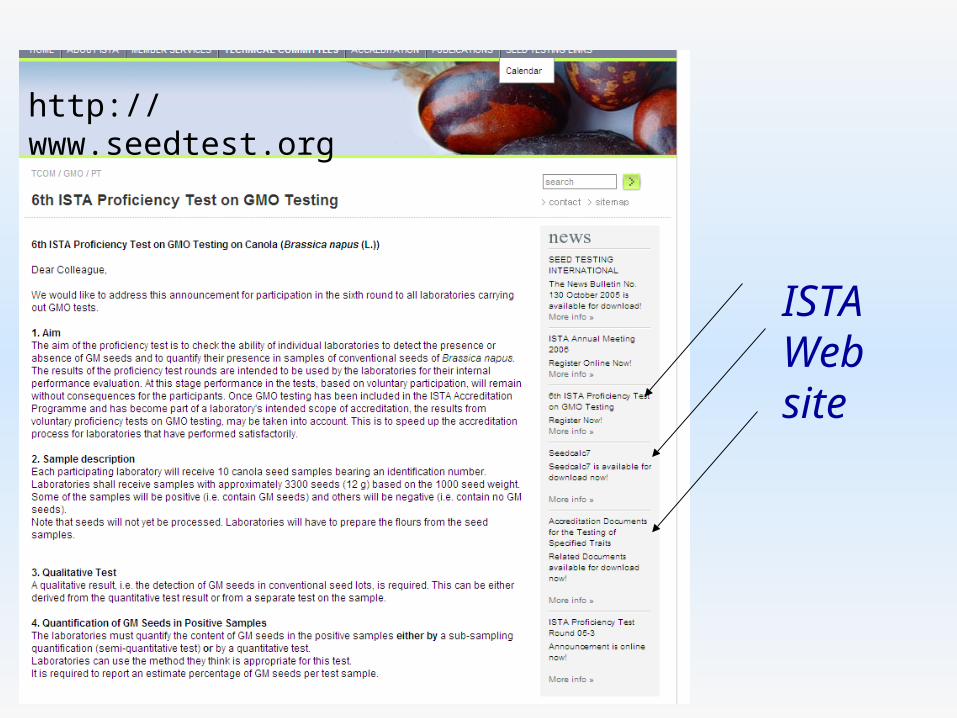
ISTA Web site
http://www.seedtest.org