it helps economies integrate global value chains and...
TRANSCRIPT
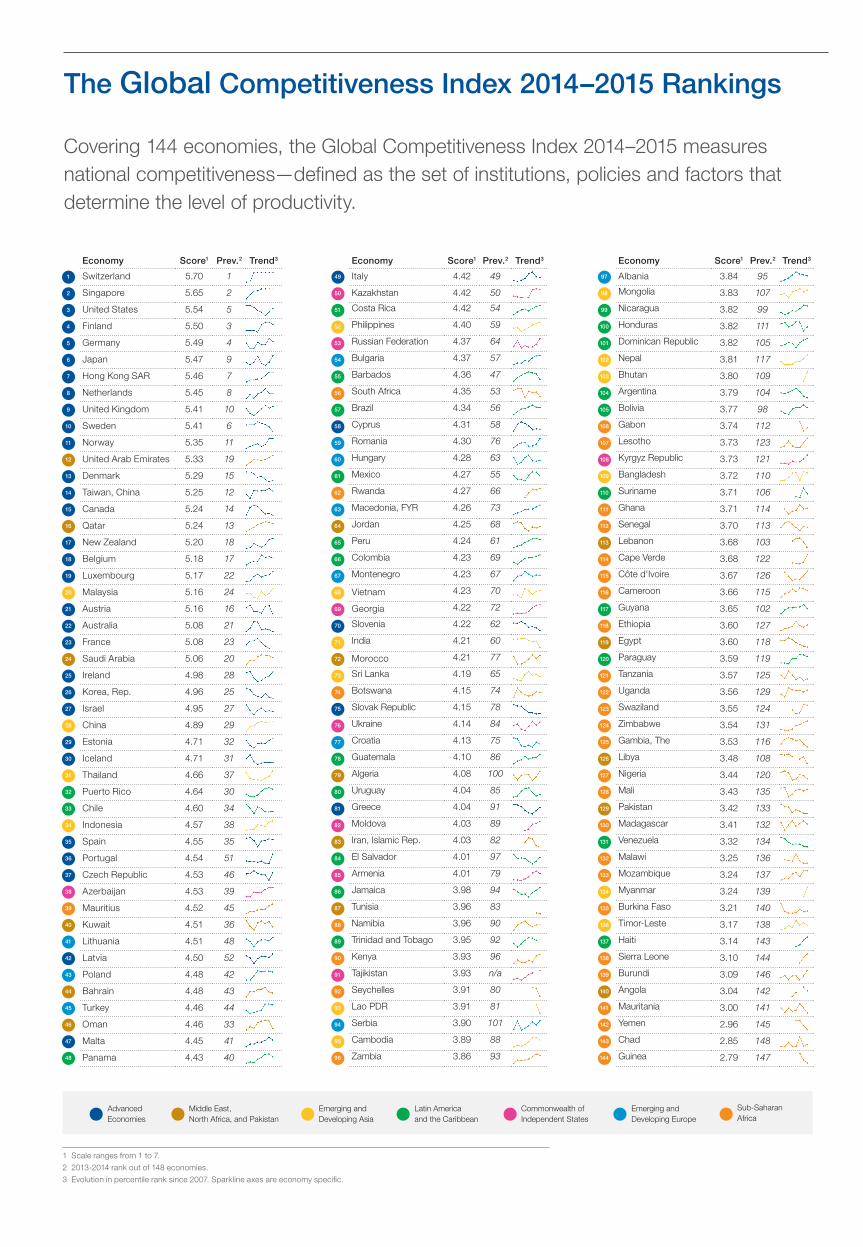
The Global Competitiveness Index 2014–2015 Rankings
Covering 144 economies, the Global Competitiveness Index 2014–2015 measures national competitiveness—defined as the set of institutions, policies and factors that determine the level of productivity.
1
10
19
28
37
46
4
13
22
31
40
7
16
25
34
43
2
11
20
29
38
47
5
14
23
32
41
8
17
26
35
44
3
12
21
30
39
48
6
15
24
33
42
9
18
27
36
45
Economy Score1 Prev.2 Trend3
Switzerland 5.70 1
Singapore 5.65 2
United States 5.54 5
Finland 5.50 3
Germany 5.49 4
Japan 5.47 9
Hong Kong SAR 5.46 7
Netherlands 5.45 8
United Kingdom 5.41 10
Sweden 5.41 6
Norway 5.35 11
United Arab Emirates 5.33 19
Denmark 5.29 15
Taiwan, China 5.25 12
Canada 5.24 14
Qatar 5.24 13
New Zealand 5.20 18
Belgium 5.18 17
Luxembourg 5.17 22
Malaysia 5.16 24
Austria 5.16 16
Australia 5.08 21
France 5.08 23
Saudi Arabia 5.06 20
Ireland 4.98 28
Korea, Rep. 4.96 25
Israel 4.95 27
China 4.89 29
Estonia 4.71 32
Iceland 4.71 31
Thailand 4.66 37
Puerto Rico 4.64 30
Chile 4.60 34
Indonesia 4.57 38
Spain 4.55 35
Portugal 4.54 51
Czech Republic 4.53 46
Azerbaijan 4.53 39
Mauritius 4.52 45
Kuwait 4.51 36
Lithuania 4.51 48
Latvia 4.50 52
Poland 4.48 42
Bahrain 4.48 43
Turkey 4.46 44
Oman 4.46 33
Malta 4.45 41
Panama 4.43 40
51
60
69
78
87
96
54
63
72
81
90
57
66
75
84
93
52
61
70
79
88
55
64
73
82
91
58
67
76
94
53
62
71
80
89
56
65
74
83
92
59
68
77
86
95
Economy Score1 Prev.2 Trend3
Italy 4.42 49
Kazakhstan 4.42 50
Costa Rica 4.42 54
Philippines 4.40 59
Russian Federation 4.37 64
Bulgaria 4.37 57
Barbados 4.36 47
South Africa 4.35 53
Brazil 4.34 56
Cyprus 4.31 58
Romania 4.30 76
Hungary 4.28 63
Mexico 4.27 55
Rwanda 4.27 66
Macedonia, FYR 4.26 73
Jordan 4.25 68
Peru 4.24 61
Colombia 4.23 69
Montenegro 4.23 67
Vietnam 4.23 70
Georgia 4.22 72
Slovenia 4.22 62
India 4.21 60
Morocco 4.21 77
Sri Lanka 4.19 65
Botswana 4.15 74
Slovak Republic 4.15 78
Ukraine 4.14 84
Croatia 4.13 75
Guatemala 4.10 86
Algeria 4.08 100
Uruguay 4.04 85
Greece 4.04 91
Moldova 4.03 89
Iran, Islamic Rep. 4.03 82
El Salvador 4.01 97
Armenia 4.01 79
Jamaica 3.98 94
Tunisia 3.96 83
Namibia 3.96 90
Trinidad and Tobago 3.95 92
Kenya 3.93 96
Tajikistan 3.93 n/a
Seychelles 3.91 80
Lao PDR 3.91 81
Serbia 3.90 101
Cambodia 3.89 88
Zambia 3.86 93
101
110
119
128
137
104
113
122
131
140
107
116
125
134
143
102
111
120
129
138
105
114
123
132
141
108
117
126
135
144
103
112
121
130
139
106
115
124
133
142
109
118
127
136
Economy Score1 Prev.2 Trend3
Albania 3.84 95
Mongolia 3.83 107
Nicaragua 3.82 99
Honduras 3.82 111
Dominican Republic 3.82 105
Nepal 3.81 117
Bhutan 3.80 109
Argentina 3.79 104
Bolivia 3.77 98
Gabon 3.74 112
Lesotho 3.73 123
Kyrgyz Republic 3.73 121
Bangladesh 3.72 110
Suriname 3.71 106
Ghana 3.71 114
Senegal 3.70 113
Lebanon 3.68 103
Cape Verde 3.68 122
Côte d'Ivoire 3.67 126
Cameroon 3.66 115
Guyana 3.65 102
Ethiopia 3.60 127
Egypt 3.60 118
Paraguay 3.59 119
Tanzania 3.57 125
Uganda 3.56 129
Swaziland 3.55 124
Zimbabwe 3.54 131
Gambia, The 3.53 116
Libya 3.48 108
Nigeria 3.44 120
Mali 3.43 135
Pakistan 3.42 133
Madagascar 3.41 132
Venezuela 3.32 134
Malawi 3.25 136
Mozambique 3.24 137
Myanmar 3.24 139
Burkina Faso 3.21 140
Timor-Leste 3.17 138
Haiti 3.14 143
Sierra Leone 3.10 144
Burundi 3.09 146
Angola 3.04 142
Mauritania 3.00 141
Yemen 2.96 145
Chad 2.85 148
Guinea 2.79 147
Advanced Economies
Middle East, North Africa, and Pakistan
Emerging and Developing Asia
Latin America and the Caribbean
Commonwealth of Independent States
Emerging and Developing Europe
Sub-Saharan Africa
85
99
97
100
98
49
50
Competitiveness Report Series
Acknowledgements
The World Economic Forum’s Global Competitiveness and Benchmarking Network is pleased to acknowledge and thank its network of valued Partner Institutes, without which the realization of The Global Competitiveness Report 2014–2015 would not have been possible. Partner Institutes typically consist of leading research or academic institutes, business organizations, national competitiveness councils or recognized professional entities, committed to improving the competitiveness of their economy. By being responsible for the administration of the Executive Opinion Survey in their countries, the Partner Institutes provide the Forum with a representative sample of data, which allows the research to be carried out.
Switzerland91-93 route de la Capite,CH-1223 Cologny/Geneva
T +41 (0) 22 869 1212F +41 (0) 22 786 [email protected]
weforum.org/gcr
Since 1979, through its research on competitiveness and associated publications and outreach work, the Global Competitiveness and Benchmarking Network has provided governments, policy-makers, the business community and academia with invaluable insights into the policies, institutions and factors determining national competitiveness. Its research raises awareness and provides a platform for discussing these issues.
About the World Economic ForumThe World Economic Forum is an international institution committed to improving the state of the world through public-private cooperation. It engages political, business, academic and other leaders of society in collaborative efforts to shape global, regional and industry agendas. Together with other stakeholders, it works to define challenges, solutions and actions, always in the spirit of global citizenship. It was established in 1971 as a not-for-profit foundation and is headquartered in Geneva, Switzerland. It is independent and impartial, and is not tied to any special interests. It works in close cooperation with all major international organizations.
The Global Information Technology Report
This report provides a comprehensive assessment of “networked readiness”—how prepared an economy is to apply the benefits of ICT to promote economic growth and well-being.
The Global Enabling Trade Report
This report assesses the quality of policies, infrastructure and services facilitating the free flow of goods over borders and to their destinations. It helps economies integrate global value chains and companies into their investment decisions. It informs policy dialogue and provides a tool to monitor progress on certain aspects of global trade.
The Travel & Tourism Competitiveness Report
This report assesses economies based on the policies they are implementing to develop the travel and tourism sector. It explores how the travel and tourism industry has the potential to boost economic resilience and job creation, and examines a number of factors that continue to hinder its development.
1 Scale ranges from 1 to 7.
2 2013-2014 rank out of 148 economies.
3 Evolution in percentile rank since 2007. Sparkline axes are economy specific.
Insight Report
The GlobalCompetitiveness Report2014–2015Highlights