it is possible to predict sangiovese wine quality …
TRANSCRIPT
- 207 -J. Int. Sci. Vigne Vin, 2010, 44, n°4, 207-218
©Vigne et Vin Publications Internationales (Bordeaux, France)
IT IS POSSIBLE TO PREDICT SANGIOVESE WINEQUALITY THROUGH A LIMITED NUMBER OF VARIABLES MEASURED ON THE VINES
P. BUCELLI1, E. A.C. COSTANTINI1 and P. STORCHI2
1 : Agricultural Research Council, Research Centre for Agrobiology and Pedology,Piazza M. D’Azeglio, 30, 50121 Firenze, Italy
2 : Agricultural Research Council, Research Unit for Viticulture, Via Romea 53, 52020 Arezzo, Italy
*Corresponding author : [email protected]
Aims: The research work aimed at creating and testing a method to evaluatevine performance of Sangiovese (VPS), in particular, a method able topredict the potential oenological result through a limited number of variablesmeasured on the vines.
Methods and results: A matching table was created on the basis of literatureand the experience acquired over twenty years of research activity onSangiovese vine and wine quality in Tuscany, which allowed the selectionof eight viticultural parameters and three VPS classes. In order to validatethe matching table, a specific experiment was conducted during the years2002 and 2003 in 10 vineyards (selected from 7 farms) representative ofthe main soils and climates of the vine cultivation areas of the Province ofSiena (Italy). The experimental results validated the proposed matchingtable through a non parametric statistical analysis. A multivariate regressionanalysis between wine sensory evaluation (score) and viticultural parameterssignificantly predicted wine quality even with only 4 grape parameters(P < 0.05).
Conclusion: It was possible to predict VPS by means of a matching tablebased upon eight simple viticultural parameters. The reliability of the winequality prediction increased proportionally according to the number ofviticultural parameters, but remained rather high (R2 = 0.606) when takinginto account only sugar content, sugar accumulation rate, mean berryweight, and extractable polyphenol index (EPI).
Significance and impact of the study: It is now possible to predict thequality of Sangiovese wines with a few selected grape parameters. Becauseof the wide variability in soil and climatic condition of the viticultural areasof the Province of Siena, where the method was developed, and the strongclimatic contrast between the years when the method was validated, theuse of both matching table and multiple regression is recommended forVPS prediction in Mediterranean environments.
Key words: soil, vine performance, grape, red wine, Tuscany
Objectif: L’objectif de cette recherche est de créer et de tester une méthodepour évaluer la performance viticole du Sangiovese (PVS), une méthodepermettant de prévoir le résultat œnologique potentiel, par l’utilisationde paramètres viticoles facilement mesurables.
Méthodes et résultats: Une table de comparaison a été créée sur la basede la littérature et de l’expérience acquise pendant vingt années d’activitésde recherche sur le raisin et la qualité du vin Sangiovese en Toscane. Cecia permis la sélection de paramètres viticoles pour évaluer la PVS. La tablede comparaison a pris en considération huit paramètres viticoles. Un essai,pour valider la table de comparaison, a été mené en 2002 et 2003 dans10vignobles sélectionnés (à partir de 7 fermes), représentatifs des principauxterroirs et des climats de vignobles de la Province de Sienne. Les résultatsexpérimentaux ont validé la table de comparaison proposée par une analysestatistique non paramétrique. Une régression linéaire multivariée entrel’évaluation sensorielle du vin (score) et les paramètres viticoles a préditsignificativement la qualité du vin avec seulement quatre paramètresviticoles (P < 0.05).
Conclusion: Il a été possible de prévoir PVS par une table de comparaisonbasée sur huit paramètres viticoles simples. La fiabilité de la prédiction dela qualité du vin a varié proportionnellement en fonction du nombre desparamètres viticoles, mais est restée assez haute (R2 = 0.606) en prenanten compte la teneur en sucres, le taux d’accumulation du sucre, le poidsmoyen des baies et l’indice des polyphénols extractibles.
Signification et impact de l’étude: Il est maintenant possible de prévoirla qualité du Sangiovese avec peu de paramètres viticoles. À cause de lalarge variabilité du sol et des conditions climatiques des zones viticoles deProvince de Sienne, où la méthode a été développée, l’emploi de la tablede comparaison, ainsi que de la régression multiple est recommandé pourévaluer la PVS dans bien d’autres environnements méditerranéens.
Mots-clés: sol, vigne performance, raisin, vin rouge, Toscane
Abstract Résumé
manuscript received the 4th June 2009 - revised manuscript received the 4th November 2010
bucelli 24/12/10 14:10 Page 207
- 208 -J. Int. Sci. Vigne Vin, 2010, 44, n°4, 207-218©Vigne et Vin Publications Internationales (Bordeaux, France)
P. BUCELLI et al.
INTRODUCTION
The viticulture and oenology of Tuscany (central Italy)are the outcome of a secular tradition which shaped theregion’s landscape and deeply affected the socio-economicdevelopment of hilly agriculture. In Tuscany, Sangioveseis the main cultivar in the regional ampelographic outline:it is a major component in 33 denominations of origin(DOC and DOCG) and it occupies more than 60 % of thetotal vineyard surface. Its reputation is increasing, bothin Italy and internationally (Fregoni, 2006). The DOCvineyards of Siena (Central Tuscany) comprise about14,500 ha and produce some of the world’s mostrenowned red wines, such as Brunello di Montalcino,Chianti and Chianti Classico, and Nobile diMontepulciano, all of which use Sangiovese as the maingrape variety (Caldano and Rossi, 2008).
The territory of Siena has a prominent viticulturalvocation. However, it is also well known that its highenvironmental variability has a huge influence over theviticultural and oenological results, mainly in the case ofthose varieties, such as Sangiovese, which have no strictgenetic control over their vegetative and productivebehaviours (Storchi et al., 1995). In fact, Sangiovese hasa genotypic ability to limit the negative effects of waterstress, reducing the transpiring leaf surface by means ofpermanent and irreversible adaptations of the oldest leaves(Palliotti et al., 2008). On account of that, the quality ofSangiovese wines is very dependent on the interactionbetween the climatical trend of the year and the soilcharacteristics.
The current target oenological model for Sangiovesewines, that is, what most winemakers try to obtain, ischaracterized by an alcohol content of about 12 °, a rubyred color with high color intensity and levels of totalpolyphenols (> 7.50 nm and > 2,000 mg L-1, respectively),fine aromas of violet, blackberry and plum, and a well-balanced and persistent mouth feel.
Differences in yield and grape parameters are linkedto viticultural management, climate and soil variations,and correspond to distinctive wine characteristics andquality. The term “vine performance of Sangiovese”(VPS) was used to define the vegetative and productivebehaviour of this vine variety in a specific year and soil.
The evaluation of the oenological result in a particularyear and plot is necessary if one wishes to assess therelationships between quality of Sangiovese wines andland characteristics. The evaluation can be obtained bymeans of a standardized oenological technique, such assmall scale wine making. In this way it is possible to carryout a more reliable comparison of the wines, as thevariability factors present in industrial wine making arecontrolled. It is also possible to perform a sensory
evaluation of the wine made exclusively with the grapesof a particular plot (Gigliotti and Bucelli, 1990). However,the high specialization of small scale wine making limitsits application to only experimental cellars. It is thereforenecessary to use some parameters measured on vine andgrape as predictors of potential wine quality. Theparameters must be reliable, i. e. correlated to wine quality,sensitive, reproducible, and relatively easy to measure.
Lanyon et al. (2004) reported studies on grapecomponent characteristics and wine quality. In particular,they found that the most valuable predictors were berryweight, berry sugar content, juice malate level, totalanthocyanins and phenolics in berries or juice, and totalglycosyl-glucose bound precursors. In Italy, therelationship between the vine performance of Sangioveseand its oenological result has been previously studied byBertuccioli et al. (1998) in the Chianti Classico area. Theyfound that some parameters indicating the quality ofSangiovese wines, such as alcoholic degree, pH, totalacidity, ashes, total anthocyanins, and total phenols andtheir fractions, were correlated with the mean clusterweight, the number of buds per vine left at pruning, theonset of veraison and the total shoot length. More recently,Bertuccioli (2006) highlighted the relationship betweenthe global quality (as score) of Sangiovese wines and theirphenolic content. Since the latter parameter is correlatedto extractable anthocyanins of grapes, their evaluationallows to predict the phenolic content of the correspondingwines and to estimate their global quality.
The aim of this work was to create and test a methodto evaluate VPS on the basis of a limited number of easilymeasurable viticultural parameters.
MATERIALS AND METHODS
1. The matching table
The methodology followed the suggestions proposedby the Food and Agriculture Organization (FAO) toevaluate land suitability for different agricultural crops(FAO, 1976). The FAO system foresees the creation of amatching table to compare predictor and responsevariables. In the proposed matching table for Sangiovese,the selected measurable parameters of vine and grape(predictors) were classified according to their expectedinfluence on the response variable, namely the quality ofthe Sangiovese wine. The selection and classification ofthe predictors made use of the experience obtained inmany years of trials conducted in the Province of Siena,Montepulciano and the Chianti Classico area (Storchiet al., 1995 and 2005; Costantini et al., 1996 and 2010;Bucelli et al., 1999 and 2006; Egger et al., 1999).
bucelli 24/12/10 14:10 Page 208
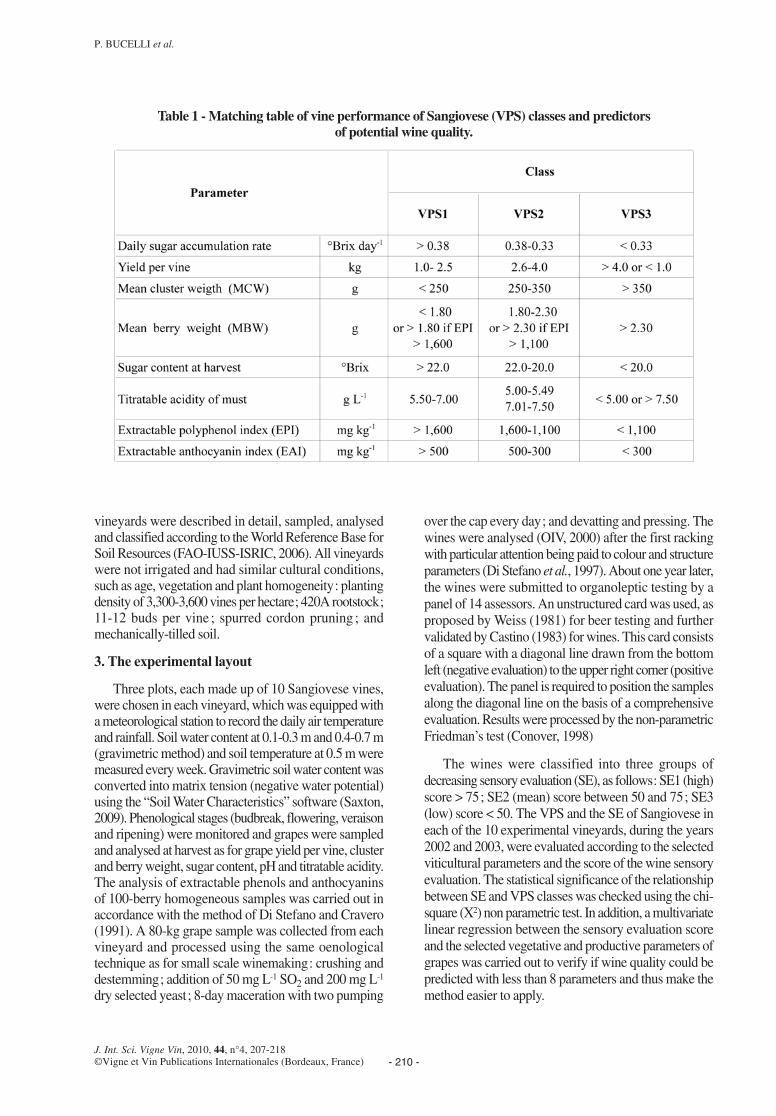
The viticultural parameters selected for theachievement of a high quality Sangiovese wine were thefollowing:
- Sugar accumulation rate from veraison to harvest in°Brix day-1. The target wine should have values higherthan 0.38 °Brix day-1. Lower values indicate suboptimalnutrition during ripening, such an excess of water ornitrogen after veraison or close to harvest;
- Sugar content of must in °Brix. The optimum valueis higher than 22 °Brix. Values lower than 20.0 °Brix areinsufficient to obtain a high quality wine;
- Grape yield per vine in kg. The target value isbetween 1.0 and 2.5 kg, depending on vine density. Themore this level is exceeded, the less positive is theoenological result, because of juice dilution. However,yields lower than 1 kg per vine are not economicallycompatible with the planting density in use in this area(about 3,500 vines per hectare);
- Mean cluster weight in g. The best wines are obtainedwhen the value is in the range between 250 to 300 g :heavier clusters generally show excessive compactnessand less coloured internal berries, because of shading;
- Mean berry weight in g. This is a very importantparameter for the quality of red wines: heavier berries(bigger berries) reduce the surface to volume ratio to the detriment of polyphenolic content. The optimumvalue is less than 1.80 g, or between 1.80 and 2.30 g if the level of extractable polyphenols is higher than1,600 mg kg-1;
- Must titratable acidity as tartaric acid g L-1. Theoptimum value for a well organoleptically-balanced wineranges from 5.50 to 7.50 g L-1;
- Extractable polyphenol index (EPI) from berry skinas (+)catechin mg kg-1, in accordance with Di Stefanoand Cravero methodology (1991). The reference value ishigher than 1,600 mg kg-1, indicating a high potential forwell structured and full-bodied wines;
- Extractable anthocyanin index (EAI) from berry skinas (+)malvidine-3-glucoside mg kg-1, in accordance withDi Stefano and Cravero methodology (1991). Grapeshaving values higher than 500 mg kg-1 generally producewell coloured wines.
The values of the selected parameters were then usedto define three classes of VPS, corresponding to threelevels of potential wine quality. The thresholds betweenclasses were determined on the basis of the experienceacquired during twenty years of research activity onSangiovese vine and wine quality in Tuscany and theextensive literature on the subject, in particular, the
following publications: Boselli et al. (2001) and Scalabrelliet al. (2001) studied the productive and vegetativeparameters of Sangiovese grapevines during the 1993-1998 period in the Chianti Classico area (yield per vine;cluster and berry weight; sugar content at harvest; musttotal acidity); Bucelli (2001) evaluated the extractableanthocyanin and polyphenol index from the berry skin of6 Sangiovese clones in the Province of Siena; Storchiet al. (2001) studied the carpometric and analyticalcharacteristics of 11 Sangiovese biotypes and clones inthe Chianti area; and Scalabrelli et al. (2006) evaluatedthe agronomic behaviour of Sangiovese vines in11 vineyards of the Chianti Classico area for 3 years (1997-1999) considering yield per vine, cluster and berry weight,sugar content at harvest, must total acidity, and polyphenoland anthocyanin content of berries at harvest.
The matching table presenting the selected parametersclassified into three classes of decreasing vine performance(VPS1, VPS2 and VPS3) is reported in table 1.
2. The experimental sites
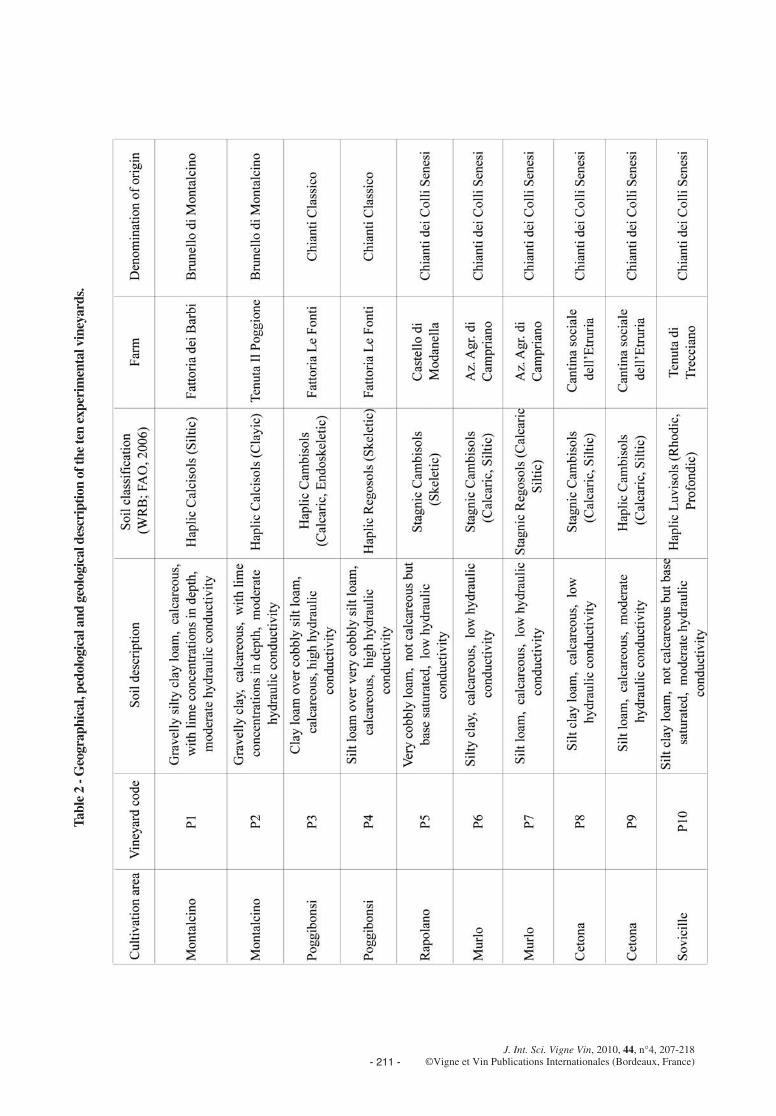
The matching table was validated in a specificexperiment conducted during the years 2002 and 2003 in10 vineyards located in the Province of Siena, Italy. Theselected vineyards were chosen as representative of themain soils and climates of the vine cultivation area aftera survey of the whole province (Costantini et al., 2006aand b).
In the vine cultivation areas of the Province of Siena,air temperature ranges from 13.5 to 14,8 °C, with amaximum in July and a minimum in January, and littleyearly and monthly standard deviations of the long-termmeans. The long-term mean annual rainfall is between730 and 850 mm, with high yearly and monthly standarddeviations. The wetter months are usually October,November and December. The hilly territory, wherevineyards are mostly concentrated, was formed in differentgeological eras and presents extremely variablecharacteristics. The low-lying areas consist of soils formedby the deposit of alluvial material with a deep rootingpotential, dating from the Quaternary Period. Furtheruphill, on the Pliocene and Miocene marine sediments,the soils are mainly clayey and enriched by calcareousfossil material, but they are often rather thin due to severewater erosion. In the upper part of the territory, the soilsare formed in older geological formations and they areusually moderately stony and sandy, rich in lime, andintermixed with wide areas of clayey and rocky soils.Paleosols are rather frequent on structural and fluvialterraces, in karst depressions but also on dissected surfacesand slopes (Costantini et al., 2006b).
The 10 experimental vineyards were situated on7 different farms (Table 2). The soils of the selected
- 209 -J. Int. Sci. Vigne Vin, 2010, 44, n°4, 207-218
©Vigne et Vin Publications Internationales (Bordeaux, France)
bucelli 24/12/10 14:10 Page 209
vineyards were described in detail, sampled, analysedand classified according to the World Reference Base forSoil Resources (FAO-IUSS-ISRIC, 2006). All vineyardswere not irrigated and had similar cultural conditions,such as age, vegetation and plant homogeneity: plantingdensity of 3,300-3,600 vines per hectare; 420A rootstock;11-12 buds per vine ; spurred cordon pruning ; andmechanically-tilled soil.
3. The experimental layout
Three plots, each made up of 10 Sangiovese vines,were chosen in each vineyard, which was equipped witha meteorological station to record the daily air temperatureand rainfall. Soil water content at 0.1-0.3 m and 0.4-0.7 m(gravimetric method) and soil temperature at 0.5 m weremeasured every week. Gravimetric soil water content wasconverted into matrix tension (negative water potential)using the “Soil Water Characteristics” software (Saxton,2009). Phenological stages (budbreak, flowering, veraisonand ripening) were monitored and grapes were sampledand analysed at harvest as for grape yield per vine, clusterand berry weight, sugar content, pH and titratable acidity.The analysis of extractable phenols and anthocyaninsof 100-berry homogeneous samples was carried out inaccordance with the method of Di Stefano and Cravero(1991). A 80-kg grape sample was collected from eachvineyard and processed using the same oenologicaltechnique as for small scale winemaking: crushing anddestemming; addition of 50 mg L-1 SO2 and 200 mg L-1
dry selected yeast; 8-day maceration with two pumping
over the cap every day; and devatting and pressing. Thewines were analysed (OIV, 2000) after the first rackingwith particular attention being paid to colour and structureparameters (Di Stefano et al., 1997). About one year later,the wines were submitted to organoleptic testing by apanel of 14 assessors. An unstructured card was used, asproposed by Weiss (1981) for beer testing and furthervalidated by Castino (1983) for wines. This card consistsof a square with a diagonal line drawn from the bottomleft (negative evaluation) to the upper right corner (positiveevaluation). The panel is required to position the samplesalong the diagonal line on the basis of a comprehensiveevaluation. Results were processed by the non-parametricFriedman’s test (Conover, 1998)
The wines were classified into three groups ofdecreasing sensory evaluation (SE), as follows: SE1 (high)score > 75; SE2 (mean) score between 50 and 75; SE3(low) score < 50. The VPS and the SE of Sangiovese ineach of the 10 experimental vineyards, during the years2002 and 2003, were evaluated according to the selectedviticultural parameters and the score of the wine sensoryevaluation. The statistical significance of the relationshipbetween SE and VPS classes was checked using the chi-square (X2) non parametric test. In addition, a multivariatelinear regression between the sensory evaluation scoreand the selected vegetative and productive parameters ofgrapes was carried out to verify if wine quality could bepredicted with less than 8 parameters and thus make themethod easier to apply.
- 210 -J. Int. Sci. Vigne Vin, 2010, 44, n°4, 207-218©Vigne et Vin Publications Internationales (Bordeaux, France)
P. BUCELLI et al.
Table 1 - Matching table of vine performance of Sangiovese (VPS) classes and predictors of potential wine quality.
bucelli 24/12/10 14:10 Page 210
- 211 -J. Int. Sci. Vigne Vin, 2010, 44, n°4, 207-218
©Vigne et Vin Publications Internationales (Bordeaux, France)
Tabl
e 2
- Geo
grap
hica
l, pe
dolo
gica
l and
geo
logi
cal d
escr
iptio
n of
the
ten
expe
rim
enta
l vin
eyar
ds.
bucelli 24/12/10 14:10 Page 211
RESULTS AND DISCUSSION
1. Climate and pedoclimate during the studied years
The experiment was carried out in 2002 and 2003 in10 vineyards located in the Province of Siena, Italy. Theselected vineyards, annotated P1 to P10, are listed intable 2.
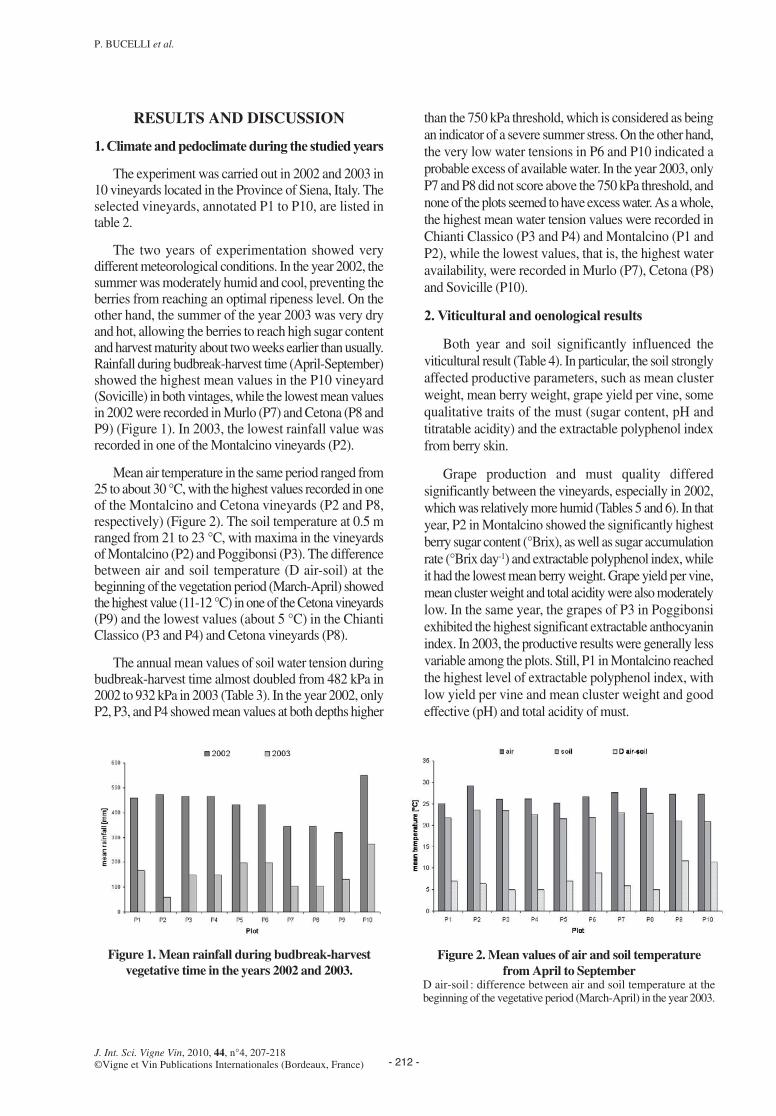
The two years of experimentation showed verydifferent meteorological conditions. In the year 2002, thesummer was moderately humid and cool, preventing theberries from reaching an optimal ripeness level. On theother hand, the summer of the year 2003 was very dryand hot, allowing the berries to reach high sugar contentand harvest maturity about two weeks earlier than usually.Rainfall during budbreak-harvest time (April-September)showed the highest mean values in the P10 vineyard(Sovicille) in both vintages, while the lowest mean valuesin 2002 were recorded in Murlo (P7) and Cetona (P8 andP9) (Figure 1). In 2003, the lowest rainfall value wasrecorded in one of the Montalcino vineyards (P2).
Mean air temperature in the same period ranged from25 to about 30 °C, with the highest values recorded in oneof the Montalcino and Cetona vineyards (P2 and P8,respectively) (Figure 2). The soil temperature at 0.5 mranged from 21 to 23 °C, with maxima in the vineyardsof Montalcino (P2) and Poggibonsi (P3). The differencebetween air and soil temperature (D air-soil) at thebeginning of the vegetation period (March-April) showedthe highest value (11-12 °C) in one of the Cetona vineyards(P9) and the lowest values (about 5 °C) in the ChiantiClassico (P3 and P4) and Cetona vineyards (P8).
The annual mean values of soil water tension duringbudbreak-harvest time almost doubled from 482 kPa in2002 to 932 kPa in 2003 (Table 3). In the year 2002, onlyP2, P3, and P4 showed mean values at both depths higher
than the 750 kPa threshold, which is considered as beingan indicator of a severe summer stress. On the other hand,the very low water tensions in P6 and P10 indicated aprobable excess of available water. In the year 2003, onlyP7 and P8 did not score above the 750 kPa threshold, andnone of the plots seemed to have excess water. As a whole,the highest mean water tension values were recorded inChianti Classico (P3 and P4) and Montalcino (P1 andP2), while the lowest values, that is, the highest wateravailability, were recorded in Murlo (P7), Cetona (P8)and Sovicille (P10).
2. Viticultural and oenological results
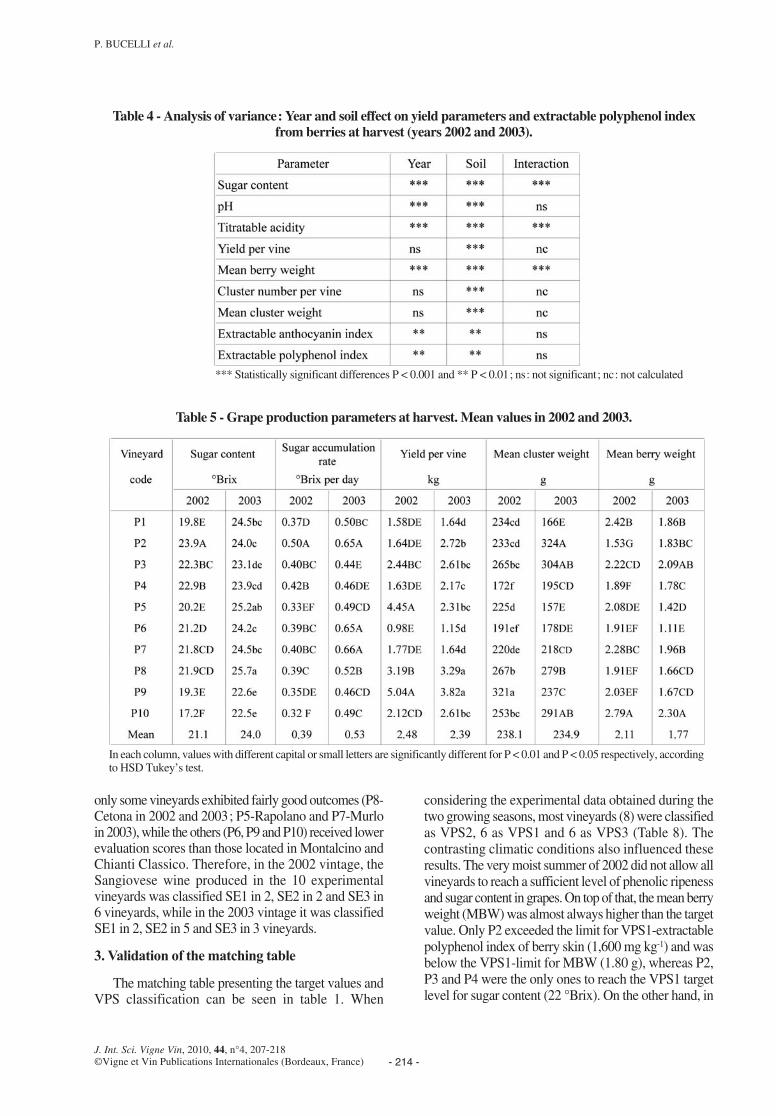
Both year and soil significantly influenced theviticultural result (Table 4). In particular, the soil stronglyaffected productive parameters, such as mean clusterweight, mean berry weight, grape yield per vine, somequalitative traits of the must (sugar content, pH andtitratable acidity) and the extractable polyphenol indexfrom berry skin.
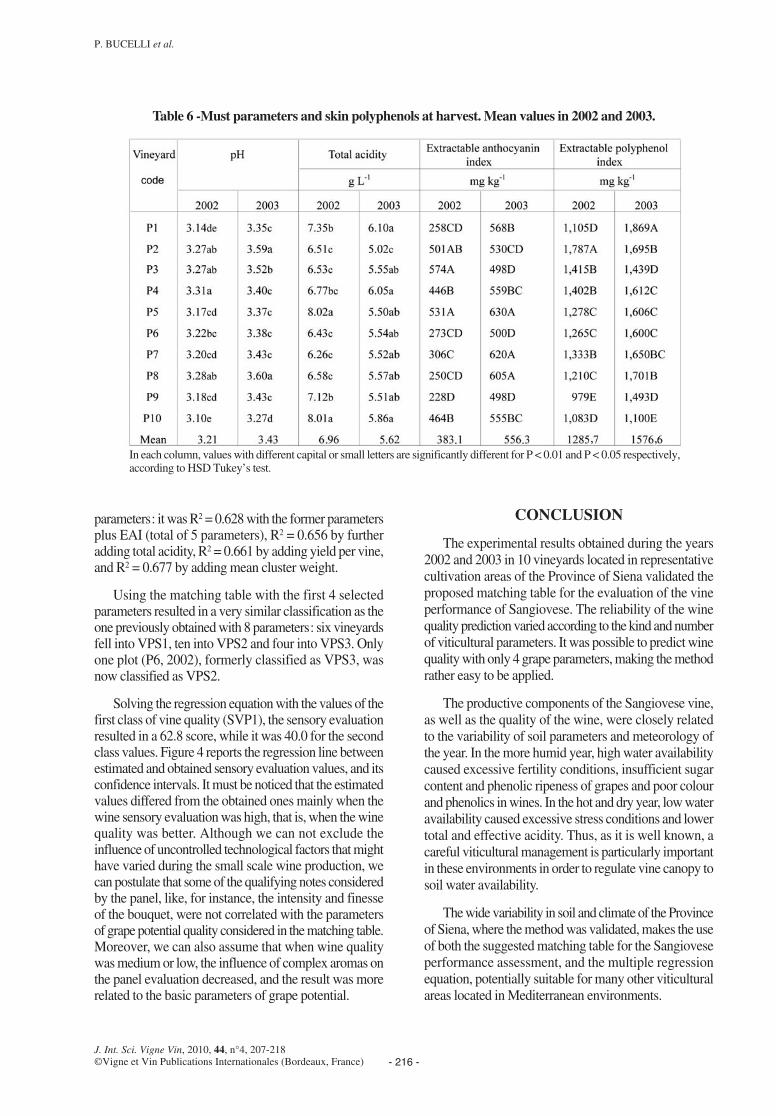
Grape production and must quality differedsignificantly between the vineyards, especially in 2002,which was relatively more humid (Tables 5 and 6). In thatyear, P2 in Montalcino showed the significantly highestberry sugar content (°Brix), as well as sugar accumulationrate (°Brix day-1) and extractable polyphenol index, whileit had the lowest mean berry weight. Grape yield per vine,mean cluster weight and total acidity were also moderatelylow. In the same year, the grapes of P3 in Poggibonsiexhibited the highest significant extractable anthocyaninindex. In 2003, the productive results were generally lessvariable among the plots. Still, P1 in Montalcino reachedthe highest level of extractable polyphenol index, withlow yield per vine and mean cluster weight and goodeffective (pH) and total acidity of must.
- 212 -J. Int. Sci. Vigne Vin, 2010, 44, n°4, 207-218©Vigne et Vin Publications Internationales (Bordeaux, France)
P. BUCELLI et al.
Figure 1. Mean rainfall during budbreak-harvestvegetative time in the years 2002 and 2003.
Figure 2. Mean values of air and soil temperaturefrom April to September
D air-soil : difference between air and soil temperature at thebeginning of the vegetative period (March-April) in the year 2003.
bucelli 24/12/10 14:10 Page 212

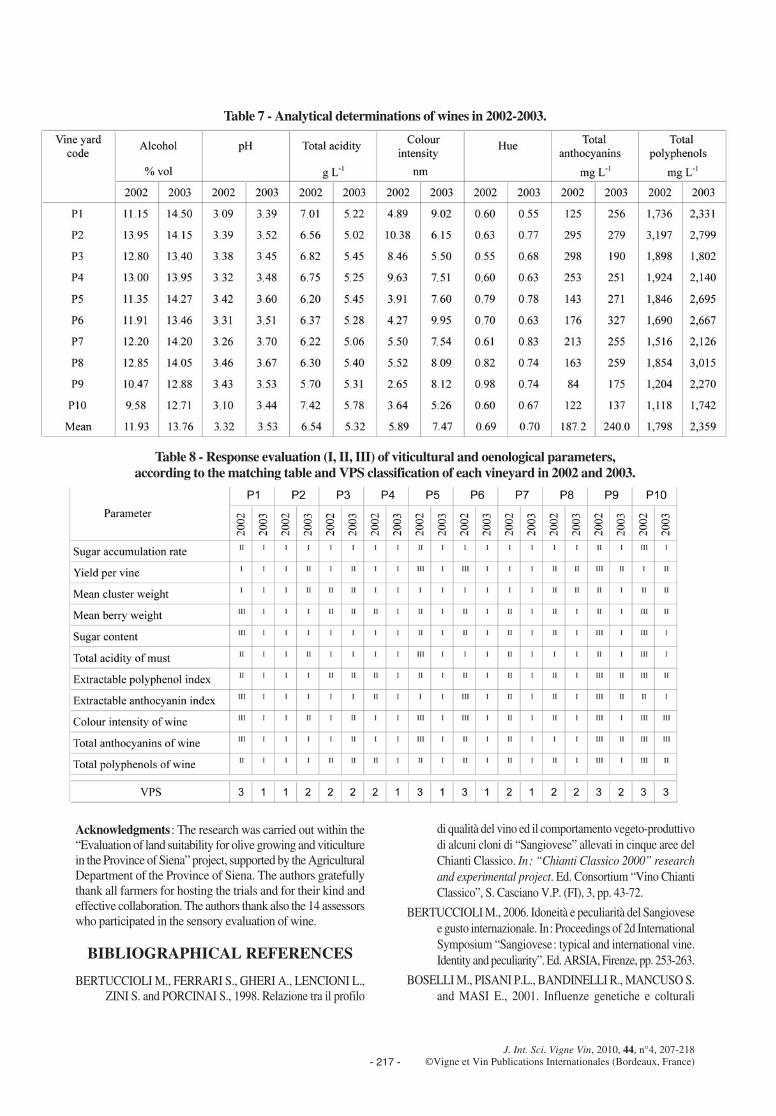
As for the oenological results, there was morevariability among the plots in 2002 than in 2003 (Table 7).A high alcoholic degree was measured for both years inMontalcino (P2), in both experimental fields of ChiantiClassico (P3 and P4), and in one of two vineyards ofMurlo (P7) and Cetona (P8). In 2002, Sociville (P10) andthe wine of the second Cetona vineyard (P9) showed thelowest values and in 2003, the alcoholic content was highin all wines. The effective and total acidity of all wineswas lower in the hot 2003 vintage. Colour intensity (DO420
+ DO520) and total anthocyanins and polyphenols showeda high degree of variability in both years. The Sangiovesewines obtained in Montalcino (P2) and Chianti Classico(P4) in the 2002 vintage had superior colour and phenolicsthan all the other experimental vineyards. Montalcino
(P2), Rapolano (P5), Murlo (P6) and Cetona (P8) winesshowed the highest levels of these parameters in 2003.
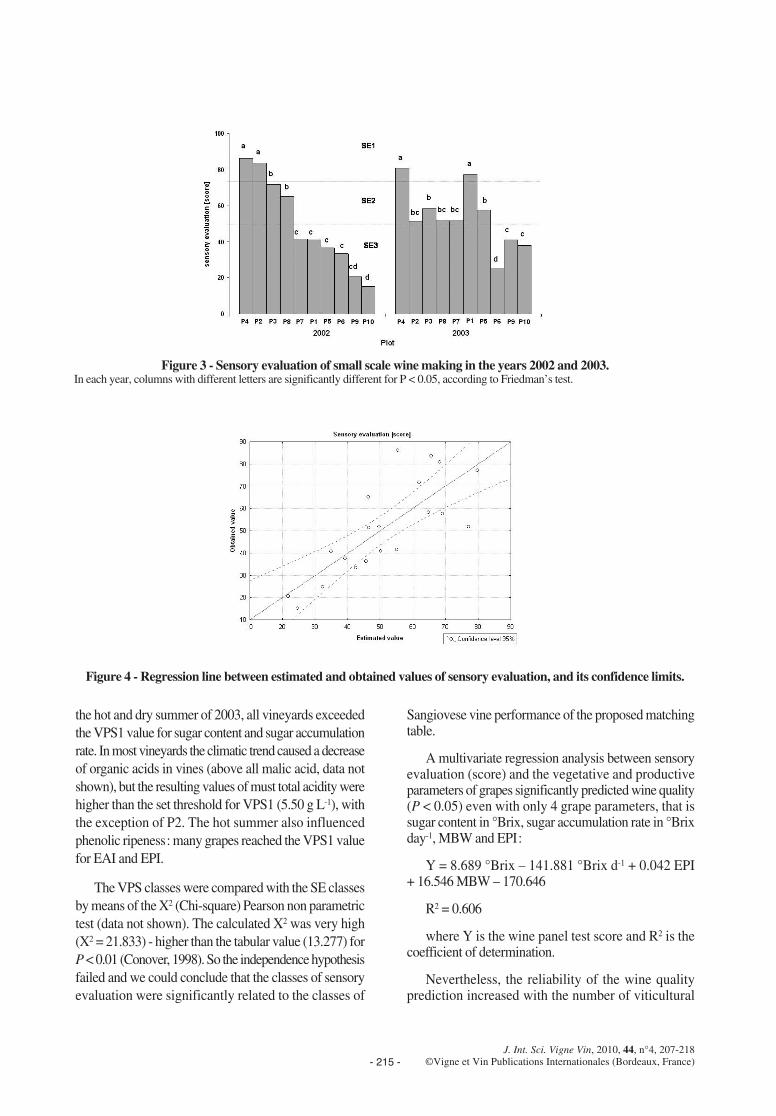
The organoleptic analyses of both vintages clearlyshowed the suitability of the experimental environmentsof Montalcino (P1 and P2) and Chianti Classico (P3 andP4) for the Sangiovese vine and its oenological result(Figure 3). Vineyard P4, in particular, showed the bestqualitative potential by producing high quality wines withhigh sensory evaluation scores in both climaticallycontrasted years. The two Montalcino vineyards provedto be more subjected to climatic variability: P1, havingcooler environmental conditions, gave the best qualityresults in 2003, which was a very hot and dry year,whereas P2, located in a hotter and drier pedoclimate,gave better results in 2002, which was a very moistsummer. In the Chianti Colli Senesi experimental fields,
- 213 -J. Int. Sci. Vigne Vin, 2010, 44, n°4, 207-218
©Vigne et Vin Publications Internationales (Bordeaux, France)
Table 3 - Soil water tension (kPa, negative water potential) measured from April to September in 2002-2003.Standard deviation in parentheses.
nc: not calculated
bucelli 24/12/10 14:10 Page 213
only some vineyards exhibited fairly good outcomes (P8-Cetona in 2002 and 2003; P5-Rapolano and P7-Murloin 2003), while the others (P6, P9 and P10) received lowerevaluation scores than those located in Montalcino andChianti Classico. Therefore, in the 2002 vintage, theSangiovese wine produced in the 10 experimentalvineyards was classified SE1 in 2, SE2 in 2 and SE3 in6 vineyards, while in the 2003 vintage it was classifiedSE1 in 2, SE2 in 5 and SE3 in 3 vineyards.
3. Validation of the matching table
The matching table presenting the target values andVPS classification can be seen in table 1. When
considering the experimental data obtained during thetwo growing seasons, most vineyards (8) were classifiedas VPS2, 6 as VPS1 and 6 as VPS3 (Table 8). Thecontrasting climatic conditions also influenced theseresults. The very moist summer of 2002 did not allow allvineyards to reach a sufficient level of phenolic ripenessand sugar content in grapes. On top of that, the mean berryweight (MBW) was almost always higher than the targetvalue. Only P2 exceeded the limit for VPS1-extractablepolyphenol index of berry skin (1,600 mg kg-1) and wasbelow the VPS1-limit for MBW (1.80 g), whereas P2,P3 and P4 were the only ones to reach the VPS1 targetlevel for sugar content (22 °Brix). On the other hand, in
- 214 -J. Int. Sci. Vigne Vin, 2010, 44, n°4, 207-218©Vigne et Vin Publications Internationales (Bordeaux, France)
P. BUCELLI et al.
Table 4 - Analysis of variance: Year and soil effect on yield parameters and extractable polyphenol indexfrom berries at harvest (years 2002 and 2003).
*** Statistically significant differences P < 0.001 and ** P < 0.01; ns: not significant; nc: not calculated
Table 5 - Grape production parameters at harvest. Mean values in 2002 and 2003.
In each column, values with different capital or small letters are significantly different for P < 0.01 and P < 0.05 respectively, accordingto HSD Tukey’s test.
bucelli 24/12/10 14:10 Page 214
the hot and dry summer of 2003, all vineyards exceededthe VPS1 value for sugar content and sugar accumulationrate. In most vineyards the climatic trend caused a decreaseof organic acids in vines (above all malic acid, data notshown), but the resulting values of must total acidity werehigher than the set threshold for VPS1 (5.50 g L-1), withthe exception of P2. The hot summer also influencedphenolic ripeness: many grapes reached the VPS1 valuefor EAI and EPI.
The VPS classes were compared with the SE classesby means of the X2 (Chi-square) Pearson non parametrictest (data not shown). The calculated X2 was very high(X2 = 21.833) - higher than the tabular value (13.277) forP < 0.01 (Conover, 1998). So the independence hypothesisfailed and we could conclude that the classes of sensoryevaluation were significantly related to the classes of
Sangiovese vine performance of the proposed matchingtable.
A multivariate regression analysis between sensoryevaluation (score) and the vegetative and productiveparameters of grapes significantly predicted wine quality(P < 0.05) even with only 4 grape parameters, that is sugar content in °Brix, sugar accumulation rate in °Brixday-1, MBW and EPI:
Y = 8.689 °Brix – 141.881 °Brix d-1 + 0.042 EPI+ 16.546 MBW – 170.646
R2 = 0.606
where Y is the wine panel test score and R2 is thecoefficient of determination.
Nevertheless, the reliability of the wine qualityprediction increased with the number of viticultural
- 215 -J. Int. Sci. Vigne Vin, 2010, 44, n°4, 207-218
©Vigne et Vin Publications Internationales (Bordeaux, France)
Figure 3 - Sensory evaluation of small scale wine making in the years 2002 and 2003.In each year, columns with different letters are significantly different for P < 0.05, according to Friedman’s test.
Figure 4 - Regression line between estimated and obtained values of sensory evaluation, and its confidence limits.
bucelli 24/12/10 14:10 Page 215
parameters: it was R2 = 0.628 with the former parametersplus EAI (total of 5 parameters), R2 = 0.656 by furtheradding total acidity, R2 = 0.661 by adding yield per vine,and R2 = 0.677 by adding mean cluster weight.
Using the matching table with the first 4 selectedparameters resulted in a very similar classification as theone previously obtained with 8 parameters: six vineyardsfell into VPS1, ten into VPS2 and four into VPS3. Onlyone plot (P6, 2002), formerly classified as VPS3, wasnow classified as VPS2.
Solving the regression equation with the values of thefirst class of vine quality (SVP1), the sensory evaluationresulted in a 62.8 score, while it was 40.0 for the secondclass values. Figure 4 reports the regression line betweenestimated and obtained sensory evaluation values, and itsconfidence intervals. It must be noticed that the estimatedvalues differed from the obtained ones mainly when thewine sensory evaluation was high, that is, when the winequality was better. Although we can not exclude theinfluence of uncontrolled technological factors that mighthave varied during the small scale wine production, wecan postulate that some of the qualifying notes consideredby the panel, like, for instance, the intensity and finesseof the bouquet, were not correlated with the parametersof grape potential quality considered in the matching table.Moreover, we can also assume that when wine qualitywas medium or low, the influence of complex aromas onthe panel evaluation decreased, and the result was morerelated to the basic parameters of grape potential.
CONCLUSION
The experimental results obtained during the years2002 and 2003 in 10 vineyards located in representativecultivation areas of the Province of Siena validated theproposed matching table for the evaluation of the vineperformance of Sangiovese. The reliability of the winequality prediction varied according to the kind and numberof viticultural parameters. It was possible to predict winequality with only 4 grape parameters, making the methodrather easy to be applied.
The productive components of the Sangiovese vine,as well as the quality of the wine, were closely relatedto the variability of soil parameters and meteorology ofthe year. In the more humid year, high water availabilitycaused excessive fertility conditions, insufficient sugarcontent and phenolic ripeness of grapes and poor colourand phenolics in wines. In the hot and dry year, low wateravailability caused excessive stress conditions and lowertotal and effective acidity. Thus, as it is well known, acareful viticultural management is particularly importantin these environments in order to regulate vine canopy tosoil water availability.
The wide variability in soil and climate of the Provinceof Siena, where the method was validated, makes the useof both the suggested matching table for the Sangioveseperformance assessment, and the multiple regressionequation, potentially suitable for many other viticulturalareas located in Mediterranean environments.
- 216 -J. Int. Sci. Vigne Vin, 2010, 44, n°4, 207-218©Vigne et Vin Publications Internationales (Bordeaux, France)
P. BUCELLI et al.
Table 6 -Must parameters and skin polyphenols at harvest. Mean values in 2002 and 2003.
In each column, values with different capital or small letters are significantly different for P < 0.01 and P < 0.05 respectively,according to HSD Tukey’s test.
bucelli 24/12/10 14:10 Page 216
Acknowledgments: The research was carried out within the“Evaluation of land suitability for olive growing and viticulturein the Province of Siena” project, supported by the AgriculturalDepartment of the Province of Siena. The authors gratefullythank all farmers for hosting the trials and for their kind andeffective collaboration. The authors thank also the 14 assessorswho participated in the sensory evaluation of wine.
BIBLIOGRAPHICAL REFERENCES
BERTUCCIOLI M., FERRARI S., GHERI A., LENCIONI L.,ZINI S. and PORCINAI S., 1998. Relazione tra il profilo
di qualità del vino ed il comportamento vegeto-produttivodi alcuni cloni di “Sangiovese” allevati in cinque aree delChianti Classico. In: “Chianti Classico 2000” researchand experimental project. Ed. Consortium “Vino ChiantiClassico”, S. Casciano V.P. (FI), 3, pp. 43-72.
BERTUCCIOLI M., 2006. Idoneità e peculiarità del Sangiovesee gusto internazionale. In: Proceedings of 2d InternationalSymposium “Sangiovese: typical and international vine.Identity and peculiarity”. Ed. ARSIA, Firenze, pp. 253-263.
BOSELLI M., PISANI P.L., BANDINELLI R., MANCUSO S.and MASI E., 2001. Influenze genetiche e colturali
- 217 -J. Int. Sci. Vigne Vin, 2010, 44, n°4, 207-218
©Vigne et Vin Publications Internationales (Bordeaux, France)
Table 8 - Response evaluation (I, II, III) of viticultural and oenological parameters, according to the matching table and VPS classification of each vineyard in 2002 and 2003.
Table 7 - Analytical determinations of wines in 2002-2003.
bucelli 24/12/10 14:10 Page 217
sull’equilibrio vegeto-produttivo del vitigno “Sangiovese”.In: Proc. Int. Symp. “Sangiovese”. Ed. ARSIA, Firenze,pp. 213-217.
BUCELLI P., PIRACCI A., GIANNETTI F. and FAVIERE V.,1999. Prugnolo gentile: the basic vine variety of the “VinoNobile di Montepulciano”. In: Proceedings XI GESCO.Marsala (TP), pp. 429-435.
BUCELLI P., 2001. Componenti fenolici in cloni di Sangiovesesu portinnesti diversi. In : Proceedings of InternationalSymposium “Sangiovese”. Ed. ARSIA, Firenze, pp. 413-418.
BUCELLI P., PIRACCI A., FAVIERE V., GIANNETTI F. andBALDI M., 2006. Attitudini enologiche di sei cloni diSangiovese nella zona di produzione del Chianti Classico.In : Proceedings of 2d International Symposium“Sangiovese: typical and international vine. Identity andpeculiarity”. Ed. ARSIA, Firenze, pp. 365-369.
CALDANO G. and ROSSI A., 2008. Codice Denominazioni diorigine dei vini. Ed. Unione Italiana Vini, Milano.
CASTINO M., 1983. La valutazione organolettica dei vini conscala non strutturata. Vignevini, 10, 53-61.
CONOVER W.J., 1998. Practical non parametric statistics. Ed.J. Wiley & Sons, New York.
COSTANTINI E.A.C., CAMPOSTRINI F., ARCARA P.G.,CHERUBINI P., STORCHI P. and PIERUCCI M., 1996.Soil and climate functional characters for grape ripeningand wine quality of "Vino Nobile di Montepulciano". ActaHorticulturae 427 ISHS, 45-55.
COSTANTINI E.A.C., BARBETTI R., BUCELLI P., CIMATOA., FRANCHINI E., L’ABATE G., PELLEGRINI S.,STORCHI P. and VIGNOZZI N., 2006a. Zonazione viticolaed olivicola della provincia di Siena. Ed. Grafiche Boccacci,Colle Val d’Elsa (SI).
COSTANTINI E.A.C., BARBETTI R., BUCELLI P., L’ABATEG., LELLI L., PELLEGRINI S. and STORCHI P., 2006b.Land peculiarities of the vine cultivation areas in the Provinceof Siena (Italy), with indications concerning the viticulturaland oenological results of Sangiovese vine. Boll. Soc. Geol.It., 6, 147-159.
COSTANTINI E.A.C., PELLEGRINI S., BUCELLI P.,BARBETTI R., CAMPAGNOLO S., STORCHI P.,MAGINI S., PERRIA R., 2010. Mapping suitability forSangiovese wine by means of δ13C and geophysical sensorsin soils with moderate salinity. Europ. J. Agronomy, 33,208 – 217.
DI STEFANO R. and CRAVERO M.C., 1991. Metodi per lostudio dei polifenoli dell’uva. Riv. Vitic. Enol., 2, 37-43.
DI STEFANO R., UMMARINO I. and GENTILINI N., 1997.Alcuni aspetti nel controllo di qualità nel campo enologico.Lo stato di combinazione degli antociani. In : Annalidell’Istituto Sperimentale per l’Enologia. Ed. ISEN, Asti,XXVII, pp. 105-121.
EGGER E., GRECO M.G., PIERUCCI M. and STORCHI P.,1999. Zonazione aziendale nel territorio del Chianti Classicoe valorizzazione dei vini. In: Proc. 2d Int. meeting “vinezoning”. Siena, pp. 341-354.
FAO, 1976. A framework for land evaluation. In: Soils Bulletin32. Food and Agriculture Organization of the UnitedNations. Rome.
FAO, IUSS, ISRIC, 2006. World Reference Base for soil resource.In: World Soil Resource Report. Ed FAO, 103, Rome.
FREGONI M., 2006. Il Sangiovese, vitigno autoctono einternazionale: evoluzione e strategie di sviluppo. In: Proc.2d Int. Symp. “Sangiovese: typical and international vine.Identity and peculiarity”. Ed. ARSIA, Firenze, pp. 21-30.
GIGLIOTTI A. and BUCELLI P., 1990. Evoluzione deicomponenti antocianici e dei pigmenti colorati in una seriedi prove di invecchiamento. Riv. Vitic. Enol., 3, 49-62.
LANYON D.M., CASS A. and HANSEN D., 2004. The effect ofsoil properties on vine performance. In: CSIRO Land andWater, Technical Report 34/04, Australia, pp. 1-54.
O.I.V., 2000. Recueil des méthodes internationales d’analyse desvins et des moûts. Ed. Organisation International de la Vigneet du Vin, Paris.
PALLIOTTI A., SILVESTRONI O., PETOUMENOU D.,VIGNAROLI S. and BERRIOS J.G., 2008. Evaluation oflow-energy demand adaptive mechanisms in Sangiovesegrapevine during drought. J. Int. Sci. Vigne Vin, 42, 1-7.
SAXTON K.E., 2009. Soil Water Characteristics. Ed. USDAAgricultural Research Service, Hydrology and RemoteSensing Lab., Beltsville, Maryland USA.
SCALABRELLI G., LORETI F., PISANI P.L. and BANDINELLIR., 2001. Comportamento bio-agronomico del “Sangiovese”su diversi portinnesti nel Chianti Classico. In: Proceedingsof International Symposium “Sangiovese”. Ed. ARSIAFirenze, pp. 289-294.
SCALABRELLI G., D’ONOFRIO C., MACCHIA A.,ROSELLINI D., BERTUCCIOLI M., and BOSELLI M.,2006. Comportamento agronomico del vitigno Sangiovesein 11 zone del Chianti Classico. In : Proceedings ofInternational Symposium “Sangiovese”. Ed. ARSIAFirenze, pp. 530-539.
STORCHI P., EGGER E. and RASPINI L., 1995. Research onSangiovese R10 in different Chianti Classico areas. In :Proceedings International Symposium on clonal selection.Portland (Oregon), pp. 148-152.
STORCHI P., EGGER E., ARMANNI A.B., LAZZARA S. andPIERUCCI M., 2001. Valutazioni morfologiche e analitichedell’uva di cloni diversi del “Sangiovese”. In: Proc. Int.Symp. “Sangiovese”. Ed. ARSIA, Firenze, pp. 121-125.
STORCHI P., COSTANTINI E.A.C. and BUCELLI P., 2005.The influence of climate and soil on viticultural andoenological parameters of Sangiovese grapevine under non-irrigated conditions. Acta Horticulturae, 689, 333-340.
WEISS J., 1981. Rating scales in the sensory analysis of food stuffs.II. Paradigmatic application of a rating method withunstructured scale. Acta alimentaria, 10, 395-405.
- 218 -J. Int. Sci. Vigne Vin, 2010, 44, n°4, 207-218©Vigne et Vin Publications Internationales (Bordeaux, France)
P. BUCELLI et al.
bucelli 24/12/10 14:10 Page 218