it tool for controlling cashflows in sarl technobatilux - theseus
TRANSCRIPT

Anna Smolentseva
IT TOOL FOR CONTROLLING CASHFLOWS IN SARL
TECHNOBATILUX
Bachelor’s Thesis Business Management
December 2012
DESCRIPTION
Date of the bachelor's thesis
Author(s)
Anna Smolentseva
Degree programme and option
Degree Programme in Business Management Bachelor of Business Administration
Name of the bachelor's thesis
IT tool for controlling cashflows in SARL Technobatilux
Abstract
Growing competition developed quite unfavorable conditions for the companies and pointed at the necessity of a more thorough control of financial flows. The purpose of this study was to identify the strengths and weaknesses of a company and to find out how a micro company with a thorough mar-keting strategy can enhance its performance through the business intelligence software. The theoretical background consists of three parts. They include the studies concerning cash flows overall, means of analyzing company’s activities and business intelligence software and their imple-mentation in real business life. The research data was collected through participant observation during my internship in the French construction company Technobatilux. The practical part included SWOT and value chain analyses which showed not only advantages of the company, but certain weaknesses and needs. Besides, the identification of the concerns of Technobatilux was fulfilled during the in depth interview with the financial manager who determined certain difficulties in the decision making process because of the lack of financial controlling. According to the findings, micro companies and SMEs experience problems with business intelligence software, because they lack financing or skills. Instead of professional programs they use substitutes which partially correspond to their needs. These substitutes are usually familiar accounting programs which include financial analysis functions. As a result of the research, an excel spreadsheet file was developed for the company. It was tailor made to meet the needs of the company – the ability to see the profitability of every project monthly and to analyse various types of costs in order to increase profitability and efficiency. Subject headings, (keywords)
Cash flow statement, cash management, business intellugent systems, Microsoft Excel Pages Language URN
46p+2 apendices
English
Remarks, notes on appendices
Tutor
Eila Jussila
Employer of the bachelor's thesis
SARL Technobatilux

CONTENTS
1 INTRODUCTION................................................................................................... 1
2 CASH FLOW MANAGEMENT ............................................................................ 2
2.1 Cash flow statement .......................................................................................... 2
2.2 Classification of costs ....................................................................................... 5
2.3 Cash Management ............................................................................................. 6
2.4 Control of cash .................................................................................................. 9
3 ANALYZING BUSINESS ACTIVITIES ............................................................ 10
3.1 SWOT analysis................................................................................................ 10
3.2 Value Chain analysis ....................................................................................... 11
3.3 Cash flow analysis........................................................................................... 13
4 BUSINESS INTELLIGENCE SYSTEMS ........................................................... 14
4.1 Business Intelligence and its development trends ........................................... 15
4.2 Overview of major Business Intelligence systems.......................................... 17
4.3 Microsoft Excel as a BI solution for small business ....................................... 18
5 RESEARCH METHODS...................................................................................... 23
5.1 Interview ......................................................................................................... 24
5.2 Observation ..................................................................................................... 25
5.3 Research process ............................................................................................. 27
6 SARL TECHNOBATILUX AND CASH MANAGEMENT............................... 28
6.1 Description and activities of the case company .............................................. 29
6.2 Cash flow management in SARL Technobatilux ............................................ 32
6.3 SWOT analysis of Technobatilux ................................................................... 33
6.4 Value chain analysis of Technobatilux ........................................................... 36
7 CASH FLOW CONTROL TOOL FOR TECHNOBATILUX ............................. 37
7.1 Developing Excel spreadsheet for cash control in Technobatilux .................. 38
7.2 Possible development and further application ................................................ 43
8 CONCLUSION ..................................................................................................... 45
BIBLIOGRAPHY ................................................................................................. 47
APPENDICES

1
1 INTRODUCTION
Cash flow is an important issue in every company. Control of cash flow affects com-
pany’s profitability. Moreover, it is relevant for all stakeholders to analyze cash pay-
ments and predict liquidity and the overall future development of the company.
The thesis is made for a French micro company Technobatilux where I worked as an
intern from January till April 2012. The company operates in the southern region of
the country. It is a private limited liability company which was created in March 2011.
The major company’s activities are construction of buildings (private houses) and
renovation.
The management developed a detailed marketing strategy which was essential in at-
traction of the clients and helped to show a positive financial result for the first year of
the company’s existence. Still, the company faced another problem related to the in-
creasing number of the projects and lack of financial instruments to supervise them.
Therefore, the management of Technobatilux responded to the question of how a mi-
cro company can maintain sustainability through controlling the company’s finances
by decision to develop an IT tool for cash management. The system should facilitate
the current results of the activities any time. Besides, one of its main functions should
be the ability to review every project and to allocate resources where it is necessary.
A wide range of provided services and processes inside the company imply certain
complexity in planning and supervising of the projects on daily basis. Thus, the man-
agement should find the solution that suits the needs of the company: a tool that would
allow seeing the costs and profits of every single project and reacting timely on the
unforeseen changes. The purpose of the tool is to facilitate decision making for the
management.
The research questions are the following:
1. What are the needs and weaknesses of Technobatilux from the point of view of
cash flow?
2. What is the most suitable and cost efficient way to control finances in the
company?

2
These questions are answered through the theoretical framework that covers strategic
management and critical success factors which are used to make SWOT and value
chain analyses of Technobatilux; and the notion of business intelligence programs and
their development, description of business intelligence market leaders 2012. Concern-
ing empirical part, the work includes qualitative research (in-depth structured inter-
views and participant observation). The selected methods allowed to receive detailed
information about cash flow management in the case company and to participate in
the project of developing the excel tool.
Thus, the objective of this bachelor`s thesis is to find and develop the most suitable IT
solution to control financial activities and provide analysis for Technobatilux.
2 CASH FLOW MANAGEMENT
Cash flow statement belongs to financial statements which are produced during ac-
counting process. They convey economic information about the company’s activities
to interested parties who make decisions about financial position of the company, re-
sults of operations, and cash flows. Each of the four principal financial statements has
its own purpose, but they are interconnected in order to give the full picture about a
company’s activities (Marshall 2011, 32).
The financial statements are:
- Balance sheet (or statement of financial position);
- Income statement (or statement of earnings, or profit and loss statement, or
statement of operations);
- Statement of cash flows;
- Statement of changes in owners’ equity (or statement of changes in capital
stock and/or statement of changes in retained earnings) (Marshall, 2011, 32).
2.1 Cash flow statement
According to David Marshall (2011), the statement of cash flows is an obligatory fi-
nancial statement that shows how accounting evolves to meet the requirements of us-
ers of financial statements. Over the decades, the importance of understanding the

3
cash flows statement of an entity has been highlighted, because income statement does
not present cash flows from operations (with the exception for cash related to reve-
nues and expenses) and it does not show information about cash flows from investing
and financing activities (Marshall 2011, 41).
The author underlines that the purpose of the statement of cash flows is to identify the
sources and uses of cash during the year by reporting the changes in all of the other
balance sheet items. Because of the accounting equation (assets equal liabilities plus
owners’ equity), the total of the changes in every other asset and each liability and
element of owners’ equity will equal the change in cash (Marshall 2011, 41-42).
Therefore, cash flow statement provides the relevant information about cash payments
of a company and it helps to analyze and make certain predictions. Hongren et al.
(2012) note that past cash receipts and payments may be useful for several groups of
stakeholders. For example, management of the company may use cash flow statement
to predict future cash flows; investors may evaluate management decisions concerning
investing activities; lenders and stockholders may predict the ability of the company to
pay debts and liabilities (Hongren & Harrison 2012, 663).
Cash Flow Statement is prepared like Fund Flow Statement. Preparation of this state-
ment is based on the movement of cash, may be an actual inflow of cash or outflow of
cash, Profit and Loss Account and other relevant information. While preparing a cash
flow statement, it starts with an opening balance of cash in hand and cash at bank, all
the sources of cash are added to an opening balance minus applications of cash is rec-
onciled with the closing balance of cash. The balance represents cash and bank bal-
ances at the end of accounting period (Periasamy 2010, 211)
Periasamy(2010) distinguishes the main sources of cash and applications of cash. He
refers to the sources of cash (inflows) the following items: cash from operations (trad-
ing profit); sale of fixed assets and of investments for cash; raising long-term loans
from the financial institutions; issuing of shares and debentures for cash. Applications
of cash have the following forms: cash lost in operations (losses); redemption of
shares and debentures by cash; purchase of fixed assets; and repayment of long-term
loans (Periasamy 2010, 212)

4
Cash flow activities
Cash flow activities are subdivided into three groups:
- Operating activities
- Investing activities
- Financing activities
To have a closer look at each of them, the description provided by Hongren et al
(2012) was used.
Operating Activities
These activities are considered as the most important category of cash flows because
they reflect the day-to-day operations that determine the future of an organization.
Besides, revenues, expenses, gains, and losses of the company are generated by the
operating activities. Moreover, they affect net income on the income statement and
current assets and current liabilities on the balance sheet (Hongren & Harrison 2012,
663).
Operating activities may be reported in two ways: the direct method or the indirect
method. The direct method consists in a separate listing of each major item of operat-
ing cash receipt (such as cash received from customers) and each major item of oper-
ating cash payments (such as cash paid for merchandise). The cash payments are sub-
tracted from cash receipts to determine the net cash provided by operating activities.
The indirect method reports net income and then adjusts it for items necessary to ob-
tain net cash provided or used by operating activities. It does not report individual
items of cash inflows and cash outflows from operating activities. Instead, the indirect
method reports the necessary adjustments to reconcile net income to net cash provided
or used by operating activities (Wild & Shaw 2011, 638-639). These two methods of
reporting concern only operating activities.
Investing Activities
Investing activities show increase and decrease of long-term assets (such as comput-
ers, software, land, premises, and equipment). They include:

5
- purchases and sales of these assets; long-term loans receivable from others
(non-trade) and collections of those loans;
- purchases and sales of long-term investments (Hongren & Harrison 2012,
663).
Financing Activities
Financing activities indicate increase and decrease of long-time liabilities and equity.
They include:
- issuing stock, paying dividends, and buying and selling treasury stock;
- borrowing money and paying off loans (Hongren & Harrison 2012, 664).
2.2 Classification of costs
A cost, in its widest meaning, is “an amount of expenditure on a defined activity”
(Weetman 2010, 33). This subchapter chapter explains some of the basic classifica-
tions of the expenditures in management accounting.
The traditional classification of costs includes three types:
- variable costs and fixed costs;
- direct costs and indirect costs;
- product costs and period costs (Weetman 2010, 33).
A variable cost is one which varies directly with changes in the level of activity, over
a defined period of time. A fixed cost is one which is not affected by changes in the
level of activity, over a defined period of time. A semi-variable cost is one which is
partly fixed and partly varies with changes in the level of activity, over a defined peri-
od of time (Weetman 2010, 35-37).
A fixed cost that increases in steps is called a step cost. The cost is fixed over a speci-
fied level of activity but then increases as a further amount of fixed cost is incurred.
One example is the cost of renting storage space (Weetman 2010, p.37).
The costs of a business activity can also be classified as direct and indirect costs. Di-
rect costs are those which are directly related to a particular object (such as a product

6
which has been manufactured) or a particular service (such as a repair job completed)
or a particular location (such as a department within the organization). Indirect costs
are those which cannot be directly related to a particular object or service or location
and therefore have to be apportioned on a basis which is as fair as can be devised
(Weetman 2010, 39).
The definition of direct and indirect costs depends on the purpose for which the cost
will be used. Direct costs are directly traceable to an identifiable unit, such as a prod-
uct or service or department of the business, for which costs are to be determined.
Indirect costs are spread over a number of identifiable units of the business, such as
products or services or departments, for which costs are to be determined. Indirect
costs are also called overhead costs. Overhead costs are the costs which cannot be
identified directly with products or services (Weetman 2010, 40).
Another way of looking at the cost as a unit of output of a business is to distinguish
product costs and period costs. Product costs are those which are identified with goods
or services intended for sale to customers. These costs belong to the products and stay
with them until they are sold. If goods remain unsold, or work-in-progress remains
incomplete, then the product costs stay with the unsold goods or work-in-progress
under the heading of inventory (stock). Period costs are the costs that are treated as
expenses of the period and are not carried as part of the inventory (stock) value. Prod-
uct costs are the costs associated with goods or services purchased, or produced, for
sale to customers. Period costs are those costs which are treated as expenses in the
period in which they are incurred (Weetman, 2010, 41).
2.3 Cash Management
Cash is a necessary asset of every company. Most companies also own cash equiva-
lents which are assets similar to cash. Cash and cash equivalents are the most liquid of
all assets and are easily hidden and moved. Wild et al (2011) insist that an effective
system of internal controls protects these assets and it should meet three basic guide-
lines:
1. Handling cash is separate from recordkeeping of cash.
2. Cash receipts are promptly deposited in a bank.
3. Cash disbursements are made by check.

7
The first guideline applies separation of duties to minimize errors and fraud. When
duties are separated, two or more people must collude to steal cash and conceal this
action in the accounting records. The second guideline uses immediate deposits of all
cash receipts to produce a timely independent record of the cash received. It also re-
duces the likelihood of cash theft (or loss) and the risk that an employee could person-
ally use the money before depositing it. The third guideline uses payments by check to
develop an independent bank record of cash disbursements. This guideline also reduc-
es the risk of cash theft (or loss) (Wild & Shaw 2011, 321).
The exact procedures used to achieve control over cash vary across companies. They
depend on factors such as company size, number of employees, volume of cash trans-
actions, and sources of cash.
Cash Equivalents and Liquidity
Good accounting systems help in managing the amount of cash and controlling who
has access to it. Cash is the usual means of payment when paying for assets, services,
or liabilities. Liquidity refers to a company’s ability to pay for its near-term obliga-
tions. Cash and similar assets are called liquid assets because they can be readily used
to settle such obligations. A company needs liquid assets to effectively operate. Cash
includes currency and coins along with the amounts on deposit in bank accounts,
checking accounts (called demand deposits), and many savings accounts (called time
deposits). Cash also includes items that are acceptable for deposit in these accounts
such as customer checks, cashier’s checks, certified checks, and money orders (Wild
& Shaw 2011, 321).
Cash equivalents are short-term, highly liquid investment assets meeting two criteria:
1 readily convertible to a known cash amount and
2 sufficiently close to their due date so that their market value is not sensitive to
interest rate changes orders (Wild & Shaw 2011, 321).
Only investments purchased within three months of their due date usually satisfy these
criteria. Examples of cash equivalents are short-term investments in assets such as

8
U.S. Treasury bills and money market funds. To increase their return, many compa-
nies invest idle cash in cash equivalents. Most companies combine cash equivalents
with cash as a single item on the balance sheet orders (Wild & Shaw 2011, 321).
When companies fail, one of the most common causes is their inability to manage
cash. Companies must plan both cash receipts and cash payments. The goals of cash
management are the following:
1. Plan cash receipts to meet cash payments when due.
2. Keep a minimum level of cash necessary to operate (Wild & Shaw 2011, 321).
The treasurer of the company is responsible for cash management. Effective cash
management involves applying the following cash management principles:
1. Encourage collection of receivables. The more quickly customers and others
pay the company, the more quickly that company can use the money. Some
companies have cash-only sales policies. Others might offer discounts for
payments received early.
2. Delay payment of liabilities. The more delayed a company is in paying others,
the more time it has to use the money. Some companies regularly wait to pay
their bills until the last possible day allowed—although, a company must take
care not to hurt its credit standing.
3. Keep only necessary levels of assets. The less money tied up in idle assets, the
more money to invest in productive assets. Some companies maintain just-in-
time inventory; meaning they plan inventory to be available at the same time
orders are filled. Others might lease out excess warehouse space or rent
equipment instead of buying it.
4. Plan expenditures. Money should be spent only when it is available. Compa-
nies must look at seasonal and business cycles to plan expenditures.
5. Invest excess cash. Excess cash earns no return and should be invested. Excess
cash from seasonal cycles can be placed in a bank account or other short-term
investment for income. Excess cash beyond what’s needed for regular business
should be invested in productive assets like factories and inventories (Wild &
Shaw 2011, 321-322).

9
2.4 Control of cash
John Wild et al. (2011) suggest two types of cash control:
1. Control of cash receipts
2. Controls of cash disbursements
Internal control of cash receipts ensures that cash received is properly recorded and
deposited. Cash receipts can arise from transactions such as cash sales, collections of
customer accounts, receipts of interest earned, bank loans, sales of assets, and owner
investments. There are two important types of cash receipts: over-the-counter and by
mail (Wild & Shaw 2011, 322).
Control of cash disbursements is especially important as most large thefts occur from
payment of fictitious invoices. One key to controlling cash disbursements is to require
all expenditures to be made by check. The only exception is small payments made
from petty cash. Another key is to deny access to the accounting records to anyone
other than the owner who has the authority to sign checks. A small business owner
often signs checks and knows from personal contact that the items being paid for are
actually received. This arrangement is impossible in large businesses. Instead, internal
control procedures must be substituted for personal contact. Such procedures are de-
signed to assure the check signer that the obligations recorded are properly incurred
and should be paid (Wild & Shaw 2011, 324).
Control of cash disbursements is realized via voucher and petty cash systems of con-
trol. A voucher system is a set of procedures and approvals designed to control cash
disbursements and the acceptance of obligations. The voucher system of control estab-
lishes procedures for
- verifying, approving, and recording obligations for eventual cash disburse-
ment;
- issuing checks for payment of verified, approved, and recorded obligations
(Wild & Shaw 2011, 324).
A voucher system’s control over cash disbursements begins when a company dis-
charges an obligation that will result in payment of cash. A key factor in this system is
that only approved departments and individuals are authorized to incur such obliga-

10
tions. The system often limits the type of obligations that a department or individual
can incur.
Petty cash disbursements are the small payments required for items such as postage,
courier fees, minor repairs, and low-cost supplies. To avoid the time and cost of writ-
ing checks for small amounts, a company sets up a petty cash fund to make small
payments (Wild & Shaw 2011, 326).
3 ANALYZING BUSINESS ACTIVITIES
Business activities may be analyzed from different perspectives; the most relevant for
this thesis are strategic, marketing, and financial ones. The most common tools for the
analysis are to be reviewed in this chapter. They are SWOT analysis as a marketing
tool, value chain analysis as a strategic tool; and cash flow analysis as a financial
analysis tool.
3.1 SWOT analysis
SWOT analysis represents the analysis of internal (strengths and weaknesses) and
external (opportunities and threats) environment of a company. Each company needs
to evaluate its weak and strong points to find new opportunities for development and
to oversee possible threats.
SWOT analysis was introduced by Philip Kotler (Kotler et al., 2008). He insists that
the business does not have to correct all its weaknesses or boast about all its strengths.
The other disputable point, in his opinion, is whether the business should limit itself to
those opportunities where it possesses the required strengths or whether it should con-
sider opportunities that mean it might have to acquire or develop certain strengths.
On the other side, all companies are affected macro environment factors (demograph-
ic-economic, natural, technological, political-legal, and social-cultural) and significant
micro environmental factors (customers, competitors, suppliers, distributors, dealers
that affect its ability to earn profits). All these factors should be monitored to establish
proper marketing system and look for possible development strategies. For this pur-

11
pose, the management needs to identify the associated opportunities and threats
(Kotler et al., 2008, 52).
Gillian & Wilson (2009) remark that finding out threats and opportunities is a compli-
cated process, as any future development of the company can be categorized as an
opportunity or a threat, and the management should asses the action needed to profit
from the opportunity or minimization of the impact of the threat. Meanwhile, the au-
thors remark that what might appear to be an opportunity at first sight may not be so
after examining the organization’s resources, its culture, the expectations of its stake-
holders, the strategies available, or the feasibility of implementing the strategy. They
suggest understanding an opportunity as any sector of the market where company may
obtain competitive advantage. However, the external environment generates not only
opportunities, but also threats which may lead to the unfavorable change of the mar-
keting positioning of the company (Gillian & Wilson, 200, 85-87).
Concerning strengths and weaknesses, Gillian & Wilson (2009) classify them into a
fundamental strength, a marginal strength, a neutral factor, a marginal weakness, or a
fundamental weakness. Connection of these aspects gives a general picture of compa-
ny’s strengths and weaknesses. However, not all the strengths and weaknesses have
the same level of the importance. For a more detailed analysis the authors subdivided
the strengths and weaknesses according to their relevance (high, medium, low) and
according to the factors (marketing, financial, manufacturing and organizational)
(Gillian & Wilson, 200, 88-89).
3.2 Value Chain analysis
Value chain is a concept introduced by Michael Porter in 1985 (Porter, 1998). Its aim
is to analyze primary and support activities of the company to create value that ex-
ceeds the cost of providing the product or service, thus generating a profit margin
(Quick MBA).
The value chain describes the activities within and around an organization which cre-
ate a product or service. It is the cost of these value activities and the value that they
deliver that determines whether or not best value products or services are developed.
All the activities are divided into primary and support activities (Johnson 2005, 136).

12
Primary activities are directly concerned with the creation or delivery of a product or
service and can be grouped into five main areas:
1. Inbound logistics are the activities concerned with receiving, storing and dis-
tributing the inputs to the product or service. They include materials handling,
stock control, transport, etc.
2. Operations transform these various inputs into the final product or service:
machining, packaging, assembly, testing, etc.
3. Outbound logistics collect, store and distribute the product to customers. For
tangible products this would be warehousing, materials handling, distribution,
etc. In the case of services, they may be more concerned with arrangements for
bringing customers to the service if it is a fixed location (e.g. sports events).
4. Marketing and sales provide the means whereby consumers/users are made
aware of the product or service and are able to purchase it. This would include
sales administration, advertising, selling and so on. In public services, commu-
nication networks which help users access a particular service are often im-
portant.
5. Service includes all those activities which enhance or maintain the value of a
product or service, such as installation, repair, training and spares (Johnson
2005, 137).
Each of these groups of primary activities is linked to support activities. Support activ-
ities help to improve the effectiveness or efficiency of primary activities. They can be
divided into four areas:
1. Procurement. This refers to the processes for acquiring the various resource inputs
to the primary activities. As such, it occurs in many parts of the organization.
2. Technology development. All value activities have a ‘technology’, even if it is just
know-how. The key technologies may be concerned directly with the product (e.g.
R&D, product design) or with processes (e.g. process development) or with a par-

13
ticular resource (e.g. raw materials improvements). This area is fundamental to the
innovative capacity of the organization.
3. Human resource management. This is a particularly important area which
transcends all primary activities. It is concerned with activities involved in re-
cruiting, managing, training, developing and rewarding people within the or-
ganization.
4. Infrastructure. The systems of planning, finance, quality control, information
management, etc. important to an organization’s performance in its primary
activities. Infrastructure also consists of the structures and routines of the or-
ganization which are part of its culture (Johnson 2005, 137-138).
3.3 Cash flow analysis
Traditionally, investors and creditors have most commonly used ratios based on ac-
crual accounting. These days, cash-based ratios are gaining increased acceptance
among analysts (Kimmel 2009, 639).
In the statement of cash flows, cash provided by operating activities is intended to
indicate the cash-generating capability of the company. Analysts have noted, however,
that cash provided by operating activities fails to take into account that a company
must invest in new fixed assets just to maintain its current level of operations. Com-
panies also must at least maintain dividends at current levels to satisfy investors. The
measurement of free cash flow provides additional insight regarding a company’s cash
generating ability. Free cash flow describes the cash remaining from operations after
adjustment for capital expenditures and dividends (Kimmel 2009, 639).
That is Free cash flow measures the operating cash flow available to a company to
use after purchasing the property, plant, and equipment (PP&E) necessary to maintain
current productive capacity (Warren et al. 2009, 737). The formula of free cash flow is
rather simple. (Figure 1.)

14
Free Cash Flow = Cash Provided
- Capital
- Cash
By Operations Expenditures Dividends
FIGURE 1. Free cash flow
Most of the ratios use the accrual-based ratios from the income statement and balance
sheet for analyzing company’s liquidity and solvency. However, some analysts are
critical about the adjustments that are usually made in the income statement and bal-
ance sheet and they prefer to calculate the ratios based on cash flow statement in addi-
tion to the accrual-based analysis. Still, cash flow based ratios have a disadvantage –
there are no readily available industry average numbers for comparison (Kimmel
2009, 641-642).
Kimmel (2009) defines liquidity as “the ability to pay obligations expected to become
due within the next year”. Mentioning one measure of liquidity - the current ratio (cur-
rent assets divided by current liabilities) the author remarks its drawback - the ratio
uses the numbers of the end of the period only and they may not be representative of
the position of a company during the greatest part of the period. Kimmel (2009) sug-
gest the current cash debt coverage ratio as a more objective solution. It is computed
as cash provided by operating activities divided by average current liabilities. General-
ly, a value below 0,4 may require a more thorough look at a company’s liquidity
(Kimmel 2009, 642).
Solvency is interpreted as “the ability of a company to survive over the long term” and
it is measured by means of the cash debt coverage ratio. It is calculated as the ratio of
cash provided by operating activities to total debt as represented by average total lia-
bilities. This ratio indicates a company’s ability to repay its liabilities from cash gen-
erated from operations (without selling the assets of a company such as property,
plant, and equipment). If the result of the ratio is below 0,2, then there is a high prob-
ability of accounting insolvency (Kimmel 2009, 643).
4 BUSINESS INTELLIGENCE SYSTEMS
Enterprise financial software grew up to save money by replacing manual systems for
accounting and payroll, but then it became some sort of a warehouse of information
15
with potential for increasing revenues. This led to the appearance of Business Intelli-
gence (BI) applications in the 1990s. Nowadays there exist numerous BI systems
which purpose is to facilitate the financial analysis and make the decision making eas-
ier.
4.1 Business Intelligence and its development trends
Philip Hunter (2010) defines Business Intelligence (BI) as “computer-based tech-
niques used in spotting extracting, and analyzing business data (such as sales revenue)
by products or departments or associated costs and incomes. “
Business intelligence concept is connected with the concepts of customer relationship
management (CRM) and enterprise resource planning. According to Philip Hunter
(2010) customer relationship management is managing an organization’s interactions
with clients, partners, and distributors; it is connected with BI by involvement of the
usage of the technology to organize, automate, and synchronize business processes
such as sales activities, marketing, customer service, and technical support.
Speaking about enterprise resource planning (ERP), Hunter (2010) underlines that it is
an integrated computer based system which is used to manage internal and external
resources such as tangible assets, financial resources, materials, and human resources.
The aim of ERP is to facilitate the information interactions between all the depart-
ments and stakeholders inside and outside the organization (Hunter 2010).
Software as a service (SaaS) is a model of software deployment using the Internet as a
delivery medium. With SaaS, a provider licenses an application to customers for use
as a service on demand, either through a time subscription or a ‘pay-as-you-go’ mod-
el. Sometimes also known as ‘software on demand’, the SaaS model allows vendors to
develop, host and operate software for customer use. Rather than purchase the hard-
ware and software to run an application, customers need only a computer or a server
to download the application and Internet access to run it. Therefore, business intelli-
gence software is a collection of decision support technologies for the enterprises
aimed at facilitating decision-making for executives, managers, and analysts (Hunter
2010).

16
Last two decades were remarked by intense growth, both in the offer of products and
services and in the adoption of these technologies by enterprises. This growth has
been fueled by the declining cost of acquiring and storing very large amounts of data
arising from sources such as customer transactions in banking, retail as well as in e-
businesses, RFID tags for inventory tracking, email, and query logs for Web sites,
blogs, and product reviews. Enterprises today collect data at a finer granularity, which
is therefore of much larger volume. Businesses are leveraging their data asset aggres-
sively by deploying and experimenting with more sophisticated data analysis tech-
niques to drive business decisions and deliver new functionality such as personalized
offers and services to customers. Today, it is difficult to find a successful enterprise
that has not leveraged BI technology for its business. For example, BI technology is
used in manufacturing for order shipment and customer support, in retail for user pro-
filing to target grocery coupons during checkout, in financial services for claims anal-
ysis and fraud detection, in transportation for fleet management, in telecommunica-
tions for identifying reasons for customer churn, in utilities for power usage analysis,
and health care for outcomes analysis (Chaudhuri, 2011).
Enterprise financial software grew up to save money by replacing manual systems for
accounting and payroll, but then became a repository of information with potential for
increasing revenue in more positive ways. Business Intelligence (BI) refers to com-
puter-based techniques used in spotting extracting, and analyzing business data (such
as sales revenue) by products or departments or associated costs and incomes. Cus-
tomer relationship management (CRM) is a strategy for managing an organization’s
interactions with clients, partners, and sales prospects. It Involves usage of the tech-
nology to organize, automate, and synchronize business processes such as sales activi-
ties, marketing, customer service, and tech support. Enterprise resource planning
(ERP) is an integrated computer based system (or software architecture) used to man-
age internal and external resources including tangible assets, financial resources, ma-
terials, and human resources. Its purpose is to facilitate the flow of information be-
tween all business functions inside the boundaries of the organization, and manage
connections to outside ‘stakeholders’ (Chaudhuri, 2011).
Software as a service (SaaS) is a model of software deployment using the Internet as a
delivery medium. With SaaS, a provider licenses an application to customers for use
as a service on demand, either through a time-bound subscription or a ‘pay-as-you-go’

17
model. Sometimes also known as ‘software on demand’, the SaaS model allows ven-
dors to develop, host and operate software for customer use. Rather than purchase the
hardware and software to run an application, customers need only a computer or a
server to download the application and Internet access to run it (Hunter 2010).
4.2 Overview of major Business Intelligence systems
Business Intelligence systems are constantly developed by various companies, which
provides a wide choice for the companies. A thorough overview of BI systems in this
chapter is provided by Gartner analysts John Hagerty, Rita L. Sallam and James Rich-
ardson (Hagerty et al., 2012).
They explain that business intelligence (BI) platforms enable all types of users —
from IT staff to consultants to business users — to build applications that help organi-
zations learn about and understand their business (Hagerty et al., 2012)..
According to the Figure 2, one may conclude that the leaders of BI market are Oracle,
MicroStrategy, Microsoft, IBM, SAS, SAP, Information Builders and QlikTech. They
all have their strong and weak points, which are described by the researches.
FIGURE 2. Magic Quadrant for Business Intelligence Platforms (February 2012)
Challengers Leaders
Niche Players Visionaries
Abil
ity
to
ex
ecute
Completeness of vision
Tableau
Tibco Software (spotfire)
Information Builders
Oracle
MicroStrategy
Microsoft
QlikTech IBM
SAS
SAP
LogiXML
Actuate Panorama Spftware
Prognoz
Board International Acrplan Targit
Alteryx
Penhtaho Japersoft

18
The most interesting group for this study is the leaders of the BI industry and Mi-
crosoft software particularly. Therefore, Gartner’s overview of the advantages and
drawbacks of Microsoft is immensely important for further research.
4.3 Microsoft Excel as a BI solution for small business
Business intelligence solutions are expensive by the standards of many, and maybe
most, small businesses. There is a real danger of small businesses spending too much
on BI systems and finally finding it too complicated to use for their requirements.
Gerry Blackwell (2010) points out several challenges of a professional BI:
- High price (for example, it costs from $20,000 to $200,000 to implement
QlikView)
- Extra charges (monthly; for extracting data from commonly used applications;
- Data from all sources must also be free of errors and inconsistencies, therefore,
you need a competent employee to check it (Blackwell, 2010)
What is the possible solution to avoid high costs? Some experts say it is Microsoft
Excel. One of them is Rick Sherman (Sherman, 2005), who made a research about the
usage of Microsoft Excel as a Business Intelligence tool. According to the article
(Sherman, 2005), Microsoft states that there are over 150 million Excel users, with
many of them using it for reporting and analysis of corporate data.
For many years BI vendors have been building front-end tools to try to replace spread-
sheets for querying, reporting and analyzing data results. But despite the fact that tens
of thousands of BI tool licenses have been sold, spreadsheets are still the most perva-
sive and dominant tool.
Sherman (2005) explains the popularity of the program by the following reasons:
- It is on practically everyone's PC; there are no extra costs;
- it's easy to learn;
- it does the data manipulation and data graphics companies need for most re-
ports and analyses;

19
- many business people mastered excel spreadsheets (Sherman, 2005)
BI vendors initially responded in two ways. Firstly, they tried to develop Excel-like
interfaces. Secondly, they "integrated" with spreadsheets by exporting data in spread-
sheet formats like CSV (without formulas or formatting). This one-way transfer often
required business users to reformat and recreate formulas, which did not make them or
their IT people (Sherman, 2005).
As far as many analysts confirm that Microsoft Excel is the best solution for small and
medium companies, it is important to look at the Microsoft BI products generally
(their core offerings). Gartner’s research which was made in February 2012 by
Hagerty was taken as the basis for defining the strengths and weaknesses of Microsoft
as a BI vendor.
Strengths.
Microsoft offers a competitive set of BI capabilities, packaging and pricing that ap-
peal to Microsoft developers and its independent distributor channel. The company
has consistently invested in building and enhancing BI capabilities into three of its
core offerings — Microsoft Office (specifically Excel), Microsoft SQL Server and
Microsoft SharePoint — in order to increase their value and drive upgrades. By incor-
porating BI capabilities into its most ubiquitous products, Microsoft virtually guaran-
tees its BI offering's continued adoption, particularly in organizations with a Mi-
crosoft-centric information infrastructure. As a result of this strategy, since the com-
pany's serious entry into the market in 2000, Microsoft's BI market share has grown
steadily to take the No. 3 spot in 2010(Hagerty et al., 2012).
Microsoft's low-license-cost bundling strategy for BI platforms makes it a compelling
license-cost value proposition for organizations that are seeking to deploy BI to a wid-
er range of users, or that are aiming at decreasing overall BI portfolio license costs by
using lower-cost BI tools for basic BI functions. Its license cost profile is comparable
to open-source BI vendors, and it is considerably less than its commercial competitors.
Moreover, Microsoft has added a new BI package (server/client access license model)
for SQL Server 2012, which makes it easier for customers to license the SQL Server
BI portion of the stack. As Microsoft continues to enhance its BI capabilities in prod-

20
ucts that most companies already own (Office, SQL Server and SharePoint), the func-
tionality premium for alternatives may become increasingly difficult to justify for
many organizations. In the Magic Quadrant customer survey, more Microsoft custom-
ers cited TCO and license cost as the core reason for selecting Microsoft as a BI ven-
dor than for most other vendors in the survey (Hagerty et al., 2012).
Microsoft's market success is also driven in part by its IT-oriented, BI authoring tools
within SQL Server, which are based on Visual Studio, the broadly adopted develop-
ment environment. This approach, along with targeted marketing efforts and programs
for building strong developer communities and support, has helped Microsoft lower
the cost and expand the availability of its BI skills. In the Magic Quadrant survey,
Microsoft customers rate its BI platform infrastructure among the highest compared to
most other vendors, and a higher percentage of customers use it extensively. Moreo-
ver, "wide availability of skills" is among the top reasons why customers select Mi-
crosoft more often than all other competing vendors in the survey (Hagerty et al.,
2012).
While Microsoft has traditionally focused on the developer, it continues to enhance
reporting, dash boarding and data discovery capabilities in Excel with the intention of
making Excel not only the most widely deployed BI tool, but also the most functional
for business users. With its April 2010 release of SQL Server PowerPivot and the up-
coming release of Power View in SQL Server 2012, Microsoft has earned the distinc-
tion of being the first mega vendors to offer a credible response to the groundswell of
interest in, and acceptance of, interactive visualization tools as an alternative and
complement to traditional report-centric architectures. Compared to what is available
with competing stand-alone data discovery products, the user and usage monitoring
capabilities of PowerPivot workbooks in SharePoint give IT greater control over what
content is shared, and the process of validating data sources, models and calculations
contained in PowerPivot workbooks. With the SQL Server 2012 release Microsoft is
expected to build on this set of managed business user capabilities by enabling
PowerPivot to move seamlessly from a personal workbook to an enterprise data
source and deployment. Specifically, IT will be able to import user-created content
from a personal PowerPivot model into the professional BI environment of Visual
Studio. This capability can help to bridge the departmental silo/enterprise divide,
without compromising on business-user flexibility (Hagerty et al., 2012).

21
Use of OLAP functionality by Microsoft customers is among the highest when com-
pared to other vendors. This can be attributed to the success and adoption of Microsoft
SQL Server Analysis Services functionality bundled with Microsoft SQL Server and
its optimizations with Microsoft front-end tools. Building on the in-memory capabili-
ties of SQL Server PowerPivot, in SQL Server 2012, Microsoft will introduce a fully
in-memory version of Microsoft Analysis Services cubes that enables the subsecond
analysis of billions of rows (as opposed to hundreds of millions of rows supported
today by PowerPivot), to address the needs of organizations that are turning to neoner
in-memory OLAP architectures over traditional multidimensional OLAP architectures
to support dynamic and interactive analysis of large datasets (Hagerty et al., 2012)..
Microsoft's cloud-based DataMarket offering, which makes external data easier to
consume, analyze and integrate with internal data, is a unique enhancement to Mi-
crosoft's portfolio of BI capabilities. DataMarket is an online data market that enables
ISVs and business users to access, purchase and analyze trusted, public-domain and
commercial premium data (Hagerty et al., 2012)..
Cautions.
Since Gartner began surveying BI platform customers for this Magic Quadrant re-
search five years ago, this is the first year that Microsoft has scored below the survey
average on key Ability to Execute measures, including overall product functionality,
support and customer experience. These results are reflected in Microsoft's lower rela-
tive Ability to Execute position on the Magic Quadrant compared to last year (Hagerty
et al., 2012)..
Multiproduct complexity is a challenge. Because Microsoft's BI platform capabilities
exist across three different tools (Office, SQL Server and SharePoint) that also per-
form non-BI functions, integrating the necessary components and building the appli-
cations is left to the organization. Microsoft's do-it-yourself approach puts more of the
BI solutions development and integration ones for the platform components on cus-
tomers, compared with the all-in-one purpose-built BI platforms offered by most other
vendors in the BI market. Microsoft's road map for Office, which features the consoli-
dation of more and more front-end reporting, dashboard and analysis capabilities in
Excel, should begin to address some of this complexity over time. Moreover, although

22
BI in the cloud is not yet a high priority for most organizations in the Magic Quadrant
survey, Microsoft has placed cloud deployment at the top of its list of major develop-
ment and go-to-market initiatives for BI by ultimately making its core BI products —
SQL Server, SharePoint and Office — available in the cloud. This investment and
emphasis is core to Microsoft's strategy to make BI easy to deploy and low-cost —
cloud-based BI will, in theory, remove some of the complexity of the three-component
requirement (Hagerty et al., 2012).
Microsoft lags behind most other BI vendors in delivering mobile BI capabilities. It
has, instead, relied on partners, such as Decision Support Panel, Roambi and Extended
Results, to build mobile solutions for Apple iOS that integrate with Microsoft BI
components. Microsoft BI assets can run in a browser today, but they are not opti-
mized for iOS, Android or Windows devices. Microsoft has stated that it plans to op-
timize browser experiences on mobile devices in the future, including the version of
Safari provided by the iPad. It is notable that despite limitations to Microsoft's current
mobile BI capability, an above average percentage of Microsoft BI customers report
that they plan to deploy a mobile BI solution in the next 12 months (Hagerty et al.,
2012).
Microsoft discontinued the development of Microsoft Office PerformancePoint Server
2007 (PPS 2007) as a stand-alone solution for financial analytic applications (for ex-
ample, planning, budgeting and consolidation) in favor of moving its CPM capabili-
ties, such as financial reporting, into the Dynamics applications. Microsoft moved the
functionality in PPS 2007 for dashboards, scorecards and analysis natively into Share-
Point as SharePoint 2010 PerformancePoint Services. As a result, Microsoft's perfor-
mance management product strategy lags behind that of the other stack vendors (IBM,
Oracle and SAP) that offer stand-alone CPM products. Microsoft instead relies on its
partners to deliver Microsoft-based CPM solutions (Hagerty et al., 2012).
There is currently no single business metadata layer or capability that spans Mi-
crosoft's BI platform components, and there are limited capabilities for sophisticated
metadata modeling, impact analysis, data lineage and change management. In Gart-
ner's BI platform customer surveys, Microsoft scores below average year after year for
its metadata capabilities. The lack of a unified semantic model of Microsoft system
has been a key customer pain point and limitation. In response, Microsoft will be

23
shipping the BI semantic model as the single business metadata layer, in the SQL
Server 2012 release for relational and multidimensional data, and is adding data line-
age, impact analysis and master data services in SQL Server 2012. As customers up-
grade, one would expect these results to improve in next year's Magic Quadrant sur-
vey (Hagerty et al., 2012).
Microsoft's recent announcement to support Hadoop on Windows is a signal that it has
plans to support diverse data types. However, unlike Oracle and IBM, beyond
Hadoop, even though Microsoft has Bing, its core search engine, and FAST, its enter-
prise search engine in SharePoint 2010, Microsoft has not articulated a comprehensive
vision around delivering analytics for diverse data. At the time of the FAST acquisi-
tion, However, FAST was gaining some traction with its BI search capabilities
(Hagerty et al., 2012).
5 RESEARCH METHODS
While conducting a business research, data collection and data analysis are divided
into quantitative and qualitative. The quantitative method is based on numerical data,
qualitative research, on the contrary, relies on non-numeric data (words).
Mark Saunders, Philip Lewis and Adrian Thornhill (Saunders et al., 2009) define
quantitative data as any data collection technique (for example, a questionnaire) or
data analysis procedure (such as graphs or statistics) that deals with numerical data.
Qualitative research, on the other hand, mainly implies as data collection technique
(an interview) or data analysis procedure (categorizing data) that handles non-
numerical data. Even though qualitative research is usually referred to words, it can
sometimes deal with types of data such as pictures and video clips (Saunders et al.,
2009, 151).
Therefore, focus groups, in-depth interviews, content analysis, ethnography, evalua-
tion and semiotics are among the many approaches that apply to qualitative research,
but in its most basic form this method involves the analysis of any unstructured data,
including open-ended surveys, literature reviews, audio recordings, pictures and web
pages.

24
5.1 Interview
Analyzing various BI systems, it is important to find out what IT software is useful for
the case company. An in-depth interview was chosen as a research method for getting
detailed data.
Before starting the interview process, it is essential to define what the interview is and
choose a proper type. According to Mark Saunders, Philip Lewis and Adrian
Thornhill (Saunders et al., 2009), an interview is “a purposeful discussion between
two or more people”. The use of interviews can help to collect valid and reliable data
that are relevant to the research questions and objectives.
There are various classifications of the interview. Interviews may be highly formal-
ized and structured, using standardized questions for each research participant (often
called a respondent), or they may be informal and unstructured conversations. In be-
tween there are intermediate positions (Saunders et al., 2009, 320).
In the book “Research methods for business students” Mark Saunders, Philip Lewis
and Adrian Thornhill mention several classifications. One of them, presented by Hea-
ley and Rawlinson (Healey 1991; Healey and Rawlinson 1993, 1994), differentiates
standardized and non-standardized interviews. The other typology, created by Powney
and Watts (1987), distinguishes respondent (participant) and informal interviews
(Saunders et al., 2009, 320).
The current research was based on the typology introduced by Mark Saunders, Philip
Lewis and Adrian Thornhill (Saunders et al., 2009). It subdivides the interviews into:
- Structured interviews;
- Semi-structured interviews;
- Unstructured or in-depth interviews.
Structured interviews are basically questionnaires which contain a predetermined
and identical set of questions. These interviews may be referred as interviewer-
administered questionnaires. As the purpose of the structured interviews is to collect
quantitative data they are also referred to as ‘quantitative research interviews’ (Saun-
ders et al., 2009, 320).

25
By comparison, semi-structured and in-depth interviews are ‘non-standardized’. In
this type of the interviews the researcher has a list of topics and questions to be dis-
cussed during the interview, although these may vary in certain situations. Therefore,
it is possible to omit some questions in particular interviews, or to ask extra question
that occur in the process, creating a specific context of the interview. The order of
questions may differ as well, depending on the flow of the conversation. Besides, ad-
ditional questions can be necessary to explore research topic and objectives given the
nature of events within particular organizations. The nature of the questions implies
that the data will be recorded by audio-recording the conversation or note taking
(Saunders et al., 2009, 321).
Unstructured interviews are informal and the researcher does not have a predeter-
mined list of questions to be discussed during the interview. Though, the researcher
needs to have a clear objective and the understanding of the most important aspects
for the interview.
5.2 Observation
Observation is the other research method used for the thesis. Mark Saunders, Philip
Lewis and Adrian Thornhill (Saunders et al., 2009) subdivide observation method
into:
- Participant observation
- Structured observation
According to the authors, structured observation is systematic and has a high level of
predetermined structure. The observer is more detached and interested in quantifying
behavior. The disadvantage of such observation is that it gives the information about
how many times these types of actions happened , but does not explain the motives
why it happened (Saunders et al., 2009, 300).
Participant observation belongs to the qualitative research and it originates from the
science of social anthropology. Structure observation, on the other hand, is quantita-
tive and its main purpose is to count the number and the frequency of the actions
(Saunders et al., 2009, 288).

26
Giving a more detailed look at the participant observation, there exist several roles for
the observer:
- complete participant (a researcher is trying to become a research group mem-
ber and does not reveal his or her purposes);
- complete observer (a researcher does not participate in the activities of the ob-
serving group and keeps the purpose secret);
- observer as participant (a researcher here is more a spectator, but the group
knows that they are being observed);
- participant as observer (a researcher reveals the purposes of the research pro-
cess and participates in the activities) (Saunders et al., 2009, 293-295).
The first two roles (complete participant and complete observer) mean that the re-
searcher conceals his or her identity. These roles make the observation more objective,
because the group does know not about the research and group members behave as
usual. However, these roles are problematic from the ethical point of view. Last two
roles (observer as participant and participant as observer) help to explore the process
deeper, because a researcher may discuss certain issues with the group.
Besides, Mark Saunders, Philip Lewis and Adrian Thornhill (Saunders et al., 2009)
subdivide data received by means of observation into primary, secondary and experi-
ential. Primary observations are mostly taking notes or record of the events. Second-
ary observations are observers’ statements about the events and they include the inter-
pretations. Experiential data is connected to the perceptions of the observer during the
observation process and the way they might change (Saunders et al., 2009, 296).
Mark Saunders, Philip Lewis and Adrian Thornhill (Saunders et al., 2009) adduce the
following factors which determine the choice of the role:
- the purpose of the research;
- available time (participant roles are more time consuming);
- personal traits (participant observer role requires more flexibility);
- organizational access;
- ethical considerations (Saunders et al., 2009, 295-296).

27
Therefore, before starting observation, a researcher should choose the appropriate role
considering the research purpose, personal qualities, the subject of the research and
ethical issues.
5.3 Research process
The purpose of the conducted research was to learn about the current situation of the
financial flows control in the case company Technobatilux and discuss the require-
ment for the IT tool which can facilitate the decision making in the company. In-depth
interview and participant observation were chosen as research methods.
The first research method was participant observation. The role was participant as
observer. The choice of the role was determined by the fact that I worked as an intern
in the company for 3 months (January – April 2012) and my activities directly in-
volved dealing with accountancy of the company (double- entry bookkeeping, under-
standing the accounting principles in the company) and participation in the project
with the purpose to create an excel file which would facilitate cash flow control in the
company.
The first stage of primary data collection was carried out during my internship by
keeping the records for the internship report about what the situation used to be and
what is the current situation of financial management in the company is. As far as the
company was organized in March 2011, they did not have a need of employing a full-
time accountant. They made a contract with an outside accountant who was making all
reports about VAT, salaries, pensions etc in his office for several companies. It lead to
a mess in accounting, because management could not get the data in time, the ac-
countant was quite difficult to reach when they needed his advice.
Therefore, from 2012 they made a decision to do all the bookkeeping themselves and
hire a charted accountant for consultations and preparing reports for tax and other
state services. After a considerate check, he found several mistakes and educated of-
fice staff (including me) about the right usage of the accounting program “Ciel” and
the correct accounting practices. From that moment it was he who prepared quarterly
and yearly reports for the government and calculated the salaries monthly.

28
Still, the management realized the need for more control over finance. To define the
needs of the company, the best solution was in-depth interview. Firstly, it would allow
obtaining the required necessary data through the pre-prepared set of topics and ques-
tions. Secondly, it implies flexibility and helps to ask extra questions and get deeper
data. Finally, it was more suitable for the current research, because the interview was
held on-line via Skype.
The preparation included several stages:
1. Deciding on the main topic and questions to be asked (Appendix 1.)
2. Making an appointment for the interview.
As a result, the interview was conducted with the financial director Marina Bogacheva
on the 8th of November 2012. Establishing the contact was quite easy because of the
warm relationships developed during the internship. Moreover, the company itself is
interested in the development of the project and possible improvements which were
already made and are going to be made.
The interview helped to reveal the reasons why the company needs a tool to control
the cash flow, what were the requirements for this tool and what has been done and
what is planned to be done. Combination of the research methods mentioned above
(observation and interview) ensures that the research is reliable and unbiased.
6 SARL TECHNOBATILUX AND CASH MANAGEMENT
This chapter is aimed at giving the general ideal about the company and its activities
and its analysis by means of SWOT and Value Chain analysis. Besides, it describes
the cash flow management in the company before January 2012.
SARL Technobatilux is a French private limited liability company founded by two
entrepreneurs: Mr. Chaouch, who has over 25 years experience in the construction and
renovation in Italy (Milan) and Monaco; and Miss Bogacheva, who has over 10 years
experience in finance and international investment, mainly with a consulting world-
wide company: PricewaterhouseCoopers, Moscow, Russia.

29
6.1 Description and activities of the case company
The company was organized in March 2011 on the basis of the previously existed
company (2009-2011). The company was reorganized because of the change in part-
nership and new management vision. Mr. Chaouch is now the chief and technical di-
rector and head of the projects and Miss Bogacheva is responsible for the foreign af-
fairs administration and accounting.
The former company made a turnover of 684,000 Euro in 2009, with net income of
120,400 euro, and in 2010 the turnover was 1,645,300 euro. Contrary to all expecta-
tions, the net income for 2010 was a loss of almost 300,000 euro. This loss began the
long process of analysis of weaknesses in business, resulting in antagonisms between
the two partners. The conducted analysis highlighted the following problems:
- Inflexibility of organizational structure (in February 2011 there were 54 work-
ers with open-ended contracts),
- Lack of discipline (non-compliance with working hours, strikes),
- Lack of control over expenditures,
- Uncertain purchasing policy,
- Lack of budgeting / planning / project management control, etc.
These problems resulted in long delays in the work and very high costs. Mr. Chaouch,
technical director and project manager, saw the solution of problems in proper finan-
cial management. According to his plan, new treaties were concluded in March 2011.
The new company was created on the 31st of March 2011 and it exists nowadays.
The economic sector here the company operates is the Building and Public Works
and it includes all activities of design and construction of public and private buildings,
industrial or otherwise, and infrastructure such as roads or pipelines.
To define the position of the company at the market, it is necessary to describe its ac-
tivities and have an overview of the major competitors. The information was gathered
by means of observation and secondary sources research.

30
Competition
The construction sector in France is represented by about 480 000 companies (of
which 93% have fewer than 10 employees because of a great number of independent
craftsmen (Les entreprises - Métiers du BTP, 2012).
In 2009 there were about 52 000 construction enterprises in Provence-Alpes-Côte
d'Azur which employed more than one hundred people. The turnover in building was
9 632 million euro (without VAT), and 3 537 million euro in public works (Les
entreprises - Métiers du BTP, 2012). Therefore, the sector may be considered as a
competitive one.
Technobatilux faces two types of competition: direct and indirect.
Direct competition consists of all firms offering similar products or services: the con-
struction of private houses, the renovation and maintenance of apartments and shops.
It can be subdivided into:
1) Large scale construction enterprises (EIFFAGE, VINCI, Maisons France
Confort , FAYAT etc)
2) Small and medium sized enterprises
a. Companies with specialization in construction of residential and non-
residential buildings (Maisons Avenir Tradition, Maisons Olivia De
L'Oustal etc.)
b. Companies with specialization in certain fields like plaster works, join-
ery, installation of heating etc.
3) Self-employed craftsmen
Indirect competition is made up of businesses, offering a different product or service
but meeting the same need – for example, the increasing popularity of “Do It Your-
self” trend (online guidance, booklets, magazines etc). These factors make the com-
petition rather intense.

31
Activities
The activities of Technobatilux are designed to meet the need of two market seg-
ments:
B to C: The major target market is Eastern European customers (particularly from
Russia and Ukraine) who would like to have a house built or an apartment renovated
on Côte D’Azur (Nice, Cannes and other French cities on the Mediterranean coast).
These customers usually do not speak French or fluent English, so
TECHNOBATILUX provides its services in Russian.
B to B: The other segment is a professional one: company has a number of partner
companies (suppliers of the materials, smaller companies-sub-contractors that provide
specific services like plumbing etc)
The activities of construction companies in France are determined by NAF 2008 codes
(Insee, 2010). (Table 1.). All the codes were translated from the French language, be-
cause there was no English version.
TABLE 1. Company’s activities
Code Description
41.20A
Construction of residential
and nonresidential build-
ings
General construction or various trades taking overall
responsibility for the construction of a building
The modification or renovation of existing residential
structures
43.99C
Masonry and general struc-
tural works
Construction activities specializing in one aspect
common to different structures, requiring specialized
skill or equipment:
masonry, paving;
masonry and concrete work
realization of fencing of masonry or concrete
plates
mounting frames for concrete forms
To be continued
32
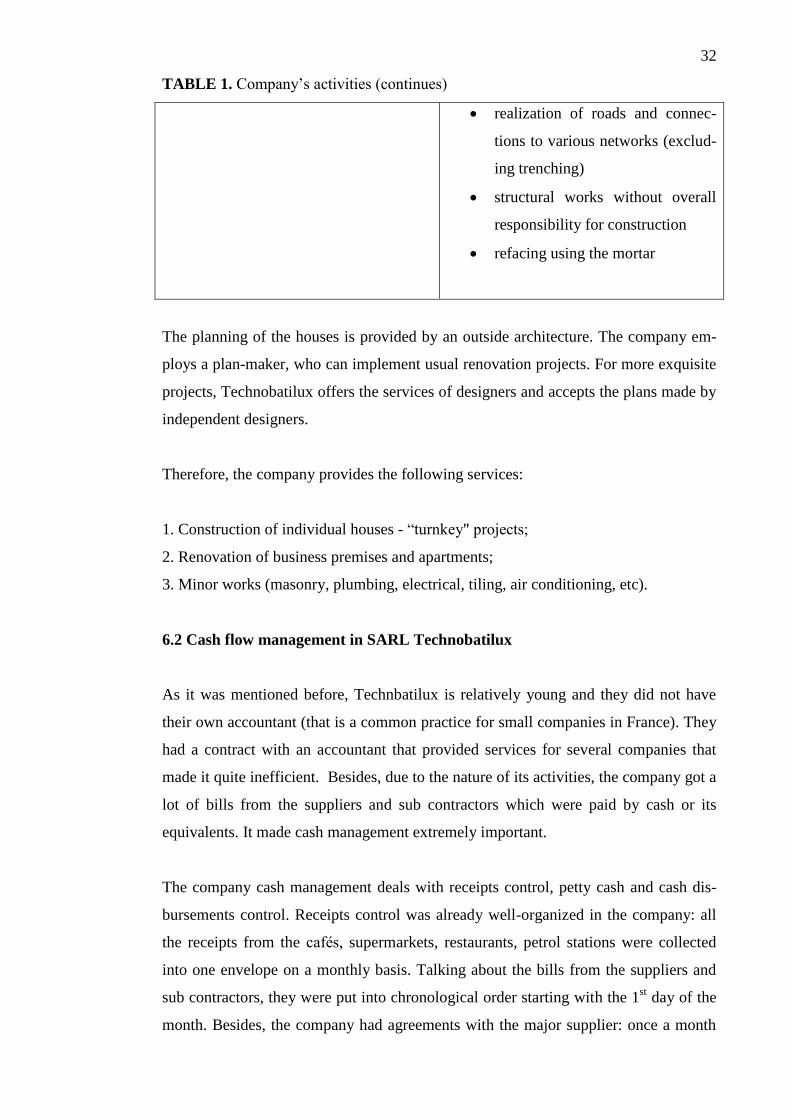
TABLE 1. Company’s activities (continues)
realization of roads and connec-
tions to various networks (exclud-
ing trenching)
structural works without overall
responsibility for construction
refacing using the mortar
The planning of the houses is provided by an outside architecture. The company em-
ploys a plan-maker, who can implement usual renovation projects. For more exquisite
projects, Technobatilux offers the services of designers and accepts the plans made by
independent designers.
Therefore, the company provides the following services:
1. Construction of individual houses - “turnkey" projects;
2. Renovation of business premises and apartments;
3. Minor works (masonry, plumbing, electrical, tiling, air conditioning, etc).
6.2 Cash flow management in SARL Technobatilux
As it was mentioned before, Technbatilux is relatively young and they did not have
their own accountant (that is a common practice for small companies in France). They
had a contract with an accountant that provided services for several companies that
made it quite inefficient. Besides, due to the nature of its activities, the company got a
lot of bills from the suppliers and sub contractors which were paid by cash or its
equivalents. It made cash management extremely important.
The company cash management deals with receipts control, petty cash and cash dis-
bursements control. Receipts control was already well-organized in the company: all
the receipts from the cafés, supermarkets, restaurants, petrol stations were collected
into one envelope on a monthly basis. Talking about the bills from the suppliers and
sub contractors, they were put into chronological order starting with the 1st day of the
month. Besides, the company had agreements with the major supplier: once a month

33
the supplier sent them the copies of all the bills (paid and unpaid), so it was easy to
track whether some bills were lost.
Concerning cash disbursements control, it was quite secure, because the access to the
check book and the corporate bank cards had only two people: the director and the
supplying manager. Still, it occurred, that the checks did not contain enough infor-
mation (for example, there was no indication of the date and to whom the check was
given). This fact made verifying the bills with the back records quite time consuming.
Petty cash was a weak point, because usually there were no records about whom and
in what amount the money from the till were given. The only prove were receipts,
which were sometimes lost.
As a result after almost a year of operating, the company had to revise all the receipts
and bills and verify all the data with the bank accounts. Because some receipts were
missing, there were some minor differences in the cash the company had and the
amount it spent.
6.3 SWOT analysis of Technobatilux
Analysis of the company by means of SWOT was carried out by means of the partici-
pant observation during my internship. SWOT analysis was made to determine major
problems of the company and its possible threats which can be solved by more precise
controlling of cash flows.
It allows to look and strong and weak points inside the company and to see the oppor-
tunities of possible improvements. Therefore, carrying out SWOT analysis which con-
sists of strengths and weaknesses of Technobatilux (Table 2) and opportunities and
possibilities (Table 3) is essential to correct possible weaknesses and avoid threats
aiming at developing the business and creating competitive advantage which would
grow into sustainable development of the company.

34
TABLE 2. Strengths and weaknesses of Technobatilux
Strengths Weaknesses
Product
- High quality of provided ser-
vices with 10-year warranty
- Additional services individual-
ized for every customer (pick-
ing up from the airport, help
with shopping and dining for
clients who do not speak French
etc)
The individualization of
the services requires more
time, as a result the com-
pany is not capable to
take more products and
the costs are higher
Price The company’s main pricing strate-
gy – skimming- allows increasing
profit margins. Meanwhile, price
flexibility in certain situations
The product quality and
market positioning (
building and renovation
of top quality) does not
allow the usage of low
quality material)
The company has all legal
permissions for construct-
ing in France, it provides
Place Versatile distribution :
- Real estate agents in
Russia and France
- Web-Site and e-mail
The cost of distribution via
intermediaries (real estate
agents) is quite high (3 – 7%
of the project price).
Promotion - Versatile promotion, especially
via internet : web-site, on-line
catalogues, web-site
- High quality services provide
intense word-of-mouth advertis-
ing
- Professional site, logo build
recognizable image of the com-
pany
The lack of print and outdoor
advertising, because of high
costs

35
It is eveident that the company has a lot of strengths, but still it has certain weaknesses
(especially it concerns financial issues)
TABLE 3. Opportunities and threats
Opportunities Threats
Offer Possibility of penetration
to new markets (Monaco,
Italy) due to increasing in-
terest of Russian speaking
clients to these countries
Obtaining the certification
for swimming pool con-
struction
Intense competition because of
the easiness of market penetra-
tion
Demand Constant increase in de-
mand on real estate in the
south of France
Increasing interest of
Russian speaking custom-
ers in real estate in South-
ern Europe as a whole
Customers’ taste may change
under the influence of the fash-
ion, they may become more
picky, experienced etc
Environment The concept of sustainable
development, which is one
of the point of the compa-
ny’s strategy
Government favors long-
term investments which
may stimulate the compa-
ny’s growth
A great number of skilled
workforce
The development of the
constructing technologies
Constantly changing legislation
(especially tax legislation)

36
To sum up the SWOT analysis, it is possible to conclude that the company has a well-
developed marketing strategy, but as far as the market is not stable the company defi-
nitely needs other tools for sustainable activities.
6.4 Value chain analysis of Technobatilux
Technobatilux value chain analysis was made together with the financial manager in
March 2012. Its purpose was to point out the major management needs and to think
about the possible solutions. (Table 4.)
TABLE 4. Value Chain analysis.
Primary Value chain
activities
Management Needs
Inbound Logistics
include the receiving, ware-
housing, and inventory con-
trol of input materials
- Get the supplies in time
- Correct transportation and storage condi-
tions to avoid damage
Operations (the processes of
transforming inputs into fin-
ished products and services)
- Compliance with due dates
- Quality control
- Constant customer support (weekly re-
ports about the progress of the projects,
pick-up from the airport etc)
Outbound Logistics: activi-
ties required to get the fin-
ished product to the custom-
er, including warehousing,
order fulfillment
- Invoicing in time
Marketing & Sales: activi-
ties associated with getting
buyers to purchase the prod-
uct, including channel selec-
tion, advertising, pricing, etc.
- Promotion channels
- Customer satisfaction
- Pricing
- To be continued

37
-
TABLE 4. Value Chain analysis (continues).
Service: the support of cus-
tomers after the products and
services are sold to them
(customer support, repair
services, etc.)
- Warranty
- After service relations
Support Activities
The infrastructure of the
firm: organizational struc-
ture, control systems, com-
pany culture, finance, legal,
quality management etc.
- Financial control
- Legislation compatibility
- Service quality management
Human resource manage-
ment: employee recruiting,
hiring, training, development,
and compensation.
- Recruitment of skilled personnel
- Planning of the staff schedules
- Salaries
- Safety
Technology development:
technologies to support val-
ue-creating activities.
- Usage of efficient technologies
Procurement: purchasing
inputs such as materials, sup-
plies, and equipment.
- Creation of qualitative supply chain
- Professional subcontractors
7 CASH FLOW CONTROL TOOL FOR TECHNOBATILUX
The solution for the company was created together with the financial director of
Technobatilux Marina Bogacheva who had eight year experience in financial man-
agement before establishing Technobatilux in France. The project was held during
January – April 2012 and during this period a demo version of the Microsoft Excel
file was developed. The important details about the functionality and possible im-
provements were received from the in-depth interview

38
7.1 Developing Excel spreadsheet for cash control in Technobatilux
The employer of this project is a micro company, thus, it cannot afford buying expen-
sive software. Some of the professional software is pretty complicated, expensive or
both. After the analysis, the management concluded that Microsoft excel matches the
needs of the company and it is the best solution during the current stage of the compa-
ny’s development, because the company already has Microsoft Office 2010, the em-
ployees are competent in Microsoft Excel, and it is suitable for the small number of
projects (usually, 2-5) the company implements at a time.
Considering the company’s need, it was decided that Excel spreadsheets should in-
clude the most essential information. (Figure 3.)
FIGURE 3. Structure of the Excel Spreadsheets
The structure of the demo version which was developed during the internship in Janu-
ary-May 2012, differed from the one mentioned above. It included only the most es-
sential things such as sales, purchases and the total summary of costs and profits. Be-
low one may see these tables and their description. It is important to note that all the
numbers, dates and names are changed due to business ethics reasons.

39
The first spreadsheet is devoted to the sales. (Table 5.). Here a manager can see:
- Date of issuing the invoice
- Invoice amount with and without tax and also tax amount
- Name of the client and the code of the project
- Number of the invoice from the register
- Sum which is to be received (accounts receivable) or is already received and
the mode of payment (usually, clients pay by bank transfers and checks, rarely
by cash).
TABLE 5. Excel Spreadsheet “Sales”
SALES
DAT
E
Price
including
tax
Net of
Tax VAT Client Code Invoice #
Re-
ceived
Ac-
counts
receiv-
able
Mode
of
Pay-
ment
08.01
.2012 7 000 6 635 365 Client 1 021 2012/04 7 000 0
Bank
Trans-
fer
20.01
.2012 5 000 4 739 261 Client 2 005 2012/09 0 5 000
28.01
.2012 10 000 9 479 521 Client 2 005 2012/05 10 000 0 Check
06.02
.2012 50 000 47 393 2 607 Client 2 005 2012/08 50 000 0
Bank
Trans-
fer
07.02
.2012 20 000 18 957 1 043 Client 2 005 2012/10 20 000 0
Bank
Trans-
fer
21.02
.2012 10 000 9 479 521 Client 2 005 2012/06 10 000 0
Bank
Trans-
fer
The next spreadsheet is “Purchases”. (Table 6.) It includes all the expenses and bills
the company has to pay. The expenses are subdivided into
- Administrative (they have the code 038); these are the expensive connected
with office activities and the cost is less than 500 euro. Besides, administrative
costs include all fixed costs such as rent, insurance etc;

40
- Commercial (all the money spent on the client services; usually meetings in
the restaurant, excursion, presents etc);
- Salaries;
- Supplies and Subcontractors (bills from the suppliers as well as credit notes;
contracts with other companies)
- Banking charges.
The last three columns represent the money which was paid or not paid and how they
were paid. Here the modes of payment differ more than in sales. The company pays
by bank card, via bank transactions, cash, bank checks, standing orders.
TABLE 6. Excel Spreadsheet “Purchases”
Purchases
DAT
E
Price
including
tax
Net
of
Tax VAT Supplier
Code
of
project
Reference
#
Type of
expenses Paid AP
Mo
de
of
pay
me
nt
970 811 159 770 200
11.11.
2011 100 84 16 Supplier 1 038 1 234 Adm 100 0
Ban
k
card
11.11.
2011 50 42 8 Cafe 1 021 201 Com 50 0
Cas
h
11.11.
2011 200 167 33 Supplier 2 003 12 345 Mat 0 200
11.11.
2011 150 125 25 Supplier 4 003 12 346 Mat 150 0
Che
que
11.11.
2011 500 418 82
Company
2 021 10 Subcon 500 0
Ban
k
card
11.11.
2011 20 17 3 Bank 038 98 765 Bank 20 0
Ban
k
card
12.11.
2011 -50 -42 -8 Supplier 2
Credit -50 0

41
The main spreadsheet “Total” represents the summed up information for every pro-
ject: revenue, expenses (salaries, administrative, commercial, supplies and subcontrac-
tors). As a result, it shows the operating income and calculates ROS (Return on Sales
–a ratio that provides insight into how much profit is being produced per euro of sales
and shows the company’s efficiency in a project). (Table 7.)
TABLE 7. Excel Spreadsheet “Total”
Year
2011
Code 004 005
INFO
Project 1 Project 2
YE
AR
2 0
1 2
Operating Income (EURO) 12 000 € 0 €
ROS (%) 22% #DEL0!
Revenue 55 500 € 0 €
Expenses TOTAL 48 500 € 0 €
Salaries 7 850 € 0 €
Administrative 1 100 € 0 €
Worker 1 2 000 € 0 €
Worker 2 1 000 € 0 €
Worker 3 0 € 0 €
Worker 4 1 150 € 0 €
Worker 5 0 € 0 €
Worker 6 1 000 € 0 €
Worker 7 1 600 € 0 €
Supplies & subcontractors 6 400 € 0 €
Administrative expenses 1 500 € 0 €
Ja
nu
ary
Operating Income (EURO) 8 500 € 0 €
ROS (%) 34% #DEL0!
Revenue 25 000 € 0 €
Expenses TOTAL 16 500 € 0 €
Feb
rua
ry
Operating Income (EURO) -1 500 € 0 €
ROS (%) -5% #DEL/0!
Revenue 30 500 € 0 €
Expenses TOTAL 32 000 € 0 €

42
As it is seen in Table 8, the manager is able to see if the project is profitable or not
every month and then allocate resources next month to make it more profitable. The
“total” spreadsheet is interlinked with other spreadsheets where revenues, costs and
salaries are calculated. The dependence between the work sheets allows avoiding
manual typing of the data. (Table 8.)
TABLE 8. Description of the Excel document
№ Title of the
spreadsheet
Description Incoming
Document
Outcoming
Document
Level1. Automatic
1 Total Includes:
- Operating Income
- Revenue on Sales
- Revenues
- Charges (administrative, com-
mercial, salaries, supplies and
subcontractors)
This spreadsheet reflects reve-
nue and profitability of every
project on monthly and yearly
basis.
- Revenue
(2)
- Adminis-
trative
Costs (3)
- Salaries
(6)
- Purchas-
es (5)
-
2 Revenue It reflects the amount of money
the company receives from a
client for every project.
Sales(4) Total (1)
3 Administra-
tive charges
per project
Administrative charges are cal-
culated per each project propor-
tionally to the overall price of
the project
Purchas-
es(5)
Total (1)
To be continued

43
Continues
Level 2, Semi automatic
4 Sales It shows paid and not paid cus-
tomers’ bills( may be compared
to the accounts receivable)
Invoices
to the cli-
ents (7)
- Revenue(2)
- Total (1)
5 Purchases It fixes all the costs depending
on the category (administrative,
salaries etc.)
Bills from
the suppli-
ers(8)
6 Salaries This spreadsheet contains the
name and professions of the em-
ployees and the number of work-
ing hours per project.
Weekly
schedule
(9)
Total (1)
Level 3. Manual (which are not included to the excel, but fixed in the accounting)
7 Invoices to
the clients
Invoices that are to be paid by
the client
- Sales(4)
8 Bills from the
suppliers
Bills that received from the sup-
pliers
- Purchases (5)
9 Weekly
schedules
Papers filled by the employees
(how many hours an employee
worked at a project during a
week)
Salaries (6)
7.2 Possible development and further application
The first part of the sub-chapter is based on the in-depth interview that helped to point
out at some corrections that have been made and some points where the file could be
improved. The second part is devoted to the advantages of the developed system and
its possibilities for other companies.
First demo addition that was made during summer 2012 concerns the cost of work per
project on monthly basis (table 9.). It allows seeing what kind of works was completed
during one month period and how many days were spent on the certain type of job.

44
TABLE 9. Cost of jobs per month
TOTAL January
Code of the project
Total
cost 001 004
Days 20 12 Cost of works 6 450 4 450 2 000
Office Workers 0 200 0
Tiler 0 0 1 000
Electrician 0 0 0
Unskilled workers 0 2 000 1 000
Carpenter 0 750 0
Painter 0 0 0
Plumber 0 1 500 0
This addition was considered an important one, because it gives the idea about the
situation with every single project. Besides, it facilitates the tasks of a manager who
gives monthly reports to the clients about what was done during the month and wheth-
er the company follows the contract timing if there are some delays. The other im-
provement that was made is to include more financial analysis ratios to see more de-
tailed results. Besides, the file should definitely include liquidity and solvency ratios
that were described in chapter 3.3.
However, it is hard to control which project the employee was working on, as one
person may sometimes work on several projects during one day. Probably, the solu-
tion to it would be presence leaves (Appendix 2.) These presence leaves may contain
the information not only about the hours spent on this or that project, but also notes
about the absence and reasons. Although, as a rule, employees do not work on Satur-
days, sometimes they are required to finish the job if the deadline is close.
The developed IT tool has certain benefits, which can attract micro and small busi-
nesses that are looking for a simple business intelligence solution. First of all, most of
the companies use Microsoft office which already includes Excel, so they do not need
to spend extra money on buying professional software. Secondly, BI software is main-
ly developed to large businesses and as a consequence it includes a great number of
the functions which are unnecessary for small companies. Thirdly, usually all manag-
ers are proficient users of Excel, therefore, in case of employing a new worker, the
company will not need a lot of time for retraining. Fourthly, excel is safer, because it

45
is stored on the office computer and does not send any data on the internet server.
Lastly, it is easily adjustable to the company’s need and situation (for example, a pro-
ducing company may add a spreadsheet concerning cost of goods sold).
8 CONCLUSION
Normally small companies have to find opportunities that are well suited to the partic-
ular resources and competences of the firm. The conducted research was aimed at de-
veloping an IT tool for controlling cash flows in the French company Technobatilux
which was the company where I used to worked as an intern for three months. During
my internship I was working on the project of cash flow control tool and also im-
proved my accounting skills.
After theoretical and practical analysis of possible business intelligence solutions, the
conclusion is that the main disadvantage of the existing BI systems is their price and
necessity of special skills. It makes them unaffordable for micro and small companies.
Moreover, purchasing a professional BI system may involve extra costs (both finan-
cial and labor). The overview of the BI market leaders and of analysts’ opinions
showed that professional business intelligence software is suitable only for large com-
panies which have disposable resources. In the same time, a great number of SMEs
prefer not to have BI programs and to find their substitutes that match their needs.
To obtain reliable and objective results, the research combined two methods observa-
tion and an in-depth interview. This combination allowed to learn the situation in de-
tails, participate in the activity of the creating an excel file and get an experience.
Microsoft Excel was chosen as a substitute for SARL Technibatilux. A corresponding
excel file was developed during this study. It includes the revenues, invoices, purchas-
es and profitability of each project of the company. It responds to the need of the
management of controlling profitability of every single constructing project on real
time basis. Besides, the thesis includes recommendations for improvements of the
system.

46
To sum up, adjustability and adaptability of the developed IT tool may easily serve
small companies as a substitute for business intelligence system. By suggested im-
provements every company may develop and improve the system according to their
needs and goals.

47
BIBLIOGRAPHY
Books
Hongren, Charles – Harrison, Walter 2012. Accounting. 9th
edition. Upper Saddle
River, NJ. Pearson/Prentice Hall.
Gillian, Colin – Wilson, Richard 2009. Strategic Marketing planning. Oxford. But-
terworth-Heinemann.
Johnson, Gerry 2005. Exploring corporate strategy. Text and cases. 7th edition.
Essex. Pearson Education Limited
Kotler, Philip – Keller, Kevin 2008. Marketing Management. 12th
edition. Upper
Saddle River, NJ. Pearson/Prentice Hall.
Marshall, David H. 2011. Accounting: what the numbers mean. New York. The
McGraw-Hill Companies
Porter, Michael, 1998. Competitive Advantage: Creating and Sustaining Superior
Performance. New York. Free Press.
Saunders, Marc – Lewis, Philip – Thornhill, Adrian 2009. Research Methods for
Business Students. 5th
edition. Harlow. Pearson Education Limited.
Weetman, Pauline 2009. Management Accounting. 2nd
edition. Harlow. Pearson
Education Limited.
Wild, John – Shaw, Ken 2011. Fundamental Accounting Principles. 20th
edition.
New York. McGraw-Hill/Irwin.
Electronic sources
Blackwell, Gerry 2010. Is Business Intelligence for Small Business, Too? Small
business computing referred 1.8.2012. Available in www-format:

48
<http://www.smallbusinesscomputing.com/news/article.php/11520_3892886_2/Is-
Business-Intelligence-for-Small-Business-Too.htm>.
Cambridge Dictionaries Online. Budget referred 5.8.2012. Available in www-
format:
<URL http://dictionary.cambridge.org/dictionary/british/budget_1?q=budget>.
Chaudhuri, Surajit 2011. An Overview of Business Intelligence Technology. Com-
munications of ACM referred 20.4.2012. Available in www-format:
<URL: http://cacm.acm.org/magazines/2011/8/114953-an-overview-of-business-
intelligence-technology/fulltext>.
Hagerty, John 2012. Magic Quadrant for Business Intelligence Platforms. Gartner
referred 15.6.2012. Available in www-format:
<URL: http://www.gartner.com/technology/reprints.do?id=1-
196WFCB&ct=120207&st=sb>.
Hunter, Philip 2010. Focusing on Finance. Engineering and Technology Magazine
referred 17.3.2012. Available in www-format:
<URL: http://eandt.theiet.org/magazine/2010/07/focus-on-finance.cfm>.
Insee [on-line]. National Institute of Statistics and Economic Studies referred
20.3.2012. Available in pdf-format:
<URL:
http://www.insee.fr/fr/methodes/nomenclatures/naf2008/pdf/naf2008_F.pdf>.
Les entreprises - Métiers du BTP [on-line]. Observatoire Prospectif des Metiers et
des Qualifications du Batiment et des Travaux referred 15.3.2012. Available in
www-format:
<URL: http://www.metiers-btp.fr/reperes/chiffres-du-btp/Pages/entreprises.aspx>.
QuickMBA [on-line]. Strategic management referred 18.3.2012. Available in www-
format:
<URL: http://www.quickmba.com/strategy/value-chain/>.

49
Sherman, Rick 2005. Microsoft Excel: The king of BI. Search CRM referred
18.3.2012. Available in www-format:
<URL: http://searchcrm.techtarget.com/news/1081869/Microsoft-Excel-The-king-
of-BI>.

APPENDIX 1.
Main interview questions:
Q1: When is your company founded?
Q2: Why did you reorganize it?
Q3: How is the company’s financial management organized?
Q4: What was the goal of developing an Excel file to control cash flows?
Q5: Why did you choose Microsoft Excel?
Q6: What were the major points to include into this IT tool?
Q7: Are you satisfied with the demo version which was developed? Were there any
corrections after the trial of the demo version?
Q8: What are the corrections?
Q9: Would you like to make some further improvements into the developed system?

APPENDIX 2.
Presence Leaves
Presence Leave
Name
:
Monday ____ . ____ . 2012
Tuesda
y
____ . ____ .
2012
Wednesda
y
____ . ____ .
2012
Project # 8.00-
12.00
14.00-
18.00
Project
#
8.00-
12.00
14.00
-
18.00
Project # 8.00-
12.00
14.00
-
18.00
1
1
1
2
2
2
Thursday ____ . ____ . 2012
Friday ____ . ____ .
2012
Saturday ____ . ____ .
2012
Project # 8.00-
12.00
14.00-
18.00
Project
#
8.00-
12.00
14.00
-
18.00
Project # 8.00-
12.00
14.00
-
18.00
1
1
1
2
2
2
Notes