italy in the eu: economic perspectives and challenges italy's public debt-to-gdp ratio -8-6-4-2...
TRANSCRIPT

Lucio Pench Director, Fiscal Policy
European Commission DG Economic and Financial Affairs
INTERNATIONAL BANKING FORUM 2011
Brescia, 13-14 June 2013
Italy in the EU: Economic
Perspectives and challenges

2 2
EUROPEAN
CONTEXT

3 3
Gradual recovery in the Euro area
100
102
104
106
108
110
112
114
116
0 1 2 3 4 5 6 7 8 9 10 11 12 13 14 15 16 17 18 19 20 21 22
Past recoveries Developments since 2009Q2
Quarters
Index
Note: Real GDP following the recessions of the mid 1970s, early 1980s and early 1990s
*European Economic Forecast – Spring 2013
forecast*

4 4
Europe's answer to the crisis
FINANCIAL
STABILITY
PUBLIC
DEBT
ECONOMIC
GROWTH
Breaking the
vicious circle
Structural
reforms
Fiscal
discipline
Banks Banks
recapitalization
Firewalls
Differentiated, growth-
friendly fiscal
consolidation
Commission proposal for
a single surveillance
mechanism
ESM: fully
implemented
since October
2012
ECB: Outright
Market
Transactions
Compact for
Growth and
Jobs
Further fiscal
measures and
structural reforms in
some Member states
€100bn to cover
financial
requirements of
Spanish banks
COMPLETE MONETARY UNION
EU and
national fiscal
governance
reform:
• Six pack
• Two pack

5 5
Annual Growth Survey 2013
1. Pursuing differentiated, growth-friendly fiscal
consolidation
2. Restoring normal lending to the economy
3. Promoting growth and competitiveness for
today and tomorrow
4. Tackling unemployment and the social
consequences of the crisis
5. Modernising public administration

6 6
ITALY

7 7
Slow growth and low employment
-6
-4
-2
0
2
4
2005 2006 2007 2008 2009 2010 2011 2012 2013 2014
IT - Hours worked EA - Hours worked IT - Real GDP EA - Real GDP
Forecast

8 8
Loss of external competitiveness (1)
95
100
105
110
115
90 92 94 96 98 00 02 04 06 08 10 12
Index (
1990 =
100)
EA-12 IT
-8
-6
-4
-2
0
2
4
6
8
10
12
14
16
99 00 01 02 03 04 05 06 07 08 09 10 11 12Cum
ula
tive c
hange s
ince 1
998 (
%)
ULC contribution NEER contribution
REER
-4
-3
-2
-1
0
1
2
3
4
98 99 00 01 02 03 04 05 06 07 08 09 10 11 12*
% o
f G
DP
Capital accountCurrent transfersIncome balanceTrade balance - servicesTrade balance - goodsTrade balanceCurrent account balance (CA)
A deteriorating current account …
… mainly driven by a subdued total factor productivity trend …
… not reflected in wage dynamics and exacerbated by NEER*
* Nominal effective exchange rate
9 9
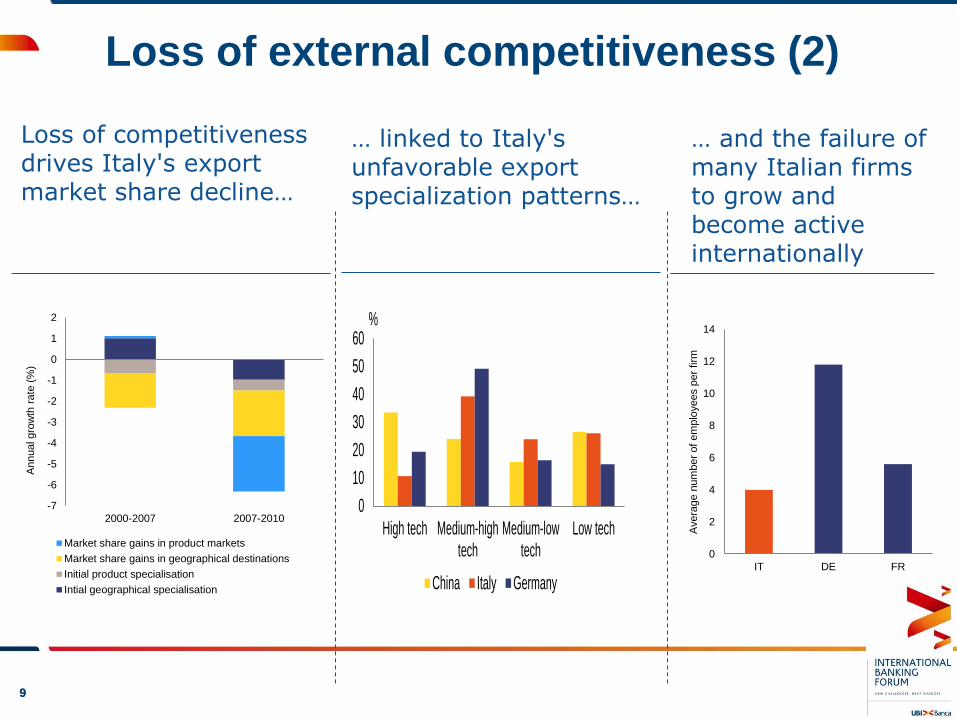
Loss of external competitiveness (2)
-7
-6
-5
-4
-3
-2
-1
0
1
2
2000-2007 2007-2010
Annual gro
wth
rate
(%
)
Market share gains in product markets
Market share gains in geographical destinations
Initial product specialisation
Intial geographical specialisation
0
10
20
30
40
50
60
High tech Medium-hightech
Medium-lowtech
Low tech
China Italy Germany
%
Loss of competitiveness drives Italy's export market share decline…
… linked to Italy's unfavorable export specialization patterns…
0
2
4
6
8
10
12
14
IT DE FR
Avera
ge n
um
ber
of
em
plo
yees p
er
firm
… and the failure of many Italian firms to grow and become active internationally
10 10
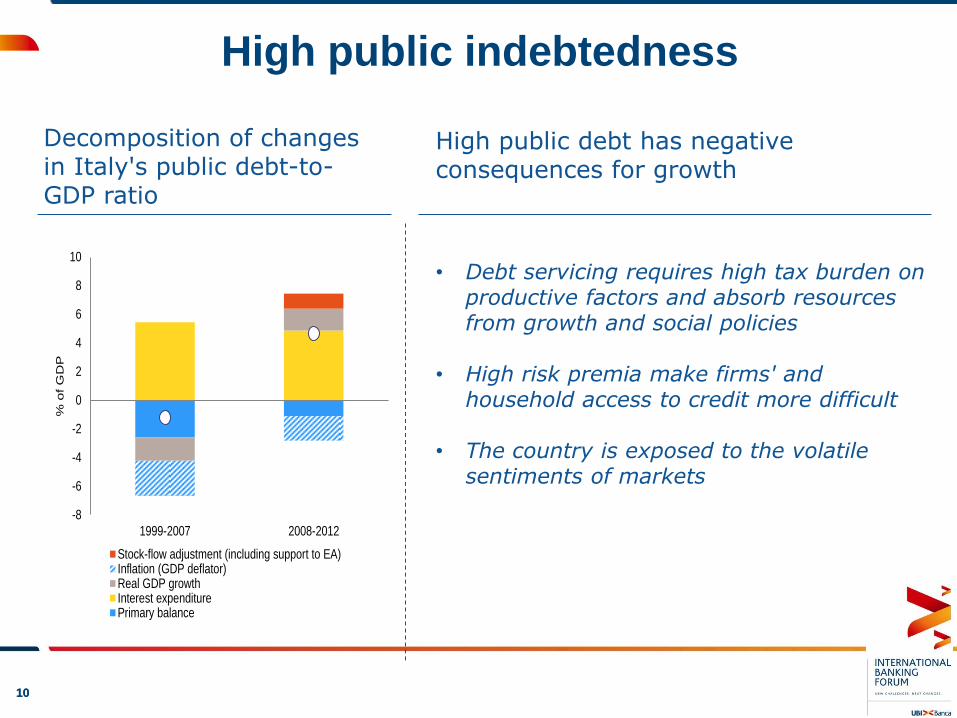
High public indebtedness
Decomposition of changes in Italy's public debt-to-GDP ratio
-8
-6
-4
-2
0
2
4
6
8
10
1999-2007 2008-2012
% o
f G
DP
Stock-flow adjustment (including support to EA)Inflation (GDP deflator)Real GDP growthInterest expenditurePrimary balance
• Debt servicing requires high tax burden on productive factors and absorb resources from growth and social policies
• High risk premia make firms' and household access to credit more difficult
• The country is exposed to the volatile sentiments of markets
High public debt has negative consequences for growth

11 11
High public indebtedness: current
perspectives
96
100
104
108
112
116
120
124
128
132
136
140
2010 2011 2012 2013 2014 2015 2016 2017
(% of GDP)
Stochastic debt projections 2013-17, ITALY
p10_p20 p20_p40 p40_p60
p60_p80 p80_p90 p50 gdebt_gdp_DSM
Source: Commission Services

12 12
The need to mobilize publicly-owned assets

13 13
State aid to Italian financial institutions has been among the lowest in the EU so far
0%
50%
100%
150%
200%
250%
300%
350%
400%
IE DK
BE
GR
ES
NL
UK
LV
PT
SW S
I
AT FI
CY
DE
LU
FR
PL
HU IT SL
LT
BG
CZ
EE
MT
RO
EU
27
Recapitalisation measures Other measures*
Source: European Commission (Facts and figures on state aid in the EU Member States, Commission Staff working document – autumn 2012 update, SEC(2012) 443 final). * Includes guarantees, asset relief interventions and liquidity measures.
Approved amounts of aid to financial institutions per Member State (% of 2011 GDP, measures between 1
October 2008 and 1 October 2012)

14 14
Bank loans to firms contract, and SMEs in particular suffer from tight credit conditions
-6
-4
-2
0
2
4
6
8
10
12
14
16
Jan 0
3
Sep 0
3
May 0
4
Jan 0
5
Sep 0
5
May 0
6
Jan 0
7
Sep 0
7
May 0
8
Jan 0
9
Sep 0
9
May 1
0
Jan 1
1
Sep 1
1
May 1
2
Jan 1
3
%
0
1
2
3
4
5
6
7
Ja
n 0
3
Se
p 0
3
Ma
y 0
4
Ja
n 0
5
Se
p 0
5
Ma
y 0
6
Ja
n 0
7
Se
p 0
7
Ma
y 0
8
Ja
n 0
9
Se
p 0
9
Ma
y 1
0
Ja
n 1
1
Se
p 1
1
Ma
y 1
2
Ja
n 1
3
%
All loans Up to EUR 250k
Up to EUR 1m Over EUR 1m
ECB policy rate
12-month % change in stock of loans to non-financial corporations in Italy
Interest rate on new bank loans to non-financial corporations in Italy
Source: Bank of Italy

15 15
Banks' total bad debts have tripled since 2009, while bad debt coverage has trended down
0
20
40
60
80
100
120
140Jan-0
9
Apr-
09
Jul-09
Oct-
09
Jan-1
0
Apr-
10
Jul-10
Oct-
10
Jan-1
1
Apr-
11
Jul-11
Oct-
11
Jan-1
2
Apr-
12
Jul-12
Oct-
12
Ja
n-1
3
Ap
r-1
3
EU
R b
illio
n
Gross bad debts - total
Gross bad debts - productive sectors*
Provisions and direct writedownsSource: Bank of Italy. There is a statistical break in January 2011. 'Bad debts' in Italian are 'sofferenze'. * 'Productive sectors' includes non-financial corporations and producer households.

16 16
What policy mix, then?
1. Deploying growth- and equity-friendly
fiscal consolidation
2. Enacting structural measures addressing
competitiveness challenge
3. Restoring the supply of credit to the
economy
hand-in-hand to start a virtuous circle

17 17
Fiscal consolidation (1)
Little room for reducing the current level of
expenditure (and, consequently, of taxation)

18 18
Fiscal consolidation (2)
..but ample scope for improvement, by
• Reducing expenditure inefficiencies and prioritise
spending on growth levers
• Improving efficiency of tax system and reducing
distortions by shifting the tax burden away from labour
and capital and fighting tax evasion

19 19
Improving public expenditure quality Illustrative QPF indicators for sub-dimension QPF 3 (composition, efficiency and effectiveness of expenditure)
Composition Education Health R&D and
innovation Public
infrastructures Public order
Public administration
Country Average Rank Average Rank Average Rank Average Rank Average Rank Average Rank Average Rank BE -0.5 19 5.6 4 -1.8 13 1.6 9 0.4 8 -1.8 13 -3.4 12
BG -2.8 21 -8.3 23 -23.2 25 -13.5 27 -14.7 26 -22.2 27 -19.4 27
CZ 8.7 6 5.6 5 -5.9 19 -6.8 16 -5.4 16 -10.0 22 -14.5 23
DK 3.5 11 4.7 7 -4.8 17 1.9 8 5.2 3 4.4 6 13.1 1
DE -9.2 26 1.7 14 -0.3 9 6.3 2 5.0 4 6.3 3 0.5 7
EE 8.5 7 2.1 12 -15.4 22 -4.6 14 -3.7 14 -7.5 20 -2.9 10
IE 7.0 8 7.4 2 -0.3 10 2.6 7 -8.6 21 -4.5 17 -0.4 8
EL -13.6 27 -6.9 21 -1.1 12 -9.9 24 -7.2 19 -1.5 12 -10.9 18
ES 0.7 15 -12.6 25 2.1 3 -9.5 22 -3.3 13 -3.7 16 -5.4 13
FR 2.7 12 1.0 16 1.2 5 4.9 3 2.3 6 -0.6 11 -2.9 11
IT -1.7 20 -8.3 22 0.9 6 -7.2 18 -7.2 18 -8.5 21 -15.4 24 CY 1.3 13 3.6 10 -2.6 15 -11.8 26 -2.3 11 6.6 2 -6.9 15
LV 11.6 2 -1.2 19 -25.1 27 -9.1 19 -10.5 24 -2.1 14 -13.3 20
LT 10.1 3 1.8 13 -20.7 24 -3.7 13 -6.2 17 -11.7 23 -14.2 22
LU -3.0 22 -2.9 20 1.6 4 0.0 10 8.5 1 2.2 8 4.5 6
HU -0.2 17 0.4 17 -16.2 23 -7.0 17 -7.6 20 -3.1 15 -13.0 19
MT 0.2 16 -15.8 26 -5.0 18 -5.3 15 -10.3 22 9.3 1 -6.7 14
NL -4.0 24 4.5 8 -0.6 11 4.1 4 6.8 2 0.0 9 6.9 4
AT -3.7 23 6.6 3 0.3 8 3.4 5 3.6 5 6.2 4 5.1 5
PL 1.0 14 3.0 11 -12.2 20 -10.1 25 -13.9 25 -16.1 25 -17.4 25
PT 12.9 1 -18.4 27 2.2 2 -9.6 23 -3.0 12 -0.4 10 -8.1 17
RO 9.0 4 -9.4 24 -24.5 26 -9.3 20 -17.4 27 -16.9 26 -17.9 26
SI 8.9 5 3.7 9 -2.4 14 -3.6 12 -5.3 15 -4.8 18 -7.4 16
SK -6.5 25 1.5 15 -14.9 21 -9.4 21 -10.3 23 -12.3 24 -14.0 21
FI -0.5 18 12.6 1 0.7 7 9.3 1 -0.6 9 5.8 5 9.7 2
SE 4.1 10 5.1 6 3.2 1 2.9 6 1.2 7 2.4 7 7.1 3
UK 5.3 9 -0.2 18 -3.3 16 -0.7 11 -2.1 10 -5.8 19 -0.9 9
Average 1.8 -0.5 -6.2 -3.5 4.0 -3.3 -5.5
Std. Dev. 6.5 7.5 9.1 6.4 6.7 7.9 9.2

20 20
Improving the structure of taxation Overview table: Tax policy challenges in Member States
Contribution
of tax
increases to
consolidation
Need
and
room
for tax
shift
Labour tax
reforms for
specific
groups
Broadening tax bases Tax governance
challenges Special topics
Need to
review
tax
expend.
in PIT
Need to
review
tax
expend.
in CIT**
Debt bias
in
corporate
taxation
Increase
VAT
efficiency
Tax
compliance
Tax
admin.
Housing taxation
Recurrent
tax low
Debt
bias
Structural
shift
BE X X (X) X (X) X X X
DE (X) (X) (X) X
EE X X
EI p - X (X)
EL p - X X X X X X X X
ES X X X (X) X X X X
FR X X X X X (X) X
IT X X X X X X X CY p - (X) X
LU X X X X
MT X X X X X
NL (X) X X
AT (X) (X) X X
PT p - X X X (X) X X X X
SI X X X X
SK X (X) X X X
FI X
BG X X X
CZ X X (X) X X X X
DK X
LV X X X X
LT X (X) X X
HU (X) X (X) X X
PL (X) (X) X X
RO p X X X X X X
SE (X) (X) X
UK X X X
21 21
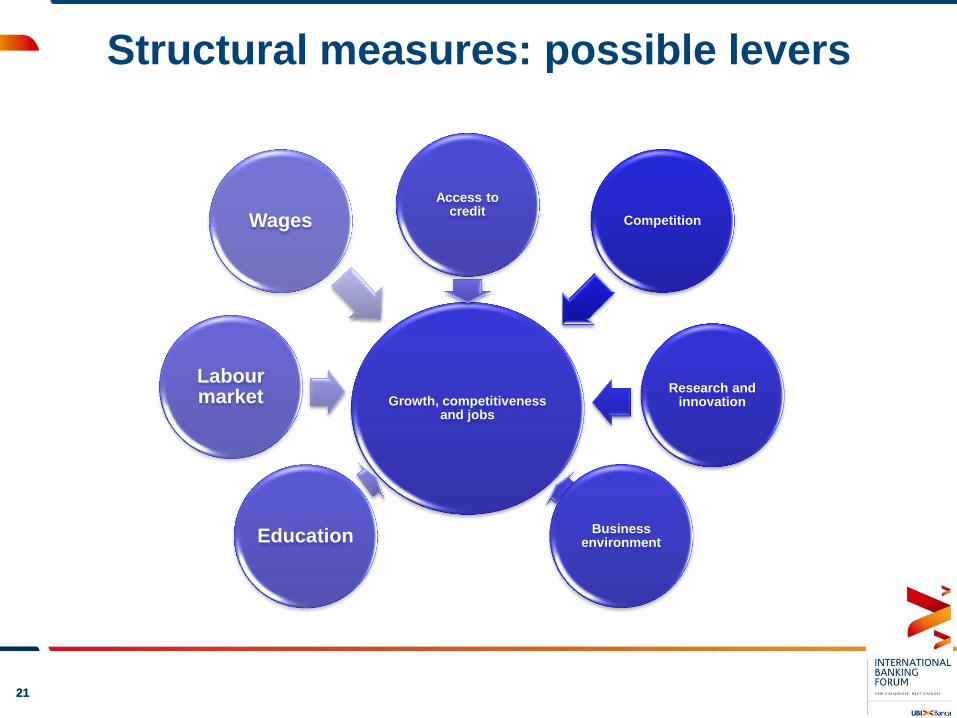
Structural measures: possible levers
Growth, competitiveness and jobs
Competition
Research and innovation
Business environment
Access to credit
Education
Labour market
Wages

22 22
Important steps already taken
• Reducing the deficit and moving towards fiscal
consolidation
• Shifting tax burden from labour and capital
onto property, consumption and environment
• Improving functioning of labour and product
markets
• Improving business environment
• Fostering human capital and favouring
research and innovation

23 23
Reform momentum to be maintained
• No backtracking on fiscal consolidation as
pre-condition for growth enhancing strategy
• Continue structural reforms to remove
bottlenecks to the adjustment of the economy
and boost long-term growth potential
(education, competition, business
environment, tax administration efficiency,
social protection)
• Tackle constrains to financing of
enterprises

24 24
The challenge of implementation
Need to adopt the required implementing legislation…
44%
16%
16%
24%
published/adopted
not adopted and no expiringdate
Not adopted, but defined bythe competent Ministry
not adopted/expired
…and follow up with concrete implementation measures

25 25
Country-specific recommendations:
Italy 2013 1. Pursue growth-friendly fiscal consolidation. Improve the efficiency and
quality of public expenditure.
2. Reinforce the administrative and business environment. Ensure timely
implementation of on-going reforms.
3. Promote banking sector corporate governance, asset-quality screening
and the resolution of non-performing loans on banks’ balance sheets.
Promote further the development of capital markets to diversify and enhance
firms' access to finance.
4. Ensure the effective implementation of the labour market and wage setting
reforms. Foster labour market participation and prevent early school leaving.
5. Shift the tax burden from labour and capital to consumption, property and
the environment in a budgetary neutral manner. Pursue the fight against tax
evasion.
6. Promote market opening in the services sector and foster market access
to local public services. Upgrade infrastructure capacity in network industries.