its and work zones · its and work zones tracy scriba ... (nchrp project in pa) automated...
TRANSCRIPT

ITS and Work Zones
Tracy ScribaFHWA Office of Operations
Work Zone Team
ARTBA Work Zone Conference November 2004

• What is Work Zone ITS?• Why Use It?• Examples of Applications• FHWA WZ ITS Activities
Presentation Outline

What is Work Zone ITS?
• Use of technology to support effective work zone management and operations
• Used both in and around work zones• Can have a safety or mobility main focus,
but often supports both• Portable and temporary in most cases

What is Work Zone ITS?
Includes some combination of:
• Input devices: Sensors, cameras• Output to: VMS, websites, highway
advisory radio, pagers, 511, a TMC• Via a local PC, a virtual TMC, or a TMC

What is Work Zone ITS?Users of information may include: • DOTs• Public and road users• Media outlets• Contractors• Trucking companies• Emergency services providers• Motorist assistance patrols• Third party traveler information
providers

Why Use Work Zone ITS?
• The effects of road work on road users and workers are increasing.
• We are seeing:– More congestion on our roads– More work zones– More lost lives– Growing exposure– Growing public frustration

Why Use Work Zone ITS?
Because it can help:
• Improve safety, mobility, traveler satisfaction, incident response, relationship with emergency responders
• Reduce congestion, crashes, secondary crashes, complaints from the public
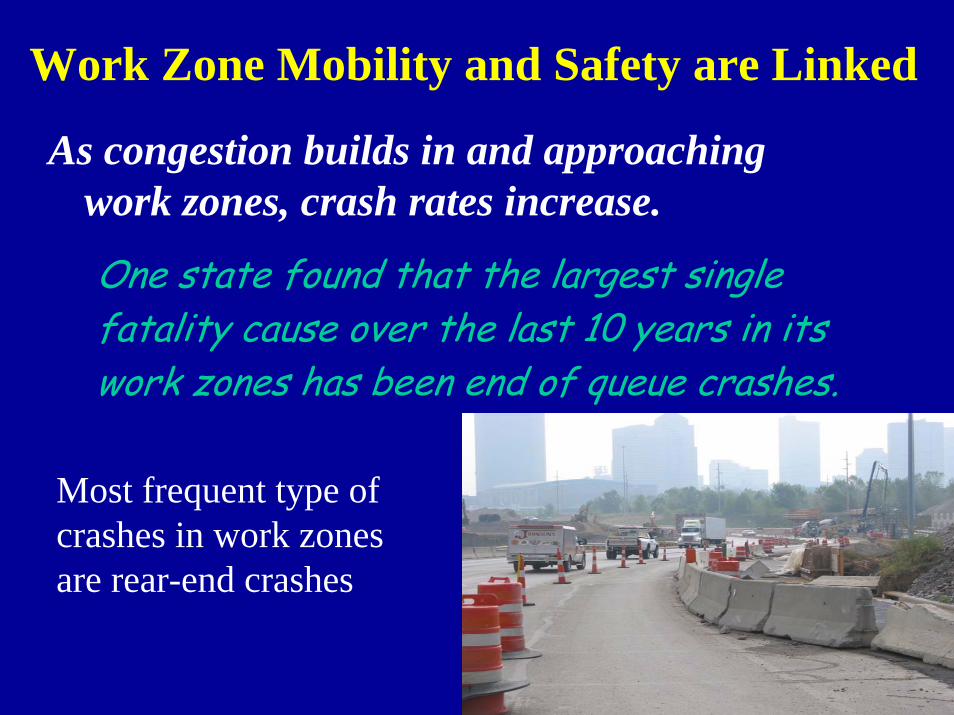
Work Zone Mobility and Safety are Linked
As congestion builds in and approaching work zones, crash rates increase.
One state found that the largest singlefatality cause over the last 10 years in itswork zones has been end of queue crashes.
Most frequent type of crashes in work zones are rear-end crashes

ITS Applications in Work Zones
• Traffic monitoring and management• Traveler information• Incident management• Tracking and evaluation of contract
incentive/disincentives• Worker safety/protection• Speed management and enforcement

Example ITS Work Zone Applications
• Traffic monitoring and management– Sensors, queue detectors, counters,
cameras and VMS– Dynamic “no passing zone” at
taper based on traffic conditions• Traveler information
– Alternate route information– Estimated delay (time, distance)– Notification of stopped/slowed
traffic

I-95 Outside of Fayetteville, NC
• Deployed May 2002• 6 sensors to monitor real-time traffic
conditions• Data used to calculate delay• Delay info automatically displayed on
CMSs and website (map, CMS messages)• 6 cameras to gather additional condition
info, verify system CMS messages

I-95 Outside of Fayetteville, NC• When delay > threshold, alternate route info
also given on CMS• Traffic signal added to alternate route to
handle increased flow during diversions• Results:
– Before: NB Queues of 3.5 to 4 mi and SB Queues of 2.5 to 3 mi during lane closures
– After: Queues 1 mi or less– ITS considered major contributing factor

Dynamic Lane MergeCreates a dynamic no-passing zone based on detected traffic volume and back-ups
• Sensors detect traffic conditions
• Next upstream sign activated when traffic threshold met
• “Do Not Pass When Flashing”
• Signs are regulatory and enforceable

Interstate North of Detroit, Michigan• Used to improve traffic flow, prevent dangerous
merging• System reduced travel time delays, number of
crashes, aggressive driving during AM and PM peak periods
• Study found the system effective for roads with moderate traffic volumes
$120,000 cost for system

Work Zone Incident Management
Albuquerque Big I – Cameras, some detectors– Temporary TMC co-located with police
substation – HELP trucks patrolling, wrecker on call
Used to:– Quickly detect incidents, call for
appropriate, efficient response– Guide drivers through work zone and
detours

16
ITS Control CenterITS Control Center
Smart Work StationsSmart Work Stations
H.E.L.P. PatrolsH.E.L.P. Patrols
Coordination with Emergency ServicesCoordination with Emergency Services
Big “I” Construction Intelligent Transportation
System
Big “I” Construction Intelligent Transportation
System

Benefits of Using ITS at the Big I• Mobility
– Incident clear time reduced from 45 minutes in past to 25 minutes in work zone
• Safety– Less incidents than expected (7% increase during WZ)
• Cost savings– Help ensure response is commensurate with incident to
save costs and avoid clogging roadway– Automation
• Improved relations with incident response community
• Better public relations/better informed public

Tracking and Evaluation of Contract Incentive/Disincentives
Arizona SR 68 travel time system
Rural corridor: Major route for commuting casino workers, recreational users, trucks

Arizona State Route 68
Why use ITS?• Lengthy delays during past projects
significantly impacted the public• No viable alternate routes, so ADOT
focused on reducing travel time in WZ• To assess contractor compliance with travel
time incentive/disincentive

Arizona State Route 68• Avg travel time before WZ = 17 minutes• Contractor required to keep average travel
time to < 27 minutes– Otherwise $400k incentive pool reduced
• License plate reader system used to measure travel times

Arizona State Route 68 - Results
• Greater contractor participation in and commitment to keeping traffic moving – Limited number of flagging stations– Scheduled work to reduce impacts to travelers
• Incentive pool only charged about $15,000– System helped keep traffic moving– Contractor received most of the possible $400k
incentive
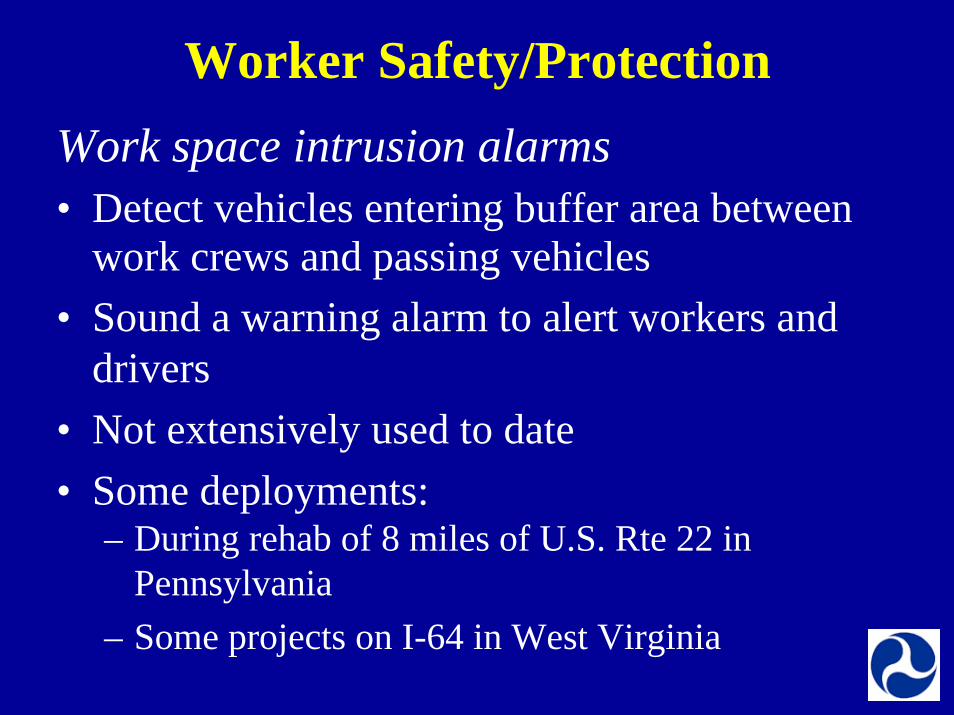
Worker Safety/ProtectionWork space intrusion alarms• Detect vehicles entering buffer area between
work crews and passing vehicles• Sound a warning alarm to alert workers and
drivers• Not extensively used to date• Some deployments:
– During rehab of 8 miles of U.S. Rte 22 in Pennsylvania
– Some projects on I-64 in West Virginia

Example of One Type of Intrusion Alarm
Transmitter Receiver

Intrusion Alarm Layout
OPEN LANE RECEIVER & ALARM
TRANSMITTER
WORK CREW
Sensors need to be carefully aligned
For More Information:http://www.ops.fhwa.dot.gov/wz/workshops/author-index.htm

Example of Another Type of Intrusion Alarm
Activates and sounds alarm:
• Upon direct vehicle impact. (shock)
• When tilted 90 degrees from vertical. (tilt)
Can be used on cones, drums, barricades…

Speed Management and Enforcement• Variable speed limits• Automated enforcement
Technology-assisted speed enforcement with VSL (NCHRP project in PA)

Automated Enforcement• Help address limited space in WZs• Move enforcement activity outside the WZ• May require changes to law• Need to overcome public/political opposition

Variable Speed Limits in Work Zones
• Enables an agency to automatically adjust speed limit based on changing conditions– Whether workers are present– As traffic flow changes– Weather (fog, rain, ice)
• May result in– More credibility of speed limits– Increased compliance– Improved safety– Improved traffic flow
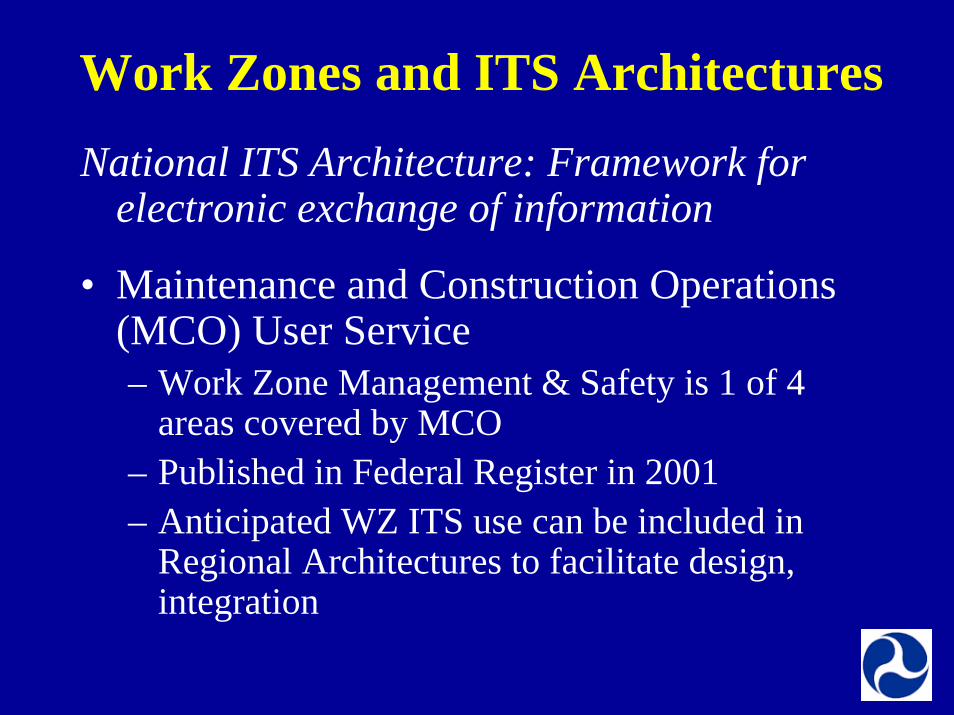
Work Zones and ITS ArchitecturesNational ITS Architecture: Framework for
electronic exchange of information
• Maintenance and Construction Operations (MCO) User Service– Work Zone Management & Safety is 1 of 4
areas covered by MCO– Published in Federal Register in 2001– Anticipated WZ ITS use can be included in
Regional Architectures to facilitate design, integration

Work Zones and Regional ITS Architectures
Considerations for including WZ ITS:
• Length of deployment: How temporary is it?• Connectivity: Will the WZ ITS tie into something
or be standalone?– TMC– Existing Website– 511 Traveler Info– 911 Call Center– Transit Center

FHWA ITS in WZ Activities
• Cross-Cutting Study• Case Studies• Implementation Guide• VSL Field Operational Test• Assessment of Effectiveness• Evaluation Criteria• Training Needs

WZ ITS Cross-Cutting Study• 4 sites
– Albuquerque, NM Big I (I-40 & I-25)– Lansing, MI I-496– Springfield, IL I-55– West Memphis, AR I-40 near I-55
• Additional research/information gathering on other applications
• Brochure and Report developed
FHWA-OP-01-043 and FHWA-OP-02-025

Challenges/Lessons Learned
• Communications must be reliable• Allow start-up time• Need to develop public awareness• Information must be accurate (public credibility)• Involve partners early• Carefully gauge amount of information delivered• Portability can be key• Systems must be maintained• Lack of data analysis done to quantify benefits

Benefits
• Improved mobility and traffic management• More informed public• Quicker incident response• Greater safety of workers and travelers• Better PR and relationships with other
stakeholders• Enhanced speed management• Potential for cost savings• Better understanding of traffic conditions

WZ ITS Case Studies• Highlight 4 successful applications
– Incident Mgmt System, Albuquerque– Traffic Mgmt & Traveler Info System, Springfield, IL– Contract Incentive Monitoring, Arizona– Dynamic Lane Merge, Detroit
• Provide more detailed information • 4 individual reports, about 15 pages each• 1 available now, others later in Nov 2004
FHWA-OP-04-072

Implementation Guide
• Provide guidance for implementing ITS in work zones
• Share knowledge and lessons learned from those experienced with ITS in work zones
• Available in early 2005

Implementation Guide
System Concept Deployment
Planning and System Development
Procurement
Operations, Maintenance, and Sustainability
System Evaluation

VSL Field Operational Test
• State self-evaluations, independent national evaluation
• Evaluate effectiveness and benefits• Locations
– Michigan– Maryland – Possibly a 3rd site

VSL Field Operational Test - Michigan

Assessment of Effectiveness
• Gather quantifiable results on effectiveness of ITS in work zones
• Look at mobility (delay, queue length) and safety measures, delivery of traveler info
• 6 sites where ITS is deployed in a work zone– NC site (I-40 in Winston-Salem)– AR site (I-30 between Benton and Little Rock)– MI site (US 131 in Kalamazoo)– Selection of other sites in process

For further Information/Resources:www.fhwa.dot.gov/workzonesTracy Scriba, FHWA, 202-366-0855
Goal of FHWA Work Zone ProgramReduce congestion and crashes due to
work zones

Additional Background Information

What We’ve LearnedSnapshot of work zone activity(State DOT web sites)
Attribute Winter Summer
Paving Work 13% 26%
Lane Closures 9 hours 11.8 hours
Impact on NHS 6.9% 20.9%
# of Work Zones 3,312 6,472
Lost Capacity(freeway lane miles)
3,357 6,157

More Congestion on our Roads
100110120130140150160170180
1980
1982
1984
1986
1988
1990
1992
1994
1996
1998
Inde
x 19
80 =
100
VMT (millions) Lane Mile Index
1980-1998Vehicle Travel up 72%, Road Miles up 1%
• We’re traveling more miles without increasing highway capacity significantly.
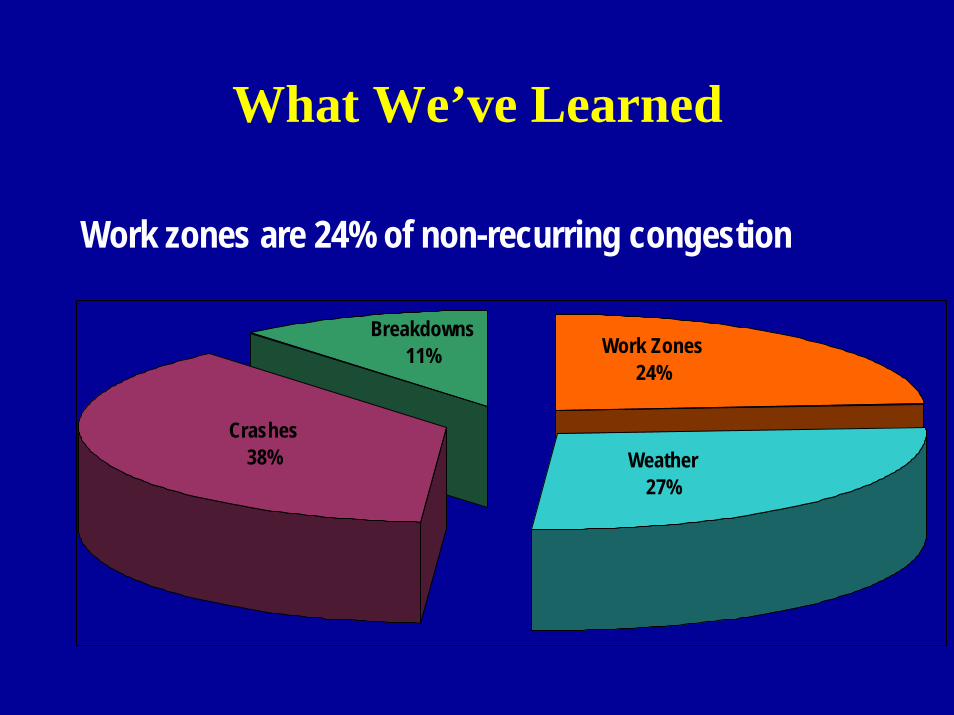
What We’ve Learned
Work zones are 24% of non-recurring congestion
Crashes38%
Breakdowns11%
Weather27%
Work Zones24%

Work Zone Fatalities Have Increased
• Average more than 800 fatalities per year, with a high of 1,079 in 2001.
• In 1999, approximately 39,000 people were injured in work zones crashes.
• 120 to 130 workers die per year in road construction activities.
0200400600800
10001200
1994 1995 1996 1997 1998 1999 2000 2001
Year
Wor
k Zo
ne
Fata
litie
s
00000
10000
20000
30000
40000
50000
Wor
k Zo
ne
Inju
ries
Fatalities Injuries

Growing Exposure• Growing portion of roadwork is done under
traffic– Share of highway capital outlay spent on system
preservation rose from 47.6% in 1997 to 52% in 2000• Working under traffic means more exposure of
workers and road users

Increased Public Concern Second Lowest Level of Satisfaction
58%
53%
47%
48%
55%
58%
60%
59%
47%
59%
65%
74%
77%
77%
79%
Traffic Flow
Work Zones
Pavement Conditions
MaintenanceResponse Time
Safety
Travel Amenities
Bridge Conditions
Visual Appeal
1995 2000
Data not collected in 1995Data not collected in 1995Perc
enta
ge o
f Res
pons
es
“Sat
isfie
d” a
nd “
Very
Sat
isfie
d”
Source: Source: Moving Ahead:Moving Ahead: The American Public Speaks on Roadways and Transportation in CoThe American Public Speaks on Roadways and Transportation in Communitiesmmunities(which can be found on the FHWA web page at http://www.fhwa.dot.(which can be found on the FHWA web page at http://www.fhwa.dot.gov/reports/movingahead.htm)gov/reports/movingahead.htm)

What We’ve LearnedAttributes Reported on the Web
(Sample of 20 State DOT websites - Summer 2001)
Purpose 77%Project start/end dates 71%Length (miles) 18%Lane closures or work activity by time of day
22%
Expected Delay 26% say whether or not to expect any delay 7% gave quantitative estimate