itu-t rec. p.57 (06/2021) artificial ears
TRANSCRIPT

I n t e r n a t i o n a l T e l e c o m m u n i c a t i o n U n i o n
ITU-T P.57 TELECOMMUNICATION STANDARDIZATION SECTOR OF ITU
(06/2021)
SERIES P: TELEPHONE TRANSMISSION QUALITY, TELEPHONE INSTALLATIONS, LOCAL LINE NETWORKS
Objective measuring apparatus
Artificial ears
Recommendation ITU-T P.57

ITU-T P-SERIES RECOMMENDATIONS
TELEPHONE TRANSMISSION QUALITY, TELEPHONE INSTALLATIONS, LOCAL LINE NETWORKS
Vocabulary and effects of transmission parameters on customer opinion of transmission quality P.10–P.19
Voice terminal characteristics P.30–P.39
Reference systems P.40–P.49
Objective measuring apparatus P.50–P.59
Objective electro-acoustical measurements P.60–P.69
Measurements related to speech loudness P.70–P.79
Methods for objective and subjective assessment of speech quality P.80–P.89
Voice terminal characteristics P.300–P.399
Objective measuring apparatus P.500–P.599
Measurements related to speech loudness P.700–P.709
Methods for objective and subjective assessment of speech and video quality P.800–P.899
Audiovisual quality in multimedia services P.900–P.999
Transmission performance and QoS aspects of IP end-points P.1000–P.1099
Communications involving vehicles P.1100–P.1199
Models and tools for quality assessment of streamed media P.1200–P.1299
Telemeeting assessment P.1300–P.1399
Statistical analysis, evaluation and reporting guidelines of quality measurements P.1400–P.1499
Methods for objective and subjective assessment of quality of services other than speech and video
P.1500–P.1599
For further details, please refer to the list of ITU-T Recommendations.

Rec. ITU-T P.57 (06/2021) i
Recommendation ITU-T P.57
Artificial ears
Summary
Recommendation ITU-T P.57 specifies the electro-acoustical characteristics of artificial ears to be
used for telephonometric measurements. Four devices are specified: a telephone band type for
measurements on traditional telephone sets, an insert earphone type, a type faithfully reproducing the
characteristics of the human ear and a type faithfully reproducing the characteristics of the human ear
including an average adult human ear canal.
History
Edition Recommendation Approval Study Group Unique ID*
1.0 ITU-T P.57 1993-03-12 XII 11.1002/1000/1747
2.0 ITU-T P.57 1996-08-30 12 11.1002/1000/3636
3.0 ITU-T P.57 2002-07-14 12 11.1002/1000/6082
3.1 ITU-T P.57 (2002) Cor. 1 2005-01-27 12 11.1002/1000/7827
4.0 ITU-T P.57 2005-11-29 12 11.1002/1000/8676
5.0 ITU-T P.57 2009-04-29 12 11.1002/1000/9732
6.0 ITU-T P.57 2011-12-14 12 11.1002/1000/11457
7.0 ITU-T P.57 2021-02-13 12 11.1002/1000/14599
8.0 ITU-T P.57 2021-06-13 12 11.1002/1000/14662
Keywords
Quality of service measurement, speech quality.
____________________
* To access the Recommendation, type the URL http://handle.itu.int/ in the address field of your web
browser, followed by the Recommendation's unique ID. For example, http://handle.itu.int/11.1002/1000/11
830-en.

ii Rec. ITU-T P.57 (06/2021)
FOREWORD
The International Telecommunication Union (ITU) is the United Nations specialized agency in the field of
telecommunications, information and communication technologies (ICTs). The ITU Telecommunication
Standardization Sector (ITU-T) is a permanent organ of ITU. ITU-T is responsible for studying technical,
operating and tariff questions and issuing Recommendations on them with a view to standardizing
telecommunications on a worldwide basis.
The World Telecommunication Standardization Assembly (WTSA), which meets every four years, establishes
the topics for study by the ITU-T study groups which, in turn, produce Recommendations on these topics.
The approval of ITU-T Recommendations is covered by the procedure laid down in WTSA Resolution 1.
In some areas of information technology which fall within ITU-T's purview, the necessary standards are
prepared on a collaborative basis with ISO and IEC.
NOTE
In this Recommendation, the expression "Administration" is used for conciseness to indicate both a
telecommunication administration and a recognized operating agency.
Compliance with this Recommendation is voluntary. However, the Recommendation may contain certain
mandatory provisions (to ensure, e.g., interoperability or applicability) and compliance with the
Recommendation is achieved when all of these mandatory provisions are met. The words "shall" or some other
obligatory language such as "must" and the negative equivalents are used to express requirements. The use of
such words does not suggest that compliance with the Recommendation is required of any party.
INTELLECTUAL PROPERTY RIGHTS
ITU draws attention to the possibility that the practice or implementation of this Recommendation may involve
the use of a claimed Intellectual Property Right. ITU takes no position concerning the evidence, validity or
applicability of claimed Intellectual Property Rights, whether asserted by ITU members or others outside of
the Recommendation development process.
As of the date of approval of this Recommendation, ITU had received notice of intellectual property, protected
by patents/software copyrights, which may be required to implement this Recommendation. However,
implementers are cautioned that this may not represent the latest information and are therefore strongly urged
to consult the appropriate ITU-T databases available via the ITU-T website at http://www.itu.int/ITU-T/ipr/.
© ITU 2021
All rights reserved. No part of this publication may be reproduced, by any means whatsoever, without the prior
written permission of ITU.

Rec. ITU-T P.57 (06/2021) iii
Table of Contents
Page
1 Scope and object ........................................................................................................... 1
1.1 Scope .............................................................................................................. 1
1.2 Object ............................................................................................................. 1
2 References..................................................................................................................... 1
3 Definitions .................................................................................................................... 2
3.1 Terms defined elsewhere ................................................................................ 2
3.2 Terms defined in this Recommendation ......................................................... 2
4 Abbreviations and acronyms ........................................................................................ 4
5 Conventions .................................................................................................................. 5
6 Artificial ear types ........................................................................................................ 5
6.1 Type 1 artificial ear ........................................................................................ 5
6.2 Type 2 artificial ear ........................................................................................ 6
6.3 Type 3 artificial ear ........................................................................................ 8
6.4 Type 4 artificial ear ........................................................................................ 19
6.5 Calibration of the artificial ears type 1 and type 3.2 ...................................... 43
6.6 Performance verification of the artificial ears types 2, 3.1, 3.3 and 3.4 ......... 46
6.7 Atmospheric reference conditions .................................................................. 46
6.8 General requirements ...................................................................................... 46
6.9 Ear-drum reference point to ear reference point correction ........................... 46
7 Idle noise floor .............................................................................................................. 46
Annex A – A practical procedure for determination of the acoustic input impedance of
artificial ears ................................................................................................................. 48
A.1 Introduction .................................................................................................... 48
A.2 Calibration of the impedance probe ............................................................... 49
A.3 Artificial ear calibration ................................................................................. 50
Annex B – Cross sectional areas of type 4.3 artificial ear ....................................................... 51
B.1 Cross sections of the concha bottom .............................................................. 51
B.2 Cross sectional areas of the ear canal and concha bottom .............................. 52
B.3 Cross sectional areas of the pinna simulator .................................................. 58
Annex C – Cross sectional areas of Type 4.4 artificial ear ...................................................... 83
C.1 Cross sections of the concha bottom .............................................................. 83
C.2 Cross sectional areas of the ear canal and concha bottom .............................. 83
C.3 Cross sectional areas of the pinna simulator .................................................. 87
Appendix I – Comparative acoustical input impedance measurements on the artificial ears
Types 3.3 and 3.4 and on human ears ........................................................................... 88
I.1 Introduction ................................................................................................... 88
I.2 Data overview ................................................................................................ 88
I.3 Artificial ear measurements ............................................................................ 89

iv Rec. ITU-T P.57 (06/2021)
Page
I.4 Human ear measurements .............................................................................. 90
I.5 Comparison between human and artificial ear measurements ....................... 98
Appendix II – Illustration of the mobile phone-shaped impedance probe used in
Appendix I .................................................................................................................... 106
Bibliography............................................................................................................................. 108

Rec. ITU-T P.57 (06/2021) 1
Recommendation ITU-T P.57
Artificial ears
1 Scope and object
1.1 Scope
This Recommendation specifies the artificial ears for telephonometric use. Four types are
recommended, covering the different transducers, types, sizes and technologies.
The methods of use of the artificial ears are outside the scope of this Recommendation; however,
some general rules are provided about the application force and the positioning of transducers.
1.2 Object
Four types of artificial ears are defined:
1) a telephone-band type for measurements on traditional telephone sets;
2) a type for measuring insert earphones;
3) a type which faithfully reproduces the acoustic characteristics of the median human ear;
4) a type which faithfully reproduces the acoustic characteristics of median human ear,
including an anatomically shaped ear canal.
2 References
The following ITU-T Recommendations and other references contain provisions which, through
reference in this text, constitute provisions of this Recommendation. At the time of publication, the
editions indicated were valid. All Recommendations and other references are subject to revision;
users of this Recommendation are therefore encouraged to investigate the possibility of applying the
most recent edition of the Recommendations and other references listed below. A list of the currently
valid ITU-T Recommendations is regularly published. The reference to a document within this
Recommendation does not give it, as a stand-alone document, the status of a Recommendation.
[ITU-T P.64] Recommendation ITU-T P.64 (2019), Determination of sensitivity/frequency
characteristics of local telephone systems.
[ITU-T P.79] Recommendation ITU-T P.79 (2007), Calculation of loudness ratings for
telephone sets.
[ITU-T P.380] Recommendation ITU-T P.380 (2003), Electro-acoustic measurements on
headsets.
[IEC 60318-1] IEC 60318-1:2009, Electroacoustics – Simulators of human head and ear –
Part 1: Ear simulator for the measurement of supra-aural and circumaural
earphones. <http://webstore.iec.ch/webstore/webstore.nsf/ArtNum_PK/43309?OpenDocument>
[IEC 60318-4] IEC 60318-4:2010, Electroacoustics – Simulators of human head and ear –
Part 4: Occluded-ear simulator for the measurement of earphones coupled to
the ear by means of ear inserts. <http://webstore.iec.ch/webstore/webstore.nsf/ArtNum_PK/43703?OpenDocument>
[b-IEC 61260-1] IEC 61260-1:2014, Electroacoustics – Octave-band and fractional-octave-
band filters – Part 1: Specifications. <https://webstore.iec.ch/publication/5063>

2 Rec. ITU-T P.57 (06/2021)
[ISO 389-7] ISO 389-7:2019, Acoustics – Reference zero for the calibration of audiometric
equipment – Part 7: Reference threshold of hearing under free-field and
diffuse-field listening conditions.
3 Definitions
3.1 Terms defined elsewhere
None.
3.2 Terms defined in this Recommendation
This Recommendation defines the following terms:
3.2.1 acoustically closed earphones (nominally sealed): Earphones which are intended to prevent
any acoustic coupling between the external environment and the ear canal.
3.2.2 acoustically open earphones (nominally unsealed): Earphones which intentionally provide
an acoustic path between the external environment and the ear canal.
3.2.3 artificial ear: A device for the calibration of earphones incorporating an acoustic coupler
and a calibration microphone for the measurement of sound pressure, and having an overall acoustic
impedance similar to that of the average human ear over a given frequency band.
3.2.4 circum-aural earphones: Earphones which enclose the pinna and seat on the surrounding
surface of the head. Contact to the head is normally maintained by compliant cushions. Circum-aural
earphones may touch but not significantly compress the pinna (see Figure 1).
P.57(09)_F01
Caudal
Back
Front
Rostral
Right earhorizontalsection
a) Circum-aural (open) b) Circum-aural (closed)
Figure 1 – Circum-aural earphones
3.2.5 ear canal entrance point (EEP): A point located at the centre of the ear canal opening.
3.2.6 ear canal extension: Cylindrical cavity extending the simulation of the ear canal provided
by the occluded-ear simulator out of the concha cavity.
3.2.7 ear reference point (ERP): A virtual point for geometric reference located at the entrance
to the listener's ear, traditionally used for calculating telephonometric loudness ratings.
3.2.8 ear simulator: Device for measuring the output sound pressure of an earphone under
well-defined loading conditions in a specified frequency range. It consists essentially of a principal
cavity, acoustic load networks and a calibrated microphone. The location of the microphone is chosen
so that the sound pressure at the microphone corresponds approximately to the sound pressure
existing at the human ear-drum.
3.2.9 ear-drum reference point (DRP): A point located at the end of the ear canal, corresponding
to the ear-drum position.

Rec. ITU-T P.57 (06/2021) 3
3.2.10 insert earphones: Earphones which are intended to partially or completely enter the ear canal
(see Figure 2).
Figure 2 – Insert earphones
3.2.11 intra-concha earphones: Earphones which are intended to rest within the concha cavity of
the ear. They have an external diameter (or maximum dimension) of less than 25 mm but are not
made to enter the ear canal (see Figure 3).
Figure 3 – Intra-concha earphones
3.2.12 occluded-ear simulator: Ear simulator which simulates the inner part of the ear canal, from
the tip of an ear insert to the ear-drum.
3.2.13 pinna simulator: A device which has the approximate shape of dimensions of a median adult
human pinna.
3.2.14 supra-aural earphones: Earphones which rest upon the pinna and have an external diameter
(or maximum dimension) of at least 45 mm (see Figure 4).

4 Rec. ITU-T P.57 (06/2021)
Figure 4 – Supra-aural earphones
3.2.15 supra-concha earphones: Earphones which are intended to rest upon the ridges of the
concha cavity and have an external diameter (or maximum dimension) greater than 25 mm and less
than 45 mm (see Figure 5).
Figure 5 – Supra-concha (open) earphones
3.2.16 effective volume: equivalent volume of air of the acoustic compliance of the ear simulator
formed by the cavity (terminated by the reference plane) and the microphone at a frequency of
500 Hz.
4 Abbreviations and acronyms
This Recommendation uses the following abbreviations and acronyms:
ANOVA Analysis Of Variance
CAD Computer Aided Design
CL Centre of Lips
DRP ear-Drum Reference Point
EEP Ear canal Entrance Point
ERP Ear Reference Point
HATS Head And Torso Simulator
LRGP Loudness Rating Guard-ring Position

Rec. ITU-T P.57 (06/2021) 5
5 Conventions
None.
6 Artificial ear types
The fundamental purpose of an artificial ear is to test a receiver under conditions that most closely
approximate actual use by real persons. The recommendations that follow are based upon the manner
in which the receivers are intended to be used. Modifications to an artificial ear or test procedure shall
not be made. To avoid alteration of the specified concha volume and/or leak, flexible sealing material,
such as putty, shall not be used.
Of the artificial ears defined below, those with a flexible pinna are intended to most closely resemble
the manner in which the receivers are intended to be used.
In the narrow-band (100 Hz to 4 kHz), the type 3.3 artificial ear resembles the human ear most closely
and is the preferred choice, irrespective of the device to be tested.
Use of artificial ears type 1 and 3.2 is limited to their scope of usability, described below.
Comparative acoustic impedance measurements of the artificial ear types and human ears were
conducted on a large scale and are shown in Appendix I.
For super-wideband and full-band applications, the type 4.3 artificial ear resembles the human ear
most closely and is the preferred choice, irrespective of the device to be tested. As an alternative, the
type 4.4 artificial ear can be used for most telecommunication applications as well.
6.1 Type 1 artificial ear
The type 1 artificial ear is specified in [IEC 60318-1].
It is recommended that the type 1 artificial ear should only be used as a legacy ear simulator for
measurements on large, supra-aural or supra-concha, hard-cap, conically symmetrical receivers,
which naturally seal to the simulator rim, intended for narrow-band telephony applications
(100 Hz to 4 kHz). The type 1 artificial ear should not be used for receivers that do not meet these
specifications.
The acoustic input impedance and the frequency sensitivity response of the type 1 artificial ear are
determined with reference to the ERP as specified in clause 6.4. The nominal modulus of the
impedance curve and the corresponding tolerance limits are given in Table 1.
Table 1 – Acoustical impedance for type 1 artificial ear (IEC 60318)
Frequency
(Hz)
Acoustical imp.
(dB re 1 Pa s/m3)
Tolerance
( dB)
Frequency
(Hz)
Acoustical imp.
(dB re 1 Pa s/m3)
Tolerance
( dB)
100 145.6 1 950 134.5 1
106 145.3 1 1000 134.0 1
112 145.0 1 1060 133.4 1
118 144.6 1 1120 132.8 1
125 144.3 1 1180 132.2 1
132 144.0 1 1250 131.7 1
140 143.7 1 1320 131.1 1
150 143.4 1 1400 130.6 1
160 143.2 1 1500 130.1 1
170 143.0 1 1600 129.6 1

6 Rec. ITU-T P.57 (06/2021)
Table 1 – Acoustical impedance for type 1 artificial ear (IEC 60318)
Frequency
(Hz)
Acoustical imp.
(dB re 1 Pa s/m3)
Tolerance
( dB)
Frequency
(Hz)
Acoustical imp.
(dB re 1 Pa s/m3)
Tolerance
( dB)
180 143.0 1 1700 129.4 1
190 142.9 1 1800 129.2 1
200 142.8 1 1900 129.2 1
212 142.9 1 2000 129.3 1
224 142.9 1 2120 129.5 1
236 143.1 1 2240 129.7 1
250 143.2 1 2360 129.8 1
265 143.4 1 2500 129.8 1
280 143.5 1 2650 129.6 1
300 143.7 1 2800 129.2 1
315 143.6 1 3000 128.6 1
335 143.7 1 3150 127.9 1
355 143.6 1 3350 127.0 1
375 143.3 1 3550 125.9 1
400 143.0 1 3750 124.8 1
425 142.7 1 4000 123.2 1
450 142.2 1 4250 121.5 1
475 141.7 1 4500 119.5 1
500 141.3 1 4750 117.1 1
530 140.7 1 5000 114.2 1
560 140.1 1 5300 109.6 1
600 139.4 1 5600 104.7 1
630 138.9 1 6000 109.6 1
670 138.3 1 6300 113.6 1
710 137.6 1 6700 117.0 1
750 137.1 1 7100 119.5 1
800 136.4 1 7500 121.3 1
850 135.7 1 8000 123.2 1
900 135.1 1
NOTE 1 – The type 1 artificial ear is not suitable for measuring low acoustic-impedance earphones.
NOTE 2 – The type 1 artificial ear is defined for simulating the acoustic load of the human ear under no leakage
conditions. For receive loudness rating calculations according to [ITU-T P.79], it is recommended that
measured data be corrected using the real ear loss correction LE provided in Table 2 of [ITU-T P.79].
NOTE 3 – It is recommended to use an application force between 5 N and 10 N for placing ear-caps against
type 1 artificial ears. The force applied in measurements shall always be reported.
6.2 Type 2 artificial ear
The type 2 artificial ear is specified in [IEC 60318-4].

Rec. ITU-T P.57 (06/2021) 7
It is recommended that the type 2 artificial ear should be used for measurements on insert earphones,
both sealed and unsealed.
The sound pressure measured by the type 2 artificial ear is referred to the ear-drum reference point
(DRP). The correction function given in Tables 2-a (1/3 octave band measurements) and 2-b
(1/12 octave band and sine measurements) shall be used for converting data to the ear reference point
(ERP) when it is required to calculate loudness ratings or check results against specifications based
on measurements referring to the ERP.
NOTE – For receive loudness rating calculations according to [ITU-T P.79], the real ear loss correction LE
should be as specified in [ITU-T P.380].
Table 2-a – SDE – Third octave measurements
Frequency
(Hz)
SDE
(dB)
Frequency
(Hz)
SDE
(dB)
100 0.0 1000 –1.7
125 0.0 1250 –2.6
160 0.0 1600 –4.2
200 0.0 2000 –6.5
250 –0.3 2500 –9.4
315 –0.2 3150 –10.3
400 –0.5 4000 –6.6
500 –0.6 5000 –3.2
630 –0.7 6300 –3.3
800 –1.1 8000 –16.0
(10 000) (–14.4)
SDE: The transfer function DRP to ERP
SDE: 20 log10 (PE/PD)
where:
PE: Sound pressure at the ERP
PD: Sound pressure at the DRP
NOTE – The values in this table apply to 1/3 octave band measurements only.
Table 2-b – SDE – Twelfth octave measurements
Frequency
(Hz)
SDE
(dB)
Frequency
(Hz)
SDE
(dB)
Frequency
(Hz)
SDE
(dB)
Frequency
(Hz)
SDE
(dB)
92 0.1 290 –0.3 917 –1.3 2901 –11.0
97 0.0 307 –0.2 972 –1.4 3073 –10.5
103 0.0 325 –0.2 1029 –1.8 3255 –10.2
109 0.0 345 –0.2 1090 –2.0 3447 –9.1
115 0.0 365 –0.4 1155 –2.3 3652 –8.0
122 0.0 387 –0.5 1223 –2.4 3868 –6.9
130 0.0 410 –0.4 1296 –2.6 4097 –5.8
137 0.0 434 –0.6 1372 –3.1 4340 –5.0

8 Rec. ITU-T P.57 (06/2021)
Table 2-b – SDE – Twelfth octave measurements
Frequency
(Hz)
SDE
(dB)
Frequency
(Hz)
SDE
(dB)
Frequency
(Hz)
SDE
(dB)
Frequency
(Hz)
SDE
(dB)
145 0.0 460 –0.3 1454 –3.3 4597 –4.2
154 0.0 487 –0.7 1540 –3.9 4870 –3.3
163 0.0 516 –0.6 1631 –4.4 5158 –2.7
173 –0.1 546 –0.6 1728 –4.8 5464 –2.4
183 –0.1 579 –0.6 1830 –5.3 5788 –2.4
193 0.0 613 –0.6 1939 –6.0 6131 –2.5
205 0.1 649 –0.8 2053 –6.9 6494 –3.3
218 0.0 688 –0.8 2175 –7.5 6879 –4.5
230 –0.1 729 –1.0 2304 –8.1 7286 –5.9
244 –0.2 772 –1.1 2441 –9.1 7718 –9.0
259 –0.3 818 –1.1 2585 –9.5 8175 –14.2
274 –0.3 866 –1.2 2738 –10.4 8659 –20.7
NOTE – The frequencies listed are the 1/12 octave centre frequencies specified in [IEC 61260-1]. The values
apply to 1/12 octave band measurements as well as sine-based measurements. SDE may be determined for
immediate frequencies by interpolation on a (log f) versus (lin dB) basis.
6.3 Type 3 artificial ear
The type 3 artificial ear consists of the IEC 60318-4 occluded-ear simulator, to which is added an ear
canal extension terminated with a pinna simulation device. Three pinna simulators are recommended,
providing the suitable coupling arrangements for measuring different transducer types. The type 3
artificial ear configurations are classified as follows:
Type 3.1 Concha bottom simulator.
Type 3.2 Simplified pinna simulator.
Type 3.3 Pinna simulator (anatomically shaped).
Type 3.4 Pinna simulator (simplified).
NOTE – Acoustically, open earphones equipped with soft cushions should be positioned against the type 3
artificial ear with the same force as applied in normal use. The force applied in measurements shall always be
reported.
6.3.1 Type 3.1 – Concha bottom simulator
The concha bottom simulation is realized in the type 3.1 artificial ear by a flat plate termination of
the 10.0 mm ear canal extension.
It is recommended that the type 3.1 artificial ear should be used for measurements on intra-concha
earphones, designed for sitting on the bottom of the concha cavity.
The sound pressure measured by the type 3.1 artificial ear is referred to the ear-drum reference point
(DRP). The correction function given in Tables 2-a (1/3 octave band measurements) and 2-b
(1/12 octave band and sine measurements) shall be used for converting data to the ear reference point
(ERP) when it is required to calculate loudness ratings or check results against specifications based
on measurements referred to the ERP.
NOTE – For receive loudness rating calculations according to [ITU-T P.79], the real ear loss correction LE
should be set to zero.

Rec. ITU-T P.57 (06/2021) 9
6.3.2 Type 3.2 – Simplified pinna simulator
The pinna simulation is realized in the type 3.2 artificial ear by a cavity terminating the 10.0 mm ear
canal extension. A well-defined leak from the cavity to the exterior simulates the average human ear
loss for telephone handsets which are held either firmly (low leak version) or loosely (high leak
version) against the human ear. The construction of the leak may differ depending on the specific
application of the type 3.2 artificial ear (see Figure 6 and Tables 3-a and 3-b).
P.57(09)_F06
General dimensions
as for high level version
EEP EEP
5°
42°
ERP
High leak version
All dimensions in mm
Figure 6 – Example of high leak and low leak simplified pinna simulators
for use in an LRGP test head
Table 3-a – Leakage simulation, realized using a slit (type 3.2 artificial ear)
Leakage
grade Use
Slit depth
(mm)
Slit height
(mm)
Opening angle
(degrees)
Low LRGP/HATS 2.8 0.2 0.26 0.01 84 1
High HATS 1.9 0.2 0.50 + 0.01 – 0.03 240 1

10 Rec. ITU-T P.57 (06/2021)
Table 3-b – Leakage simulation, realized using cylindrical holes
(type 3.2 artificial ear)
Leakage
grade Use Number of holes
Diameter
(mm)
Depth
(mm)
High LRGP 33 1.7 8.5 0.2
6 1.8 8.5 0.2
It is recommended that the type 3.2 artificial ear with a high- or low-grade leak should be used for
measurements on supra-aural or supra-concha, hard-cap receivers, which naturally seal to the
simulator rim, intended for both narrow-band and wideband telephony applications (100 Hz to
8 kHz). It is also recommended for measurements on low acoustic impedance receivers.
The acoustic input impedance and the frequency sensitivity response of the type 3.2 artificial ear are
determined with reference to the ERP as specified in clause 6.4. The nominal modulus of the
impedance curve and the corresponding tolerance limits are given in Tables 4-a, 4-b and 4-c.
NOTE 1 – The leakage grade ("high" or "low") adopted in measurements shall be reported. The low-grade
leak intends to simulate real ear loss for a receiver pressed firmly to the ear, while the high-grade leak intends
to simulate real ear loss for a loosely coupled receiver.
NOTE 2 – The type 3.2 artificial ear emulates the human ear canal, with the microphone diaphragm at the
eardrum position. Hence, in addition to the particular microphone characteristics, the frequency sensitivity
response of the artificial ear includes an individual ERP to DRP transfer function. It is essential, therefore, that
measurement values are corrected for the frequency sensitivity response calibration data (open ear condition)
provided with the particular artificial ear used.
NOTE 3 – For receive loudness rating calculations according to [ITU-T P.79], the real ear loss correction LE
should be set to zero.
NOTE 4 – The ERP to DRP transfer function depends significantly on the acoustic loading of the ear. For
diagnostic purposes (e.g., to interpret differences to measurements made using the type 1 artificial ear), the
type 3.2 artificial ear may be supplied with calibration data recorded under closed-ear conditions or other well-
defined acoustical terminations.
NOTE 5 – The flat plate termination of the ear canal extension provided by the type 3.2 artificial ear is a
possible implementation of the type 3.1 artificial ear.
NOTE 6 – The type 3.2 artificial ear is only intended for use with earphones designed to operate in close
contact with the real pinna.
NOTE 7 – All dimensions determining the acoustic leak are for guidance only. They may be modified slightly
for different commercial designs in order to obtain the nominal acoustic input impedance.
NOTE 8 – It is recommended to use an application force between 5 N and 10 N for placing hard ear-caps
against the type 3.2 artificial ear. The force applied in the measurements shall always be reported.
NOTE 9 – For receivers that do not naturally seal to the simulator rim, an adapter may be created for the
specific geometry of the receiver. This adaptor may be machined or injection moulded and shall not alter the
specified concha volume or leak. The adaptor shall be made from a material which cannot be altered, shaped
or modified by the person performing the testing.
All leakage-related dimensions are for guidance only – see also Figure 6. Practical implementation
must always be optimized with respect to the acoustical specifications.

Rec. ITU-T P.57 (06/2021) 11
Table 4-a – Acoustical impedance, resonance, and Q-factors
(type 3.2 – low and high leak)
Q-factor Resonance
(Hz)
Magnitude
(dB)
Low leak 1.81 713.8 140.4
Tolerance () 0.18 25.0 1.0
High leak 3.5 1570.0 138.8
Tolerance () 0.35 50.0 1.5
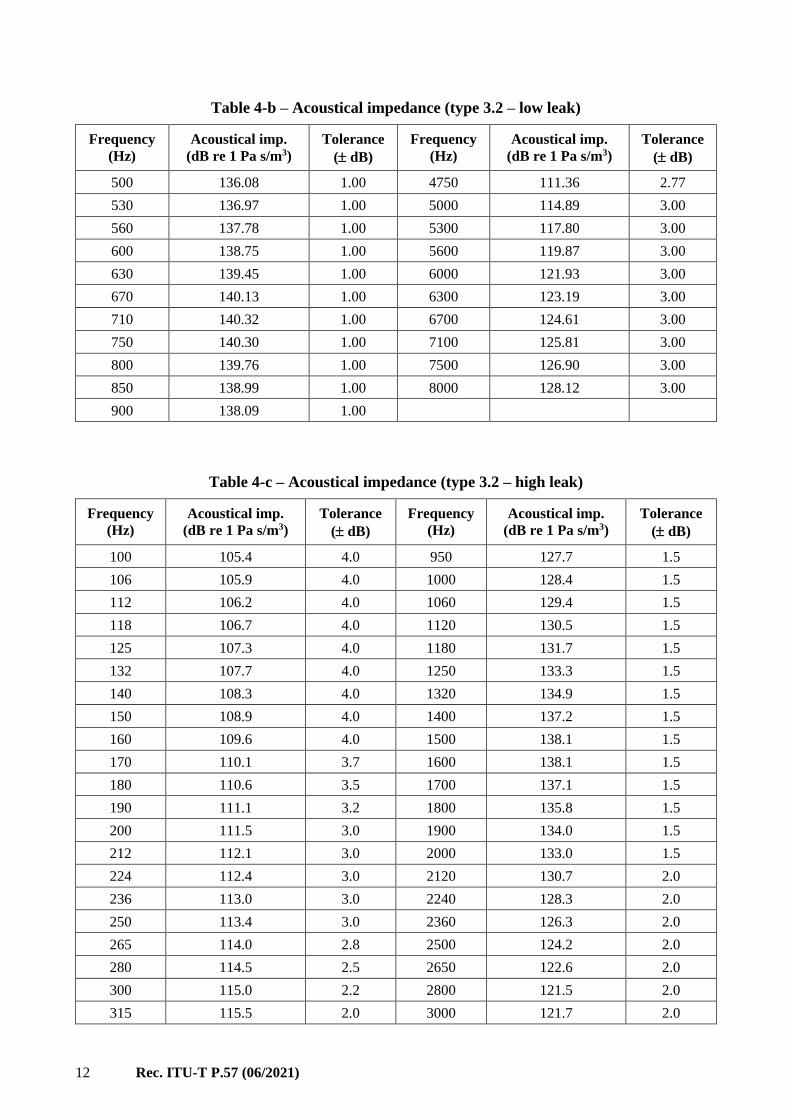
Table 4-b – Acoustical impedance (type 3.2 – low leak)
Frequency
(Hz)
Acoustical imp.
(dB re 1 Pa s/m3)
Tolerance
( dB)
Frequency
(Hz)
Acoustical imp.
(dB re 1 Pa s/m3)
Tolerance
( dB)
100 125.77 4.00 950 137.18 1.00
106 126.07 4.00 1000 136.33 1.00
112 126.18 4.00 1060 135.34 1.00
118 126.28 4.00 1120 134.40 1.00
125 126.44 4.00 1180 133.48 1.00
132 126.60 4.00 1250 132.46 1.00
140 126.74 4.00 1320 131.48 1.00
150 127.26 4.00 1400 130.40 1.00
160 127.27 4.00 1500 129.10 1.00
170 127.42 3.73 1600 127.85 1.00
180 127.79 3.47 1700 126.69 1.00
190 127.89 3.23 1800 125.58 1.00
200 128.10 3.00 1900 124.46 1.00
212 128.44 3.00 2000 123.45 1.00
224 128.71 3.00 2120 122.38 1.26
236 129.01 3.00 2240 121.22 1.51
250 129.31 3.00 2360 119.99 1.74
265 129.66 2.75 2500 118.69 2.00
280 130.08 2.51 2650 117.60 2.00
300 130.46 2.21 2800 116.99 2.00
315 130.92 2.00 3000 117.47 2.00
335 131.50 2.00 3150 117.91 2.00
355 132.02 2.00 3350 118.74 2.00
375 132.52 2.00 3550 119.23 2.00
400 133.23 2.00 3750 118.77 2.00
425 133.95 1.73 4000 116.22 2.00
450 134.72 1.47 4250 111.62 2.27
475 135.32 1.23 4500 108.19 2.53
12 Rec. ITU-T P.57 (06/2021)
Table 4-b – Acoustical impedance (type 3.2 – low leak)
Frequency
(Hz)
Acoustical imp.
(dB re 1 Pa s/m3)
Tolerance
( dB)
Frequency
(Hz)
Acoustical imp.
(dB re 1 Pa s/m3)
Tolerance
( dB)
500 136.08 1.00 4750 111.36 2.77
530 136.97 1.00 5000 114.89 3.00
560 137.78 1.00 5300 117.80 3.00
600 138.75 1.00 5600 119.87 3.00
630 139.45 1.00 6000 121.93 3.00
670 140.13 1.00 6300 123.19 3.00
710 140.32 1.00 6700 124.61 3.00
750 140.30 1.00 7100 125.81 3.00
800 139.76 1.00 7500 126.90 3.00
850 138.99 1.00 8000 128.12 3.00
900 138.09 1.00
Table 4-c – Acoustical impedance (type 3.2 – high leak)
Frequency
(Hz)
Acoustical imp.
(dB re 1 Pa s/m3)
Tolerance
( dB)
Frequency
(Hz)
Acoustical imp.
(dB re 1 Pa s/m3)
Tolerance
( dB)
100 105.4 4.0 950 127.7 1.5
106 105.9 4.0 1000 128.4 1.5
112 106.2 4.0 1060 129.4 1.5
118 106.7 4.0 1120 130.5 1.5
125 107.3 4.0 1180 131.7 1.5
132 107.7 4.0 1250 133.3 1.5
140 108.3 4.0 1320 134.9 1.5
150 108.9 4.0 1400 137.2 1.5
160 109.6 4.0 1500 138.1 1.5
170 110.1 3.7 1600 138.1 1.5
180 110.6 3.5 1700 137.1 1.5
190 111.1 3.2 1800 135.8 1.5
200 111.5 3.0 1900 134.0 1.5
212 112.1 3.0 2000 133.0 1.5
224 112.4 3.0 2120 130.7 2.0
236 113.0 3.0 2240 128.3 2.0
250 113.4 3.0 2360 126.3 2.0
265 114.0 2.8 2500 124.2 2.0
280 114.5 2.5 2650 122.6 2.0
300 115.0 2.2 2800 121.5 2.0
315 115.5 2.0 3000 121.7 2.0

Rec. ITU-T P.57 (06/2021) 13
Table 4-c – Acoustical impedance (type 3.2 – high leak)
Frequency
(Hz)
Acoustical imp.
(dB re 1 Pa s/m3)
Tolerance
( dB)
Frequency
(Hz)
Acoustical imp.
(dB re 1 Pa s/m3)
Tolerance
( dB)
335 116.1 2.0 3150 121.9 2.0
355 116.6 2.0 3350 122.6 2.0
375 117.1 2.0 3550 123.3 2.0
400 117.7 2.0 3750 123.4 2.0
425 118.4 1.5 4000 121.7 2.0
450 118.8 1.5 4250 118.2 2.3
475 119.3 1.5 4500 113.8 2.5
500 120.0 1.5 4750 110.9 2.8
530 120.6 1.5 5000 113.6 3.0
560 121.1 1.5 5300 116.6 3.0
600 121.9 1.5 5600 118.9 3.0
630 122.3 1.5 6000 121.3 3.0
670 123.0 1.5 6300 122.7 3.0
710 123.6 1.5 6700 124.3 3.0
750 124.4 1.5 7100 125.7 3.0
800 125.2 1.5 7500 126.9 3.0
850 126.1 1.5 8000 128.3 3.0
900 126.9 1.5
6.3.3 Type 3.3 – Pinna simulator
The type 3.3 artificial ear is realized by terminating the real ear canal extension with the pinna
simulator defined in this Recommendation (see Figures 7-a, 7-b, 7-c and 7-d). The dots in Figure 7-b
are located on a vertical axis through the ear canal entrance point. The pinna simulator shall be made
from a high-quality elastomer, the hardness of which – measured at the surface 15 mm forward to the
ear canal opening – should be 35 6° Shore-OO. Measurement techniques are described in
[b-ISO 48-4] and [b-ASTM D2240-15].
It is recommended that the type 3.3 artificial ear be used for measurements on all types of devices.
The sound pressure measured by the type 3.3 artificial ear is referring to the ear-drum reference point
(DRP). The correction function given in Tables 2-a (1/3 octave band measurements) and 2-b (1/12
octave band and sine measurements) shall be used for converting data to the ear reference point (ERP)
when it is required to calculate loudness ratings or check results against specifications based on
measurements referring to the ERP.
NOTE 1 – For receive loudness rating calculations according to [ITU-T P.79], the real ear loss correction LE
should be set to zero.
NOTE 2 – The application force of hard ear-caps against the type 3.3 pinna simulator should preferably be
about 10 N. The force applied in the measurements shall always be reported.
NOTE 3 – HATS with flexible pinna simulators are the only artificial ears recommended for headset
measurements as described in [ITU-T P.380]. However, in case other types of artificial ears are used and draw
different measurement results against type 3.3 artificial ears, the results from type 3.3 artificial ears shall take
precedence.

14 Rec. ITU-T P.57 (06/2021)
P.57(09)_F07a
Vertical bit
Ear breadth
Ear lengthabove tragion
Ear length
Concha length
Concha lengthbelow tragion
Protrusion
Protrusion angle
Concha depth
a) Cross-view b) Cross section
1 Anti-helix 2 Crus of helix 3 Concha 4 Tragion
Concha breadth
3
6°
2
4
1
37
Tragion
30
66
20
28
23
19160°
NOTE – Not to scale; units in mm.
Figure 7-a – Anatomically shaped pinna simulator

Rec. ITU-T P.57 (06/2021) 15
P.57(09)_F07b
Figure 7-b – Pinna simulator cross-sections

16 Rec. ITU-T P.57 (06/2021)
P.57(09)_F07c
EEP
Figure 7-c – Pinna simulator cross-sections

Rec. ITU-T P.57 (06/2021) 17
P.57(09)_F07d
Figure 7-d – Pinna simulator cross-sections

18 Rec. ITU-T P.57 (06/2021)
6.3.4 Type 3.4 – Pinna simulator (simplified)
The pinna simulation is realized in the type 3.4 artificial ear by terminating the drum reference plane
of the type 2 artificial ear with an ear canal extension and a simplified pinna (see Figure 8). The pinna
shall be made from an elastomer with a Shore-A hardness of 25 2 at 20 C 2 C.
It is recommended that the type 3.4 artificial ear be used as an alternative to the type 3.3 for
measurements on all types of devices except supra-concha headsets, supra-aural headsets and forward
facing intra-concha headsets (acoustic outlets that do not face the ear canal). The type 3.4 artificial
ear is intended to reproduce the typical handset leakage occurring in real use for pressure forces in
the range of 1 N and 13 N.
The sound pressure measured by the type 3.4 artificial ear is referred to the ear-drum reference point
(DRP). The correction function given in Tables 2-a (1/3 octave band measurements) and 2-b (1/12
octave bands and sine measurements) shall be used for converting data to the ear reference point
(ERP) when it is required to calculate loudness ratings or check results against specifications based
on measurements referred to the ERP.
NOTE – For receive loudness rating calculations according to [ITU-T P.79], the real ear loss correction LE
should be set to zero.

Rec. ITU-T P.57 (06/2021) 19
P.57(09)_F08
23.9
0 ±
0.2
5
6.7
0
±
0.1
0
9.0
0 ±
0
.1
3.2
0 ±
0.1
0
9.5
0 ±
0.2
5
HATS reference plane
Ear canal extension
EEP
2.0
0 ±
0.1
0
EEP
B-B
0.9
0 ±
0.2
EEP
Transfer plane
(Parallel to axis of
rotation)
Parallel to
vertical plane
12° ± 30'
2.0
0 ±
0.1
0
2.00 ± 0.25
NOTE – Units in mm.
Figure 8 – Type 3.4 artificial ear
6.4 Type 4 artificial ear
The type 4 artificial ear consists of the anatomically shaped ear canal and concha bottom ear simulator
which can be used as a stand-alone device for measurements on insert earphones, both sealed and
unsealed – or to which is added a pinna simulation device for measuring different transducer types.
The type 4 artificial ear configurations are classified as follows:
Type 4.1 – For further study.
Type 4.2 – For further study.
Type 4.3 – Anatomically shaped Type 3.3 based pinna simulator with fully human shaped ear canal.
Type 4.4 – Anatomically shaped Type 3.3 based pinna simulator with partly human shaped ear canal.
6.4.1 Type 4.1 ear simulator
For further study.

20 Rec. ITU-T P.57 (06/2021)
6.4.2 Type 4.2 ear simulator
For further study.
6.4.3 Type 4.3 ear simulator
6.4.3.1 Overview
The type 4.3 artificial ear is realized by terminating the anatomical ear canal simulator with the pinna
simulator defined in this Recommendation (see Figure 9). The pinna simulator shall be made from a
high-quality elastomer, the hardness of which – measured at the surface 15 mm forward to the ear
canal opening – should be 35 6°Shore-OO. Measurement techniques are described in [b-ISO 48-4]
and [b-ASTM D2240-15].
NOTE 1 – The application force of hard ear-caps against the type 4.3 pinna simulator should preferably be
about 10 N. The force applied in the measurements shall always be reported.
NOTE 2 – HATS with flexible pinna simulators are the only artificial ears recommended for headset
measurements as described in [ITU-T P.380]. However, in case artificial ears of type 1, 2 or 3 are used, and if
different measurement results are obtained compared to the type 4.3 artificial ears, the results from type
4.3 artificial ears shall take precedence.
NOTE 3 – A comparison between the type 4.3 pinna simulator and the type 3.3 pinna simulator will reveal a
difference between the two at the region where the transition from concha bottom to the ear canal takes place.
In the type 3.3 the concha bottom constitutes an almost plane surface which connects to the cylindrical shaped
ear canal in an approximately 90-degree angle. In the type 4.3 the concha bottom has been modified in order
to obtain smooth and continuous transition to the anatomically shaped ear canal.
Figure 9 – The type 4.3 ear simulator, showing an average
human ear canal with the type 3.3 based pinna simulator
attached
6.4.3.2 Ear-drum reference point to ear reference point correction
The sound pressure measured by the type 4.3 artificial ear refers to the ear-drum reference point
(DRP). The correction function given in Tables 5-a (1/3 octave band measurements) and 5-b
(1/12 octave band and sine measurements) shall be used for converting data to the ear reference point
(ERP) when it is required to calculate loudness ratings or check results against specifications based
on measurements referring to the ERP.
NOTE 1 – For receive loudness rating calculations according to [ITU-T P.79], the real ear loss correction LE
should be set to zero.

Rec. ITU-T P.57 (06/2021) 21
Table 5-a – SDE – Third octave measurements
Frequency (Hz) SDE
(dB)
Frequency (Hz) SDE
(dB)
20 0.00 630 –1.26
25 0.00 800 –1.67
31.5 0.00 1000 –1.93
40 0.00 1250 –2.30
50 –0.01 1600 –3.80
63 –0.01 2000 –6.12
80 –0.02 2500 –8.93
100 –0.03 3150 –11.34
125 –0.05 4000 –8.65
160 –0.09 5000 –5.69
200 –0.15 6300 –8.73
250 –0.24 8000 –7.22
315 –0.40 10000 –15.35
400 –0.61 12500 –13.16
500 –0.89 16000 –4.27 20000 +4.63
SDE is the transfer function DRP to ERP
SDE = 20 log10 (PE/PD)
where:
PE Sound pressure at the ERP
PD Sound pressure at the DRP
NOTE – The values in this table apply to 1/3 octave band measurements only.
Table 5-b – SDE – Twelfth octave measurements
Frequency
(Hz)
SDE
(dB)
Frequency
(Hz)
SDE
(dB)
Frequency
(Hz)
SDE
(dB)
20 0.00 200 –0.15 2000 –6.00
21 0.00 212 –0.17 2120 –6.73
22 0.00 224 –0.19 2240 –7.42
24 0.00 236 –0.21 2360 –8.00
25 0.00 250 –0.24 2500 –8.82
27 0.00 265 –0.27 2650 –9.71
28 0.00 280 –0.31 2800 –10.49
30 0.00 300 –0.35 3000 –11.34
32 0.00 315 –0.39 3150 –11.71
34 0.00 335 –0.44 3350 –11.61
36 0.00 355 –0.49 3550 –10.85
38 0.00 375 –0.54 3750 –9.81

22 Rec. ITU-T P.57 (06/2021)
Table 5-b – SDE – Twelfth octave measurements
Frequency
(Hz)
SDE
(dB)
Frequency
(Hz)
SDE
(dB)
Frequency
(Hz)
SDE
(dB)
40 0.00 400 –0.61 4000 –8.41
43 –0.01 425 –0.67 4250 –7.29
45 –0.01 450 –0.74 4500 –6.41
48 –0.01 475 –0.81 4750 –5.83
50 –0.01 500 –0.88 5000 –5.42
53 –0.01 530 –0.96 5300 –5.39
56 –0.01 560 –1.05 5600 –5.75
60 –0.01 600 –1.16 6000 –6.89
63 –0.01 630 –1.25 6300 –8.16
67 –0.01 670 –1.36 6700 –10.34
71 –0.02 710 –1.47 7100 –11.62
75 –0.02 750 –1.57 7500 –9.18
80 –0.02 800 –1.68 8000 –5.77
85 –0.02 850 –1.76 8500 –3.77
90 –0.03 900 –1.83 9000 –5.26
95 –0.03 950 –1.88 9500 –10.76
100 –0.03 1000 –1.92 10000 –16.52
106 –0.04 1060 –1.97 10600 –18.86
112 –0.04 1120 –2.04 11200 –17.09
118 –0.05 1180 –2.13 11800 –13.62
125 –0.05 1250 –2.26 12500 –11.63
132 –0.06 1320 –2.44 13200 –11.86
140 –0.07 1400 –2.71 14000 –12.42
150 –0.08 1500 –3.10 15000 –5.96
160 –0.09 1600 –3.73 16000 –2.05
170 –0.10 1700 –4.43 17000 1.06
180 –0.11 1800 –4.96 18000 –4.01
190 –0.13 1900 –5.43 19000 –3.29 20000 –6.61
NOTE – The frequencies listed are the 1/12 octave centre frequencies specified in [IEC 61260-1]. The values
apply to 1/12 octave band measurements as well as sine-based measurements. SDE may be determined for
immediate frequencies by interpolation on a (log f) versus (lin dB) basis.
6.4.3.3 Transfer impedance
For calibration of the ear simulator a reference volume shall be used. The effective acoustical volume
of the reference volume should be reported. Table 5-c provides data where the transfer impedance
has been measured using a reference volume of 1.63 cm3 (+/– 0,10 cm3). The transfer impedance of
the ear canal simulator is measured between the reference plane as shown in Figure 10 (see also
clause 6.4.3.4) and the DRP. The magnitude for transfer impedance and tolerances versus frequency
are provided in Table 5-c.

Rec. ITU-T P.57 (06/2021) 23
NOTE 1 – It should be noted that alternative methods for calibration of the ear simulator can be used. In such
situations the method should be stated.
NOTE 2 – At 500 Hz, the magnitude of the acoustic transfer impedance 27.7 MPa⋅s/m3 corresponds to the
magnitude of the effective volume of the ear simulator 1.63 ± 0,10 cm3.
Table 5-c – Transfer impedance (times f) for type 4.3 ear simulator relative to the reference
frequency 500 Hz for a nominal effective volume of 1.63 cm3 (±0.10 cm3)
Frequency
(Hz)
Transfer
imp. x f
Rel. 500 Hz
Tol.
upper
(dB)
Tol.
lower
(dB)
Frequency
(Hz)
Transfer
imp. x f
Rel. 500 Hz
Tol.
upper
(dB)
Tol.
lower
(dB)
20 –4.56 +2.4 –1.1 670 0.42 +0.9 –1.1
21 –4.50 +2.4 –1.1 710 0.59 +0.9 –1.1
22 –4.32 +2.2 –1.3 750 0.78 +0.8 –1.2
24 –4.15 +2.2 –1.3 800 1.04 +0.8 –1.2
25 –4.14 +2.4 –1.1 850 1.38 +0.7 –1.3
27 –3.97 +2.2 –1.3 900 1.74 +0.7 –1.3
28 –3.87 +2.2 –1.3 950 2.14 +0.7 –1.3
30 –3.71 +2.2 –1.3 1000 2.56 +0.7 –1.3
32 –3.61 +2.2 –1.3 1060 3.07 +0.7 –1.3
34 –3.46 +2.1 –1.4 1120 3.58 +0.8 –1.2
36 –3.34 +2.1 –1.4 1180 4.06 +0.8 –1.2
38 –3.20 +2.1 –1.4 1250 4.57 +0.9 –1.1
40 –3.06 +2.0 –1.5 1320 5.02 +0.9 –1.1
43 –2.93 +1.5 –1.5 1400 5.45 +1.0 –1.0
45 –2.80 +1.5 –1.5 1500 5.88 +1.0 –1.0
48 –2.65 +1.5 –1.5 1600 6.22 +1.1 –0.9
50 –2.56 +1.5 –1.5 1700 6.51 +1.1 –0.9
53 –2.42 +1.5 –1.5 1800 6.75 +1.1 –0.9
56 –2.30 +1.4 –1.6 1900 6.98 +1.1 –0.9
60 –2.15 +1.4 –1.6 2000 7.19 +1.1 –0.9
63 –2.05 +1.4 –1.6 2120 7.45 +1.1 –0.9
67 –1.93 +1.4 –1.6 2240 7.71 +1.1 –0.9
71 –1.83 +1.4 –1.6 2360 7.96 +1.1 –0.9
75 –1.69 +1.4 –1.1 2500 8.27 +1.1 –0.9
80 –1.58 +0.9 –1.1 2650 8.59 +1.1 –0.9
85 –1.48 +0.9 –1.1 2800 8.91 +1.2 –0.8
90 –1.38 +0.9 –1.1 3000 9.31 +1.2 –0.8
95 –1.30 +0.9 –1.1 3150 9.58 +1.2 –0.8
100 –1.22 +0.9 –1.1 3350 9.91 +1.2 –0.8
106 –1.11 +0.9 –1.1 3550 10.21 +1.2 –0.8
112 –1.03 +0.9 –1.1 3750 10.47 +1.2 –0.8
118 –0.98 +0.9 –1.1 4000 10.77 +1.2 –0.8
125 –0.89 +0.9 –1.1 4250 11.05 +1.2 –0.8

24 Rec. ITU-T P.57 (06/2021)
Table 5-c – Transfer impedance (times f) for type 4.3 ear simulator relative to the reference
frequency 500 Hz for a nominal effective volume of 1.63 cm3 (±0.10 cm3)
Frequency
(Hz)
Transfer
imp. x f
Rel. 500 Hz
Tol.
upper
(dB)
Tol.
lower
(dB)
Frequency
(Hz)
Transfer
imp. x f
Rel. 500 Hz
Tol.
upper
(dB)
Tol.
lower
(dB)
132 –0.83 +0.9 –1.1 4500 11.33 +1.2 –0.8
140 –0.77 +0.9 –1.1 4750 11.61 +1.1 –0.9
150 –0.70 +0.9 –1.1 5000 11.90 +1.1 –1.4
160 –0.64 +0.9 –1.1 5300 12.29 +1.1 –1.4
170 –0.58 +0.9 –1.1 5600 12.71 +1.5 –1.5
180 –0.55 +0.9 –1.1 6000 13.34 +1.7 –1.6
190 –0.51 +1.0 –1.0 6300 13.88 +1.6 –1.6
200 –0.47 +1.0 –1.0 6700 14.68 +1.8 –1.7
212 –0.43 +1.0 –1.0 7100 15.58 +1.7 –2.8
224 –0.40 +1.0 –1.0 7500 16.61 +2.1 –2.9
236 –0.37 +1.0 –1.0 8000 18.10 +1.9 –3.1
250 –0.34 +1.0 –1.0 8500 19.87 +2.7 –3.3
265 –0.31 +1.0 –1.0 9000 21.96 +2.9 –4.1
280 –0.28 +1.0 –1.0 9500 24.40 +2.6 –4.4
300 –0.26 +1.0 –1.0 10000 26.96 +2.4 –4.6
315 –0.23 +1.0 –1.0 10600 28.39 +3.7 –2.8
335 –0.22 +1.0 –1.0 11200 27.18 +4.5 –3.7
355 –0.18 +1.0 –1.0 11800 24.82 +5.2 –4.1
375 –0.17 +1.0 –1.0 12500 22.56 +4.2 –3.8
400 –0.13 +1.0 –1.0 13200 20.98 +3.4 –4.6
425 –0.10 +1.0 –1.0 14000 19.91 +3.1 –4.9
450 –0.07 +1.0 –1.0 15000 19.34 +2.8 –7.2
475 –0.04 +1.0 –1.0 16000 19.50 +2.6 –7.4
500 0.00 +1.0 –1.0 17000 20.76 +3.0 –8.0
530 0.05 +1.0 –1.0 18000 23.28 +5.1 –7.9
560 0.11 +1.0 –1.0 19000 28.36 +6.8 –9.2
600 0.21 +0.9 –1.1 20000 32.11 +4.6 –11.4
630 0.29 +0.9 –1.1
6.4.3.4 Geometry of the ear simulator
6.4.3.4.1 Overview
The geometry of the ear canal is specified by extracting cross sectional areas of the canal normal to a
curved axis following the centre of the ear canal as illustrated in the green planes of Figure 10. The
centre line is calculated from a surface model of the average human ear canal geometry. In brief, it is
determined as the weighted shortest paths to a maximal sphere inscribed in the object, the surface
model of the ear canal.

Rec. ITU-T P.57 (06/2021) 25
The geometry of the bottom of the concha is specified by three cross sectional areas as illustrated by
the yellow planes of Figure 10. As the centre line is not well defined beyond 28 mm, the origin
coordinate of each of those planes, as illustrated by the black dot in each plane, is found from a
perpendicular projection from each plane to the EEP, as illustrated by the red dot, and referred to as
"EEP projections". The last yellow plane of the concha bottom, before the transition to the pinna, is
the last plane from which data could be extracted from the average human ear canal geometry. The
two yellow planes between the last plane and the green 28 mm plane of the ear canal have been evenly
distributed. See clause B.1 for a detailed description of the cross sections areas.
Figure 10 – Cross sectional areas of the anatomically shaped ear canal and concha bottom of
the Type 4.3 ear simulator. It should be noted that the 0.5 mm plane is omitted in the illustration,
however all tables that holds geometry data do include data for the 0.5 mm plane
6.4.3.4.2 Coordinates of the centre line and the concha bottom
Using the terminology of [ITU-T P.64], a Cartesian coordinate system with origin in the centre of
lips (CL) is introduced. Using this coordinate and starting at the tip of the ear canal, the coordinates
of the centre line with the ear canal aligned on the right side of HATS are given in Table 6. The step
size is 0.5 mm and the first cross section of Figure 10 is located 0.5 mm from the tip and then at every
2 mm. The coordinates of DRP, the reference plane in the ear canal, EEP, the EEP projections in the
concha bottom, and of ERP are also given. The reference plane is located approximately 11 mm from
the opening of the ear canal and corresponds to the insertion depth of a typical insert earphone. The
location of DRP corresponds to the approximately centre of the tympanic membrane and represents
the point at the end of the ear canal where the sound pressure should be measured. The vector at DRP
illustrated in Figure 10 is normal to the measurements plane and points in the direction
[xm, ym, zm] = [–0.41, 0.58, –0.70].

26 Rec. ITU-T P.57 (06/2021)
Table 6 – The xm, ym, zm coordinates of the ear canal centre line and EEP
projections of the concha bottom
Centre line [mm] xm ym zm Cross section
0 103.67 39.29 50.71
0.5 103.81 39.76 50.69 0.5 mm
DRP 105.5 42.02 53.76
1 103.98 40.23 50.76
1.5 104.13 40.68 50.91
2 104.27 41.11 51.12 2 mm
2.5 104.43 41.53 51.34
3 104.58 41.93 51.59
3.5 104.73 42.34 51.84
4 104.87 42.77 52.04 4 mm
4.5 104.97 43.23 52.21
5 105.06 43.71 52.33
5.5 105.13 44.19 52.43
6 105.2 44.68 52.5 6 mm
6.5 105.3 45.17 52.53
7 105.43 45.65 52.54
7.5 105.48 46.14 52.6
8 105.56 46.64 52.62 8 mm
8.5 105.63 47.12 52.58
9 105.63 47.61 52.56
9.5 105.64 48.11 52.5
10 105.61 48.6 52.45 10 mm
10.5 105.63 49.08 52.32
11 105.67 49.54 52.12
11.5 105.72 49.99 51.92
12 105.75 50.46 51.74 12 mm
12.5 105.78 50.93 51.56
13 105.83 51.37 51.34
13.5 105.88 51.82 51.13
14 105.93 52.26 50.9 14 mm
14.5 106 52.7 50.67
15 106.07 53.11 50.4
15.5 106.15 53.51 50.11
16 106.2 53.92 49.84 16 mm
16.5 106.23 54.34 49.57
17 106.21 54.76 49.3
Ref. Plane (17.33) 106.18 55.04 49.13

Rec. ITU-T P.57 (06/2021) 27
Table 6 – The xm, ym, zm coordinates of the ear canal centre line and EEP
projections of the concha bottom
Centre line [mm] xm ym zm Cross section
17.5 106.17 55.18 49.03
18 106.09 55.6 48.78 18 mm
18.5 105.97 56.02 48.54
19 105.81 56.44 48.31
19.5 105.64 56.83 48.06
20 105.45 57.22 47.82 20 mm
20.5 105.21 57.61 47.62
21 104.97 57.97 47.37
21.5 104.69 58.33 47.16
22 104.39 58.67 46.96 22 mm
22.5 104.08 59.03 46.8
23 103.77 59.39 46.65
23.5 103.46 59.74 46.48
24 103.16 60.1 46.31 24 mm
24.5 102.87 60.47 46.14
25 102.6 60.84 45.96
25.5 102.35 61.24 45.8
26 102.14 61.67 45.65 26 mm
26.5 101.99 62.11 45.48
27 101.9 62.56 45.28
27.5 101.87 63.03 45.11
28 101.89 63.51 44.96 28 mm
EEP Projection 29.5 mm 103.90 64.07 42.59 29.5 mm
EEP Projection 31 mm 103.99 65.49 42.14 31 mm
EEP 104 66 42.99
EEP Projection 32.5 mm 103.97 67.01 41.78 32.5 mm
ERP 110 77.73 40.8
6.4.3.4.3 Unit vectors for each cross section of the ear canal
In order to align the cross section in 3D space on HATS, three unit vectors are assigned to each section
on the centre line as illustrated in Figure 11:
�̂�𝑒: normal vector of each cross section pointing towards the tip of the ear canal
along the centre line;
�̂�𝑒and �̂�𝑒: two unit vectors in the plane of each cross section perpendicular to �̂�𝑒.

28 Rec. ITU-T P.57 (06/2021)
Figure 11 – Illustration of the three unit vectors �̂�𝒆, �̂�𝒆, �̂�𝒆 assigned to each
cross section. �̂�𝒆 and �̂�𝒆 𝐚𝐫𝐞 𝐢𝐧 𝐭𝐡𝐞 𝐩𝐥𝐚𝐧𝐞 𝐨𝐟 𝐭𝐡𝐞 𝐜𝐫𝐨𝐬𝐬 𝐬𝐞𝐜𝐭𝐢𝐨𝐧, �̂�𝒆 is
parallel with HATS reference plane and �̂�𝐞 points in the direction of the
centre line towards the tip of the ear canal
The unit-vector �̂�𝑒 is defined always to be parallel with HATS reference plane as well as the xm – ym
plane of the coordinate system of Figure 11 and can be found as:
�̂�𝑒 =𝑐�̂�×�̂�
|𝑐�̂�×�̂�|,
where �̂� is a unit-vector in the zm direction. The other unit-vector �̂�𝑒 of each cross section can then be
found as
�̂�𝑒 =�̂�𝑒×𝑐�̂�
|�̂�𝑒×𝑐�̂�|.
By using the unit vectors as defined, sufficient information is now available to align each cross section
correctly on the centre line defined in Table 6.
In a similar manner unit vectors are assigned to the EEP projection points defined in Table 6 for the
cross sections of the concha bottom.
In Table 7 the xm, ym, zm coordinates of the three unit vectors for all cross sections of the ear canal
and concha bottom are given.
Table 7 – The xm, ym, zm coordinates of the three unit vectors of all cross sections
in the ear canal and concha bottom aligned on the centre line
Cross section �̂�𝒆(𝒙𝒎, 𝒚𝒎, 𝒛𝒎) [mm] �̂�𝒆(𝒙𝒎, 𝒚𝒎, 𝒛𝒎) [mm] �̂�𝒆(𝒙𝒎, 𝒚𝒎, 𝒛𝒎) [mm]
0.5 mm
0.00 –0.98 –0.22
–0.01 0.22 –0.98
1.00 0.00 –0.01
2 mm
–0.18 –0.93 –0.31
–0.46 0.36 –0.81
0.87 0.00 –0.49
4 mm –0.12 –0.95 –0.28

Rec. ITU-T P.57 (06/2021) 29
Table 7 – The xm, ym, zm coordinates of the three unit vectors of all cross sections
in the ear canal and concha bottom aligned on the centre line
Cross section �̂�𝒆(𝒙𝒎, 𝒚𝒎, 𝒛𝒎) [mm] �̂�𝒆(𝒙𝒎, 𝒚𝒎, 𝒛𝒎) [mm] �̂�𝒆(𝒙𝒎, 𝒚𝒎, 𝒛𝒎) [mm]
–0.36 0.30 –0.88
0.92 0.00 –0.38
6 mm
–0.01 –0.99 –0.15
–0.08 0.15 –0.99
1.00 0.00 –0.08
8 mm
–0.01 –0.98 –0.20
–0.07 0.20 –0.98
1.00 0.00 –0.07
10 mm
0.00 –1.00 –0.01
0.22 0.01 –0.98
0.98 0.00 0.22
12 mm
0.01 –1.00 –0.03
0.37 0.03 –0.93
0.93 0.00 0.37
14 mm
0.06 –0.99 –0.12
0.48 0.13 –0.87
0.87 0.00 0.49
16 mm
0.02 –1.00 –0.03
0.44 0.04 –0.90
0.90 0.00 0.44
Ref. Plane
–0.05 –1.00 0.08
0.56 –0.09 –0.82
0.82 0.00 0.57
18 mm
–0.11 –0.97 0.20
0.47 –0.23 –0.85
0.87 0.00 0.49
20 mm
–0.18 –0.87 0.45
0.32 –0.49 –0.81
0.93 0.00 0.37
22 mm
–0.18 –0.76 0.63
0.21 –0.65 –0.73
0.96 0.00 0.28
24 mm
–0.22 –0.78 0.58
0.28 –0.63 –0.73
0.93 0.00 0.36
26 mm –0.15 –0.91 0.39

30 Rec. ITU-T P.57 (06/2021)
Table 7 – The xm, ym, zm coordinates of the three unit vectors of all cross sections
in the ear canal and concha bottom aligned on the centre line
Cross section �̂�𝒆(𝒙𝒎, 𝒚𝒎, 𝒛𝒎) [mm] �̂�𝒆(𝒙𝒎, 𝒚𝒎, 𝒛𝒎) [mm] �̂�𝒆(𝒙𝒎, 𝒚𝒎, 𝒛𝒎) [mm]
0.33 –0.42 –0.84
0.93 0.00 0.37
28 mm
0.03 –1.00 –0.09
0.33 0.09 –0.94
0.94 0.00 0.33
(29.5 mm)
0.02 –1.00 –0.05
0.29 0.05 –0.96
0.96 0.00 0.29
(31 mm)
0.00 –1.00 –0.01
0.26 0.01 –0.97
0.97 0.00 0.26
(32.5 mm)
–0.01 –1.00 0.03
0.21 –0.03 –0.98
0.98 0.00 0.21
6.4.3.4.4 Cross sectional areas of the ear canal and concha bottom
The cross sectional areas of the ear canal and the concha bottom as illustrated in Figure 10 in the
plane of the two unit vectors �̂�𝑒, �̂�𝑒 . They are as illustrated in Figure 11 and are plotted in Figure 12
and listed in tables in clause B.2.

Rec. ITU-T P.57 (06/2021) 31
Figure 12 – Cross sectional areas in the �̂�𝒆, �̂�𝒆 plane of the two unit vectors
6.4.3.4.5 Geometry of anatomically shaped pinna simulator
The type 4.3 artificial ear is achieved by adding a type 3.3 based pinna simulator device to the concha
bottom of the ear simulator. To obtain a well-defined transition from type 3.3 to type 4.3 pinna, the
method described in clauses 6.4.3.4.1 to 6.4.3.4.4 has been extended to obtain closely spaced cross
sections of the geometry of the pinna simulator device as illustrated by the blue planes in Figure 13.
In contrast to Figures 7-b and 7-c, where the type 3.3 pinna is sliced horizontally, the type 4.3 pinna
is sliced in parallel planes and tilted by 8.1 degrees relative to the vertical plane of HATS. These cross
sections are parallel with the cheek of HATS and corresponds to the vertical tilt of the ear-cap vector
of the handset position for HATS as defined in Annex E of [ITU-T P.64]. Thereby the first blue plane

32 Rec. ITU-T P.57 (06/2021)
of the pinna is closely located to and can be connected to the last yellow plane of the concha bottom,
as illustrated in Figure 13.
Figure 13-a – Points on the periphery of the cross-sectional areas of the anatomically shaped
ear canal, concha bottom and pinna simulator of the type 4.3 ear simulator. The green and
yellow cross sections represent the ear canal and concha bottom, the red cross section is the
reference plane of the ear canal. The purple point is the DRP and the vector is the normal vector of
the measurement plane. The blue cross sections represent the pinna.
The black line is the centre line, the red dot is EEP and the black
dots are the projections of EEP onto each plane.

Rec. ITU-T P.57 (06/2021) 33
Figure 13-b – A different viewing angle of Figure 13-a
6.4.3.4.6 Coordinates of the EEP projections for the pinna simulator
The origin coordinate for the cross section of the pinna, as illustrated by the black dot in each of the
blue planes in Figure 13, is found from perpendicular projections from each plane to the EEP,
following the method as described in clause B.1 for the cross sections of the concha bottom. The
distance indicates the parallel distance between each plane relative to the cheek of HATS.
Table 8 – The xm, ym, zm coordinates of the EEP projections for the pinna simulator
Relative distance from cheek plane of HATS [mm] xm ym zm
–1 104.00 67.75 41.75
0 104.00 68.74 41.61
1 104.00 69.73 41.47
2 104.00 70.72 41.33
3 104.00 71.71 41.19
4 104.00 72.70 41.04
5 104.00 73.69 40.90
6 104.00 74.68 40.76

34 Rec. ITU-T P.57 (06/2021)
Table 8 – The xm, ym, zm coordinates of the EEP projections for the pinna simulator
Relative distance from cheek plane of HATS [mm] xm ym zm
7 104.00 75.67 40.62
8 104.00 76.66 40.48
9 104.00 77.65 40.34
10 104.00 78.64 40.20
11 104.00 79.63 40.06
12 104.00 80.62 39.92
13 104.00 81.61 39.77
14 104.00 82.60 39.63
15 104.00 83.59 39.49
16 104.00 84.58 39.35
17 104.00 85.57 39.21
18 104.00 86.56 39.07
18.5 104.00 87.06 39.00
6.4.3.4.7 Unit vector for the cross section of the pinna simulator
In order to align the cross section of the pinna in 3D space on HATS, the three unit vectors as defined
in clause 3.2 is assigned to each cross section of the pinna simulator. As the cross sections of the
pinna are all parallel, as illustrated by the blue planes of Figure 13, the same three unit vector apply
for all cross sections of the pinna.
In Table 9, the xm, ym, zm coordinates of the three unit vectors are applicable for all cross sections of
the pinna simulator, aligned at the EEP projection points of Table 9, as illustrated by the black dots
of the blue planes shown in Figure 13.
Table 9 – The xm, ym, zm coordinates of the three unit vectors applicable
for all cross sections of the pinna aligned at the EEP projection points
�̂�𝒆(𝒙𝒎, 𝒚𝒎, 𝒛𝒎) [mm] �̂�𝒆(𝒙𝒎, 𝒚𝒎, 𝒛𝒎) [mm] �̂�𝒆(𝒙𝒎, 𝒚𝒎, 𝒛𝒎) [mm]
0 –1 0
0.14 0 –0.99
0.99 0 0.14
6.4.3.4.8 Cross sectional areas of the pinna simulator
The cross sectional areas of the pinna as illustrated in Figure 13 in the plane of the two unit vectors
�̂�𝑒, �̂�𝑒 as defined in clause 6.4.3.4.3 are plotted in Figure 14 and listed in tables in clause B.3. The
type 4.3 pinna is sliced in cross sections with 1mm between each plane due to the complex anatomy
of the pinna compared to the ear canal and concha bottom. The blue areas in Figure 14 indicate the
solid areas of the pinna, and the white areas indicate air. The red dot placed at the origin of each plot
is the projection of the EEP onto that particular plane as listed in Table 8 and illustrated in Figure 13
by the black dot in the blue planes of the pinna.

Rec. ITU-T P.57 (06/2021) 35
Figure 14 – Cross sectional areas of the pinna in the �̂�𝒆, �̂�𝒆 plane of the two unit vectors

36 Rec. ITU-T P.57 (06/2021)
6.4.4 Type 4.4 ear simulator
6.4.4.1 Overview
The type 4.4 artificial ear can be used as an alternative to the type 4.3 ear simulator for almost all
types of applications. It consists of the same pinna, concha bottom and ear canal entry as the
type 4.3 up to the reference plane. The remaining inner part of the ear canal between reference plane
and DRP is based on [IEC 60318-4], and consists of a transition piece and a cylindrically shaped
cavity.
The type 4.4 artificial ear can be used for all types of devices, except for deep intra-concha or insert
devices, which extend beyond the reference plane. In such cases, the type 4.3 ear simulator shall be
used.
NOTE 1 – The application force of hard ear-caps against the type 4.4 pinna simulator should preferably be
about 10 N. The force applied in the measurements shall always be reported.
NOTE 2 – HATS with flexible pinna simulators are the only artificial ears recommended for headset
measurements as described in [ITU-T P.380]. However, in case artificial ears of type 1, 2 or 3 are used, and if
different measurement results are obtained compared to the type 4.4 artificial ears, the results from the
type 4.4 artificial ears shall take precedence.
6.4.4.2 Ear-drum reference point to ear reference point correction
The sound pressure measured by the type 4.4 artificial ear refers to the ear-drum reference point
(DRP). The correction function given in Tables 5-a (1/3 octave band measurements) and 5-b
(1/12 octave band and sine measurements) shall be used for converting data to the ear reference point
(ERP) when it is required to calculate loudness ratings or to check results against specifications based
on measurements referring to the ERP.
NOTE – For receive loudness rating calculations according to [ITU-T P.79], the real ear loss correction LE
should be set to zero.
6.4.4.3 Transfer impedance
The transfer impedance of the ear canal simulator is slightly different as for type 4.3 ear simulator
(see clause 6.4.3.3), and is measured between the reference plane, as shown in Figure 15, and the
DRP. The magnitude for transfer impedance and tolerances versus frequency are provided in
Table 10.
NOTE 1 – At 500 Hz, the magnitude of the acoustic transfer impedance 27.7 MPa⋅s/m3 corresponds to the
magnitude of the effective volume of the ear simulator 1.63 ± 0.10 cm3.
NOTE 2 – The nominal transfer impedance in Table 10 is that of the Type 4.3 ear simulator, whereas the upper
tolerance from 20 Hz to 180 Hz and the lower tolerances at 20 kHz has been extended to accommodate the
Type 4.4 ear simulator.
Table 10 – Transfer impedance (times f) for type 4.4 ear simulator relative to the reference
frequency 500 Hz for a nominal effective volume of 1.63 cm3 (±0.10 cm3)
Frequency
(Hz)
Transfer
imp. x f
Rel. 500 Hz
Tol.
upper
(dB)
Tol.
lower
(dB)
Frequency
(Hz)
Transfer
imp. x f
Rel. 500 Hz
Tol.
upper
(dB)
Tol.
lower
(dB)
20 –4.56 +6.2 –1.1 670 0.42 +0.9 –1.1
21 –4.50 +6.1 –1.1 710 0.59 +0.9 –1.1
22 –4.32 +6.1 –1.3 750 0.78 +0.8 –1.2
24 –4.15 +6.0 –1.3 800 1.04 +0.8 –1.2
25 –4.14 +5.7 –1.1 850 1.38 +0.7 –1.3
27 –3.97 +5.8 –1.3 900 1.74 +0.7 –1.3

Rec. ITU-T P.57 (06/2021) 37
Table 10 – Transfer impedance (times f) for type 4.4 ear simulator relative to the reference
frequency 500 Hz for a nominal effective volume of 1.63 cm3 (±0.10 cm3)
Frequency
(Hz)
Transfer
imp. x f
Rel. 500 Hz
Tol.
upper
(dB)
Tol.
lower
(dB)
Frequency
(Hz)
Transfer
imp. x f
Rel. 500 Hz
Tol.
upper
(dB)
Tol.
lower
(dB)
28 –3.87 +5.7 –1.3 950 2.14 +0.7 –1.3
30 –3.71 +5.5 –1.3 1000 2.56 +0.7 –1.3
32 –3.61 +5.4 –1.3 1060 3.07 +0.7 –1.3
34 –3.46 +5.4 –1.4 1120 3.58 +0.8 –1.2
36 –3.34 +5.2 –1.4 1180 4.06 +0.8 –1.2
38 –3.20 +5.1 –1.4 1250 4.57 +0.9 –1.1
40 –3.06 +5.1 –1.5 1320 5.02 +0.9 –1.1
43 –2.93 +4.9 –1.5 1400 5.45 +1.0 –1.0
45 –2.80 +4.8 –1.5 1500 5.88 +1.0 –1.0
48 –2.65 +4.7 –1.5 1600 6.22 +1.1 –0.9
50 –2.56 +4.6 –1.5 1700 6.51 +1.1 –0.9
53 –2.42 +4.4 –1.5 1800 6.75 +1.1 –0.9
56 –2.30 +4.4 –1.6 1900 6.98 +1.1 –0.9
60 –2.15 +4.3 –1.6 2000 7.19 +1.1 –0.9
63 –2.05 +4.2 –1.6 2120 7.45 +1.1 –0.9
67 –1.93 +4.0 –1.6 2240 7.71 +1.1 –0.9
71 –1.83 +3.9 –1.6 2360 7.96 +1.1 –0.9
75 –1.69 +3.3 –1.1 2500 8.27 +1.1 –0.9
80 –1.58 +3.2 –1.1 2650 8.59 +1.1 –0.9
85 –1.48 +3.1 –1.1 2800 8.91 +1.2 –0.8
90 –1.38 +3.0 –1.1 3000 9.31 +1.2 –0.8
95 –1.30 +2.9 –1.1 3150 9.58 +1.2 –0.8
100 –1.22 +2.8 –1.1 3350 9.91 +1.2 –0.8
106 –1.11 +2.7 –1.1 3550 10.21 +1.2 –0.8
112 –1.03 +2.6 –1.1 3750 10.47 +1.2 –0.8
118 –0.98 +2.6 –1.1 4000 10.77 +1.2 –0.8
125 –0.89 +2.5 –1.1 4250 11.05 +1.2 –0.8
132 –0.83 +2.4 –1.1 4500 11.33 +1.2 –0.8
140 –0.77 +2.4 –1.1 4750 11.61 +1.1 –0.9
150 –0.70 +2.3 –1.1 5000 11.90 +1.1 –1.4
160 –0.64 +2.2 –1.1 5300 12.29 +1.1 –1.4
170 –0.58 +2.2 –1.1 5600 12.71 +1.5 –1.5
180 –0.55 +2.2 –1.1 6000 13.34 +1.7 –1.6
190 –0.51 +1.0 –1.0 6300 13.88 +1.6 –1.6
200 –0.47 +1.0 –1.0 6700 14.68 +1.8 –1.7
212 –0.43 +1.0 –1.0 7100 15.58 +1.7 –2.8

38 Rec. ITU-T P.57 (06/2021)
Table 10 – Transfer impedance (times f) for type 4.4 ear simulator relative to the reference
frequency 500 Hz for a nominal effective volume of 1.63 cm3 (±0.10 cm3)
Frequency
(Hz)
Transfer
imp. x f
Rel. 500 Hz
Tol.
upper
(dB)
Tol.
lower
(dB)
Frequency
(Hz)
Transfer
imp. x f
Rel. 500 Hz
Tol.
upper
(dB)
Tol.
lower
(dB)
224 –0.40 +1.0 –1.0 7500 16.61 +2.1 –2.9
236 –0.37 +1.0 –1.0 8000 18.10 +1.9 –3.1
250 –0.34 +1.0 –1.0 8500 19.87 +2.7 –3.3
265 –0.31 +1.0 –1.0 9000 21.96 +2.9 –4.1
280 –0.28 +1.0 –1.0 9500 24.40 +2.6 –4.4
300 –0.26 +1.0 –1.0 10000 26.96 +2.4 –4.6
315 –0.23 +1.0 –1.0 10600 28.39 +3.7 –2.8
335 –0.22 +1.0 –1.0 11200 27.18 +4.5 –3.7
355 –0.18 +1.0 –1.0 11800 24.82 +5.2 –4.1
375 –0.17 +1.0 –1.0 12500 22.56 +4.2 –3.8
400 –0.13 +1.0 –1.0 13200 20.98 +3.4 –4.6
425 –0.10 +1.0 –1.0 14000 19.91 +3.1 –4.9
450 –0.07 +1.0 –1.0 15000 19.34 +2.8 –7.2
475 –0.04 +1.0 –1.0 16000 19.50 +2.6 –7.4
500 0.00 +1.0 –1.0 17000 20.76 +3.0 –8.0
530 0.05 +1.0 –1.0 18000 23.28 +5.1 –7.9
560 0.11 +1.0 –1.0 19000 28.36 +6.8 –9.5
600 0.21 +0.9 –1.1 20000 32.11 +4.6 –13.4
630 0.29 +0.9 –1.1
6.4.4.4 Geometry of the ear simulator
6.4.4.4.1 Overview
The geometry of the ear canal for type 4.4 is two-folded: the first part consists of the same pinna,
concha bottom and ear canal entry as specified for type 4.3 (see clause 6.4.3.4) up to the reference
plane (see Figure 15). The second part consists of a transition piece and a cylindrically shaped cavity,
which is shown in Figure 17.
Since the main part of the inner ear canal has a cylindric shape, a short transition piece of 1 mm length
shall be used. The centre line and cross-sections are provided in the following clauses in a similar
way as in clause 6.4.3, but with a much higher resolution (steps of 0.25 mm).

Rec. ITU-T P.57 (06/2021) 39
Figure 15 – Cross sectional areas of the anatomically shaped ear canal and concha bottom of
the type 4.4 ear simulator
The major part of the inner ear canal is realized as a cylindric cavity and is similar to the principal
cavity in the ear simulator described in [IEC 60318-4], which is used for the type 3.3 ear. Figure 16
shows the full geometry, which also includes two additional volumes. The DRP is located at the end
plane of the cylinder and has the same orientation as the centre line.
The following dimensions of the cylindric cavity shall be considered for an implementation:
– The diameter D of the principal cavity shall be 7.50 mm with a tolerance of ±0.1 mm.
– The length L of the principal cavity shall be dimensioned to produce a half-wavelength
resonance of the sound pressure at 11.2 kHz with a tolerance of ±1.0 kHz (see also definition
of transfer impedance in clause 6.4.3.3) of the whole inner ear canal part
(including the transition piece).
– The length L of the principal cavity shall be 14.25 mm (excluding the transition piece).
A tolerance of ±0.5 mm allows an adjustment regarding the resonance frequency.
To meet the transfer impedance requirement, two volumes V1 and V2 as indicated in Figure 16 may
be required.

40 Rec. ITU-T P.57 (06/2021)
Figure 16 – Geometry of cylindric cavity of the inner part of the ear canal
6.4.4.4.2 Coordinates of the centre line and the concha bottom
The coordinates of the centre line and the concha bottom are defined in the same way as for
type 4.3 ear simulator (see clause 6.4.3.4.2) in Table 11. In contrast to the ear canal geometry of the
type 4.3 ear, the specification of the centre line for type 4.4 ear is defined at several non-equidistant
positions due to the following reasons:
– The cylindric cavity is already completely defined by radius (7.5 mm) and length
(14.25 mm), see Figure 16.
– The resolution of the transition piece (14.25 to 15.25 mm) is provided in a higher resolution
(0.25 mm) to ensure that the anatomically shaped ear canal entry is seamlessly attached.
– To exactly meet the same coordinates and cross-section definitions as in clause 6.4.3.4.2 for
the ear canal entry, the centre line after the transition piece (15.42 mm) is aligned to the centre
line position 17.5 mm of type 4.3.
Table 11 – The xm, ym, zm coordinates of the ear canal centre line and EEP projections of the
concha bottom for type 4.4
Centre line [mm] xm ym zm Comment
0 107.32 43.36 57.25 DRP plane
14.25 106.38 54.14 49.57 Connection to cylindric cavity
14.5 106.33 55.12 49.46 Transition piece
14.75 106.28 55.09 49.35 Transition piece
15 106.23 55.07 49.24 Transition piece
15.25 106.18 55.04 49.13 Reference Plane
15.42 106.17 55.18 49.03 (equals 17.5 mm of type 4.3)
15.92 106.09 55.6 48.78
16.42 105.97 56.02 48.54
16.92 105.81 56.44 48.31
17.42 105.64 56.83 48.06
17.92 105.45 57.22 47.82

Rec. ITU-T P.57 (06/2021) 41
Table 11 – The xm, ym, zm coordinates of the ear canal centre line and EEP projections of the
concha bottom for type 4.4
Centre line [mm] xm ym zm Comment
18.42 105.21 57.61 47.62
18.92 104.97 57.97 47.37
19.42 104.69 58.33 47.16
19.92 104.39 58.67 46.96
20.42 104.08 59.03 46.8
20.92 103.77 59.39 46.65
21.42 103.46 59.74 46.48
21.92 103.16 60.1 46.31
22.42 102.87 60.47 46.14
22.92 102.6 60.84 45.96
23.42 102.35 61.24 45.8
23.92 102.14 61.67 45.65
24.42 101.99 62.11 45.48
24.92 101.9 62.56 45.28
25.42 101.87 63.03 45.11
25.92 101.89 63.51 44.96 (equals 28 mm of type 4.3)
103.90 64.07 42.59 EEP Projection #1
103.99 65.49 42.14 EEP Projection #2
104 66 42.99 EEP
103.97 67.01 41.78 EEP Projection #3
110 77.73 40.8 ERP
6.4.4.4.3 Unit vectors for each cross section of the ear canal
The unit vectors for each cross section of the ear canal are defined in the same way as for type 4.3 ear
simulator (see clause 6.4.3.4.3). In Table 12, the xm, ym, zm coordinates of the three unit vectors for
all cross sections of the ear canal entry and concha bottom are given. Note that the unit vector is the
same for all cross-sections in the inner part of the ear canal.
Table 12 – The xm, ym, zm coordinates of the three unit vectors of all cross sections
in the ear canal and concha bottom aligned on the centre line
Cross section [mm] �̂�𝒆(𝒙𝒎, 𝒚𝒎, 𝒛𝒎) [mm] �̂�𝒆(𝒙𝒎, 𝒚𝒎, 𝒛𝒎) [mm] �̂�𝒆(𝒙𝒎, 𝒚𝒎, 𝒛𝒎) [mm]
DRP Plane (0) to
Ref. Plane (15.25)
–0.05 –1.00 0.08
0.56 –0.09 –0.82
0.82 0.00 0.57
15.92
–0.11 –0.97 0.20
0.47 –0.23 –0.85
0.87 0.00 0.49
17.92 –0.18 –0.87 0.45

42 Rec. ITU-T P.57 (06/2021)
Table 12 – The xm, ym, zm coordinates of the three unit vectors of all cross sections
in the ear canal and concha bottom aligned on the centre line
Cross section [mm] �̂�𝒆(𝒙𝒎, 𝒚𝒎, 𝒛𝒎) [mm] �̂�𝒆(𝒙𝒎, 𝒚𝒎, 𝒛𝒎) [mm] �̂�𝒆(𝒙𝒎, 𝒚𝒎, 𝒛𝒎) [mm]
0.32 –0.49 –0.81
0.93 0.00 0.37
19.92
–0.18 –0.76 0.63
0.21 –0.65 –0.73
0.96 0.00 0.28
21.92
–0.22 –0.78 0.58
0.28 –0.63 –0.73
0.93 0.00 0.36
23.92
–0.15 –0.91 0.39
0.33 –0.42 –0.84
0.93 0.00 0.37
25.92
0.03 –1.00 –0.09
0.33 0.09 –0.94
0.94 0.00 0.33
EEP Projection #1
0.02 –1.00 –0.05
0.29 0.05 –0.96
0.96 0.00 0.29
EEP Projection #2
0.00 –1.00 –0.01
0.26 0.01 –0.97
0.97 0.00 0.26
EEP Projection #3
–0.01 –1.00 0.03
0.21 –0.03 –0.98
0.98 0.00 0.21
6.4.4.4.4 Cross sectional areas of the ear canal and concha bottom
The cross-sectional areas of the ear canal entry and concha bottom are the same as for type 4.3 ear
simulator (see clause 6.4.3.4.4 and clause B.2). Only the areas from the reference plane to the outer
concha bottom are applicable.
Figure 17 illustrates the cross-sectional areas of the ear canal entry and concha bottom in the plane of
the two unit vectors �̂�𝑒, �̂�𝑒 as illustrated in Figure 11. Tabular data of the cross-sections are provided
in clause C.2.

Rec. ITU-T P.57 (06/2021) 43
Figure 17 – Cross sectional areas in the �̂�𝒆, �̂�𝒆 plane of the two unit vectors
6.4.4.4.5 Geometry of anatomically shaped Pinna Simulator
The geometry of anatomically shaped pinna simulator is the same as for type 4.3 ear simulator
(see clause 6.4.3.4.5).
6.4.4.4.6 Coordinates of the EEP projections
The coordinates of the EEP projections of the pinna simulator are the same as for type 4.3 ear
simulator (see clause 6.4.3.4.6 and clause B.1/C.1).
6.4.4.4.7 Unit vector for the cross section of the pinna simulator
The unit vectors for the cross section of the pinna simulator are the same as for type 4.3 ear simulator
(see clause 6.4.3.4.7).
6.4.4.4.8 Cross sectional areas of the pinna simulator
The cross-sectional areas of the pinna simulator are the same as for type 4.3 ear simulator
(see clause 6.4.3.4.8 and clause B.3/C.3).
6.5 Calibration of the artificial ears type 1 and type 3.2
6.5.1 Performance testing of the IEC 60318-4 occluded-ear simulator (type 3.2 only)
The proper performance of the IEC 60318-4 occluded-ear simulator, which is an integral part of the
type 3.2 artificial ear, is essential to the performance of the complete artificial ear.
NOTE – Performance testing and calibration of the occluded-ear simulator are specified in [IEC 60318-4].
6.5.2 Frequency sensitivity response
The artificial ear to be calibrated is mounted in a large plane baffle. The sound pressure is
measured immediately in front of the ERP using a probe microphone with its probe tip
(diameter less than 1.5 mm) positioned at the ear reference plane as indicated in Figure 18.

44 Rec. ITU-T P.57 (06/2021)
The frequency sensitivity response (open ear condition) is then defined as the ratio between the output
of the artificial ear and the corresponding sound pressure at the ERP recorded by the probe
microphone when subjected to a plane incident wave perpendicular to the baffle.
NOTE 1 – The frequency sensitivity response has a very low sensitivity to the positioning of the sound source.
In practice, therefore, more compact calibration set-ups may be realized with or without correction of the
results, depending on the required calibration accuracy.
NOTE 2 – The frequency sensitivity response under closed ear conditions may be measured using the
calibration set-up for acoustic input impedance described in clause 6.4.3. It is determined as the ratio between
the output of the artificial ear and the sound pressure recorded by the probe microphone at the ERP.
NOTE 3 – The frequency sensitivity response shall normally be determined within the range of atmospheric
reference conditions given in clause 6.6 at the frequencies listed in Table 2-b. The actual atmospheric
conditions shall be reported. When the artificial ear operating conditions are significantly different from the
reference conditions, the calibration of the frequency sensitivity response should, if possible, be performed
under the operating conditions.
Figure 18 – Set-up for measuring the frequency sensitivity response
(open ear conditions) of type 1 and type 3.2 artificial ears
6.5.3 Acoustic input impedance
A 1/2" working-standard pressure microphone (IEC WS2P) with its protection grid mounted is placed
in a flat surface and concentrically applied and sealed to the artificial ear for use as a constant volume
velocity source, driving the artificial ear at the ERP. The corresponding sound pressure at the ERP
shall be measured using a probe microphone with its probe tip (diameter less than 1.5 mm) positioned
at the ERP. The distance between the microphone grid and the pickup point of the ear simulator shall
be less than 1 mm. A practical implementation of a calibration device is shown in Figure 19.

Rec. ITU-T P.57 (06/2021) 45
Figure 19 – Practical implementation of a calibration device (impedance probe)
for measuring acoustical input impedance of type 1 and type 3.2 artificial ears
The acoustic input impedance is then defined as the ratio between the sound pressure recorded by the
probe microphone and the volume velocity generated by the 1/2" microphone.
NOTE – The acoustic input impedance shall be determined within the range of atmospheric reference
conditions given in clause 6.6. The actual conditions shall be reported.
Annex A contains a practical description of a procedure which allows complete calibration based on
a calibrated reference microphone and a calibrated volume.

46 Rec. ITU-T P.57 (06/2021)
6.6 Performance verification of the artificial ears types 2, 3.1, 3.3 and 3.4
These types of artificial ears do not provide a well-defined ERP, as they either do not simulate the
pinna or feature a flexible pinna which may cause the frequency sensitivity response and acoustical
input impedance to change as a function of application pressure. Thus, an actual calibration with
respect to frequency sensitivity response as well as acoustic input impedance is not relevant.
The performance verification of these artificial ears, therefore, relies exclusively on the performance
testing and calibration of the occluded ear simulator as specified in [IEC 60318-4] in combination
with a verification of the mechanical properties of the pinna simulator (Types 3.3 and 3.4 only).
6.7 Atmospheric reference conditions
It is recommended that measurements using artificial ears be performed under the following reference
conditions:
Static pressure: 101.3 3.0 kPa;
Temperature: 23 3° C;
Humidity: 60 20%.
NOTE – When it is required to perform measurements under other atmospheric conditions, the actual
conditions shall be reported.
6.8 General requirements
The metallic parts composing the artificial ears shall be made of non-magnetic material.
NOTE – The IEC WS2P microphones used in the artificial ears may contain magnetic material.
6.9 Ear-drum reference point to ear reference point correction
While type 2, 3.3 and 3.4 artificial ears are calibrated by applying a known acoustic pressure to the
DRP, Types 1 and 3.2 are calibrated by applying a known acoustic pressure to the ERP. As a
consequence, the acoustic pressure measured by means of Types 2, 3.3 and 3.4 shall be referred to
the ERP by means of the standardized correction functions reported in Tables 2-a and 2-b, while the
pressure measured by Types 1 and 3.2 is directly referring to the ERP.
NOTE – The individual calibration of Types 1 and 3.2 can either be provided by the manufacturer in terms of
the overall electro-acoustic sensitivity from the ERP to the electric output of the measurement microphone
built into the artificial ear, or in terms of the level correction between the acoustic pressure measured by the
built-in microphone and the pressure at the ERP. The latter approach is preferable as it allows for an easier
routine check of the artificial ear's calibration.
7 Idle noise floor
Certain measurement applications require a low self-noise of the acoustic test equipment, including
the ear simulators.
For this purpose and in addition to the layout, design and acoustic properties of all artificial ears
described in clause 6, an optional low noise requirement can be defined based on the lower threshold
of hearing as defined in [ISO 389-7] and shown in Figure 20.

Rec. ITU-T P.57 (06/2021) 47
Figure 20 – Hearing threshold according to [ISO 389-7]
Requirements
The idle noise level in each frequency band shall be below the hearing threshold under diffuse-field
conditions as defined from 20 Hz to 16 kHz in Table 1 of [ISO 389-7].
In case individual test specifications do not require noise-sensitive measurements for frequencies
higher than 10 kHz, ears simulators used may deviate from the above requirements in the frequency
range above 10 kHz.
For binaural applications, left and right ear simulator shall meet this requirement.
Test method
1) The artificial ear under test is placed in an acoustically treated measurement chamber, either
stand-alone or mounted on a HATS.
2) The idle noise is analysed over at a time period of at least 10 s with appropriate measurement
equipment.
3) Diffuse-field correction according to Table 3 of [ITU-T P.58] shall be applied to the analysis
in 1/3rd octave bands (row B) according to [IEC 61260-1].
4) The requirement and the measured idle noise versus bands is evaluated for each frequency
according to the frequency range required by the individual test specification, but at least up
to 10 kHz.

48 Rec. ITU-T P.57 (06/2021)
Annex A
A practical procedure for determination of the acoustic
input impedance of artificial ears
(This annex forms an integral part of this Recommendation.)
A.1 Introduction
The procedure described in this annex allows accurate and traceable calibration of the acoustic input
impedance of artificial ears type 1 and type 3.2 as required in clause 6.4.3. Additionally, the
calibration set-up allows determination of the closed condition frequency sensitivity response of the
artificial ears.
The procedure relies on the availability of a laboratory-standard 1/2" pressure microphone
(IEC LS2P) calibrated with respect to its frequency sensitivity response, and a calibrated reference
volume.
The set-up required to perform the measurements is shown in Figure A.1. It is based upon an audio
frequency response analyser and an impedance probe consisting of a 1/2" working-standard pressure
microphone (IEC WS2P) used as transmitter, and a probe microphone used as receiver
(see Figure 10).
The reference microphone and the reference volume are used to determine the relative frequency
sensitivity responses of the transmitter and probe microphones in the impedance probe prior to the
calibration of the artificial ear itself. For this purpose, the reference microphone is mounted in a
calibration unit, positioned as closely as possible to the probe tip integrated in the impedance probe.
P.57(09)_FA.1
Program disk
Power amplifier
Probe in Direct in out
Microphone
power supply
out
Ch
1
Ch
2
200 V
In
Out
Transmitter socket and microphone
Impedance probe
Ear simulator
Calibration unit
Reference microphone
Microphone preamplifier
For calibration purpose
Reference volume
Figure A.1 – Measurement set-up

Rec. ITU-T P.57 (06/2021) 49
A.2 Calibration of the impedance probe
A.2.1 Frequency response of the probe microphone
The reference microphone (Figure A.1) is mounted in the calibration unit and the calibration unit is
placed in a suitable test bench. The impedance probe is attached to the calibration unit and the
reference microphone is now used to calibrate the probe microphone. This is done by measuring the
frequency response of the probe microphone relative to the frequency response of the reference
microphone. The signal is delivered by the transmitter microphone of the impedance probe. The
absolute frequency response of the probe microphone in [V/Pa] is then obtained as follows:
( )
( )( )fH
fV
fV(f)H RefCal
RefO,
PrbO,Prb.Abs
=
where:
HPrb.Abs(f): Absolute frequency response of the probe microphone
VO,Prb(f): Probe microphone output voltage in calibration unit
VO,Ref(f): Reference microphone output voltage in calibration unit
HRefCal(f): Absolute calibrated reference microphone response.
A.2.2 Relative frequency response of the transmitter microphone
Apart from a constant factor, the transmitter microphone capsule in the impedance probe has the same
frequency sensitivity when used as a volume source as it does during its normal use as a receiver.
Hence, the same method and set-up used for the probe microphone calibration is used to calibrate the
transmitter microphone of the impedance probe. The only difference is that now the reference
microphone delivers the signal, and the calibrated probe microphone is used to calibrate the
transmitter microphone which, in this case, is used as a receiver:
( )( )
( )( )fH
fV
fVfH Prb.Abs
PrbO,
TrO,Tr.Abs.Mic
=
where:
HTr.Abs.Mic(f): Absolute microphone frequency response of the transmitter microphone
VO,Prb(f): Probe microphone output voltage in calibration unit
VO,Tr(f): Transmitter microphone output voltage in calibration unit
HPrb.Abs(f): Absolute frequency response of the probe microphone (as measured above).
The frequency response of the transmitter microphone, relative to the sensitivity at a reference
frequency (f0), when used as a volume velocity source is then:
( )( )( )
( )00Tr.Abs.Mic
Tr.Abs.MicTr.Rel.Src ff
fH
fHfH =
where the term (f/f0) relates to the fact that the transmit sensitivity is expressed in terms of volume
velocity rather than volume.
A.2.3 Absolute sensitivity of the transmitter microphone as a volume velocity source
The additional factor describing the absolute sensitivity of the transmitter microphone, when used as
a volume velocity source, remains to be determined. This factor is found by measuring the sound
pressure level produced by the transmitter microphone in the reference volume. The reference volume
is placed in the test bench and the impedance probe is attached to the reference volume. The nominal

50 Rec. ITU-T P.57 (06/2021)
acoustical impedance in [Pa s/m3] equals one divided by the acoustic compliance (Ca) of the reference
volume:
Vjω
ρc
jω
1Z
2
aRef . Vola, ==
It is recommended that the reference volume has a size comparable to the volume of the artificial
ears. For a known excitation voltage, vi,Tr.Mic, the sound pressure, pPr.Mic, is measured at a low
frequency (f0) where the frequency response of the transmitter microphone is frequency independent
and the reference volume behaves as an ideal compliance. The absolute sensitivity factor of the
transmitter microphone in [m3/Vs] is calculated as follows:
( )
( ) ( ) 0Tr . M i ci ,0Re f . Vola ,
0Pr . M i cTr . Sr c
fVfZ
fps
=
Thus the absolute sensitivity of the transmitter microphone, when used as a volume velocity source,
is:
( ) ( ) Tr . Sr cTr . Rel . Sr cTr . Abs . Sr c sfHfH =
A.3 Artificial ear calibration
A.3.1 Determination of acoustical impedance
During the measurements, the artificial ear is placed in a suitable test bench (not shown in Figure A.1).
Referring to Figure A.1 the impedance probe is attached to the artificial ear. With the transmitter
microphone providing the volume velocity q(f), the sound pressure pERP(f) at the ERP is measured by
the probe microphone of the impedance probe:
( )( )
( )
( )( )
( )( )
==
fH
fV
fH
fV
fq
fpfZ
Tr.Abs.Src
i.Tr.Src
Prb.Abs
PrbMicO,
ERPERPEar,
where:
Vi,Tr.Src(f): Input voltage to the transmitter microphone used as a volume velocity source
VO,PrbMic(f): Output voltage of the probe microphone.
A.3.2 Determination of closed condition sound pressure sensitivity
The same set-up is used as for the determination of acoustic input impedance, but the output voltage
of the artificial ear relative to the sound pressure at the ERP is measured:
( )( )
( )
( )
=
fH
fV
fVfH
Prb.Abs
PrMicO,
EarO,Cond. ClosedEar,

Rec. ITU-T P.57 (06/2021) 51
Annex B
Cross sectional areas of type 4.3 artificial ear
(This annex forms an integral part of this Recommendation.)
B.1 Cross sections of the concha bottom
As illustrated in Figure 10, two cross section planes have been evenly distributed, between the 28 mm
plane and the last plane of the concha bottom. These planes have been determined using the algorithm
outlined below.
First, the green plane at 28 mm and the last plane are characterized by a point and a normal vector as
summarized in Table B.1.
Table B.1 – The points and normal vectors describing the 28 mm plane and
the last plane of the ear canal
Plane Description x [mm] y [mm] z [mm]
28 mm plane Point in plane, 𝐫𝐅𝐢𝐫𝐬𝐭 101.89 63.51 44.96
Normal vector of plane, �̂�𝐅𝐢𝐫𝐬𝐭 –0.088 0.939 –0.333
Last plane of the concha
bottom
Point in plane, 𝐫𝐋𝐚𝐬𝐭 101.77 67.44 44.11
Normal vector of plane, �̂�𝐋𝐚𝐬𝐭 –0.032 0.977 0.210
To find the shortest distance from 𝐫𝐅𝐢𝐫𝐬𝐭 to the last plane the equation for a plane is used:
�̂� ⋅ (𝐫 − 𝐫𝟎) = 0,
where �̂� is the normal unit vector of the plane, 𝐫𝟎 is a point in the plane and 𝐫 is the set of all points
fulfilling the equation. The shortest distance between the centre line point at 28 mm to the last plane
of the ear canal is then given by:
𝐷𝐅𝐢𝐫𝐬𝐭−𝐋𝐚𝐬𝐭 =|�̂�𝐋𝐚𝐬𝐭⋅𝐫𝐅𝐢𝐫𝐬𝐭−�̂�𝐋𝐚𝐬𝐭⋅𝐫𝐋𝐚𝐬𝐭|
|�̂�𝐋𝐚𝐬𝐭|
The point in the last plane closest to the 28 mm centre line point is thus given by:
𝐫𝐋𝐚𝐬𝐭 = 𝐫𝐅𝐢𝐫𝐬𝐭 + �̂�𝐋𝐚𝐬𝐭𝐷𝐅𝐢𝐫𝐬𝐭−𝐋𝐚𝐬𝐭.
The point 𝐫𝐋𝐚𝐬𝐭 given in Table B.1 is the point in the last plane closest to the 28 mm centre line point.
In order to find planes in-between the two planes in Table B.1. a point in each plane is first
determined. This is done by evenly distributing points on the straight line between 𝐫𝐅𝐢𝐫𝐬𝐭 and 𝐫𝐋𝐚𝐬𝐭 in
the following way:
𝐫𝐢 = 𝐫𝐅𝐢𝐫𝐬𝐭 + (𝐫𝐋𝐚𝐬𝐭 − 𝐫𝐅𝐢𝐫𝐬𝐭)𝑖
𝑁planes+1
where 𝑁planes is the number of planes added between the two planes and 𝑖 = 1. . 𝑁planes. A similar
approach is used in order to determine the normal vectors of the planes between the two planes:
𝐧𝐢 = 𝐧𝐅𝐢𝐫𝐬𝐭 + (𝐧𝐋𝐚𝐬𝐭 − 𝐧𝐅𝐢𝐫𝐬𝐭)𝑖
𝑁planes+1
In this way the orientations of the interpolated planes are linearly dependent on the orientation of the
28 mm centre line plane and the last plane of the ear canal.
The points in the planes found using this algorithm are not the points used as origin in the 2D plots
of Figure 12 for the three yellow planes. For those planes EEP have been projected into the planes
and the projected EEP points are then used as the origin in Figure 12.

52 Rec. ITU-T P.57 (06/2021)
The projected EEP points are found in the following way. First the perpendicular signed distance
between EEP and the plane is found:
𝐷𝐄𝐄𝐏−𝐏𝐥𝐚𝐧𝐞 =�̂�𝐏𝐥𝐚𝐧𝐞⋅𝐫𝐄𝐄𝐏−�̂�𝐏𝐥𝐚𝐧𝐞⋅𝐫𝐏𝐥𝐚𝐧𝐞
|�̂�𝐏𝐥𝐚𝐧𝐞|
where �̂�𝐏𝐥𝐚𝐧𝐞 is the normal vector of the plane, 𝐫𝐄𝐄𝐏 is the EEP point (104,66,42) and 𝐫𝐏𝐥𝐚𝐧𝐞 is any
point in the plane. The projection of the EEP point on to the plane is then simply given as:
EEP Projection = 𝐫𝐄𝐄𝐏 − �̂�𝐏𝐥𝐚𝐧𝐞𝐷𝐄𝐄𝐏−𝐏𝐥𝐚𝐧𝐞
B.2 Cross sectional areas of the ear canal and concha bottom
The cross sectional areas of the ear canal and the concha bottom as described in clauses 6.4.3.4.2,
6.4.3.4.3 and 6.4.3.4.4 and illustrated in Figure 10 in the plane of the two unit vectors �̂�𝑒, �̂�𝑒 as
illustrated in Figure 11 are listed in Table B.2. The cross sections along the centre line (the green
planes) are given with 25 points on the periphery in each, corresponding to a spacing better than or
equal to 1.1 mm. The cross sections of the concha bottom (the yellow planes) are larger and given
with a spacing of 1 mm between the points. These tables are the basis for the plots shown in Figure 12.
Table B.2 – Tabular values for the cross sectional areas of the ear canal and concha bottom
Cross section 0.5 mm Cross section 2 mm Cross section 4 mm
�̂�𝒆 �̂�𝒆 �̂�𝒆 �̂�𝒆 �̂�𝒆 �̂�𝒆
–0.76 –0.89 –1.72 –0.37 1.74 –1.04
–0.82 –0.55 –1.89 –0.91 2.27 –0.54
–0.80 –0.20 –1.91 –1.47 2.57 0.13
–0.70 0.13 –1.73 –2.00 2.69 0.85
–0.54 0.43 –1.30 –2.36 2.74 1.58
–0.33 0.71 –0.76 –2.36 2.85 2.30
–0.11 0.98 –0.30 –2.04 2.82 3.02
0.13 1.22 0.09 –1.62 2.32 3.47
0.40 1.44 0.48 –1.22 1.61 3.37
0.69 1.63 0.89 –0.83 0.97 3.03
1.00 1.78 1.30 –0.44 0.36 2.63
1.34 1.83 1.66 0.00 –0.22 2.18
1.67 1.77 1.94 0.49 –0.78 1.71
1.76 1.44 2.16 1.01 –1.31 1.20
1.70 1.10 2.33 1.55 –1.81 0.67
1.58 0.77 2.40 2.10 –2.21 0.06
1.41 0.47 2.11 2.58 –2.46 –0.63
1.22 0.19 1.55 2.61 –2.51 –1.36
1.01 –0.09 1.03 2.41 –2.38 –2.07
0.78 –0.35 0.55 2.10 –2.00 –2.69
0.56 –0.62 0.11 1.75 –1.35 –2.93
0.33 –0.87 –0.33 1.39 –0.70 –2.62
0.06 –1.10 –0.74 1.00 –0.15 –2.14
–0.25 –1.24 –1.13 0.59 0.45 –1.73

Rec. ITU-T P.57 (06/2021) 53
Cross section 0.5 mm Cross section 2 mm Cross section 4 mm
�̂�𝒆 �̂�𝒆 �̂�𝒆 �̂�𝒆 �̂�𝒆 �̂�𝒆
–0.57 –1.17 –1.46 0.13 1.11 –1.40
Cross section 6 mm Cross section 8 mm Cross section 10 mm
�̂�𝒆 �̂�𝒆 �̂�𝒆 �̂�𝒆 �̂�𝒆 �̂�𝒆
2.32 0.28 3.18 0.71 –2.21 1.45
2.61 1.01 3.54 1.44 –1.57 2.03
2.94 1.72 3.70 2.24 –0.91 2.57
3.30 2.43 3.42 2.99 –0.19 3.04
3.26 3.18 2.77 3.48 0.61 3.33
2.67 3.64 1.99 3.70 1.47 3.39
1.89 3.64 1.18 3.65 2.29 3.17
1.15 3.39 0.42 3.36 3.03 2.73
0.47 3.00 –0.28 2.91 3.63 2.12
–0.14 2.51 –0.89 2.39 3.99 1.35
–0.72 1.98 –1.51 1.84 4.03 0.50
–1.29 1.44 –2.09 1.27 3.75 –0.30
–1.82 0.87 –2.63 0.66 3.23 –0.98
–2.29 0.24 –3.04 –0.05 2.57 –1.52
–2.62 –0.47 –3.19 –0.84 1.83 –1.97
–2.68 –1.25 –2.91 –1.60 1.05 –2.34
–2.50 –2.00 –2.35 –2.20 0.24 –2.61
–2.08 –2.67 –1.66 –2.62 –0.61 –2.75
–1.47 –3.14 –0.89 –2.89 –1.46 –2.75
–0.70 –3.19 –0.08 –2.85 –2.30 –2.55
–0.03 –2.80 0.64 –2.47 –3.06 –2.15
0.55 –2.27 1.26 –1.93 –3.57 –1.48
1.10 –1.71 1.81 –1.32 –3.65 –0.64
1.60 –1.10 2.31 –0.68 –3.33 0.15
2.00 –0.43 2.76 0.01 –2.81 0.84
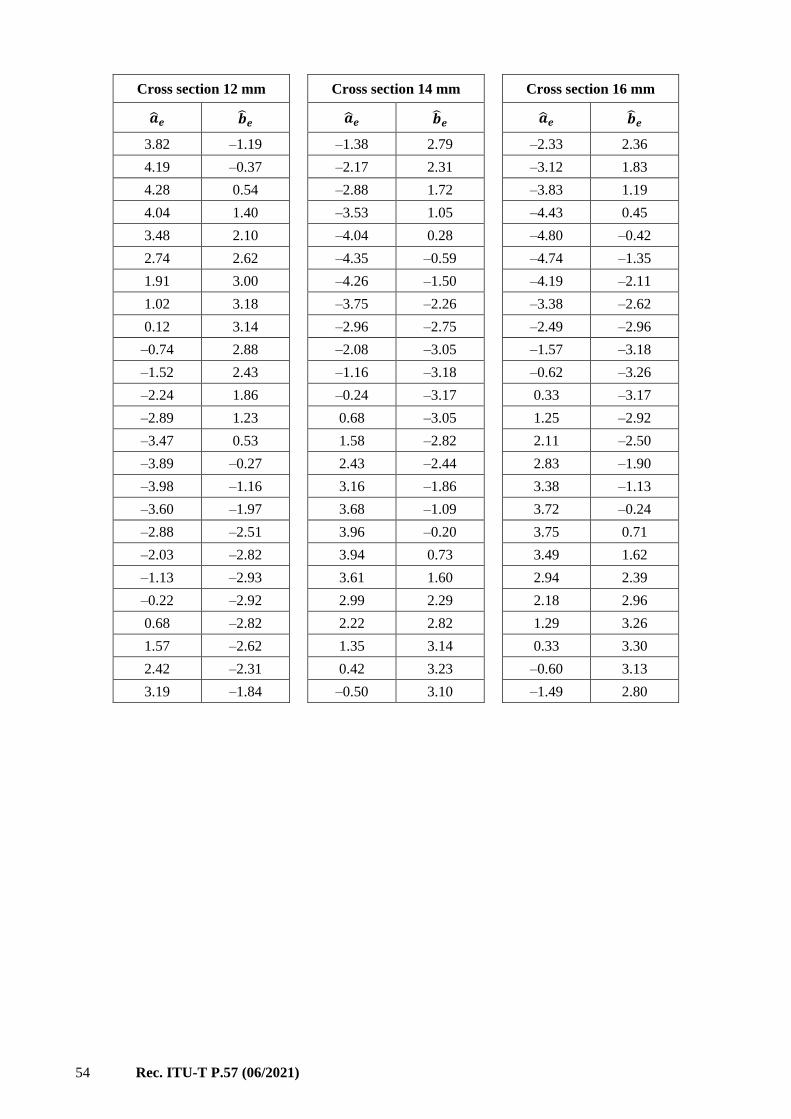
54 Rec. ITU-T P.57 (06/2021)
Cross section 12 mm Cross section 14 mm Cross section 16 mm
�̂�𝒆 �̂�𝒆 �̂�𝒆 �̂�𝒆 �̂�𝒆 �̂�𝒆
3.82 –1.19 –1.38 2.79 –2.33 2.36
4.19 –0.37 –2.17 2.31 –3.12 1.83
4.28 0.54 –2.88 1.72 –3.83 1.19
4.04 1.40 –3.53 1.05 –4.43 0.45
3.48 2.10 –4.04 0.28 –4.80 –0.42
2.74 2.62 –4.35 –0.59 –4.74 –1.35
1.91 3.00 –4.26 –1.50 –4.19 –2.11
1.02 3.18 –3.75 –2.26 –3.38 –2.62
0.12 3.14 –2.96 –2.75 –2.49 –2.96
–0.74 2.88 –2.08 –3.05 –1.57 –3.18
–1.52 2.43 –1.16 –3.18 –0.62 –3.26
–2.24 1.86 –0.24 –3.17 0.33 –3.17
–2.89 1.23 0.68 –3.05 1.25 –2.92
–3.47 0.53 1.58 –2.82 2.11 –2.50
–3.89 –0.27 2.43 –2.44 2.83 –1.90
–3.98 –1.16 3.16 –1.86 3.38 –1.13
–3.60 –1.97 3.68 –1.09 3.72 –0.24
–2.88 –2.51 3.96 –0.20 3.75 0.71
–2.03 –2.82 3.94 0.73 3.49 1.62
–1.13 –2.93 3.61 1.60 2.94 2.39
–0.22 –2.92 2.99 2.29 2.18 2.96
0.68 –2.82 2.22 2.82 1.29 3.26
1.57 –2.62 1.35 3.14 0.33 3.30
2.42 –2.31 0.42 3.23 –0.60 3.13
3.19 –1.84 –0.50 3.10 –1.49 2.80

Rec. ITU-T P.57 (06/2021) 55
Cross section Ref. Plane Cross section 18 mm Cross section 20 mm
�̂�𝒆 �̂�𝒆 �̂�𝒆 �̂�𝒆 �̂�𝒆 �̂�𝒆
2.94 –1.27 –1.83 2.63 –0.30 –3.24
2.37 –2.02 –2.70 2.24 0.64 –3.00
1.65 –2.62 –3.52 1.75 1.52 –2.57
0.82 –3.07 –4.25 1.14 2.31 –2.00
–0.09 –3.31 –4.85 0.39 2.95 –1.26
–1.03 –3.34 –5.19 –0.49 3.39 –0.39
–1.96 –3.21 –4.99 –1.40 3.52 0.57
–2.86 –2.91 –4.38 –2.14 3.26 1.50
–3.70 –2.50 –3.60 –2.68 2.64 2.26
–4.44 –1.92 –2.73 –3.08 1.80 2.74
–4.93 –1.12 –1.81 –3.32 0.84 2.94
–4.90 –0.20 –0.86 –3.37 –0.13 2.98
–4.47 0.64 0.09 –3.25 –1.11 2.88
–3.84 1.34 0.99 –2.95 –2.06 2.67
–3.10 1.92 1.81 –2.46 –2.98 2.34
–2.29 2.40 2.50 –1.81 –3.84 1.89
–1.42 2.77 3.07 –1.04 –4.62 1.29
–0.53 3.06 3.44 –0.17 –5.25 0.55
0.40 3.21 3.55 0.78 –5.61 –0.35
1.34 3.14 3.29 1.69 –5.48 –1.31
2.22 2.83 2.71 2.44 –4.90 –2.09
2.95 2.24 1.89 2.92 –4.10 –2.65
3.41 1.42 0.97 3.14 –3.21 –3.04
3.53 0.50 0.02 3.10 –2.26 –3.25
3.35 –0.43 –0.92 2.92 –1.28 –3.32

56 Rec. ITU-T P.57 (06/2021)
Cross section 22 mm Cross section 24 mm Cross section 26 mm
�̂�𝒆 �̂�𝒆 �̂�𝒆 �̂�𝒆 �̂�𝒆 �̂�𝒆
–0.43 –3.00 –4.35 2.12 3.56 0.84
0.53 –2.91 –5.11 1.50 2.99 1.69
1.45 –2.64 –5.54 0.64 2.24 2.41
2.30 –2.18 –5.45 –0.32 1.38 2.96
3.01 –1.54 –4.89 –1.12 0.41 3.28
3.49 –0.71 –4.15 –1.76 –0.61 3.39
3.61 0.24 –3.30 –2.25 –1.64 3.33
3.34 1.16 –2.38 –2.61 –2.65 3.12
2.76 1.93 –1.44 –2.87 –3.60 2.75
1.98 2.48 –0.47 –3.01 –4.47 2.22
1.07 2.81 0.51 –3.01 –5.18 1.47
0.12 2.96 1.47 –2.82 –5.57 0.53
–0.84 2.96 2.37 –2.43 –5.51 –0.48
–1.80 2.84 3.15 –1.85 –5.01 –1.38
–2.74 2.62 3.68 –1.03 –4.24 –2.06
–3.64 2.28 3.79 –0.06 –3.34 –2.56
–4.47 1.79 3.50 0.87 –2.39 –2.94
–5.18 1.15 2.95 1.67 –1.40 –3.20
–5.58 0.28 2.22 2.32 –0.38 –3.33
–5.44 –0.66 1.34 2.77 0.65 –3.31
–4.87 –1.42 0.39 3.00 1.65 –3.08
–4.11 –2.02 –0.59 3.07 2.56 –2.62
–3.26 –2.46 –1.57 3.01 3.37 –1.98
–2.34 –2.76 –2.53 2.84 3.92 –1.13
–1.39 –2.93 –3.47 2.55 3.93 –0.11

Rec. ITU-T P.57 (06/2021) 57
Cross section 28 mm Cross section 29.5 mm Cross section 31 mm Cross section 32.5 mm
�̂�𝒆 �̂�𝒆 �̂�𝒆 �̂�𝒆 �̂�𝒆 �̂�𝒆 �̂�𝒆 �̂�𝒆
–5.51 2.16 6.33 1.54 6.57 1.62 –6.38 3.86
–4.71 2.92 6.14 2.51 6.20 2.54 –6.82 2.97
–3.70 3.36 5.58 3.34 5.57 3.32 –7.00 1.99
–2.62 3.58 4.86 4.02 4.82 3.97 –6.94 0.99
–1.52 3.67 4.04 4.60 3.97 4.51 –6.78 0.00
–0.42 3.59 3.16 5.07 3.07 4.93 –6.58 –0.98
0.66 3.34 2.21 5.39 2.11 5.20 –6.37 –1.95
1.67 2.90 1.23 5.54 1.12 5.34 –6.16 –2.93
2.59 2.29 0.23 5.58 0.12 5.39 –5.99 –3.92
3.39 1.53 –0.77 5.55 –0.88 5.39 –5.83 –4.91
4.00 0.61 –1.77 5.45 –1.88 5.36 –5.67 –5.89
4.13 –0.47 –2.74 5.23 –2.88 5.28 –5.37 –6.84
3.69 –1.47 –3.65 4.82 –3.85 5.06 –4.92 –7.74
2.92 –2.26 –4.39 4.16 –4.76 4.65 –4.30 –8.52
2.00 –2.86 –4.90 3.31 –5.47 3.99 –3.54 –9.16
0.95 –3.22 –5.13 2.34 –5.96 3.13 –2.64 –9.60
–0.14 –3.38 –4.97 1.36 –6.09 2.15 –1.66 –9.78
–1.24 –3.38 –4.49 0.49 –5.94 1.16 –0.66 –9.73
–2.34 –3.25 –3.79 –0.23 –5.57 0.23 0.29 –9.43
–3.41 –2.97 –3.00 –0.83 –5.06 –0.62 1.16 –8.93
–4.43 –2.54 –2.13 –1.33 –4.47 –1.44 1.91 –8.28
–5.32 –1.89 –1.20 –1.70 –3.88 –2.24 2.57 –7.53
–5.94 –0.99 –0.24 –1.95 –3.29 –3.05 3.14 –6.71
–6.18 0.08 0.76 –2.05 –2.72 –3.87 3.63 –5.84
–6.01 1.18 1.76 –2.00 –2.09 –4.64 4.14 –4.98 2.75 –1.86 –1.31 –5.26 4.71 –4.15 3.71 –1.62 –0.35 –5.49 5.29 –3.34 4.61 –1.17 0.63 –5.34 5.89 –2.54 5.36 –0.52 1.47 –4.81 6.40 –1.68 5.94 0.29 2.29 –4.23 6.75 –0.74 6.30 1.22 3.10 –3.65 6.86 0.25 3.92 –3.07 6.73 1.24 4.72 –2.47 6.31 2.14 5.43 –1.77 5.70 2.93 6.02 –0.97 4.94 3.59 6.44 –0.06 4.09 4.10 6.60 0.92 3.17 4.49
2.20 4.74
1.21 4.87
0.21 4.92
–0.79 4.96
–1.79 5.00
–2.79 5.04
–3.79 5.02
–4.77 4.84
–5.70 4.48

58 Rec. ITU-T P.57 (06/2021)
B.3 Cross sectional areas of the pinna simulator
The cross sectional areas of the pinna simulator as described in clauses 6.4.3.4.2 to 6.4.3.4.8 and
illustrated in Figure 14 in the plane of the two unit vectors �̂�𝑒, �̂�𝑒 as defined in clause 6.4.3.4.3 are
listed in Table B.3. The cross sections are given with a spacing on the periphery of 1mm between the
points. These tables are the basis for the plots shown in Figure 14.
The distance from each cross-section plane to the chin of HATS is given in the heading of each table.
For some distances there are multiple tables associated. In that case the table denoted pinna plane X
mm – 1 contains the points for the outer edge of the plane, whereas the tables denoted pinna plane X
mm – 2 and pinna plane X mm – 3 contains the points for the non-solid areas within the outer edge
(white areas in Figure 14). The exception is the first table for the -1 mm plane, where there is no solid
area – thus the area within the points is air and is coloured white in Figure 14.
Table B.3 – Tabular values for the cross sectional areas of the pinna simulator
Pinna plane – 1 mm
�̂�𝒆 �̂�𝒆 �̂�𝒆 �̂�𝒆
6.52 1.61 –6.93 –5.27
6.80 0.66 –7.01 –4.28
6.78 –0.34 –6.99 –3.28
6.53 –1.31 –7.20 –2.31
6.10 –2.21 –7.32 –1.31
5.55 –3.04 –7.41 –0.32
4.98 –3.86 –7.49 0.68
4.46 –4.72 –7.48 1.68
3.97 –5.59 –7.29 2.65
3.52 –6.48 –6.90 3.57
3.02 –7.35 –6.18 4.23
2.43 –8.15 –5.23 4.54
1.75 –8.89 –4.24 4.70
0.97 –9.51 –3.24 4.73
0.10 –10.00 –2.24 4.72
–0.84 –10.33 –1.24 4.65
–1.83 –10.44 –0.24 4.64
–2.82 –10.34 0.76 4.61
–3.78 –10.05 1.75 4.56
–4.64 –9.55 2.74 4.41
–5.38 –8.87 3.70 4.13
–6.00 –8.10 4.60 3.69
–6.46 –7.21 5.39 3.08
–6.78 –6.26 6.07 2.36

Rec. ITU-T P.57 (06/2021) 59
Pinna plane 0 mm – 1
�̂�𝒆 �̂�𝒆 �̂�𝒆 �̂�𝒆 �̂�𝒆 �̂�𝒆 �̂�𝒆 �̂�𝒆 �̂�𝒆 �̂�𝒆
–5.31 24.05 26.68 14.15 23.81 –16.97 –9.28 –23.11 –29.07 2.33
–4.32 24.22 27.33 13.38 23.03 –17.59 –10.23 –22.80 –28.93 3.32
–3.33 24.36 27.93 12.59 22.23 –18.19 –11.17 –22.46 –28.72 4.30
–2.34 24.48 28.48 11.75 21.41 –18.76 –12.10 –22.09 –28.49 5.27
–1.35 24.61 29.02 10.91 20.57 –19.30 –13.02 –21.70 –28.19 6.22
–0.36 24.74 29.52 10.05 19.71 –19.81 –13.93 –21.29 –27.85 7.16
0.64 24.81 29.99 9.16 18.83 –20.28 –14.83 –20.85 –27.47 8.09
1.64 24.80 30.41 8.25 17.94 –20.74 –15.72 –20.38 –27.05 9.00
2.64 24.78 30.79 7.33 17.04 –21.19 –16.59 –19.89 –26.60 9.89
3.64 24.77 31.16 6.40 16.14 –21.61 –17.44 –19.37 –26.11 10.76
4.63 24.65 31.44 5.44 15.22 –22.00 –18.28 –18.83 –25.58 11.61
5.62 24.49 31.66 4.47 14.29 –22.37 –19.10 –18.25 –25.04 12.45
6.60 24.33 31.85 3.48 13.35 –22.71 –19.91 –17.67 –24.45 13.25
7.59 24.17 32.00 2.50 12.39 –23.01 –20.73 –17.09 –23.81 14.03
8.58 24.02 32.09 1.50 11.43 –23.30 –21.47 –16.42 –23.12 14.75
9.56 23.85 32.12 0.50 10.47 –23.55 –22.21 –15.75 –22.42 15.46
10.53 23.61 32.11 –0.50 9.49 –23.78 –22.89 –15.02 –21.70 16.16
11.50 23.36 32.06 –1.50 8.52 –23.99 –23.52 –14.25 –20.95 16.82
12.45 23.05 31.95 –2.49 7.53 –24.17 –24.16 –13.48 –20.19 17.47
13.40 22.73 31.79 –3.48 6.54 –24.32 –24.78 –12.69 –19.40 18.07
14.35 22.42 31.59 –4.46 5.55 –24.44 –25.35 –11.87 –18.59 18.66
15.29 22.07 31.35 –5.43 4.56 –24.54 –25.90 –11.04 –17.77 19.23
16.21 21.69 31.07 –6.39 3.56 –24.62 –26.40 –10.17 –16.92 19.76
17.11 21.24 30.74 –7.33 2.56 –24.66 –26.87 –9.29 –16.04 20.24
18.00 20.79 30.37 –8.26 1.56 –24.69 –27.29 –8.38 –15.17 20.73
18.88 20.33 29.95 –9.17 0.56 –24.67 –27.69 –7.46 –14.27 21.17
19.75 19.83 29.50 –10.06 –0.44 –24.63 –28.04 –6.52 –13.36 21.58
20.60 19.30 29.00 –10.93 –1.43 –24.56 –28.36 –5.58 –12.44 21.97
21.43 18.75 28.48 –11.78 –2.43 –24.48 –28.62 –4.61 –11.51 22.34
22.26 18.19 27.90 –12.59 –3.43 –24.37 –28.86 –3.64 –10.57 22.68
23.06 17.58 27.29 –13.39 –4.42 –24.23 –29.03 –2.66 –9.63 23.03
23.83 16.94 26.65 –14.16 –5.40 –24.07 –29.13 –1.66 –8.67 23.31
24.56 16.27 25.98 –14.90 –6.38 –23.88 –29.20 –0.66 –7.71 23.58
25.29 15.59 25.29 –15.62 –7.36 –23.65 –29.20 0.34 –6.73 23.79
25.99 14.87 24.56 –16.30 –8.32 –23.39 –29.17 1.33 –5.75 23.97

60 Rec. ITU-T P.57 (06/2021)
Pinna plane 0 mm – 2 Pinna plane 0 mm – 3
�̂�𝒆 �̂�𝒆 �̂�𝒆 �̂�𝒆 �̂�𝒆 �̂�𝒆
4.69 –6.07 –7.34 2.40 11.47 –9.80
4.21 –6.94 –6.91 3.30 10.80 –10.54
3.68 –7.79 –6.19 3.98 9.97 –11.09
3.07 –8.59 –5.22 4.20 9.02 –11.36
2.41 –9.34 –4.23 4.37 8.61 –10.62
1.69 –10.03 –3.24 4.43 9.07 –9.73
0.90 –10.64 –2.24 4.42 9.74 –9.00
0.03 –11.12 –1.24 4.36 10.55 –8.41
–0.94 –11.36 –0.24 4.33 11.44 –7.97
–1.94 –11.44 0.76 4.29 12.12 –8.37
–2.93 –11.37 1.76 4.24 11.78 –9.31
–3.90 –11.13 2.75 4.10
–4.79 –10.69 3.70 3.81
–5.53 –10.02 4.59 3.36
–6.15 –9.23 5.38 2.75
–6.69 –8.39 6.06 2.02
–7.09 –7.48 6.65 1.21
–7.37 –6.52 7.12 0.34
–7.52 –5.53 7.18 –0.66
–7.58 –4.53 6.95 –1.62
–7.53 –3.54 6.60 –2.55
–7.66 –2.55 6.14 –3.44
–7.72 –1.55 5.65 –4.31
–7.72 –0.55 5.17 –5.19
–7.72 0.45 4.70 –6.07
–7.62 1.44

Rec. ITU-T P.57 (06/2021) 61
Pinna plane 1 mm – 1
�̂�𝒆 �̂�𝒆 �̂�𝒆 �̂�𝒆 �̂�𝒆 �̂�𝒆 �̂�𝒆 �̂�𝒆
11.30 17.11 25.43 –11.38 –8.59 –18.93 –23.27 9.42
12.27 16.89 24.87 –12.21 –9.20 –18.13 –22.59 10.16
13.20 16.56 24.22 –12.97 –9.76 –17.31 –21.88 10.86
14.10 16.12 23.53 –13.69 –10.32 –16.48 –21.18 11.57
14.99 15.70 22.82 –14.39 –10.88 –15.65 –20.42 12.23
15.78 15.16 22.04 –15.01 –11.34 –14.76 –19.64 12.85
16.61 14.62 21.18 –15.53 –11.72 –13.84 –18.88 13.50
17.51 14.20 20.30 –16.00 –12.09 –12.91 –18.08 14.10
18.48 13.95 19.41 –16.45 –12.45 –11.97 –17.23 14.63
19.39 13.54 18.52 –16.91 –12.82 –11.04 –16.42 15.21
20.29 13.11 17.62 –17.35 –13.21 –10.12 –15.51 15.61
21.20 12.70 16.72 –17.79 –13.63 –9.22 –14.58 15.99
22.06 12.19 15.83 –18.24 –14.15 –8.37 –13.66 16.37
22.86 11.59 14.93 –18.68 –14.80 –7.60 –12.69 16.60
23.57 10.89 14.03 –19.11 –15.57 –6.98 –11.70 16.75
24.23 10.14 13.12 –19.53 –16.46 –6.53 –10.70 16.79
24.85 9.36 12.21 –19.94 –17.38 –6.14 –9.72 16.98
25.41 8.53 11.30 –20.35 –18.31 –5.76 –8.75 17.17
25.94 7.68 10.38 –20.75 –19.22 –5.35 –7.76 17.35
26.45 6.82 9.45 –21.11 –20.13 –4.95 –6.80 17.62
26.92 5.94 8.51 –21.45 –21.06 –4.60 –5.82 17.80
27.33 5.03 7.55 –21.75 –22.00 –4.26 –4.84 18.00
27.67 4.09 6.59 –22.00 –22.94 –3.91 –3.88 18.29
27.95 3.13 5.61 –22.20 –23.86 –3.51 –2.90 18.44
28.18 2.16 4.62 –22.35 –24.73 –3.02 –1.90 18.50
28.31 1.16 3.62 –22.42 –25.50 –2.39 –0.92 18.68
28.31 0.16 2.62 –22.44 –26.06 –1.57 0.07 18.81
28.27 –0.83 1.62 –22.42 –26.44 –0.65 1.07 18.79
28.19 –1.83 0.62 –22.34 –26.60 0.34 2.07 18.72
28.05 –2.82 –0.37 –22.21 –26.65 1.34 3.07 18.71
27.88 –3.81 –1.35 –22.05 –26.62 2.34 4.06 18.78
27.68 –4.79 –2.33 –21.82 –26.50 3.33 5.06 18.76
27.46 –5.76 –3.30 –21.57 –26.29 4.31 6.04 18.56
27.22 –6.73 –4.26 –21.31 –25.98 5.26 7.00 18.30
26.95 –7.69 –5.21 –20.99 –25.58 6.17 7.97 18.05
26.65 –8.65 –6.13 –20.60 –25.08 7.04 8.95 17.84
26.30 –9.58 –7.02 –20.14 –24.52 7.87 9.89 17.52
25.90 –10.50 –7.86 –19.60 –23.91 8.66 10.83 17.18

62 Rec. ITU-T P.57 (06/2021)
Pinna plane 1 mm – 2 Pinna plane 1 mm – 3
�̂�𝒆 �̂�𝒆 �̂�𝒆 �̂�𝒆 �̂�𝒆 �̂�𝒆
–7.80 0.73 5.13 –6.89 12.01 –10.34
–7.51 1.69 4.57 –7.72 11.36 –11.10
–7.08 2.59 4.00 –8.54 10.62 –11.76
–6.43 3.34 3.37 –9.32 9.83 –12.39
–5.53 3.71 2.73 –10.08 9.00 –12.94
–4.56 3.97 2.01 –10.77 8.05 –13.20
–3.57 4.11 1.23 –11.40 7.10 –12.94
–2.58 4.13 0.37 –11.90 6.59 –12.12
–1.58 4.11 –0.58 –12.20 6.72 –11.13
–0.58 4.04 –1.57 –12.35 7.15 –10.24
0.42 4.01 –2.57 –12.35 7.80 –9.49
1.42 3.96 –3.56 –12.23 8.53 –8.80
2.41 3.84 –4.51 –11.94 9.30 –8.16
3.37 3.58 –5.37 –11.44 10.11 –7.58
4.28 3.16 –6.08 –10.73 10.96 –7.06
5.09 2.58 –6.63 –9.90 11.86 –6.61
5.82 1.90 –7.11 –9.03 12.81 –6.31
6.52 1.18 –7.48 –8.10 13.79 –6.33
7.19 0.44 –7.74 –7.13 14.11 –7.15
7.53 –0.49 –7.91 –6.15 13.68 –8.05
7.60 –1.49 –8.00 –5.15 13.15 –8.90
7.38 –2.46 –8.00 –4.15 12.53 –9.68
7.10 –3.42 –8.03 –3.15
6.69 –4.33 –8.05 –2.16
6.21 –5.21 –7.99 –1.16
5.68 –6.05 –7.93 –0.16

Rec. ITU-T P.57 (06/2021) 63
Pinna plane 2 mm – 1
�̂�𝒆 �̂�𝒆 �̂�𝒆 �̂�𝒆 �̂�𝒆 �̂�𝒆 �̂�𝒆 �̂�𝒆
–12.73 –9.98 16.71 –17.08 18.01 9.97 –17.36 11.00
–12.41 –10.92 17.61 –16.63 17.05 10.24 –18.24 10.53
–12.13 –11.88 18.50 –16.19 16.08 10.50 –19.14 10.09
–11.83 –12.84 19.40 –15.75 15.11 10.75 –20.04 9.66
–11.51 –13.79 20.30 –15.32 14.16 11.06 –20.94 9.23
–11.13 –14.71 21.19 –14.87 13.23 11.43 –21.85 8.80
–10.67 –15.60 22.05 –14.35 12.34 11.82 –22.71 8.29
–10.14 –16.44 22.84 –13.74 11.44 12.25 –23.53 7.72
–9.56 –17.26 23.58 –13.07 10.50 12.60 –24.26 7.04
–8.93 –18.04 24.29 –12.36 9.58 12.83 –24.89 6.26
–8.26 –18.78 24.93 –11.59 8.66 13.21 –25.45 5.44
–7.51 –19.44 25.47 –10.75 7.72 13.56 –25.86 4.53
–6.65 –19.95 25.93 –9.86 6.76 13.82 –26.15 3.57
–5.79 –20.46 26.33 –8.95 5.82 14.16 –26.30 2.58
–4.89 –20.91 26.70 –8.02 4.86 14.45 –26.26 1.58
–3.98 –21.30 27.01 –7.07 3.87 14.56 –26.06 0.61
–3.03 –21.63 27.28 –6.11 2.87 14.55 –25.76 –0.35
–2.07 –21.91 27.49 –5.13 1.88 14.63 –25.33 –1.25
–1.10 –22.15 27.63 –4.14 0.89 14.78 –24.79 –2.09
–0.12 –22.33 27.71 –3.14 –0.11 14.82 –24.10 –2.81
0.87 –22.44 27.73 –2.14 –1.10 14.72 –23.31 –3.42
1.87 –22.50 27.72 –1.14 –2.10 14.71 –22.45 –3.93
2.87 –22.49 27.69 –0.14 –3.10 14.67 –21.54 –4.35
3.87 –22.44 27.58 0.85 –4.07 14.48 –20.61 –4.71
4.86 –22.31 27.37 1.83 –5.06 14.35 –19.67 –5.04
5.84 –22.11 27.04 2.77 –6.05 14.24 –18.72 –5.36
6.80 –21.83 26.66 3.70 –7.04 14.05 –17.76 –5.64
7.74 –21.48 26.17 4.56 –8.03 13.95 –16.80 –5.92
8.66 –21.11 25.59 5.38 –9.01 13.78 –15.86 –6.25
9.58 –20.70 24.92 6.12 –10.00 13.76 –14.98 –6.73
10.47 –20.25 24.19 6.80 –11.00 13.72 –14.21 –7.36
11.36 –19.79 23.39 7.41 –11.99 13.56 –13.56 –8.12
12.25 –19.34 22.56 7.96 –12.93 13.23 –13.10 –9.01
13.14 –18.88 21.71 8.49 –13.87 12.90 –12.74 –9.94
14.03 –18.42 20.83 8.96 –14.78 12.51
14.92 –17.97 19.91 9.35 –15.63 12.00
15.82 –17.52 18.97 9.68 –16.50 11.52

64 Rec. ITU-T P.57 (06/2021)
Pinna plane 2 mm – 2
�̂�𝒆 �̂�𝒆 �̂�𝒆 �̂�𝒆
6.14 –6.89 –4.65 –13.00
5.63 –7.75 –5.54 –12.55
5.32 –8.70 –6.30 –11.91
5.00 –9.64 –6.90 –11.11
5.73 –9.47 –7.36 –10.22
6.54 –8.89 –7.73 –9.30
7.42 –8.41 –7.98 –8.33
8.28 –7.90 –8.16 –7.35
9.15 –7.41 –8.29 –6.35
10.05 –6.97 –8.36 –5.36
10.96 –6.57 –8.37 –4.36
11.89 –6.19 –8.38 –3.36
12.83 –5.85 –8.32 –2.36
13.80 –5.63 –8.22 –1.36
14.80 –5.68 –8.09 –0.37
15.22 –6.40 –7.87 0.60
14.60 –7.18 –7.48 1.52
14.00 –7.97 –6.94 2.36
13.44 –8.81 –6.21 3.03
12.87 –9.63 –5.29 3.39
12.27 –10.42 –4.33 3.67
11.61 –11.18 –3.34 3.82
10.93 –11.91 –2.34 3.84
10.20 –12.60 –1.34 3.80
9.44 –13.25 –0.34 3.72
8.61 –13.80 0.65 3.67
7.72 –14.26 1.65 3.58
6.76 –14.50 2.63 3.40
5.76 –14.47 3.57 3.06
4.84 –14.10 4.46 2.61
4.21 –13.35 5.28 2.03
4.01 –12.38 6.08 1.43
3.86 –11.41 6.87 0.82
2.94 –11.64 7.51 0.06
2.08 –12.14 7.93 –0.84
1.19 –12.59 8.09 –1.83
0.27 –12.99 7.97 –2.82
–0.69 –13.26 7.66 –3.77
–1.69 –13.36 7.30 –4.70
–2.68 –13.33 6.86 –5.60
–3.67 –13.20 6.38 –6.47

Rec. ITU-T P.57 (06/2021) 65
Pinna plane 3 mm – 1
�̂�𝒆 �̂�𝒆 �̂�𝒆 �̂�𝒆 �̂�𝒆 �̂�𝒆 �̂�𝒆 �̂�𝒆
–12.63 –9.81 15.20 –17.56 18.47 6.54 –15.38 8.60
–12.30 –10.75 16.08 –17.10 17.47 6.56 –16.31 8.24
–12.03 –11.72 16.97 –16.65 16.47 6.54 –17.30 8.11
–11.77 –12.68 17.87 –16.21 15.47 6.54 –18.30 8.13
–11.51 –13.65 18.77 –15.78 14.49 6.69 –19.30 8.16
–11.19 –14.59 19.68 –15.36 13.54 7.01 –20.30 8.15
–10.80 –15.51 20.59 –14.94 12.65 7.47 –21.30 8.08
–10.34 –16.40 21.49 –14.50 11.81 8.01 –22.28 7.89
–9.81 –17.25 22.35 –13.99 10.97 8.56 –23.22 7.55
–9.23 –18.06 23.16 –13.41 10.13 9.10 –24.09 7.06
–8.56 –18.81 23.95 –12.79 9.26 9.60 –24.84 6.40
–7.82 –19.48 24.67 –12.10 8.38 10.06 –25.46 5.62
–7.03 –20.08 25.32 –11.34 7.47 10.47 –25.99 4.77
–6.17 –20.61 25.85 –10.50 6.53 10.81 –26.37 3.85
–5.29 –21.07 26.32 –9.61 5.58 11.14 –26.62 2.88
–4.38 –21.48 26.73 –8.70 4.63 11.46 –26.74 1.89
–3.44 –21.84 27.11 –7.78 3.66 11.69 –26.65 0.90
–2.49 –22.13 27.43 –6.83 2.68 11.85 –26.35 –0.06
–1.52 –22.38 27.65 –5.86 1.69 12.03 –25.94 –0.97
–0.54 –22.60 27.79 –4.86 0.71 12.21 –25.42 –1.83
0.44 –22.76 27.84 –3.87 –0.28 12.31 –24.80 –2.60
1.44 –22.85 27.82 –2.87 –1.28 12.34 –24.06 –3.27
2.44 –22.88 27.73 –1.87 –2.28 12.41 –23.23 –3.83
3.44 –22.82 27.59 –0.88 –3.27 12.38 –22.34 –4.29
4.43 –22.69 27.38 0.10 –4.27 12.34 –21.42 –4.68
5.41 –22.51 27.08 1.05 –5.27 12.29 –20.49 –5.04
6.37 –22.23 26.70 1.98 –6.26 12.17 –19.53 –5.33
7.30 –21.87 26.23 2.86 –7.26 12.05 –18.56 –5.56
8.22 –21.47 25.66 3.67 –8.24 11.90 –17.59 –5.79
9.11 –21.02 24.96 4.39 –9.24 11.80 –16.62 –6.06
9.98 –20.52 24.18 5.01 –10.21 11.59 –15.69 –6.43
10.84 –20.02 23.31 5.52 –11.15 11.25 –14.82 –6.91
11.70 –19.51 22.39 5.90 –12.04 10.78 –14.03 –7.53
12.57 –19.00 21.44 6.21 –12.87 10.24 –13.38 –8.28
13.43 –18.50 20.46 6.42 –13.69 9.67 –12.89 –9.15
14.31 –18.02 19.47 6.50 –14.52 9.10

66 Rec. ITU-T P.57 (06/2021)
Pinna plane 3 mm – 2
�̂�𝒆 �̂�𝒆 �̂�𝒆 �̂�𝒆
–0.77 –14.25 8.35 –4.84
–1.77 –14.25 8.63 –5.77
–2.77 –14.17 9.57 –6.01
–3.76 –14.00 10.56 –5.91
–4.72 –13.76 11.54 –5.72
–5.65 –13.40 12.52 –5.53
–6.45 –12.79 13.51 –5.35
–7.05 –11.99 14.50 –5.25
–7.50 –11.10 15.50 –5.29
–7.83 –10.16 16.49 –5.46
–8.07 –9.19 17.48 –5.55
–8.25 –8.21 18.48 –5.65
–8.39 –7.22 19.47 –5.79
–8.46 –6.22 20.44 –6.03
–8.51 –5.22 21.30 –6.52
–8.51 –4.22 21.51 –7.43
–8.48 –3.22 20.80 –8.09
–8.41 –2.22 19.82 –8.24
–8.32 –1.23 18.86 –7.97
–8.15 –0.24 17.99 –7.47
–7.87 0.72 17.13 –6.98
–7.39 1.59 16.18 –6.69
–6.72 2.33 15.20 –6.85
–5.88 2.86 14.35 –7.38
–4.95 3.23 13.71 –8.14
–3.97 3.41 13.18 –8.99
–2.98 3.49 12.67 –9.85
–1.98 3.47 12.11 –10.67
–0.98 3.41 11.48 –11.45
0.01 3.29 10.80 –12.19
1.01 3.19 10.10 –12.90
1.99 3.03 9.35 –13.56
2.96 2.78 8.55 –14.16
3.90 2.43 7.70 –14.69
4.80 2.01 6.81 –15.14
5.72 1.62 5.86 –15.45
6.65 1.23 4.87 –15.56
7.49 0.71 3.88 –15.49
8.19 0.00 2.94 –15.15
8.64 –0.88 2.08 –14.65
8.73 –1.88 1.15 –14.29
8.66 –2.88 0.15 –14.23
8.45 –3.85

Rec. ITU-T P.57 (06/2021) 67
Pinna plane 4 mm – 1
�̂�𝒆 �̂�𝒆 �̂�𝒆 �̂�𝒆 �̂�𝒆 �̂�𝒆 �̂�𝒆 �̂�𝒆
–10.88 9.44 –16.90 –6.72 10.91 –20.15 22.01 4.08
–11.74 8.93 –15.95 –7.02 11.75 –19.61 21.01 4.12
–12.52 8.31 –15.05 –7.45 12.59 –19.08 20.03 3.95
–13.22 7.59 –14.22 –8.00 13.45 –18.56 19.07 3.67
–13.78 6.77 –13.51 –8.71 14.31 –18.05 18.13 3.33
–14.36 5.96 –12.96 –9.54 15.19 –17.58 17.22 2.92
–15.16 5.36 –12.55 –10.45 16.08 –17.13 16.31 2.50
–16.13 5.19 –12.23 –11.40 16.99 –16.70 15.39 2.11
–17.08 5.50 –11.95 –12.36 17.90 –16.30 14.44 1.79
–17.97 5.95 –11.69 –13.32 18.83 –15.93 13.45 1.66
–18.84 6.44 –11.42 –14.28 19.76 –15.57 12.46 1.77
–19.73 6.90 –11.10 –15.23 20.69 –15.20 11.58 2.22
–20.67 7.24 –10.70 –16.15 21.63 –14.84 10.91 2.95
–21.65 7.39 –10.25 –17.04 22.54 –14.44 10.39 3.81
–22.65 7.39 –9.72 –17.89 23.42 –13.97 9.89 4.68
–23.64 7.23 –9.12 –18.69 24.27 –13.43 9.33 5.50
–24.56 6.85 –8.44 –19.42 25.04 –12.80 8.68 6.26
–25.38 6.28 –7.69 –20.08 25.75 –12.09 7.97 6.97
–26.08 5.57 –6.89 –20.68 26.36 –11.30 7.19 7.59
–26.68 4.77 –6.03 –21.20 26.90 –10.46 6.35 8.13
–27.11 3.87 –5.15 –21.66 27.36 –9.57 5.47 8.62
–27.44 2.92 –4.23 –22.06 27.76 –8.66 4.57 9.05
–27.64 1.94 –3.29 –22.39 28.08 –7.71 3.65 9.44
–27.63 0.95 –2.33 –22.68 28.32 –6.74 2.73 9.82
–27.38 –0.02 –1.36 –22.91 28.48 –5.75 1.77 10.10
–26.97 –0.93 –0.38 –23.11 28.53 –4.76 0.79 10.33
–26.47 –1.79 0.61 –23.25 28.45 –3.76 –0.18 10.55
–25.84 –2.57 1.61 –23.32 28.28 –2.77 –1.17 10.71
–25.11 –3.25 2.61 –23.30 28.05 –1.80 –2.16 10.84
–24.31 –3.85 3.60 –23.22 27.74 –0.85 –3.16 10.91
–23.47 –4.40 4.59 –23.06 27.33 0.06 –4.16 10.94
–22.59 –4.86 5.56 –22.81 26.84 0.93 –5.16 10.93
–21.68 –5.28 6.51 –22.50 26.26 1.75 –6.15 10.84
–20.76 –5.67 7.44 –22.13 25.59 2.48 –7.14 10.70
–19.82 –6.01 8.34 –21.71 24.81 3.11 –8.12 10.50
–18.85 –6.27 9.22 –21.22 23.94 3.59 –9.07 10.20
–17.88 –6.49 10.07 –20.70 22.99 3.90 –10.00 9.83

68 Rec. ITU-T P.57 (06/2021)
Pinna plane 4 mm – 2
�̂�𝒆 �̂�𝒆 �̂�𝒆 �̂�𝒆
14.70 –7.30 –6.21 2.56
13.84 –7.79 –5.24 2.81
13.18 –8.54 –4.25 2.89
12.69 –9.41 –3.25 2.91
12.22 –10.29 –2.25 2.90
11.69 –11.14 –1.25 2.84
11.06 –11.91 –0.25 2.75
10.39 –12.65 0.74 2.66
9.66 –13.34 1.73 2.52
8.90 –13.98 2.71 2.32
8.09 –14.58 3.68 2.07
7.26 –15.13 4.65 1.83
6.41 –15.65 5.64 1.68
5.50 –16.07 6.63 1.60
4.55 –16.37 7.61 1.38
3.56 –16.53 8.52 0.97
2.57 –16.51 9.23 0.28
1.60 –16.26 9.61 –0.63
0.67 –15.88 9.90 –1.59
–0.26 –15.53 10.15 –2.56
–1.23 –15.29 10.51 –3.48
–2.22 –15.13 11.30 –4.08
–3.20 –14.97 12.24 –4.41
–4.18 –14.75 13.22 –4.60
–5.12 –14.42 14.21 –4.76
–6.01 –13.97 15.20 –4.92
–6.75 –13.31 16.18 –5.08
–7.24 –12.44 17.17 –5.21
–7.62 –11.52 18.17 –5.27
–7.89 –10.56 19.17 –5.32
–8.07 –9.57 20.17 –5.42
–8.21 –8.58 21.13 –5.66
–8.32 –7.59 22.03 –6.09
–8.38 –6.59 22.67 –6.84
–8.42 –5.59 22.67 –7.81
–8.44 –4.59 21.97 –8.51
–8.44 –3.59 21.09 –8.98
–8.43 –2.59 20.11 –9.15
–8.40 –1.59 19.13 –8.99
–8.29 –0.60 18.21 –8.61
–8.07 0.38 17.38 –8.05
–7.71 1.30 16.55 –7.50
–7.07 2.07 15.60 –7.20

Rec. ITU-T P.57 (06/2021) 69
Pinna plane 5 mm
�̂�𝒆 �̂�𝒆 �̂�𝒆 �̂�𝒆 �̂�𝒆 �̂�𝒆 �̂�𝒆 �̂�𝒆 �̂�𝒆 �̂�𝒆
–13.41 –9.81 22.43 –15.75 22.98 –6.37 –8.15 –6.97 –9.83 8.89
–12.87 –10.65 23.39 –15.47 23.55 –7.18 –8.20 –5.97 –10.72 8.44
–12.49 –11.57 24.30 –15.07 23.49 –8.14 –8.26 –4.98 –11.52 7.84
–12.17 –12.52 25.17 –14.57 22.80 –8.85 –8.31 –3.98 –12.20 7.11
–11.90 –13.48 25.98 –13.98 21.92 –9.32 –8.36 –2.98 –12.75 6.28
–11.62 –14.44 26.72 –13.31 20.98 –9.63 –8.40 –1.98 –13.27 5.42
–11.31 –15.40 27.39 –12.57 19.99 –9.75 –8.41 –0.98 –13.83 4.60
–10.94 –16.33 28.00 –11.78 19.00 –9.59 –8.36 0.02 –14.58 3.94
–10.51 –17.23 28.50 –10.91 18.06 –9.25 –8.23 1.01 –15.52 3.62
–10.01 –18.09 28.91 –10.00 17.19 –8.77 –7.83 1.92 –16.50 3.75
–9.44 –18.91 29.22 –9.05 16.34 –8.24 –7.08 2.55 –17.43 4.12
–8.79 –19.68 29.45 –8.08 15.42 –7.84 –6.10 2.72 –18.31 4.58
–8.08 –20.38 29.58 –7.09 14.43 –7.80 –5.10 2.65 –19.17 5.10
–7.30 –21.00 29.62 –6.09 13.53 –8.20 –4.11 2.50 –20.03 5.61
–6.46 –21.54 29.56 –5.09 12.84 –8.92 –3.11 2.49 –20.91 6.08
–5.58 –22.01 29.38 –4.11 12.27 –9.74 –2.12 2.42 –21.84 6.44
–4.67 –22.43 29.06 –3.16 11.80 –10.62 –1.12 2.34 –22.82 6.66
–3.73 –22.78 28.69 –2.23 11.29 –11.48 –0.13 2.22 –23.82 6.69
–2.78 –23.07 28.26 –1.33 10.68 –12.28 0.87 2.10 –24.79 6.47
–1.81 –23.32 27.74 –0.48 10.00 –13.01 1.86 1.98 –25.69 6.03
–0.83 –23.50 27.11 0.30 9.26 –13.67 2.85 1.85 –26.50 5.45
0.17 –23.63 26.41 1.01 8.47 –14.29 3.85 1.81 –27.17 4.71
1.16 –23.68 25.60 1.60 7.67 –14.88 4.85 1.88 –27.69 3.86
2.16 –23.67 24.70 2.03 6.85 –15.46 5.83 2.07 –28.08 2.94
3.16 –23.58 23.74 2.30 6.02 –16.02 6.73 2.47 –28.31 1.97
4.14 –23.41 22.75 2.43 5.13 –16.48 7.30 3.25 –28.38 0.97
5.11 –23.17 21.75 2.42 4.21 –16.88 7.17 4.23 –28.25 –0.02
6.07 –22.88 20.77 2.24 3.26 –17.18 6.71 5.11 –27.96 –0.97
7.01 –22.52 19.81 1.98 2.28 –17.36 6.08 5.89 –27.51 –1.87
7.92 –22.11 18.86 1.65 1.29 –17.29 5.34 6.56 –26.96 –2.70
8.81 –21.65 17.97 1.21 0.32 –17.07 4.52 7.13 –26.31 –3.46
9.67 –21.15 17.12 0.68 –0.62 –16.71 3.66 7.65 –25.60 –4.16
10.52 –20.62 16.30 0.10 –1.56 –16.37 2.77 8.10 –24.82 –4.78
11.36 –20.08 15.56 –0.56 –2.51 –16.08 1.84 8.47 –24.00 –5.35
12.21 –19.55 14.93 –1.34 –3.48 –15.82 0.90 8.82 –23.12 –5.83
13.06 –19.03 14.63 –2.28 –4.44 –15.53 –0.05 9.11 –22.22 –6.26
13.93 –18.54 14.86 –3.25 –5.34 –15.12 –1.02 9.37 –21.31 –6.67
14.82 –18.08 15.45 –4.04 –6.15 –14.53 –1.99 9.59 –20.39 –7.06
15.71 –17.63 16.29 –4.57 –6.79 –13.77 –2.98 9.77 –19.45 –7.42
16.62 –17.22 17.24 –4.89 –7.24 –12.88 –3.97 9.88 –18.49 –7.69
17.57 –16.90 18.22 –5.11 –7.54 –11.93 –4.97 9.92 –17.51 –7.91
18.53 –16.60 19.21 –5.24 –7.76 –10.95 –5.97 9.87 –16.53 –8.10
19.49 –16.33 20.20 –5.36 –7.91 –9.96 –6.96 9.74 –15.56 –8.34
20.47 –16.13 21.18 –5.55 –8.02 –8.97 –7.94 9.54 –14.64 –8.72
21.45 –15.96 22.14 –5.84 –8.10 –7.97 –8.89 9.25 –13.84 –9.31

70 Rec. ITU-T P.57 (06/2021)
Pinna plane 6 mm
�̂�𝒆 �̂�𝒆 �̂�𝒆 �̂�𝒆 �̂�𝒆 �̂�𝒆 �̂�𝒆 �̂�𝒆 �̂�𝒆 �̂�𝒆
–14.54 –10.11 22.04 –17.53 24.09 –7.02 –7.85 –7.26 –11.63 5.60
–13.78 –10.75 23.03 –17.40 24.40 –7.95 –7.91 –6.26 –12.23 4.81
–13.19 –11.56 24.01 –17.21 23.94 –8.81 –8.00 –5.26 –12.87 4.04
–12.76 –12.46 24.96 –16.89 23.12 –9.37 –8.11 –4.27 –13.56 3.32
–12.42 –13.40 25.86 –16.47 22.21 –9.78 –8.22 –3.27 –14.37 2.73
–12.08 –14.34 26.71 –15.94 21.25 –10.08 –8.33 –2.28 –15.32 2.42
–11.75 –15.28 27.48 –15.30 20.27 –10.24 –8.45 –1.29 –16.31 2.46
–11.41 –16.22 28.18 –14.60 19.27 –10.22 –8.58 –0.30 –17.27 2.75
–11.01 –17.14 28.82 –13.83 18.29 –10.03 –8.73 0.69 –18.18 3.15
–10.54 –18.02 29.36 –12.98 17.35 –9.69 –8.79 1.69 –19.07 3.61
–10.01 –18.87 29.81 –12.09 16.46 –9.24 –8.55 2.65 –19.95 4.09
–9.40 –19.67 30.18 –11.16 15.56 –8.81 –7.83 3.31 –20.85 4.53
–8.74 –20.41 30.42 –10.19 14.58 –8.62 –6.85 3.35 –21.76 4.93
–8.02 –21.10 30.60 –9.21 13.60 –8.79 –5.90 3.03 –22.68 5.34
–7.21 –21.69 30.71 –8.21 12.76 –9.31 –4.99 2.63 –23.63 5.63
–6.35 –22.20 30.71 –7.22 12.06 –10.03 –4.02 2.37 –24.63 5.66
–5.46 –22.65 30.66 –6.22 11.51 –10.86 –3.03 2.24 –25.61 5.48
–4.53 –23.03 30.46 –5.24 10.99 –11.72 –2.04 2.10 –26.53 5.09
–3.59 –23.36 30.15 –4.29 10.40 –12.53 –1.05 2.00 –27.31 4.48
–2.63 –23.63 29.76 –3.37 9.71 –13.24 –0.05 1.95 –27.92 3.69
–1.65 –23.83 29.31 –2.48 8.94 –13.89 0.95 1.90 –28.35 2.79
–0.66 –23.96 28.78 –1.63 8.15 –14.49 1.95 1.86 –28.60 1.83
0.34 –24.01 28.17 –0.84 7.33 –15.07 2.94 1.93 –28.71 0.83
1.34 –24.00 27.46 –0.13 6.50 –15.62 3.90 2.20 –28.62 –0.16
2.34 –23.91 26.67 0.47 5.64 –16.14 4.75 2.73 –28.40 –1.13
3.32 –23.74 25.77 0.92 4.78 –16.64 5.07 3.64 –28.06 –2.07
4.30 –23.51 24.82 1.22 3.90 –17.12 4.77 4.59 –27.62 –2.97
5.26 –23.23 23.83 1.35 2.98 –17.53 4.18 5.39 –27.07 –3.81
6.20 –22.91 22.83 1.36 2.03 –17.81 3.44 6.06 –26.45 –4.59
7.13 –22.55 21.84 1.28 1.04 –17.93 2.62 6.64 –25.77 –5.33
8.04 –22.13 20.86 1.04 0.04 –17.84 1.76 7.14 –25.05 –6.02
8.93 –21.68 19.92 0.72 –0.93 –17.61 0.86 7.58 –24.28 –6.65
9.81 –21.20 19.02 0.29 –1.88 –17.29 –0.06 7.97 –23.44 –7.20
10.68 –20.70 18.20 –0.28 –2.82 –16.94 –1.00 8.30 –22.55 –7.64
11.55 –20.21 17.47 –0.97 –3.74 –16.57 –1.96 8.58 –21.63 –8.04
12.43 –19.73 16.92 –1.80 –4.66 –16.16 –2.93 8.82 –20.70 –8.42
13.32 –19.29 16.72 –2.77 –5.52 –15.66 –3.92 8.99 –19.76 –8.76
14.24 –18.88 17.02 –3.71 –6.25 –14.98 –4.91 9.08 –18.82 –9.08
15.16 –18.50 17.72 –4.42 –6.78 –14.14 –5.91 9.07 –17.85 –9.35
16.10 –18.16 18.61 –4.87 –7.13 –13.20 –6.91 8.96 –16.87 –9.53
17.06 –17.88 19.56 –5.19 –7.34 –12.22 –7.88 8.72 –15.89 –9.70
18.04 –17.70 20.53 –5.43 –7.50 –11.24 –8.81 8.36 –14.91 –9.91
19.04 –17.60 21.50 –5.66 –7.63 –10.25 –9.67 7.85
20.04 –17.58 22.46 –5.92 –7.72 –9.25 –10.43 7.20
21.04 –17.57 23.36 –6.36 –7.79 –8.25 –11.06 6.43

Rec. ITU-T P.57 (06/2021) 71
Pinna plane 7 mm – 1 Pinna plane 7 mm – 2
�̂�𝒆 �̂�𝒆 �̂�𝒆 �̂�𝒆 �̂�𝒆 �̂�𝒆 �̂�𝒆 �̂�𝒆 �̂�𝒆 �̂�𝒆
–27.32 3.84 2.43 –24.08 27.27 –0.22 2.03 –17.92 –7.73 5.32
–27.97 3.08 3.40 –23.85 26.36 0.20 1.06 –18.19 –6.98 4.66
–28.41 2.19 4.36 –23.57 25.39 0.44 0.07 –18.23 –6.21 4.02
–28.63 1.21 5.31 –23.27 24.40 0.57 –0.93 –18.13 –5.43 3.40
–28.71 0.22 6.26 –22.94 23.40 0.54 –1.90 –17.90 –4.57 2.89
–28.61 –0.77 7.19 –22.56 22.41 0.40 –2.85 –17.58 –3.63 2.55
–28.40 –1.75 8.10 –22.17 21.44 0.16 –3.76 –17.16 –2.66 2.30
–28.07 –2.70 9.02 –21.76 20.51 –0.20 –4.63 –16.69 –1.68 2.13
–27.66 –3.61 9.91 –21.32 19.66 –0.72 –5.45 –16.11 –0.68 2.18
–27.20 –4.49 10.82 –20.89 18.96 –1.43 –6.15 –15.40 0.31 2.29
–26.68 –5.34 11.73 –20.47 18.46 –2.29 –6.63 –14.53 1.31 2.35
–26.10 –6.16 12.65 –20.10 18.38 –3.27 –6.91 –13.58 2.23 2.69
–25.47 –6.94 13.60 –19.78 18.83 –4.15 –7.06 –12.59 2.71 3.54
–24.79 –7.67 14.56 –19.51 19.58 –4.81 –7.17 –11.59 2.42 4.48
–24.05 –8.35 15.54 –19.30 20.46 –5.28 –7.27 –10.60 1.79 5.25
–23.26 –8.95 16.53 –19.17 21.39 –5.65 –7.34 –9.60 1.04 5.91
–22.40 –9.47 17.53 –19.16 22.35 –5.95 –7.40 –8.60 0.22 6.48
–21.52 –9.93 18.53 –19.25 23.29 –6.28 –7.47 –7.60 –0.66 6.96
–20.61 –10.36 19.51 –19.41 24.18 –6.73 –7.56 –6.61 –1.57 7.36
–19.71 –10.78 20.50 –19.59 24.89 –7.42 –7.66 –5.61 –2.51 7.71
–18.77 –11.14 21.49 –19.73 25.20 –8.35 –7.82 –4.63 –3.48 7.96
–17.81 –11.42 22.48 –19.82 24.73 –9.20 –8.00 –3.64 –4.47 8.07
–16.84 –11.66 23.48 –19.78 23.87 –9.69 –8.17 –2.66 –5.47 8.06
–15.87 –11.88 24.47 –19.61 22.94 –10.06 –8.35 –1.67 –6.46 7.93
–14.91 –12.17 25.41 –19.30 21.98 –10.36 –8.60 –0.71 –7.38 7.56
–14.11 –12.76 26.31 –18.86 21.01 –10.59 –8.95 0.23 –8.09 6.87
–13.50 –13.54 27.14 –18.31 20.03 –10.77 –9.38 1.13 –8.14 5.90
–13.00 –14.41 27.91 –17.67 19.03 –10.80 –9.91 1.98
–12.53 –15.29 28.62 –16.97 18.04 –10.69 –10.64 2.66
–12.10 –16.19 29.24 –16.18 17.07 –10.44 –11.57 2.97
–11.67 –17.09 29.80 –15.35 16.13 –10.11 –12.53 2.73
–11.19 –17.97 30.30 –14.49 15.18 –9.79 –13.39 2.22
–10.66 –18.82 30.73 –13.58 14.19 –9.63 –14.23 1.68
–10.08 –19.63 31.07 –12.65 13.21 –9.79 –15.16 1.33
–9.44 –20.40 31.35 –11.69 12.33 –10.25 –16.15 1.26
–8.75 –21.13 31.56 –10.71 11.58 –10.91 –17.13 1.43
–8.00 –21.79 31.71 –9.72 10.95 –11.69 –18.08 1.74
–7.18 –22.36 31.75 –8.72 10.34 –12.48 –19.00 2.14
–6.31 –22.84 31.66 –7.72 9.66 –13.21 –19.90 2.57
–5.40 –23.27 31.49 –6.74 8.90 –13.86 –20.81 2.99
–4.47 –23.63 31.25 –5.77 8.09 –14.44 –21.73 3.38
–3.52 –23.93 30.94 –4.82 7.25 –14.98 –22.65 3.77
–2.54 –24.14 30.54 –3.90 6.40 –15.51 –23.58 4.15
–1.55 –24.29 30.04 –3.04 5.54 –16.03 –24.53 4.45
–0.55 –24.35 29.48 –2.21 4.68 –16.53 –25.52 4.57
0.45 –24.33 28.83 –1.45 3.82 –17.04 –26.49 4.37
1.44 –24.24 28.09 –0.79 2.94 –17.51

72 Rec. ITU-T P.57 (06/2021)
Pinna plane 8 mm – 1 Pinna plane 8 mm – 2
�̂�𝒆 �̂�𝒆 �̂�𝒆 �̂�𝒆 �̂�𝒆 �̂�𝒆 �̂�𝒆 �̂�𝒆 �̂�𝒆 �̂�𝒆
–28.23 1.00 5.61 –23.25 26.75 –0.47 –0.65 –18.34 –4.45 6.01
–28.40 0.02 6.56 –22.93 25.78 –0.27 –1.64 –18.22 –4.89 5.21
–28.38 –0.98 7.50 –22.59 24.78 –0.20 –2.61 –17.95 –4.36 4.37
–28.22 –1.96 8.44 –22.25 23.79 –0.30 –3.52 –17.55 –3.52 3.84
–27.96 –2.93 9.38 –21.90 22.81 –0.49 –4.38 –17.05 –2.59 3.47
–27.63 –3.87 10.31 –21.56 21.86 –0.82 –5.19 –16.45 –1.61 3.48
–27.27 –4.80 11.27 –21.25 20.99 –1.30 –5.89 –15.74 –0.83 4.06
–26.82 –5.70 12.23 –20.98 20.29 –2.01 –6.38 –14.88 –1.21 4.94
–26.33 –6.57 13.21 –20.81 19.86 –2.90 –6.65 –13.92 –1.98 5.57
–25.83 –7.43 14.21 –20.72 19.94 –3.88 –6.77 –12.92 –2.91 5.94
–25.28 –8.27 15.21 –20.76 20.47 –4.72 –6.85 –11.93 –3.89 6.11
–24.68 –9.07 16.20 –20.90 21.23 –5.36 –6.91 –10.93
–24.05 –9.85 17.16 –21.15 22.10 –5.85 –6.96 –9.93
–23.37 –10.57 18.11 –21.48 23.02 –6.25 –7.00 –8.93
–22.65 –11.27 19.02 –21.88 23.94 –6.64 –7.07 –7.93
–21.90 –11.93 19.95 –22.25 24.82 –7.11 –7.16 –6.94
–21.12 –12.55 20.91 –22.54 25.53 –7.81 –7.30 –5.95
–20.29 –13.12 21.90 –22.66 25.93 –8.71 –7.46 –4.96
–19.45 –13.67 22.89 –22.61 25.75 –9.67 –7.67 –3.98
–18.57 –14.13 23.87 –22.41 24.92 –10.20 –7.91 –3.01
–17.66 –14.54 24.82 –22.09 23.97 –10.50 –8.15 –2.04
–16.72 –14.89 25.72 –21.65 22.98 –10.69 –8.47 –1.09
–15.79 –15.25 26.56 –21.12 22.01 –10.90 –8.92 –0.21
–14.88 –15.68 27.34 –20.49 21.03 –11.11 –9.52 0.60
–14.04 –16.21 28.08 –19.82 20.05 –11.31 –10.23 1.29
–13.27 –16.85 28.76 –19.08 19.06 –11.44 –11.10 1.77
–12.61 –17.60 29.40 –18.32 18.06 –11.46 –12.09 1.83
–11.99 –18.38 30.00 –17.52 17.06 –11.36 –13.01 1.45
–11.36 –19.16 30.54 –16.68 16.08 –11.17 –13.83 0.88
–10.74 –19.94 31.02 –15.80 15.11 –10.94 –14.68 0.36
–10.07 –20.69 31.43 –14.89 14.12 –10.77 –15.63 0.07
–9.37 –21.40 31.81 –13.96 13.13 –10.80 –16.62 0.03
–8.62 –22.07 32.12 –13.01 12.18 –11.10 –17.60 0.23
–7.82 –22.67 32.35 –12.04 11.33 –11.63 –18.54 0.58
–6.96 –23.17 32.51 –11.05 10.60 –12.31 –19.47 0.95
–6.06 –23.60 32.60 –10.06 9.89 –13.01 –20.39 1.33
–5.13 –23.96 32.59 –9.06 9.12 –13.66 –21.31 1.73
–4.17 –24.26 32.47 –8.07 8.31 –14.23 –22.23 2.13
–3.20 –24.46 32.25 –7.09 7.46 –14.76 –23.15 2.52
–2.20 –24.59 31.95 –6.14 6.59 –15.26 –24.08 2.87
–1.21 –24.65 31.59 –5.21 5.73 –15.76 –25.03 3.17
–0.21 –24.62 31.14 –4.31 4.86 –16.27 –26.02 3.24
0.79 –24.54 30.65 –3.44 4.00 –16.78 –26.95 2.88
1.78 –24.39 30.06 –2.64 3.14 –17.28 –27.67 2.20
2.75 –24.16 29.33 –1.96 2.25 –17.75 –28.14 1.32
3.71 –23.88 28.54 –1.35 1.32 –18.11
4.66 –23.57 27.68 –0.83 0.35 –18.31

Rec. ITU-T P.57 (06/2021) 73
Pinna plane 9 mm
�̂�𝒆 �̂�𝒆 �̂�𝒆 �̂�𝒆 �̂�𝒆 �̂�𝒆 �̂�𝒆 �̂�𝒆
10.65 –12.76 –20.09 –0.22 –2.20 –24.92 33.22 –8.91
9.82 –13.32 –21.02 0.16 –1.20 –24.92 33.03 –7.93
9.00 –13.89 –21.94 0.54 –0.20 –24.86 32.74 –6.97
8.16 –14.43 –22.87 0.92 0.80 –24.76 32.36 –6.05
7.29 –14.92 –23.80 1.29 1.78 –24.59 31.91 –5.15
6.40 –15.38 –24.75 1.59 2.76 –24.36 31.41 –4.29
5.52 –15.85 –25.74 1.66 3.72 –24.10 30.83 –3.47
4.65 –16.34 –26.65 1.26 4.68 –23.81 30.13 –2.77
3.78 –16.84 –27.33 0.54 5.64 –23.52 29.33 –2.17
2.91 –17.34 –27.67 –0.39 6.60 –23.24 28.46 –1.66
2.01 –17.77 –27.78 –1.38 7.56 –22.97 27.55 –1.27
1.07 –18.10 –27.71 –2.38 8.53 –22.72 26.57 –1.06
0.09 –18.29 –27.53 –3.36 9.50 –22.50 25.57 –1.01
–0.91 –18.31 –27.27 –4.33 10.49 –22.33 24.57 –1.08
–1.90 –18.18 –26.94 –5.27 11.48 –22.25 23.60 –1.31
–2.85 –17.88 –26.56 –6.20 12.48 –22.32 22.67 –1.67
–3.74 –17.42 –26.16 –7.11 13.45 –22.57 21.85 –2.23
–4.56 –16.86 –25.72 –8.01 14.38 –22.92 21.27 –3.03
–5.28 –16.16 –25.26 –8.90 15.27 –23.37 21.15 –4.01
–5.86 –15.35 –24.78 –9.77 16.09 –23.95 21.55 –4.91
–6.25 –14.43 –24.26 –10.63 16.90 –24.53 22.20 –5.67
–6.44 –13.45 –23.71 –11.46 17.75 –25.05 23.00 –6.27
–6.51 –12.46 –23.13 –12.28 18.67 –25.45 23.88 –6.73
–6.54 –11.46 –22.51 –13.06 19.64 –25.68 24.77 –7.20
–6.57 –10.46 –21.86 –13.82 20.64 –25.70 25.60 –7.75
–6.60 –9.46 –21.15 –14.53 21.63 –25.58 26.27 –8.49
–6.65 –8.46 –20.43 –15.22 22.59 –25.31 26.73 –9.37
–6.74 –7.46 –19.69 –15.89 23.54 –24.99 26.80 –10.36
–6.88 –6.47 –18.91 –16.51 24.46 –24.61 26.26 –11.17
–7.07 –5.49 –18.08 –17.07 25.35 –24.15 25.31 –11.45
–7.28 –4.51 –17.23 –17.60 26.19 –23.61 24.31 –11.50
–7.53 –3.55 –16.35 –18.09 26.99 –23.01 23.31 –11.52
–7.83 –2.59 –15.47 –18.55 27.73 –22.34 22.31 –11.59
–8.19 –1.66 –14.57 –19.00 28.43 –21.63 21.32 –11.72
–8.69 –0.80 –13.68 –19.44 29.08 –20.86 20.33 –11.90
–9.33 –0.03 –12.82 –19.95 29.69 –20.08 19.35 –12.07
–10.09 0.62 –11.99 –20.51 30.27 –19.26 18.36 –12.19
–11.00 1.02 –11.19 –21.11 30.80 –18.41 17.36 –12.25
–11.99 1.01 –10.40 –21.72 31.31 –17.55 16.36 –12.21
–12.88 0.57 –9.61 –22.34 31.76 –16.66 15.36 –12.13
–13.66 –0.05 –8.80 –22.92 32.16 –15.74 14.37 –12.00
–14.45 –0.66 –7.94 –23.44 32.52 –14.81 13.38 –11.91
–15.32 –1.14 –7.04 –23.87 32.83 –13.86 12.39 –12.00
–16.30 –1.36 –6.12 –24.26 33.08 –12.89 11.44 –12.31
–17.29 –1.28 –5.16 –24.54 33.20 –11.90
–18.25 –0.99 –4.19 –24.76 33.29 –10.90
–19.17 –0.61 –3.19 –24.87 33.31 –9.90

74 Rec. ITU-T P.57 (06/2021)
Pinna plane 10 mm
�̂�𝒆 �̂�𝒆 �̂�𝒆 �̂�𝒆 �̂�𝒆 �̂�𝒆 �̂�𝒆 �̂�𝒆
–3.92 –25.29 33.70 –13.18 11.64 –13.25 –19.99 –1.85
–2.92 –25.34 33.80 –12.18 10.68 –13.52 –20.91 –1.47
–1.92 –25.33 33.83 –11.18 9.76 –13.92 –21.84 –1.11
–0.92 –25.29 33.81 –10.18 8.87 –14.38 –22.78 –0.76
0.08 –25.21 33.71 –9.19 7.99 –14.84 –23.73 –0.44
1.07 –25.09 33.50 –8.21 7.09 –15.29 –24.71 –0.26
2.06 –24.93 33.19 –7.26 6.19 –15.72 –25.67 –0.47
3.04 –24.74 32.78 –6.35 5.29 –16.16 –26.40 –1.14
4.02 –24.53 32.30 –5.48 4.39 –16.60 –26.77 –2.06
4.98 –24.28 31.73 –4.65 3.50 –17.05 –26.84 –3.05
5.96 –24.07 31.09 –3.89 2.60 –17.49 –26.76 –4.05
6.94 –23.87 30.35 –3.22 1.68 –17.87 –26.55 –5.03
7.94 –23.76 29.51 –2.67 0.72 –18.14 –26.28 –5.99
8.94 –23.73 28.60 –2.25 –0.28 –18.25 –25.97 –6.94
9.92 –23.87 27.65 –1.96 –1.27 –18.20 –25.61 –7.87
10.85 –24.25 26.66 –1.85 –2.25 –17.99 –25.25 –8.80
11.66 –24.82 25.66 –1.90 –3.16 –17.57 –24.83 –9.72
12.40 –25.50 24.67 –2.08 –4.01 –17.05 –24.41 –10.62
13.12 –26.19 23.74 –2.43 –4.76 –16.39 –23.97 –11.52
13.89 –26.83 22.92 –2.99 –5.34 –15.58 –23.51 –12.40
14.68 –27.43 22.40 –3.83 –5.75 –14.67 –23.00 –13.27
15.57 –27.90 22.39 –4.82 –6.02 –13.71 –22.47 –14.11
16.53 –28.18 22.79 –5.72 –6.14 –12.71 –21.91 –14.94
17.52 –28.30 23.43 –6.49 –6.19 –11.71 –21.31 –15.74
18.52 –28.33 24.21 –7.12 –6.23 –10.72 –20.67 –16.51
19.51 –28.24 25.03 –7.69 –6.27 –9.72 –20.01 –17.26
20.49 –28.04 25.84 –8.27 –6.32 –8.72 –19.31 –17.97
21.45 –27.76 26.58 –8.94 –6.42 –7.72 –18.56 –18.64
22.40 –27.43 27.16 –9.75 –6.57 –6.73 –17.80 –19.28
23.32 –27.06 27.52 –10.68 –6.78 –5.76 –16.99 –19.87
24.23 –26.65 27.60 –11.67 –7.05 –4.79 –16.14 –20.41
25.11 –26.16 27.28 –12.61 –7.33 –3.83 –15.28 –20.91
25.95 –25.62 26.53 –13.24 –7.64 –2.88 –14.39 –21.37
26.75 –25.02 25.55 –13.29 –8.09 –1.99 –13.49 –21.81
27.50 –24.36 24.58 –13.04 –8.65 –1.17 –12.59 –22.24
28.21 –23.66 23.60 –12.83 –9.36 –0.46 –11.69 –22.68
28.88 –22.92 22.61 –12.74 –10.21 0.05 –10.79 –23.11
29.52 –22.15 21.61 –12.76 –11.18 0.25 –9.89 –23.54
30.12 –21.35 20.61 –12.84 –12.14 0.00 –8.98 –23.95
30.69 –20.53 19.62 –12.95 –12.95 –0.58 –8.05 –24.33
31.22 –19.68 18.62 –13.05 –13.65 –1.29 –7.11 –24.67
31.72 –18.81 17.63 –13.12 –14.37 –1.98 –6.15 –24.94
32.17 –17.92 16.63 –13.16 –15.20 –2.53 –5.17 –25.14
32.58 –17.01 15.63 –13.18 –16.15 –2.83 –4.18 –25.27
32.93 –16.07 14.63 –13.17 –17.15 –2.80
33.25 –15.12 13.63 –13.14 –18.12 –2.56
33.52 –14.16 12.63 –13.14 –19.06 –2.22

Rec. ITU-T P.57 (06/2021) 75
Pinna plane 11 mm
�̂�𝒆 �̂�𝒆 �̂�𝒆 �̂�𝒆 �̂�𝒆 �̂�𝒆 �̂�𝒆 �̂�𝒆
–22.96 –13.40 16.27 –30.48 23.36 –5.12 –4.75 –15.92
–22.54 –14.31 17.26 –30.40 23.54 –6.09 –5.26 –15.05
–22.06 –15.19 18.25 –30.27 24.02 –6.96 –5.60 –14.11
–21.57 –16.06 19.24 –30.08 24.65 –7.74 –5.82 –13.14
–21.05 –16.91 20.21 –29.84 25.36 –8.44 –5.93 –12.15
–20.48 –17.73 21.15 –29.52 26.11 –9.10 –6.01 –11.15
–19.87 –18.53 22.07 –29.13 26.83 –9.80 –6.09 –10.15
–19.25 –19.31 22.98 –28.71 27.46 –10.58 –6.16 –9.16
–18.57 –20.05 23.88 –28.28 27.88 –11.48 –6.27 –8.16
–17.86 –20.75 24.76 –27.80 28.06 –12.46 –6.45 –7.18
–17.10 –21.40 25.61 –27.28 28.01 –13.46 –6.63 –6.19
–16.29 –21.98 26.43 –26.70 27.69 –14.40 –6.93 –5.24
–15.44 –22.51 27.22 –26.09 27.19 –15.26 –7.28 –4.31
–14.56 –22.99 27.95 –25.41 26.50 –15.98 –7.62 –3.36
–13.66 –23.43 28.64 –24.69 25.55 –16.15 –8.11 –2.49
–12.75 –23.84 29.29 –23.92 24.66 –15.71 –8.74 –1.72
–11.82 –24.21 29.91 –23.14 23.78 –15.22 –9.51 –1.08
–10.89 –24.56 30.51 –22.34 22.84 –14.88 –10.44 –0.74
–9.94 –24.88 31.08 –21.52 21.87 –14.67 –11.43 –0.81
–8.98 –25.17 31.61 –20.67 20.87 –14.54 –12.27 –1.32
–8.02 –25.45 32.10 –19.80 19.88 –14.45 –12.95 –2.05
–7.05 –25.66 32.55 –18.91 18.88 –14.41 –13.55 –2.85
–6.06 –25.83 32.95 –17.99 17.88 –14.37 –14.19 –3.62
–5.07 –25.95 33.31 –17.06 16.88 –14.36 –14.94 –4.28
–4.07 –26.01 33.62 –16.11 15.88 –14.35 –15.86 –4.65
–3.07 –26.04 33.89 –15.14 14.88 –14.37 –16.86 –4.63
–2.07 –26.03 34.07 –14.16 13.88 –14.40 –17.83 –4.40
–1.07 –25.99 34.19 –13.17 12.88 –14.40 –18.78 –4.10
–0.07 –25.92 34.22 –12.17 11.88 –14.42 –19.73 –3.78
0.92 –25.83 34.20 –11.17 10.89 –14.50 –20.67 –3.43
1.92 –25.72 34.12 –10.17 9.91 –14.70 –21.61 –3.09
2.91 –25.60 33.94 –9.19 8.95 –15.00 –22.56 –2.77
3.90 –25.48 33.68 –8.23 8.03 –15.37 –23.53 –2.57
4.90 –25.42 33.32 –7.29 7.11 –15.76 –24.52 –2.65
5.90 –25.43 32.85 –6.41 6.19 –16.16 –25.25 –3.29
6.88 –25.59 32.32 –5.57 5.26 –16.54 –25.51 –4.25
7.80 –25.99 31.67 –4.81 4.35 –16.94 –25.53 –5.25
8.57 –26.62 30.93 –4.14 3.42 –17.31 –25.41 –6.24
9.27 –27.33 30.09 –3.60 2.48 –17.66 –25.22 –7.22
9.97 –28.05 29.18 –3.18 1.53 –17.97 –24.96 –8.18
10.69 –28.74 28.22 –2.92 0.55 –18.15 –24.66 –9.14
11.49 –29.34 27.22 –2.81 –0.45 –18.17 –24.33 –10.08
12.36 –29.83 26.23 –2.85 –1.44 –18.01 –24.00 –11.02
13.30 –30.18 25.25 –3.07 –2.38 –17.69 –23.62 –11.95
14.27 –30.39 24.34 –3.47 –3.27 –17.24 –23.21 –12.86
15.27 –30.49 23.64 –4.17 –4.08 –16.65

76 Rec. ITU-T P.57 (06/2021)
Pinna plane 12 mm
�̂�𝒆 �̂�𝒆 �̂�𝒆 �̂�𝒆 �̂�𝒆 �̂�𝒆 �̂�𝒆 �̂�𝒆
27.68 –16.13 –6.52 –8.24 –14.11 –24.65 28.48 –25.99
27.29 –17.05 –6.72 –7.26 –13.23 –25.13 29.14 –25.24
26.78 –17.91 –6.96 –6.29 –12.31 –25.53 29.78 –24.48
26.21 –18.73 –7.29 –5.35 –11.37 –25.88 30.39 –23.68
25.55 –19.48 –7.70 –4.44 –10.42 –26.19 30.97 –22.86
24.83 –20.17 –8.17 –3.56 –9.46 –26.47 31.53 –22.03
24.02 –20.76 –8.82 –2.80 –8.49 –26.71 32.04 –21.18
23.07 –21.05 –9.66 –2.26 –7.51 –26.90 32.51 –20.29
22.31 –20.56 –10.63 –2.11 –6.52 –27.06 32.94 –19.39
22.03 –19.60 –11.56 –2.44 –5.53 –27.17 33.33 –18.47
21.62 –18.69 –12.24 –3.17 –4.53 –27.24 33.64 –17.52
20.99 –17.92 –12.80 –4.00 –3.53 –27.25 33.92 –16.56
20.19 –17.31 –13.25 –4.89 –2.53 –27.28 34.15 –15.59
19.31 –16.84 –13.68 –5.79 –1.54 –27.31 34.31 –14.60
18.37 –16.49 –14.27 –6.59 –0.54 –27.32 34.42 –13.61
17.41 –16.25 –15.17 –7.00 0.46 –27.36 34.47 –12.61
16.42 –16.06 –16.16 –6.98 1.46 –27.43 34.40 –11.61
15.43 –15.94 –17.13 –6.77 2.45 –27.60 34.27 –10.62
14.43 –15.87 –18.10 –6.49 3.40 –27.89 34.07 –9.64
13.43 –15.83 –19.06 –6.21 4.31 –28.30 33.78 –8.68
12.43 –15.79 –20.00 –5.90 5.15 –28.84 33.41 –7.76
11.44 –15.76 –20.96 –5.59 5.95 –29.44 32.92 –6.88
10.44 –15.76 –21.92 –5.35 6.74 –30.06 32.33 –6.08
9.44 –15.87 –22.91 –5.37 7.52 –30.68 31.62 –5.38
8.46 –16.05 –23.62 –6.04 8.36 –31.22 30.79 –4.81
7.50 –16.31 –23.87 –7.00 9.26 –31.66 29.90 –4.37
6.55 –16.63 –23.88 –8.00 10.20 –31.98 28.94 –4.08
5.60 –16.95 –23.77 –8.99 11.18 –32.17 27.96 –3.93
4.66 –17.28 –23.59 –9.97 12.18 –32.28 26.96 –3.91
3.70 –17.58 –23.35 –10.94 13.18 –32.33 25.99 –4.13
2.73 –17.84 –23.07 –11.91 14.18 –32.30 25.10 –4.58
1.76 –18.05 –22.78 –12.86 15.17 –32.23 24.40 –5.26
0.77 –18.17 –22.43 –13.80 16.17 –32.13 24.28 –6.23
–0.23 –18.16 –22.07 –14.73 17.15 –31.97 24.48 –7.20
–1.21 –17.97 –21.69 –15.66 18.13 –31.75 24.88 –8.12
–2.15 –17.62 –21.28 –16.57 19.10 –31.50 25.43 –8.95
–3.03 –17.15 –20.83 –17.46 20.05 –31.20 26.02 –9.76
–3.85 –16.59 –20.34 –18.33 20.99 –30.86 26.63 –10.55
–4.56 –15.88 –19.81 –19.18 21.92 –30.48 27.26 –11.32
–5.12 –15.06 –19.27 –20.02 22.82 –30.05 27.77 –12.18
–5.53 –14.15 –18.68 –20.83 23.70 –29.58 28.10 –13.12
–5.80 –13.19 –18.02 –21.58 24.56 –29.07 28.17 –14.12
–5.96 –12.20 –17.33 –22.30 25.41 –28.54 27.99 –15.10
–6.08 –11.21 –16.58 –22.96 26.23 –27.97 27.71 –16.06
–6.21 –10.22 –15.80 –23.58 27.02 –27.36
–6.33 –9.22 –14.97 –24.15 27.77 –26.70

Rec. ITU-T P.57 (06/2021) 77
Pinna plane 13 mm
�̂�𝒆 �̂�𝒆 �̂�𝒆 �̂�𝒆 �̂�𝒆 �̂�𝒆 �̂�𝒆 �̂�𝒆
24.86 –21.34 –7.13 –8.66 –9.38 –27.94 31.18 –23.13
24.16 –22.05 –7.38 –7.69 –8.42 –28.22 31.73 –22.29
23.40 –22.70 –7.72 –6.75 –7.46 –28.50 32.23 –21.43
22.61 –23.31 –8.17 –5.86 –6.49 –28.76 32.69 –20.54
21.77 –23.86 –8.77 –5.06 –5.52 –28.98 33.10 –19.63
20.87 –24.30 –9.56 –4.47 –4.54 –29.20 33.47 –18.70
19.92 –24.58 –10.53 –4.53 –3.57 –29.43 33.79 –17.75
18.93 –24.77 –11.28 –5.18 –2.60 –29.66 34.04 –16.78
17.94 –24.77 –11.71 –6.08 –1.63 –29.91 34.24 –15.81
17.02 –24.39 –11.98 –7.04 –0.67 –30.21 34.37 –14.81
16.55 –23.55 –12.25 –8.01 0.27 –30.54 34.42 –13.82
16.74 –22.57 –12.64 –8.93 1.21 –30.87 34.43 –12.82
17.06 –21.63 –13.29 –9.67 2.14 –31.24 34.35 –11.82
17.28 –20.66 –14.25 –9.86 3.07 –31.62 34.16 –10.84
17.10 –19.68 –15.24 –9.74 3.99 –31.99 33.89 –9.88
16.46 –18.92 –16.22 –9.52 4.93 –32.34 33.55 –8.94
15.62 –18.39 –17.19 –9.27 5.88 –32.66 33.11 –8.04
14.71 –17.99 –18.16 –9.04 6.84 –32.95 32.53 –7.23
13.75 –17.69 –19.13 –8.81 7.81 –33.19 31.81 –6.53
12.78 –17.45 –20.12 –8.65 8.79 –33.37 30.97 –5.99
11.79 –17.30 –21.09 –8.79 9.78 –33.51 30.05 –5.60
10.80 –17.19 –21.72 –9.55 10.78 –33.58 29.09 –5.35
9.80 –17.13 –21.97 –10.51 11.78 –33.62 28.09 –5.26
8.80 –17.13 –21.98 –11.51 12.78 –33.61 27.10 –5.35
7.80 –17.22 –21.90 –12.51 13.77 –33.55 26.17 –5.70
6.82 –17.36 –21.73 –13.49 14.77 –33.42 25.45 –6.38
5.83 –17.56 –21.52 –14.47 15.76 –33.27 25.16 –7.33
4.86 –17.79 –21.28 –15.44 16.74 –33.08 25.25 –8.32
3.88 –18.00 –20.95 –16.38 17.71 –32.84 25.55 –9.27
2.90 –18.17 –20.59 –17.32 18.67 –32.57 25.94 –10.19
1.91 –18.29 –20.19 –18.24 19.62 –32.25 26.41 –11.08
0.91 –18.35 –19.76 –19.14 20.55 –31.88 26.85 –11.97
–0.09 –18.26 –19.29 –20.02 21.47 –31.49 27.25 –12.88
–1.06 –18.04 –18.78 –20.88 22.37 –31.06 27.61 –13.82
–1.99 –17.68 –18.22 –21.71 23.25 –30.58 27.79 –14.80
–2.88 –17.22 –17.61 –22.50 24.11 –30.07 27.70 –15.80
–3.72 –16.68 –16.95 –23.25 24.94 –29.52 27.51 –16.78
–4.49 –16.05 –16.24 –23.95 25.76 –28.94 27.16 –17.71
–5.16 –15.31 –15.49 –24.62 26.56 –28.34 26.72 –18.61
–5.69 –14.46 –14.71 –25.24 27.33 –27.70 26.24 –19.49
–6.08 –13.54 –13.88 –25.79 28.06 –27.02 25.69 –20.32
–6.33 –12.57 –13.03 –26.33 28.75 –26.30 25.07 –21.10
–6.50 –11.59 –12.16 –26.81 29.41 –25.55
–6.70 –10.61 –11.25 –27.24 30.04 –24.77
–6.89 –9.63 –10.32 –27.61 30.62 –23.96

78 Rec. ITU-T P.57 (06/2021)
Pinna plane 14 mm
�̂�𝒆 �̂�𝒆 �̂�𝒆 �̂�𝒆 �̂�𝒆 �̂�𝒆 �̂�𝒆 �̂�𝒆
24.89 –21.11 –6.56 –14.52 –7.79 –29.48 29.76 –25.17
24.27 –21.89 –7.12 –13.69 –6.85 –29.84 30.35 –24.36
23.61 –22.64 –7.57 –12.80 –5.91 –30.18 30.93 –23.55
22.88 –23.32 –8.03 –11.91 –4.97 –30.51 31.48 –22.71
22.09 –23.93 –8.48 –11.02 –4.03 –30.85 31.99 –21.85
21.27 –24.51 –8.93 –10.14 –3.08 –31.17 32.46 –20.97
20.40 –24.99 –9.78 –10.27 –2.13 –31.48 32.89 –20.07
19.47 –25.37 –10.23 –11.16 –1.19 –31.81 33.27 –19.14
18.51 –25.65 –10.59 –12.09 –0.23 –32.10 33.58 –18.19
17.53 –25.83 –11.14 –12.92 0.73 –32.38 33.84 –17.23
16.54 –25.97 –11.96 –13.47 1.69 –32.66 34.03 –16.25
15.54 –25.98 –12.94 –13.40 2.66 –32.91 34.14 –15.25
14.54 –25.89 –13.84 –12.97 3.63 –33.13 34.17 –14.25
13.57 –25.68 –14.71 –12.48 4.61 –33.34 34.13 –13.25
12.64 –25.30 –15.63 –12.08 5.59 –33.52 34.00 –12.26
11.93 –24.63 –16.60 –11.84 6.58 –33.69 33.80 –11.29
12.02 –23.67 –17.59 –11.75 7.56 –33.86 33.47 –10.34
12.52 –22.80 –18.58 –11.89 8.56 –34.00 33.02 –9.45
13.02 –21.93 –19.43 –12.39 9.55 –34.09 32.43 –8.65
13.21 –20.96 –19.92 –13.26 10.55 –34.11 31.69 –7.97
12.79 –20.08 –20.16 –14.23 11.55 –34.13 30.85 –7.43
12.01 –19.46 –20.21 –15.23 12.55 –34.12 29.93 –7.07
11.10 –19.06 –20.14 –16.22 13.55 –34.05 28.94 –6.90
10.14 –18.77 –19.96 –17.20 14.54 –33.94 27.95 –6.93
9.16 –18.56 –19.67 –18.16 15.53 –33.80 27.01 –7.25
8.17 –18.44 –19.32 –19.10 16.51 –33.60 26.29 –7.93
7.17 –18.37 –18.92 –20.02 17.48 –33.35 26.02 –8.88
6.17 –18.38 –18.47 –20.91 18.43 –33.06 26.00 –9.88
5.17 –18.45 –17.97 –21.77 19.38 –32.73 26.18 –10.86
4.18 –18.56 –17.42 –22.61 20.31 –32.36 26.42 –11.83
3.18 –18.64 –16.79 –23.39 21.22 –31.94 26.64 –12.80
2.18 –18.67 –16.13 –24.14 22.11 –31.49 26.85 –13.78
1.18 –18.64 –15.42 –24.84 22.98 –31.00 26.97 –14.78
0.19 –18.53 –14.69 –25.52 23.83 –30.48 26.99 –15.77
–0.78 –18.31 –13.91 –26.15 24.67 –29.93 26.92 –16.77
–1.72 –17.97 –13.11 –26.75 25.48 –29.34 26.68 –17.74
–2.63 –17.55 –12.27 –27.28 26.26 –28.72 26.33 –18.68
–3.50 –17.06 –11.42 –27.82 27.02 –28.07 25.90 –19.58
–4.34 –16.52 –10.54 –28.30 27.77 –27.41 25.37 –20.43
–5.17 –15.95 –9.63 –28.71 28.48 –26.71
–5.90 –15.27 –8.72 –29.11 29.14 –25.95

Rec. ITU-T P.57 (06/2021) 79
Pinna plane 15 mm
�̂�𝒆 �̂�𝒆 �̂�𝒆 �̂�𝒆 �̂�𝒆 �̂�𝒆 �̂�𝒆 �̂�𝒆
–18.80 –16.37 10.21 –34.06 32.78 –11.36 8.25 –24.69
–18.84 –17.37 11.21 –34.07 32.22 –10.53 8.56 –23.76
–18.72 –18.36 12.21 –34.05 31.50 –9.84 9.08 –22.91
–18.49 –19.33 13.21 –33.98 30.67 –9.29 9.46 –21.99
–18.15 –20.27 14.21 –33.90 29.72 –8.97 9.33 –21.02
–17.75 –21.18 15.20 –33.76 28.72 –8.92 8.61 –20.34
–17.26 –22.06 16.18 –33.59 27.77 –9.18 7.71 –19.92
–16.70 –22.89 17.16 –33.37 27.05 –9.86 6.74 –19.66
–16.10 –23.68 18.12 –33.09 26.75 –10.80 5.75 –19.51
–15.44 –24.44 19.06 –32.76 26.66 –11.80 4.76 –19.43
–14.74 –25.15 19.99 –32.39 26.66 –12.80 3.76 –19.38
–14.01 –25.83 20.90 –31.98 26.65 –13.80 2.76 –19.30
–13.23 –26.46 21.79 –31.52 26.58 –14.80 1.77 –19.19
–12.44 –27.07 22.66 –31.03 26.44 –15.79 0.78 –19.05
–11.62 –27.64 23.51 –30.49 26.28 –16.77 –0.20 –18.83
–10.78 –28.18 24.34 –29.94 26.00 –17.73 –1.15 –18.54
–9.90 –28.67 25.15 –29.36 25.63 –18.66 –2.09 –18.18
–9.01 –29.12 25.94 –28.74 25.17 –19.55 –3.01 –17.79
–8.10 –29.54 26.69 –28.08 24.62 –20.38 –3.90 –17.34
–7.21 –29.98 27.42 –27.40 24.02 –21.18 –4.77 –16.85
–6.30 –30.40 28.13 –26.69 23.38 –21.95 –5.65 –16.36
–5.37 –30.76 28.79 –25.94 22.68 –22.66 –6.52 –15.88
–4.43 –31.11 29.44 –25.18 21.94 –23.33 –7.42 –15.45
–3.49 –31.45 30.04 –24.38 21.16 –23.97 –8.40 –15.24
–2.54 –31.77 30.60 –23.56 20.35 –24.54 –9.35 –15.50
–1.59 –32.07 31.15 –22.72 19.48 –25.04 –10.13 –16.12
–0.63 –32.35 31.66 –21.86 18.57 –25.45 –10.94 –16.67
0.34 –32.61 32.13 –20.98 17.63 –25.79 –11.92 –16.58
1.31 –32.84 32.57 –20.08 16.66 –26.05 –12.79 –16.10
2.28 –33.07 32.95 –19.16 15.68 –26.23 –13.60 –15.51
3.27 –33.26 33.23 –18.20 14.69 –26.34 –14.39 –14.90
4.25 –33.43 33.44 –17.22 13.69 –26.38 –15.25 –14.38
5.24 –33.58 33.59 –16.23 12.69 –26.37 –16.18 –14.06
6.23 –33.72 33.63 –15.23 11.69 –26.28 –17.18 –14.07
7.22 –33.85 33.55 –14.23 10.70 –26.14 –18.01 –14.60
8.22 –33.93 33.40 –13.25 9.74 –25.87 –18.55 –15.43
9.22 –34.00 33.17 –12.27 8.83 –25.46

80 Rec. ITU-T P.57 (06/2021)
Pinna plane 16 mm
�̂�𝒆 �̂�𝒆 �̂�𝒆 �̂�𝒆 �̂�𝒆 �̂�𝒆
–16.40 –16.20 18.61 –32.30 19.89 –24.19
–17.13 –16.86 19.54 –31.94 19.03 –24.69
–17.41 –17.81 20.46 –31.56 18.14 –25.15
–17.42 –18.81 21.36 –31.12 17.21 –25.51
–17.27 –19.79 22.24 –30.63 16.25 –25.80
–16.99 –20.75 23.08 –30.09 15.28 –26.02
–16.59 –21.66 23.91 –29.54 14.29 –26.21
–16.08 –22.53 24.73 –28.97 13.31 –26.35
–15.53 –23.36 25.51 –28.35 12.31 –26.45
–14.92 –24.15 26.26 –27.68 11.31 –26.47
–14.23 –24.87 26.98 –26.99 10.31 –26.45
–13.50 –25.55 27.67 –26.27 9.31 –26.38
–12.74 –26.21 28.34 –25.52 8.32 –26.27
–11.94 –26.81 28.97 –24.74 7.34 –26.07
–11.13 –27.39 29.57 –23.95 6.40 –25.74
–10.29 –27.93 30.13 –23.11 5.51 –25.29
–9.42 –28.43 30.65 –22.26 4.98 –24.48
–8.54 –28.90 31.11 –21.38 5.29 –23.55
–7.64 –29.35 31.54 –20.47 5.77 –22.67
–6.75 –29.79 31.93 –19.55 5.72 –21.71
–5.84 –30.20 32.23 –18.60 4.99 –21.05
–4.91 –30.58 32.41 –17.61 4.09 –20.62
–3.97 –30.93 32.50 –16.62 3.13 –20.34
–3.03 –31.27 32.49 –15.62 2.16 –20.10
–2.08 –31.59 32.33 –14.63 1.19 –19.86
–1.12 –31.87 32.01 –13.69 0.22 –19.59
–0.16 –32.13 31.51 –12.82 –0.74 –19.32
0.81 –32.36 30.83 –12.11 –1.68 –18.98
1.79 –32.56 29.93 –11.69 –2.62 –18.63
2.78 –32.74 28.94 –11.66 –3.55 –18.26
3.76 –32.90 28.06 –12.11 –4.47 –17.87
4.75 –33.04 27.51 –12.94 –5.39 –17.49
5.75 –33.16 27.16 –13.87 –6.34 –17.17
6.74 –33.27 26.88 –14.83 –7.33 –17.07
7.74 –33.36 26.62 –15.80 –8.22 –17.46
8.74 –33.41 26.31 –16.75 –8.77 –18.29
9.73 –33.46 25.94 –17.68 –9.46 –18.98
10.73 –33.48 25.46 –18.56 –10.44 –18.97
11.73 –33.47 24.94 –19.41 –11.35 –18.58
12.73 –33.42 24.33 –20.20 –12.21 –18.06
13.73 –33.35 23.66 –20.94 –13.03 –17.49
14.72 –33.22 22.98 –21.68 –13.84 –16.91
15.71 –33.05 22.29 –22.40 –14.69 –16.38
16.69 –32.85 21.55 –23.07 –15.64 –16.09
17.66 –32.60 20.73 –23.65

Rec. ITU-T P.57 (06/2021) 81
Pinna plane 17 mm
�̂�𝒆 �̂�𝒆 �̂�𝒆 �̂�𝒆 �̂�𝒆 �̂�𝒆
–4.81 –29.70 29.42 –21.01 0.93 –22.30
–3.88 –30.06 29.75 –20.06 0.50 –21.44
–2.93 –30.39 29.89 –19.07 –0.33 –20.88
–1.98 –30.70 29.83 –18.08 –1.24 –20.48
–1.02 –30.97 29.54 –17.13 –2.18 –20.14
–0.05 –31.20 28.71 –16.70 –3.13 –19.83
0.93 –31.42 27.86 –17.19 –4.11 –19.63
1.91 –31.61 27.11 –17.85 –5.10 –19.66
2.90 –31.77 26.44 –18.59 –5.53 –20.51
3.89 –31.90 25.85 –19.40 –5.94 –21.37
4.88 –32.01 25.16 –20.13 –6.92 –21.52
5.88 –32.10 24.42 –20.80 –7.91 –21.38
6.88 –32.17 23.72 –21.51 –8.86 –21.06
7.88 –32.23 23.06 –22.26 –9.76 –20.64
8.87 –32.26 22.32 –22.93 –10.64 –20.16
9.87 –32.28 21.50 –23.50 –11.49 –19.63
10.87 –32.27 20.64 –24.01 –12.33 –19.10
11.87 –32.23 19.75 –24.47 –13.21 –18.62
12.87 –32.18 18.84 –24.88 –14.13 –18.24
13.87 –32.11 17.91 –25.26 –15.10 –18.31
14.86 –31.97 16.96 –25.57 –15.69 –19.08
15.84 –31.78 16.00 –25.84 –15.74 –20.07
16.82 –31.57 15.02 –26.05 –15.53 –21.05
17.78 –31.30 14.04 –26.24 –15.13 –21.96
18.72 –30.96 13.05 –26.38 –14.61 –22.81
19.64 –30.56 12.06 –26.51 –14.02 –23.62
20.53 –30.11 11.06 –26.56 –13.37 –24.38
21.41 –29.63 10.06 –26.60 –12.64 –25.07
22.27 –29.12 9.06 –26.57 –11.89 –25.72
23.10 –28.57 8.06 –26.51 –11.09 –26.33
23.92 –28.00 7.07 –26.45 –10.26 –26.88
24.69 –27.36 6.07 –26.34 –9.42 –27.42
25.43 –26.69 5.09 –26.18 –8.55 –27.92
26.16 –26.00 4.11 –25.96 –7.67 –28.38
26.82 –25.25 3.15 –25.69 –6.77 –28.83
27.44 –24.47 2.22 –25.32 –5.86 –29.25
28.02 –23.65 1.35 –24.82 –4.95 –29.65
28.56 –22.81 0.62 –24.15
29.02 –21.92 0.57 –23.22

82 Rec. ITU-T P.57 (06/2021)
Pinna plane 18 mm Pinna plane 18.5 mm
�̂�𝒆 �̂�𝒆 �̂�𝒆 �̂�𝒆 �̂�𝒆 �̂�𝒆
–4.46 –28.41 9.25 –27.47 –4.09 –27.44
–3.52 –28.75 8.26 –27.35 –3.15 –27.78
–2.57 –29.06 7.26 –27.23 –2.20 –28.08
–1.61 –29.33 6.27 –27.11 –1.22 –28.28
–0.63 –29.56 5.28 –26.96 –0.24 –28.44
0.34 –29.78 4.30 –26.79 0.75 –28.61
1.33 –29.95 3.31 –26.61 1.74 –28.71
2.32 –30.06 2.33 –26.41 2.74 –28.65
3.32 –30.16 1.36 –26.17 3.72 –28.43
4.32 –30.22 0.40 –25.88 3.81 –27.79
5.31 –30.26 –0.54 –25.57 2.89 –27.40
6.31 –30.27 –1.49 –25.23 1.94 –27.11
7.31 –30.24 –2.42 –24.87 0.97 –26.85
8.31 –30.24 –3.36 –24.52 0.02 –26.54
9.31 –30.22 –4.29 –24.16 –0.92 –26.21
10.31 –30.19 –5.22 –23.79 –1.87 –25.88
11.31 –30.15 –6.14 –23.40 –2.81 –25.54
12.31 –30.10 –7.07 –23.03 –3.75 –25.21
13.30 –29.99 –8.00 –22.67 –4.68 –24.85
14.29 –29.84 –8.92 –22.28 –5.61 –24.46
15.27 –29.64 –9.83 –21.87 –6.54 –24.11
16.25 –29.41 –10.72 –21.42 –7.49 –23.79
17.19 –29.09 –11.68 –21.12 –8.46 –23.54
18.09 –28.64 –12.64 –21.21 –9.31 –23.82
18.87 –28.02 –12.77 –22.14 –8.83 –24.67
19.55 –27.29 –12.30 –23.01 –8.07 –25.31
19.20 –26.67 –11.66 –23.78 –7.23 –25.85
18.20 –26.75 –10.96 –24.49 –6.37 –26.37
17.21 –26.88 –10.22 –25.16 –5.50 –26.84
16.22 –26.98 –9.41 –25.76 –4.58 –27.25
15.23 –27.11 –8.59 –26.32
14.23 –27.23 –7.73 –26.83
13.24 –27.33 –6.85 –27.30
12.25 –27.44 –5.96 –27.77
11.25 –27.49 –5.05 –28.18
10.25 –27.52

Rec. ITU-T P.57 (06/2021) 83
Annex C
Cross sectional areas of Type 4.4 artificial ear
(This annex forms an integral part of this Recommendation.)
C.1 Cross sections of the concha bottom
The two additional cross-section planes around the EEP as illustrated in Figure 15 are determined in
the same way as in clause B.1 for the type 4.3 ear.
C.2 Cross sectional areas of the ear canal and concha bottom
The cross sectional areas of the ear canal and the concha bottom as described in clauses 6.4.4.4.2,
6.4.4.4.3 and 6.4.4.4.4 and illustrated in Figure 15 in the plane of the two unit vectors �̂�𝑒, �̂�𝑒 as
illustrated in Figure 11 are listed in Table C.1. The cross sections along the centre line (the green
planes) are given with 25 points on the periphery in each, corresponding to a spacing better than or
equal to 1.1 mm. The cross sections of the concha bottom (the yellow planes) are larger and given
with a spacing of 1 mm between the points. These tables are the basis for the plots shown in Figure 17.
Table C.1 – Tabular values for the cross sectional areas of the ear canal and concha bottom
DRP (0 mm) &
cylindric cavity entry
(14.25 mm)
14.5 mm 14.75 mm 15 mm
�̂�𝒆 �̂�𝒆 �̂�𝒆 �̂�𝒆 �̂�𝒆 �̂�𝒆 �̂�𝒆 �̂�𝒆
3.44 −1.49 3.32 −1.43 3.19 −1.38 3.07 −1.32
2.86 −2.43 2.82 −2.23 2.67 −2.16 2.52 −2.09
2.00 −3.17 2.14 −2.88 1.97 −2.79 1.81 −2.71
0.97 −3.62 1.32 −3.35 1.16 −3.25 0.99 −3.16
−0.09 −3.75 0.42 −3.61 0.25 −3.51 0.08 −3.41
−1.10 −3.59 −0.52 −3.64 −0.69 −3.54 −0.85 −3.44
−1.95 −3.20 −1.44 −3.45 −1.61 −3.37 −1.78 −3.29
−2.62 −2.69 −2.29 −3.05 −2.48 −3.01 −2.66 −2.96
−3.10 −2.11 −3.03 −2.49 −3.25 −2.49 −3.47 −2.50
−3.44 −1.50 −3.61 −1.76 −3.89 −1.82 −4.16 −1.87
−3.65 −0.84 −3.98 −0.90 −4.29 −0.98 −4.61 −1.06
−3.75 −0.15 −4.04 0.04 −4.32 −0.04 −4.61 −0.12
−3.71 0.53 −3.82 0.94 −4.04 0.84 −4.25 0.74
−3.54 1.23 −3.38 1.76 −3.54 1.62 −3.69 1.48
−3.19 1.97 −2.77 2.47 −2.88 2.28 −2.99 2.10
−2.59 2.71 −2.01 3.02 −2.10 2.81 −2.20 2.60
−1.72 3.33 −1.15 3.39 −1.24 3.18 −1.34 2.97
−0.65 3.69 -0.23 3.58 −0.33 3.40 −0.43 3.23
0.45 3.72 0.71 3.55 0.60 3.43 0.50 3.32
1.46 3.45 1.61 3.29 1.51 3.24 1.42 3.19
2.31 2.96 2.41 2.82 2.35 2.82 2.28 2.83
2.98 2.27 3.06 2.14 3.02 2.18 2.98 2.21

84 Rec. ITU-T P.57 (06/2021)
Table C.1 – Tabular values for the cross sectional areas of the ear canal and concha bottom
DRP (0 mm) &
cylindric cavity entry
(14.25 mm)
14.5 mm 14.75 mm 15 mm
3.46 1.45 3.50 1.31 3.47 1.35 3.44 1.39
3.71 0.52 3.68 0.39 3.63 0.43 3.58 0.46
3.72 −0.47 3.62 −0.54 3.53 −0.50 3.44 −0.47
Ref. Plane (15.25) 15.92 mm 17.92 mm
�̂�𝒆 �̂�𝒆 �̂�𝒆 �̂�𝒆 �̂�𝒆 �̂�𝒆
2.94 −1.27 −1.83 2.63 −0.30 −3.24
2.37 −2.02 −2.70 2.24 0.64 −3.00
1.65 −2.62 −3.52 1.75 1.52 −2.57
0.82 −3.07 −4.25 1.14 2.31 −2.00
−0.09 −3.31 −4.85 0.39 2.95 −1.26
−1.03 −3.34 −5.19 −0.49 3.39 −0.39
−1.96 −3.21 −4.99 −1.40 3.52 0.57
−2.86 −2.91 −4.38 −2.14 3.26 1.50
−3.70 −2.50 −3.60 −2.68 2.64 2.26
−4.44 −1.92 −2.73 −3.08 1.80 2.74
−4.93 −1.12 −1.81 −3.32 0.84 2.94
−4.90 −0.20 −0.86 −3.37 −0.13 2.98
−4.47 0.64 0.09 −3.25 −1.11 2.88
−3.84 1.34 0.99 −2.95 −2.06 2.67
−3.10 1.92 1.81 −2.46 −2.98 2.34
−2.29 2.40 2.50 −1.81 −3.84 1.89
−1.42 2.77 3.07 −1.04 −4.62 1.29
−0.53 3.06 3.44 −0.17 −5.25 0.55
0.40 3.21 3.55 0.78 −5.61 −0.35
1.34 3.14 3.29 1.69 −5.48 −1.31
2.22 2.83 2.71 2.44 −4.90 −2.09
2.95 2.24 1.89 2.92 −4.10 −2.65
3.41 1.42 0.97 3.14 −3.21 −3.04
3.53 0.50 0.02 3.10 −2.26 −3.25
3.35 −0.43 −0.92 2.92 −1.28 −3.32

Rec. ITU-T P.57 (06/2021) 85
19.92 mm 21.92 mm 23.92 mm
�̂�𝒆 �̂�𝒆 �̂�𝒆 �̂�𝒆 �̂�𝒆 �̂�𝒆
−0.43 −3.00 −4.35 2.12 3.56 0.84
0.53 −2.91 −5.11 1.50 2.99 1.69
1.45 −2.64 −5.54 0.64 2.24 2.41
2.30 −2.18 −5.45 −0.32 1.38 2.96
3.01 −1.54 −4.89 −1.12 0.41 3.28
3.49 −0.71 −4.15 −1.76 −0.61 3.39
3.61 0.24 −3.30 −2.25 −1.64 3.33
3.34 1.16 −2.38 −2.61 −2.65 3.12
2.76 1.93 −1.44 −2.87 −3.60 2.75
1.98 2.48 −0.47 −3.01 −4.47 2.22
1.07 2.81 0.51 −3.01 −5.18 1.47
0.12 2.96 1.47 −2.82 −5.57 0.53
−0.84 2.96 2.37 −2.43 −5.51 −0.48
−1.80 2.84 3.15 −1.85 −5.01 −1.38
−2.74 2.62 3.68 −1.03 −4.24 −2.06
−3.64 2.28 3.79 −0.06 −3.34 −2.56
−4.47 1.79 3.50 0.87 −2.39 −2.94
−5.18 1.15 2.95 1.67 −1.40 −3.20
−5.58 0.28 2.22 2.32 −0.38 −3.33
−5.44 −0.66 1.34 2.77 0.65 −3.31
−4.87 −1.42 0.39 3.00 1.65 −3.08
−4.11 −2.02 −0.59 3.07 2.56 −2.62
−3.26 −2.46 −1.57 3.01 3.37 −1.98
−2.34 −2.76 −2.53 2.84 3.92 −1.13
−1.39 −2.93 −3.47 2.55 3.93 −0.11

86 Rec. ITU-T P.57 (06/2021)
25.92 mm EEP Projection #1 EEP Projection #2 EEP Projection #3
�̂�𝒆 �̂�𝒆 �̂�𝒆 �̂�𝒆 �̂�𝒆 �̂�𝒆 �̂�𝒆 �̂�𝒆
−5.51 2.16 6.33 1.54 6.57 1.62 −6.38 3.86
−4.71 2.92 6.14 2.51 6.20 2.54 −6.82 2.97
−3.70 3.36 5.58 3.34 5.57 3.32 −7.00 1.99
−2.62 3.58 4.86 4.02 4.82 3.97 −6.94 0.99
−1.52 3.67 4.04 4.60 3.97 4.51 −6.78 0.00
−0.42 3.59 3.16 5.07 3.07 4.93 −6.58 −0.98
0.66 3.34 2.21 5.39 2.11 5.20 −6.37 −1.95
1.67 2.90 1.23 5.54 1.12 5.34 −6.16 −2.93
2.59 2.29 0.23 5.58 0.12 5.39 −5.99 −3.92
3.39 1.53 −0.77 5.55 −0.88 5.39 -5.83 −4.91
4.00 0.61 −1.77 5.45 −1.88 5.36 −5.67 −5.89
4.13 −0.47 −2.74 5.23 −2.88 5.28 −5.37 −6.84
3.69 −1.47 −3.65 4.82 −3.85 5.06 −4.92 −7.74
2.92 −2.26 −4.39 4.16 −4.76 4.65 −4.30 −8.52
2.00 −2.86 −4.90 3.31 −5.47 3.99 −3.54 −9.16
0.95 −3.22 −5.13 2.34 −5.96 3.13 −2.64 −9.60
−0.14 −3.38 −4.97 1.36 -6.09 2.15 −1.66 −9.78
−1.24 −3.38 −4.49 0.49 −5.94 1.16 −0.66 −9.73
−2.34 −3.25 −3.79 −0.23 −5.57 0.23 0.29 −9.43
−3.41 −2.97 −3.00 -0.83 −5.06 −0.62 1.16 −8.93
−4.43 −2.54 −2.13 −1.33 −4.47 −1.44 1.91 −8.28
−5.32 −1.89 −1.20 −1.70 −3.88 −2.24 2.57 −7.53
−5.94 −0.99 −0.24 −1.95 −3.29 −3.05 3.14 −6.71
−6.18 0.08 0.76 −2.05 −2.72 −3.87 3.63 −5.84
−6.01 1.18 1.76 −2.00 −2.09 −4.64 4.14 −4.98
2.75 −1.86 −1.31 −5.26 4.71 −4.15
3.71 −1.62 −0.35 −5.49 5.29 −3.34
4.61 −1.17 0.63 −5.34 5.89 −2.54
5.36 −0.52 1.47 −4.81 6.40 −1.68
5.94 0.29 2.29 −4.23 6.75 −0.74
6.30 1.22 3.10 −3.65 6.86 0.25
3.92 −3.07 6.73 1.24
4.72 −2.47 6.31 2.14
5.43 −1.77 5.70 2.93
6.02 −0.97 4.94 3.59
6.44 −0.06 4.09 4.10
6.60 0.92 3.17 4.49
2.20 4.74
1.21 4.87

Rec. ITU-T P.57 (06/2021) 87
25.92 mm EEP Projection #1 EEP Projection #2 EEP Projection #3
0.21 4.92
−0.79 4.96
−1.79 5.00
−2.79 5.04
−3.79 5.02
−4.77 4.84
−5.70 4.48
C.3 Cross sectional areas of the pinna simulator
The cross-sectional areas of the pinna simulator for the type 4.4 ear simulator are identical to the ones
of type 4.3 and are provided in Table B.3.

88 Rec. ITU-T P.57 (06/2021)
Appendix I
Comparative acoustical input impedance measurements on the artificial ears
Types 3.3 and 3.4 and on human ears
(This appendix does not form an integral part of this Recommendation.)
I.1 Introduction
This appendix presents an analysis of the ear impedance measurements made in the ITU-T
round-robin test. An overview of the data from this test is presented in clause I.2 followed by a
presentation of the measurements made on the type 3.3 and 3.4 artificial ears in clause I.3.
Clause I.4 covers the analysis of the human ear measurements which includes two different
approaches. A set of univariate analyses is applied first to assess the impedance variable in terms of
variability and influence of the different factors for each frequency bin separately. A bivariate
parametric analysis is then applied to describe the variability of the impedance and frequency
variables for a set of frequency response extrema derived from the human ear measurements. Finally,
a comparison between the set of human ear impedance measurements and the impedance
measurements made on the type 3.3 and type 3.4 artificial ears is presented in clause I.5 for the two
perspectives of univariate and the bivariate structural analyses.
I.2 Data overview
The data from the round-robin test comprised acoustic impedance measured using a phone-like
impedance probe at each R40 (1/12th octave), as defined in [b-ISO 3], centre frequencies between
0.2–8 kHz for each test case.
Measurements made on artificial ear types according to this Recommendation at the standard
measurement position according to [ITU-T P.64] included:
1) Measurements by Brüel & Kjær on a type 3.3 right artificial ear with separate test cases for
application forces between 2 and 18 N increasing by 2 N steps.
2) Measurements by HEAD acoustics on a type 3.4 right artificial ear with separate test cases
for application forces between 2 and 18 N increasing by 2 N steps.
This resulted in a total of 18 individual test cases from the 2 ear types (3.3, 3.4) 9 application forces
(2 N, 4 N, 6 N, 8 N, 10 N, 12 N, 14 N, 16 N, 18 N).
Measurements were also made on the ears of 60 male and 46 female human adult subjects, split
between the organizations contributing to the tests. The organizational, geographical and age
distribution of the human subjects are:
Contributor (country):
• Lab #1 – Nokia (Finland): 24 subjects
• Lab #2 – Brüel & Kjær (Denmark): 30 subjects
• Lab #3 – HEAD acoustics (Germany): 16 subjects
• Lab #4 – Motorola (USA): 16 subjects
• Lab #5 – Uniden (USA): 20 subjects
Age:
• 20-34 yrs: 38 subjects
• 35-49 yrs: 51 subjects
• ≥ 50 yrs: 17 subjects

Rec. ITU-T P.57 (06/2021) 89
Two separate measurements were made for each of the 106 human test subjects.
• 'Normal' application force of the handset against the users' ear, inferred from placement in a
quiet environment (< 30 dBA background noise).
• 'Firm' application force of the handset against the users' ear, inferred from placement in a
noisy environment (< 70 dBA hot noise present).
In both measurement cases, the user defined what application force was required.
This resulted in a total of 212 individual test cases from the 106 subjects (60 male, 46 female) × 2
inferred application forces ('normal', 'firm').
No repetitions of test cases for the artificial or human ears were included.
I.3 Artificial ear measurements
Presented in this clause are the results of measurement on type 3.3 and type 3.4 artificial ears.
NOTE – Although not part of the planned test comparisons, results of measurement on type 3.2 low leak
and 3.2 high leak ears are supplied as normative references in clause I.5.3.
I.3.1 HATS 3.3 ear
The set of measurements, made by Brüel & Kjær on a type 3.3 right artificial ear shown in Figure I.1,
includes separate test cases for application forces between 2 and 18 N increasing by 2 N steps.
Figure I.1 – Measurement by Brüel & Kjær on a type 3.3 artificial ear with separate
test cases for application forces between 2 and 18 N increasing by 2 N steps
I.3.2 HATS 3.4 ear
The set of measurements, made by HEAD acoustics on a type 3.4 artificial ear shown in Figure I.2,
includes separate test cases for application forces between 2 and 18 N increasing by 2 N steps.
102
103
104
140
160
180
200
220
240
Frequency (Hz)
Za*
w (
Mag
nit
ud
e)
B&K - HATS meas. - type 3.3 - 9 pressure levels
From low (2N) to
high pressure (18N)

90 Rec. ITU-T P.57 (06/2021)
Figure I.2 – Measurement by HEAD acoustics on a type 3.4 artificial ear with separate
test cases for application forces between 2 and 18 N increasing by 2 N steps
I.4 Human ear measurements
I.4.1 Univariate analysis of the human ear measurements
I.4.1.1 Descriptive statistics
Figure I.3 presents a statistical summary plot of the impedance versus 1/12th octave band for the
normal (a) and firm (b) application force cases separately. Each of these graphs includes a box plot
with potential outliers in red and extreme outliers in blue for each of the frequency bins individually.
Figure I.3-a shows that the normal application force case contains a set of extreme outlying points,
which have been identified as originating from two individual measurements (subjects #12 and #50).
The firm application force case does not include any extreme outlying point. An identification of the
outlier points from both cases (see graphs in clause I.5.4) highlighted that the outlier points in the two
measurement sets are not due to one or several isolated measurements that would be clearly
inconsistent with the general shape of this set of impedance measurements.
Figures I.4 and I.5 present an impedance versus frequency bin line chart of the raw data (left plot)
and the mean and sample standard deviation (right plot) for the normal and firm application force
cases separately. The graph of the raw data for the normal application force clearly shows the two
extreme outlying cases highlighted above. Note that these two subjects (#12 and #50) were removed
from the analysis presented in subsequent clauses. The standard deviation of the human ear
measurements represented by the grey area in the right plots of Figures I.4 and I.5 illustrates the large
variability in individual impedance at the different frequency bands.
102
103
104
140
160
180
200
220
240
Frequency (Hz)
Za*
w (
Mag
nit
ud
e)
HA - HATS meas. - type 3.4 - 9 pressure levels
From low (2N) to
high pressure (18N)

Rec. ITU-T P.57 (06/2021) 91
a)
b)
Figure I.3 – Box plot with potential outliers (red circles) and extremes (blue stars) of the
impedance versus 1/12th octave band for the normal (a) and firm (b) application force cases

92 Rec. ITU-T P.57 (06/2021)
Figure I.4 – Impedance versus frequency bin line chart of the raw data (left plot) and the
mean and sample standard deviation (right plot) for the normal application force case
Figure I.5 – Impedance versus frequency bin line chart of the raw data (left plot) and the
mean and sample standard deviation (right plot) for the firm application force case
I.4.1.2 Significance testing of experimental factors
An analysis of variance (ANOVA) was applied to each of 65 frequency bins separately considering
the four following factors: Lab (five contributing organizations); Force (normal and firm application
forces); Subject (104 measured individuals); Gender (male and female). The fact that a given
individual was only measured in one laboratory and has one of the two genders has to be accounted
for in the ANOVA by considering a nesting of factors. Two separate ANOVA models were
considered to handle the nesting of the factor Subject in the factor Lab, on one hand, and the nesting
of the factor Subject in the factor Gender, on the other side. The first set of ANOVA models includes
the factors Lab, Force, Subject (Lab) and the interaction Lab Force. The second ANOVA model
includes the factors Gender, Force, Subject (Gender) and the interaction Gender Force. For each of
102
103
104
140
160
180
200
220
240
Frequency (Hz)
Za*
w (
Mag
nit
ud
e)
All human measurements - "Normal" application force
102
103
104
160
180
200
220
240
Frequency (Hz)
Za*
w (
Mag
nit
ud
e)
Human meas. - Normal ap. force - Average & stand dev.
102
103
104
140
160
180
200
220
240
Frequency (Hz)
Za*
w (
Mag
nit
ud
e)
All human measurements - "Firm" application force
102
103
104
160
180
200
220
240
Frequency (Hz)
Za*
w (
Mag
nit
ud
e)
Human meas. - Firm ap. force - Average & stand dev.

Rec. ITU-T P.57 (06/2021) 93
these two ANOVA models, a summary table of the F-ratios and associated levels of significance for
the different factors and interactions is presented for each frequency point in clause I.5.5. In this
clause, impedance versus frequency bin line charts are used to display the impedance means and
associated 95% confidence intervals about these means for the different factors. Also, significant
levels for each ANOVA table in clause I.5.5 are shown to assess the confidence of the differences
observed in these graphs.
Figure I.6 illustrates the effect of the factor Force, which is by far the largest for most frequency bins
as can be seen from the ANOVA results shown in Tables I.2 and I.3 (clause I.5.5). The difference is
clearly visible in Figure I.6 for the frequency range below 1.3 kHz and the range 2.1 kHz to 5 kHz.
The factor Lab (the five contributing organizations) has a much smaller effect than the factor Force
as illustrated in the left plot of Figure I.7. The ANOVA results of Table I.2 also highlight some
significant differences for this factor in the frequency range 1.9-2.3 kHz and around the frequency
4.2 kHz. Note, however, that the F-ratios are smaller than for the factor Force overall. The right plot
of Figure I.7 illustrates the most salient example of the difference observed for this factor when
comparing the laboratories Lab #2 and Lab #5. An additional plot is presented in Figure I.8 to
compare human ear measurement means per region, i.e., between the three European laboratories
(blue line) and the two North American laboratories (red line). This plot illustrates that differences
between the two regions are not significant based on the overlapping 95% confidence intervals. The
interaction Lab Force in the ANOVA results shown in Table I.2 (clause I.5.5), shows a significant
effect for the same frequency regions as those found for the factor Force. This effect is less important
though, as can be seen from the relatively small F-ratios, but it indicates that the application force
used by subjects for the two cases might have differed from one laboratory to another.
Considering finally the factor Gender, it appears that human ear measurements made on male and
female subjects do not follow the exact same pattern. This difference is illustrated in the left plot of
Figure I.9 and is also visible from the ANOVA results of Table I.3 in clause I.5.5. The factor Gender
is significant in the region 1.5-2.3 kHz and 3.5-4.5 kHz with relatively high F-ratios. It can be seen
however from Table I.3 that the interaction Gender Force is not significant, except for a few isolated
frequency bins, which indicates that the gender difference is not clearly related to a difference in
application force. The right plot of Figure I.9 compares human ear measurement means per gender
and per application force. This graph illustrates that differences seen between the two genders follow
roughly the same pattern for the normal and firm application force cases.

94 Rec. ITU-T P.57 (06/2021)
Figure I.6 – Comparison of human ear measurement means for the normal (blue curve)
and firm (red curve) application force cases
NOTE – The left plot illustrates the level of differences between the five laboratories. The ANOVA table given in Table I.3 indicates
that the factor Lab is significant for few frequency bins, which is visible when comparing the means and 95% confidence intervals of,
e.g., the Labs #2 and #5, as illustrated in the right plot.
Figure I.7 – Comparison of human ear measurement means
for the five contributing organizations (factor Lab)
102
103
104
180
200
220
Frequency (Hz)
Za*
w (
Mag
nit
ud
e)
Average of human meas. - Normal versus Firm ap. force
Blue: Normal application force
Red: Firm application force
102
103
104
180
200
220
Frequency (Hz)
Za*
w (
Mag
nit
ud
e)
Average of human meas. per lab
102
103
104
180
200
220
Frequency (Hz)
Za*
w (
Mag
nit
ud
e)
Average of human meas. Lab #2 versus #5

Rec. ITU-T P.57 (06/2021) 95
P.57(09)_FI.8
102
103
104
180
200
220
Frequency (Hz)
Red: North AmericaBlue: Europe
Za*
w (
Mag
nit
ud
e)
Average of human meas. per region
NOTE – This plot illustrates that differences between the two regions are not significant based on the overlapping
95% confidence intervals.
Figure I.8 – Comparison of human ear measurement means per region,
i.e., between the three European laboratories (blue line)
and the two North American laboratories (red line)
NOTE – Human ear measurement means per gender and application force (shown in the right plot) follow roughly the same pattern
for the normal and firm application forces.
Figure I.9 – Comparison of human ear measurement means per gender
(shown on the left plot) illustrating a significant difference between male and female
measurements based on the non-overlapping 95% confidence intervals
102
103
104
180
200
220
Frequency (Hz)
Za*
w (
Mag
nit
ud
e)
Average of human meas. per gender
Black: MaleBlue: Female
102
103
104
180
200
220
Frequency (Hz)
Za*
w (
Mag
nit
ud
e)
Average of human meas. per gender and appl. force
Gender
Blue: Female
Force
Black: Male
Solid: Normal
Dashed: Firm

96 Rec. ITU-T P.57 (06/2021)
I.4.2 Bivariate parametric analysis of the human ear measurements
I.4.2.1 Presentation of the analysis method
An inspection of the large set of human ear measurements made in this round-robin test reveals a
common structure in the shape of the impedance response as a function of frequency. The curve
formed by most of the individual impedance measurements shows a series of extrema which can be
used as a basis for applying a structural analysis on this dataset. For this purpose, a routine to detect
curve extrema was applied to all human ear measurements and a bivariate parametric analysis was
then considered to describe the variability of the impedance and frequency variables for this set of
frequency response extrema.
The routine used for the detection of curve extrema consists of an identification of maxima (response
minima) in the curve, i.e., points that are preceded and followed by lower (response higher) values.
The number of extrema detected from the set of 104 individual measurements in each of the two cases
is reported in Table I.1. The automatic peak detection routine did not work 100% of the time because
some curves did not follow the general shape of the dataset. Such curves lead to detected points that
could be identified visually as clear outliers and were therefore removed from the dataset of extremum
points. Table I.1 shows that the first two minima and maxima cover more than 90% of the individual
measurements, except for the second minimum of the firm application force case, which includes
only 70% of the individual measurements. The low values seen for the third maximum relates to the
fact that this maximum lies around the 6-8 kHz region. As the impedance measurement was limited
to 8 kHz in the present study, any maximum occurring above 8 kHz cannot be detected in this set of
measurements. Therefore the information presented here for the third maximum should be interpreted
with caution.
Table I.1 – Number of extrema detected from the set of 104 individual
measurements for the normal and firm application force cases
Extremum index
Application force case
Normal Firm
Maximum Minimum Maximum Minimum
1 102 98 94 87
2 99 96 91 72
3 44 54
I.4.2.2 Results of the parametric analysis
The resulting set of data points comprises the impedance and frequency values of each detected point;
and the bivariate distribution of this dataset was studied for each extrema and application force case
separately. A scatter plot of the extremum points is presented in Figure I.10 for the normal application
force case (left plot) and the firm application force case (right plot). Three individual impedance
responses are also included in this graph to illustrate how these clouds of points relate to the structural
shape of the human ear impedance. To describe statistically each cloud of points, a bivariate mean
was computed and an ellipse covering 95% of the data points was derived based on the Hotelling
T-squared statistic. Figure I.11 illustrates the resulting structural representation of the individual
human ear measurements for the normal application force case (left plot) and the firm application
force case (right plot). This graph shows that the different clouds are relatively well discriminated. In
Figure I.12, a comparison of the structural mean and the arithmetic mean is shown for the normal
application force case (left plot) and the firm application force case (right plot). In these two plots,
the size of the ellipses represents now the 95% confidence level for the mean value of the extrema,
which can be compared to the 95% confidence interval of the arithmetic mean represented by the
width of the blue and red curves in this figure. These two plots illustrate some differences in the

Rec. ITU-T P.57 (06/2021) 97
characteristics of the structural and arithmetic means for both the normal and firm application force
cases. The frequency of the extrema relate relatively well with the two methods, except perhaps for
the first maximum of the firm application force which shows a slight shift in frequency. However,
the amplitude between two successive extrema (i.e., maximum impedance to minimum impedance)
is about twice larger for the structural mean.
NOTE – The three individual impedance responses shown in these graphs illustrate how the clouds of points relate to the structural
shape of the human ear impedance.
Figure I.10 – Scatter plot of the extremum points derived from the individual human
ear impedance measurements for the normal application force case (left plot)
and the firm application force case (right plot)
NOTE – The clouds of points shown in Figure I.10 are now represented by a bivariate mean and an ellipse covering 95% of the data
points.
Figure I.11 – Structural representation of the individual human ear measurements
for the normal application force case (left plot) and the firm application force case (right plot)
102
103
104
160
180
200
220
Frequency (Hz)
Za*
w (
Mag
nit
ud
e)
Impedance extrema of human meas. - Normal appl. force
Two first minima
of human responses
3 individual
human responses
Three first maxima
of human responses
102
103
104
160
180
200
220
240
Frequency (Hz)
Za*
w (
Mag
nit
ud
e)
Impedance extrema of human meas. - Firm appl. force
102
103
104
180
200
220
240
Frequency (Hz)
Za*
w (
Mag
nit
ud
e)
Structural description of human meas. - Normal appl. force
Structural meanMean of extrema and
ellipse covering 95% of
the individual extrema
102
103
104
180
200
220
240
Frequency (Hz)
Za*
w (
Mag
nit
ud
e)
Structural description of human meas. - Firm appl. force
Mean of extrema and
ellipse covering 95% of
the individual extrema
Structural mean

98 Rec. ITU-T P.57 (06/2021)
NOTE – The size of the ellipses represents now the 95% confidence level for the mean value of the extrema, which can be compared
to the 95% confidence interval of the arithmetic mean represented by the width of the blue and red curves.
Figure I.12 – Comparison of the structural and arithmetic means of the individual human
ear measurements for the normal application force case (left plot)
and the firm application force case (right plot)
I.5 Comparison between human and artificial ear measurements
I.5.1 Univariate comparison of human and artificial ear measurements
The series of graphs presented in this clause summarizes the results of the set of round-robin test
measurements made in this study from a univariate viewpoint. The graphs presented in Figures I.13
and I.14 compare the arithmetic means of the human ear measurements with the set of measurements
made on the two artificial ear types at nine different application forces (from 2 to 18 N increasing by
2 N steps). Figure I.13 focuses on the measurements made on the artificial ear type 3.3 while
Figure I.14 focuses on the type 3.4 ear. The curve shown on the left plot of each figure (blue curve)
corresponds to the mean of the human ear measurements made with a normal application force and
the curve shown on the right plot (red curve) corresponds to the mean of the human ear measurements
made with a firm application force. The width of the red and blue curves represents the 95%
confidence interval about the human ear measurement mean per frequency bin.
102
103
104
180
200
220
240
Frequency (Hz)
Za*
w (
Mag
nit
ud
e)
Structural model of human meas. - Normal appl. force
Structural mean95% confidence ellipse
of the extremum mean
Arithmetic mean
and 95% conf. interv.
Normal appl. force
102
103
104
180
200
220
240
Frequency (Hz)
Za*
w (
Mag
nit
ud
e)
Structural model of human meas. - Firm appl. force
95% confidence ellipse
of the extremum mean
Structural mean
Arithmetic mean
and 95% conf. interv.
Firm appl. force

Rec. ITU-T P.57 (06/2021) 99
NOTE – The width of the red and blue curves represents the 95% confidence interval about the human ear measurement mean per
frequency bin.
Figure I.13 – Comparison between the human ear measurements made with normal
application force (left plot) and with firm application force (right plot)
and the measurements made on the artificial ear type 3.3
at nine different application forces
NOTE – The width of the red and blue curves represents the 95% confidence interval about the human ear measurement mean per
frequency bin.
Figure I.14 – Comparison between the human ear measurements made with normal
application force (left plot) and with firm application force (right plot)
and the measurements made on the artificial ear type 3.4
at nine different application forces
I.5.2 Bivariate parametric comparison of human and artificial ear measurements
The series of graphs presented in this clause summarizes the results of the set of round-robin test
measurements made in this study from a bivariate structural analysis viewpoint. The graphs presented
in Figures I.15 and I.16 compare the structural model of the human ear measurements with the
amplitude extrema of the two artificial ear types at nine different application forces (from 2 to 18 N
increasing by 2 N steps). Figure I.15 focuses on the measurements made on the artificial ear type 3.3,
while Figure I.16 focuses on the type 3.4 ear. The structural means shown in these graphs have been
described in clause I.4.2, but it should be noted that the ellipses presented here describe the
102
103
104
160
180
200
220
Frequency (Hz)
Za*
w (
Mag
nit
ud
e)
Average of human meas. at Normal ap. force versus 3.3
From low (2N) to
high pressure (18N)
102
103
104
160
180
200
220
Frequency (Hz)
Za*
w (
Mag
nit
ud
e)
Average of human meas. at Firm force versus 3.3
From low (2N) to
high pressure (18N)
102
103
104
160
180
200
220
Frequency (Hz)
Za*
w (
Mag
nit
ud
e)
Average of human meas. at Normal ap. force versus 3.4
From low (2N) to
high pressure (18N)
102
103
104
160
180
200
220
Frequency (Hz)
Za*
w (
Mag
nit
ud
e)
Average of human meas. at Firm ap. force versus 3.4
From low (2N) to
high pressure (18N)

100 Rec. ITU-T P.57 (06/2021)
distribution of the detected extrema, as in Figure I.11, and not the 95% confidence ellipse of the mean
as in Figure I.12. These ellipses are better suited to visually check how well the amplitude extrema
of a given artificial ear type and application force relates to the associated distribution of individual
ear impedance extrema.
Figure I.15 – Comparison between the human ear measurements made with normal
application force (left plot) and with firm application force (right plot)
and the measurements made on the artificial ear type 3.3
at nine different application forces
Figure I.16 – Comparison between the human ear measurements made with normal
application force (left plot) and with firm application force (right plot)
and the measurements made on the artificial ear type 3.4
at nine different application forces
I.5.3 Comparison between human measurements and type 3.2 artificial ear measurements
Included in this clause are the results of the human ear analysis described herein presented with the
results of equivalent measurement on a type 3.2 low-leak (Figure I.17) and type 3.2 high-leak
(Figure I.18) artificial ear. Artificial ear measurement data are supplied by Brüel & Kjær as a
normative reference to the round-robin study results.
102
103
104
180
200
220
240
Frequency (Hz)
Za*
w (
Mag
nit
ud
e)
Structural model of hum. meas. at Normal force versus 3.3
From low (2N) to
high pressure (18N)
Structural mean
Normal appl. forceMean of extrema and
ellipse covering 95% of
the individual extrema
102
103
104
180
200
220
240
Frequency (Hz)
Za*
w (
Mag
nit
ud
e)
Structural model of hum. meas. at Firm force versus 3.3
From low (2N) to
high pressure (18N)
Structural mean
Firm appl. forceMean of extrema and
ellipse covering 95% of
the individual extrema
102
103
104
180
200
220
240
Frequency (Hz)
Za*
w (
Mag
nit
ud
e)
Structural model of hum. meas. at Normal force versus 3.4
From low (2N) to
high pressure (18N)
Structural mean
Normal appl. forceMean of extrema and
ellipse covering 95% of
the individual extrema
102
103
104
180
200
220
240
Frequency (Hz)
Za*
w (
Mag
nit
ud
e)
Structural model of hum. meas. at Firm force versus 3.4
From low (2N) to
high pressure (18N)
Structural mean
Firm appl. forceMean of extrema and
ellipse covering 95% of
the individual extrema

Rec. ITU-T P.57 (06/2021) 101
NOTE – The width of the gray curves represents the 95% confidence interval of the human ear measurement mean per frequency bin.
Figure I.17 – Comparison between the measurements made on the type 3.2 artificial ear
and the human ear measurements made at normal application force (left plot)
and at firm application force (right plot)
Figure I.18 – Comparison between the measurements made on the type 3.2 artificial ear
and the structural model derived from the human ear measurements made at normal
application force (left plot) and at firm application force (right plot)
102
103
104
160
180
200
220
Frequency (Hz)
Za*
w (
Mag
nit
ud
e)
Average of human meas. at Normal ap. force versus 3.2
Type 3.2 high-leak
Type 3.2 low-leak
Type 3.3 normal appl. force
102
103
104
160
180
200
220
Frequency (Hz)
Za*
w (
Mag
nit
ud
e)
Average of human meas. at Firm ap. force versus 3.2
Type 3.2 high-leak
Type 3.2 low-leak
Type 3.3 firm appl. force
102
103
104
180
200
220
240
Frequency (Hz)
Za*
w (
Mag
nit
ud
e)
Structural model of hum. meas. at Normal force versus 3.2
Structural meanMean of extrema and
ellipse covering 95% of
the individual extrema
Type 3.2 low-leak
Type 3.2 high-leak
102
103
104
180
200
220
240
Frequency (Hz)
Za*
w (
Mag
nit
ud
e)
Structural model of hum. meas. at Firm force versus 3.2
Mean of extrema and
ellipse covering 95% of
the individual extrema
Type 3.2 low-leak
Type 3.2 high-leak
Structural mean

102 Rec. ITU-T P.57 (06/2021)
I.5.4 Identification of outliers from the box plot analysis
NOTE – This box plot highlights the subject index of the outlier data points for the different frequency bins.
Figure I.19 – Human ear measurements in the normal application force case

Rec. ITU-T P.57 (06/2021) 103
NOTE – This box plot highlights the subject index of the outlier data points for the different frequency bins.
Figure I.20 – Human ear measurements in the firm application force case

104 Rec. ITU-T P.57 (06/2021)
I.5.5 Study of factor effects by univariate analysis of variance
Table I.2 – ANOVA applied separately to each frequency bin with the factors Lab (5 levels),
Force (normal or firm), Subject (nested in Lab) and the interaction Lab × Force
Significant levels are represented as follows: *, P < 0.05; **, P < 0.01; ***,
P < 0.001.
F-ratio Sig. Level F-ratio Sig. Level F-ratio Sig. Level F-ratio Sig. Level
200 14.05 *** 0.07 2.42 *** 9.52 ***
212 0.87 194.66 *** 4.14 *** 6.09 ***
224 1.19 252.54 *** 5.48 *** 7.37 ***
236 1.09 262.33 *** 5.72 *** 7.04 ***
250 1.17 266.93 *** 6.13 *** 8.42 ***
265 1 292.44 *** 6.54 *** 8.07 ***
280 1.16 289.59 *** 6.77 *** 7.08 ***
300 1.15 312.74 *** 7.06 *** 6.27 ***
315 1.03 318.61 *** 7.5 *** 6.8 ***
335 1 271.04 *** 6.53 *** 5.53 ***
355 1.19 303.78 *** 6.76 *** 6.13 ***
375 1.27 306.91 *** 6.9 *** 6.67 ***
400 1.44 314.48 *** 6.68 *** 6.72 ***
425 1.51 307.64 *** 6.61 *** 6.08 ***
450 1.57 313.85 *** 6.63 *** 6.74 ***
475 1.64 311.82 *** 6.55 *** 6.53 ***
500 1.74 313.5 *** 6.53 *** 6.32 ***
530 1.74 309.54 *** 6.48 *** 6.22 ***
560 1.79 295.51 *** 6.32 *** 5.58 ***
600 1.82 280.43 *** 6.02 *** 5.04 ***
630 1.79 276.86 *** 5.92 *** 4.46 **
670 1.69 253.77 *** 5.73 *** 3.67 **
710 1.56 230.31 *** 5.44 *** 3.34 *
750 1.45 204.23 *** 5.08 *** 2.78 *
800 1.26 168.08 *** 4.46 *** 2.02
850 1.11 131.66 *** 3.84 *** 1.54
900 0.98 98.74 *** 3.24 *** 1.17
950 0.77 75.06 *** 2.79 *** 1.05
1000 0.67 53.26 *** 2.3 *** 0.97
1060 0.53 33.56 *** 1.75 ** 0.86
1120 0.5 20.49 *** 1.43 * 1.04
1180 0.46 11.22 ** 1.22 1.03
1250 0.72 4.26 * 1.1 1.12
1320 1.14 0.85 1.14 1.03
1400 1.37 0.06 1.36 1.02
1500 1.33 1.4 2.02 *** 0.95
1600 1.35 3.24 3.1 *** 1.04
1700 1.5 3.32 4.06 *** 1.1
1800 1.94 1.62 4.56 *** 1.06
1900 2.92 * 0.01 4.57 *** 0.91
2000 4.19 ** 2.72 4.27 *** 0.6
2120 5.13 *** 15.03 *** 4.14 *** 0.66
2240 4.52 ** 37.25 *** 4.19 *** 1.71
2360 3.03 * 61.49 *** 4.4 *** 2.47 *
2500 1.9 90.8 *** 4.99 *** 3.08 *
2650 1.16 112.9 *** 5.69 *** 3.46 *
2800 0.81 110.26 *** 5.61 *** 3.92 **
3000 1 93.99 *** 5.3 *** 3.97 **
3150 1.74 73.31 *** 4.75 *** 3.08 *
3350 2.16 54.39 *** 4.87 *** 2.87 *
3550 2.16 52.21 *** 6.13 *** 3 *
3750 2.09 59.8 *** 7.4 *** 3.33 *
4000 2.45 59.15 *** 6.77 *** 4.02 **
4250 2.67 * 40.23 *** 4.37 *** 3.25 *
4500 2.46 24.17 *** 2.62 *** 2.6 *
4750 1.92 12.35 *** 2.39 *** 2.91 *
5000 1.15 5.11 * 2.24 *** 1.83
5300 0.44 2.61 2.51 *** 0.66
5600 0.26 0.97 2.65 *** 0.4
6000 0.24 0.01 2.86 *** 0.47
6300 0.05 0.28 2.69 *** 0.71
6700 0.41 0.1 3.05 *** 1.07
7100 0.42 0.29 3.5 *** 1.01
7500 0.49 0.04 3.55 *** 1.02
8000 0.11 0 3.64 *** 1.36
Lab*Force
Frequency
Lab Force Subject(Lab)

Rec. ITU-T P.57 (06/2021) 105
Table I.3 – ANOVA applied separately to each frequency bin with the factors Gender
(male or female), Force (normal or firm), Subject (nested in Gender)
and the interaction Gender × Force
Significant levels are represented as follows: *, P < 0.05; **, P < 0.01; ***,
P < 0.001.
F-ratio Sig. Level F-ratio Sig. Level F-ratio Sig. Level F-ratio Sig. Level
200 3.11 1.12 2.7 *** 1.39
212 0.83 154.63 *** 3.43 *** 0.37
224 0.5 197.02 *** 4.42 *** 0.4
236 0.88 212.18 *** 4.66 *** 1.02
250 0.62 203.99 *** 4.77 *** 0.25
265 0.71 227.42 *** 5.17 *** 1.54
280 0.47 233.91 *** 5.52 *** 0.66
300 0.28 261.01 *** 5.9 *** 0.31
315 0.33 264.12 *** 6.13 *** 0.31
335 0.12 237.12 *** 5.55 *** 0.01
355 0.1 258.66 *** 5.68 *** 0.01
375 0.13 256.6 *** 5.72 *** 0.23
400 0.15 259.98 *** 5.58 *** 0.45
425 0.12 259.59 *** 5.64 *** 0.39
450 0.13 256.59 *** 5.56 *** 0.47
475 0.07 256.78 *** 5.56 *** 0.62
500 0.05 260.17 *** 5.61 *** 0.81
530 0.05 256.53 *** 5.61 *** 1.2
560 0.04 250.63 *** 5.58 *** 1.01
600 0.01 242.4 *** 5.43 *** 1.13
630 0.02 244.32 *** 5.43 *** 0.93
670 0.04 231.23 *** 5.37 *** 0.85
710 0.04 211.97 *** 5.13 *** 0.68
750 0.06 191.94 *** 4.84 *** 0.31
800 0.09 163.45 *** 4.33 *** 0.07
850 0.12 131.71 *** 3.77 *** 0
900 0.11 102.02 *** 3.21 *** 0.13
950 0.15 80.16 *** 2.76 *** 0.43
1000 0.22 58.52 *** 2.29 *** 0.78
1060 0.42 38.46 *** 1.73 ** 1.13
1120 0.56 24.14 *** 1.41 * 1.33
1180 0.78 14.14 *** 1.19 1.21
1250 1.07 6.24 * 1.08 1.57
1320 1.19 1.94 1.16 1.97
1400 1.93 0.08 1.38 2.41
1500 4.29 * 0.42 2.01 *** 2.1
1600 8.97 ** 1.68 2.91 *** 0.95
1700 14.81 *** 1.93 3.61 *** 0.15
1800 20.78 *** 0.94 3.92 *** 0.07
1900 23.28 *** 0.01 4.05 *** 1.01
2000 21.04 *** 2.67 4.16 *** 2.96
2120 15.19 *** 13.44 *** 4.43 *** 4.69 *
2240 8.93 ** 31.54 *** 4.43 *** 4.09 *
2360 3.93 * 52.23 *** 4.41 *** 2.08
2500 1.06 79.06 *** 4.75 *** 0.53
2650 0.11 99.94 *** 5.22 *** 0.01
2800 0.06 96.8 *** 5.01 *** 0.1
3000 0.13 84.83 *** 4.78 *** 0.89
3150 0.05 71.82 *** 4.58 *** 1.58
3350 2.7 55.36 *** 4.65 *** 0.57
3550 7.42 ** 52.43 *** 5.55 *** 0.13
3750 11.98 *** 55.3 *** 6.33 *** 0.02
4000 16.43 *** 48.86 *** 5.54 *** 0.64
4250 15.9 *** 34.94 *** 3.71 *** 0.26
4500 8.05 ** 23.84 *** 2.42 *** 0.26
4750 1.46 14.56 *** 2.35 *** 3.54
5000 0.09 7.59 ** 2.32 *** 6.23 *
5300 0.08 4.64 * 2.61 *** 5.2 *
5600 0.91 1.48 2.65 *** 1.42
6000 1.14 0.01 2.81 *** 0.08
6300 1 0.03 2.62 *** 0.98
6700 0.22 0.59 3.02 *** 1.61
7100 0 0.72 3.46 *** 1.2
7500 0.19 0 3.49 *** 0.67
8000 0.83 0.18 3.46 *** 0.75
Gender*Force
Frequency
Gender Force Subject(Gender)

106 Rec. ITU-T P.57 (06/2021)
Appendix II
Illustration of the mobile phone-shaped impedance probe used in Appendix I
(This appendix does not form an integral part of this Recommendation.)
Figures II.1 and II.2 illustrate the mobile phone-shaped impedance probe used in Appendix I.
NOTE – All numbers indicate measures in mm.
Figure II.1 – The mobile phone shaped impedance probe viewed from the side
and from the front

Rec. ITU-T P.57 (06/2021) 107
Figure II.2 – 3D view of the mobile phone-shaped impedance probe

108 Rec. ITU-T P.57 (06/2021)
Bibliography
[b-ASTM D2240-15] ASTM D2240-15 (2021), Standard Test Method for Rubber Property –
Durometer Hardness. <http://www.astm.org/Standards/D2240.htm>
[b-ISO 3] ISO 3:1973, Preferred numbers – Series of preferred numbers. <http://www.iso.org/iso/iso_catalogue/catalogue_tc/catalogue_detail.htm?csnumber=3564>
[b-ISO 48-4] ISO 48-4:2018, Rubber, vulcanized or thermoplastic – Determination of
hardness – Part 4: Indentation hardness by durometer method (Shore
hardness). https://www.iso.org/standard/74969.html


Printed in Switzerland Geneva, 2021
SERIES OF ITU-T RECOMMENDATIONS
Series A Organization of the work of ITU-T
Series D Tariff and accounting principles and international telecommunication/ICT economic and
policy issues
Series E Overall network operation, telephone service, service operation and human factors
Series F Non-telephone telecommunication services
Series G Transmission systems and media, digital systems and networks
Series H Audiovisual and multimedia systems
Series I Integrated services digital network
Series J Cable networks and transmission of television, sound programme and other multimedia
signals
Series K Protection against interference
Series L Environment and ICTs, climate change, e-waste, energy efficiency; construction, installation
and protection of cables and other elements of outside plant
Series M Telecommunication management, including TMN and network maintenance
Series N Maintenance: international sound programme and television transmission circuits
Series O Specifications of measuring equipment
Series P Telephone transmission quality, telephone installations, local line networks
Series Q Switching and signalling, and associated measurements and tests
Series R Telegraph transmission
Series S Telegraph services terminal equipment
Series T Terminals for telematic services
Series U Telegraph switching
Series V Data communication over the telephone network
Series X Data networks, open system communications and security
Series Y Global information infrastructure, Internet protocol aspects, next-generation networks,
Internet of Things and smart cities
Series Z Languages and general software aspects for telecommunication systems