j. chem. thermodynamics - concordia university
TRANSCRIPT

J. Chem. Thermodynamics 93 (2016) 242–254
Contents lists available at ScienceDirect
J. Chem. Thermodynamics
journal homepage: www.elsevier .com/locate / jc t
Thermodynamic modelling and in-situ neutron diffractioninvestigation of the (Ce + Mg + Zn) system
http://dx.doi.org/10.1016/j.jct.2015.10.0080021-9614/� 2015 Elsevier Ltd. All rights reserved.
⇑ Corresponding author.
Zhijun Zhu a, Michael A. Gharghouri b, Mamoun Medraj c, Soo Yeol Lee d, Arthur D. Pelton a,⇑aCentre de Recherche en Calcul Thermochimique, Département de Génie Chimique, Ecole Polytechnique, Montréal, Québec, CanadabCanadian Neutron Beam Centre, Canadian Nuclear Laboratories, Chalk River, Ontario, CanadacDepartment of Mechanical Engineering, Concordia University, Montréal, Québec, CanadadDepartment of Materials Science and Engineering, Chungnam National University, Daejeon 305-764, Republic of Korea
a r t i c l e i n f o a b s t r a c t
Article history:Received 27 July 2015Received in revised form 10 September2015Accepted 6 October 2015Available online 23 October 2015
Keywords:(Ce + Mg + Zn) systemPhase diagramIn-situ neutron diffractionThermodynamic assessmentThermodynamic optimization
All available phase diagram data for the (Ce + Mg + Zn) system were critically assessed. In-situ neutrondiffraction (ND) experiments were performed on selected samples to identify phases and transitiontemperatures. A critical thermodynamic evaluation and optimization of the (Ce + Mg + Zn) system werecarried out and model parameters for the thermodynamic properties of all phases were obtained. Thephase transformation behaviour of selected samples was well resolved from the ND experiments andexperimental data were used to refine the thermodynamic model parameters.
� 2015 Elsevier Ltd. All rights reserved.
1. Introduction
Magnesium being the lightest structural metal, Mg-based alloyshave many applications. Zinc is one of the most commonly usedalloying elements in Mg (AZ series), and the rare earth (RE) metalshave been shown to improve creep resistance [1,2] and sheetformability (by reducing texture [3–6]).
Information on phase behaviour is essential for the design ofnew (RE + Mg + Zn) alloys. However, few studies of the phasediagrams and thermodynamic properties of these systems havebeen made. The present study was thus undertaken to betterdefine the phase diagrams of the (RE + Mg + Zn) ternary systemsthrough the technique of critical thermodynamic assessment andoptimization coupled with limited experimentation.
In a thermodynamic optimization, adjustable model parametersare calculated using all available thermodynamic and phase-equilibrium data in order to obtain one set of model equations asfunctions of temperature and composition. Thermodynamic data,such as activities, can aid in the evaluation of the phase diagrams,and information on phase equilibria can be used to deduce thermo-dynamic properties. With this technique, it is frequently possibleto resolve discrepancies in the available data. From the model
equations, all of the thermodynamic properties and phase dia-grams can be back-calculated, and interpolations and extrapola-tions can be made in a thermodynamically correct manner. Thethermodynamic properties and phase diagrams are thereby ren-dered self-consistent and consistent with thermodynamic princi-ples, and the available data are distilled into a small set of modelparameters, ideal for computer storage. Generally, in the optimiza-tion of a ternary system one begins by optimizing the three binarysub-systems. The binary model parameters are then used to esti-mate the properties of the ternary phases, and these estimatesare then refined by introducing ternary model parameters whererequired to reproduce available ternary data.
Thermodynamic evaluations and optimizations have alreadybeen reported for the binary (Mg + Zn) system [7], all binary (Mg+ RE) systems [8–11] and all binary (RE + Zn) systems (as well as(Sc + Zn) and (Y + Zn) [12,13]. The liquid phase of the (Mg + Zn)system has been re-modeled in the present work with the ModifiedQuasichemical Model (MQM) as will be discussed in Section 4. Inthe present article we report on our evaluation, optimization andexperimental phase diagram study of the (Ce + Mg + Zn) system.In subsequent articles, we shall report on our evaluations and opti-mizations of other (RE + Mg + Zn) systems as well as on our evalu-ation, optimization and experimental phase diagram study of the(Nd + Mg + Zn) system. As expected, all (RE + Mg + Zn) systems

Z. Zhu et al. / J. Chem. Thermodynamics 93 (2016) 242–254 243
are very similar. The present work on the (Ce + Mg + Zn) systemwas greatly aided by our simultaneous assessments of all the other(RE + Mg + Zn) systems.
2. Phase equilibrium and thermodynamic data
The (Ce + Mg + Zn) system has been investigated by severalauthors. Different ternary phase names were used by differentauthors. Phases with ternary phase fields considered in the presentoptimization are summarized in table 1. All these phases can alsobe seen in the calculated isothermal section at 350 �C shown in fig-ure 1. Our nomenclature for the ternary phases s1 to s7 is in agree-ment with that of Pavlyuk et al. [14]. The same nomenclature willbe adopted for similar phases in other (RE + Mg + Zn) systems inour future reports. The phase Ce(Mg,Zn) in table 1 is a solid solu-tion of CeMg and CeZn. The CeMg3 and CeMg12 phases are solidsolutions with limited solubility of Zn. Although Pavlyuk et al.[14] and Mostafa and Medraj [20] suggested some solubility ofMg in CeZn3, Ce3Zn11, CeZn5, a-Ce2Zn17 and CeZn11, we haveassumed that these and all other binary phases do not extend intothe ternary system. The prototypes, Pearson symbols and spacegroups of all binary phases were given previously [7,8,12].Although Ce2Mg17 and a-Ce2Zn17 have the same structure, theyare treated as separate phases in the present study.
The (Ce + Mg + Zn) system was first investigated by Korol’kovand Sal’dau [16] by thermal analysis (TA). An invariantequilibrium at (341 to 343) �C was reported at a composition of50Mg–47.5Zn–2.5Ce (wt.%). Later, an isothermal section at300 �C was established by Mel’nik et al. [17] using X-ray diffrac-tion (XRD) analysis. A total of 150 samples were studied, mostof which were located in the region bounded by Mg, MgZn2, CeZn
TABLE 1Phases with ternary phase fields in the (Ce + Mg + Zn) system.
Phase name Prototype–Pearson symbol–space group Thermodynami
Ce(Mg,Zn) CsCl–cP2–Pm�3m [14] (Ce,Mg)(Mg,Zn)CeMg3 BiF3–cF16–Fm�3m [14] (Ce,Mg)(Mg,Zn)
CeMg12 Mn12Th–tI26–I4=mmm [14] Ce(Mg,Zn)12
s1 Al11La3–oI28–Immm [25] Ce3Zn9(Mg,Zn)2
s2 Unknown Ce2Mg53Zn45
s3 MnCu2Al–cF16–Fm3 m [14,26] CeMg(Mg,Zn)2
s4 TbCu7–hP8–P6=mmm [14] Ce2Mg5Zn9
s5 Ce3Mg13Zn30–hP92–P63=mmc [14] Ce3Mg13Zn30
s6 Unknown Ce6Mg11Zn83
s7 Ce20Mg19Zn81–cF480–F43 m [27] Ce20Mg19Zn81
* Elements within brackets substitute on the same sublattice.
and CeMg. Four ternary compounds were identified and their for-mulae were proposed as follows: CeMg7Zn12, �CeMg3Zn5,Ce2Mg3Zn3, and �Ce(Mg0.50�0.85Zn0.5�0.15)9. Some of the binaryand ternary compounds were reported to have limited ternaryhomogeneity ranges (see table 1), while CeMg and CeZn werefound to form a continuous solid solution. Kolitsch et al. [18]reviewed all the experimental work on the (Ce + Mg + Zn) systemup to the year 2000. The isothermal section at 300 �C proposed byMel’nik et al. [17] was redrawn by Kolitsch et al. [18] to make itconsistent with the accepted (Mg + Zn) binary phase diagram[19]. The four ternary compounds were denoted s1, s3, s4, s2respectively by Kolitsch et al. [18]; these are the phases calleds5, s4, s3 and CeMg12, respectively, in the present work.
By means of XRD, TA and scanning electron microscopy (SEM),two isopleths were established by Drits et al. [21] in the Mg-richregion, as shown in figure 2. Two ternary phases were also identi-fied: Ce(Mg0.9�0.5Zn0.1�0.5)10.1 (believed to correspond to theCeMg12 solid solution in the present work) and CeMg7Zn12
(believed to correspond to s5 in the present work).A ternary phase with constant Ce content of �7.7 at.% was
reported by Huang et al. [23,24] based on their analysis of equilib-rium alloys at (350 and 400) �C. This phase is treated as CeMg12 inthe present study.
Using diffusion couple techniques, Kevorkov and Pekguleryuz[15] investigated the (Ce + Mg + Zn) phase diagram at 350 �C. Theirpoints are shown in figure 1. These points all represent single-phasecompositions [15]. Solubilities in binary and ternary solid solutionswere determined by energy dispersive spectroscopy (EDS) and elec-tron probe microanalysis (EPMA). Two new ternary compounds,called s2 and s6 in the present work, were reported. The s2 phasewas denoted as �Ce2Mg53Zn45 while s6 was reported to be a solid
c model*
CeMg and CeZn form continuous solution [14,15,17,20]
3 Reported Zn solubility 30 at.% at 300 �C [17]Reported Zn solubility 36 at.% at 350 �C [15]Reported Zn solubility 40 at.% at 197 �C [14]Reported Zn solubility 28.4 at.% at 300 �C [20]Reported as �Ce(Mg0.50-0.85Zn0.5-0.15)9 [17]s2 in Ref. [18] with Zn content up to 45 at.%Reported as phase 1, with Zn content 0 to 48.49 at.% at350 �C[15], Ce(Mg0.9-0.5Zn0.1-0.5)10.1 in Ref. [21]Reported as Ce(Mg0.9-0.5Zn0.1-0.5)10.1 [22]Reported Zn solubility 44.5 at.% at 197 �C [14]Reported Zn solubility 43.6 at.% at 350 and 400 �C [23,24]Reported Zn solubility 39.4 at.% at 300 �C [20]Reported as s1 with Zn content 64.3 to 69 at.% [14]Reported as s1 (Ce6Mg3Zn19) [20]Assumed stoichiometric in present studyPhase 2 in Ref. [15], s2 in Ref. [14]Reported as s2 (CeMg29Zn25) [20]Reported as s3 in Ref. [14] with Zn content 38 to 50 at.%Phase 3 in Ref. [15] with proposed Zn content 45 to 50 at.%Phase 3 in Ref. [17] with Zn content 35 to 45 at.%Reported as s3 in Ref. [18]Reported as s3 in Ref. [20] with Zn content 35 to 52 at.%Assumed stoichiometric in present studyPhase 2 in Ref. [17], s3 in Ref. [18]Phase 4 in Ref. [15], s4 in Refs. [14] and [20]Assumed stoichiometric in present study. Phase 1 in Ref. [17],s1 in Ref. [18], phase 5 in Ref. [15], s5 in Refs. [14] and [20]CeMg7Zn12 in ref [21]Assumed stoichiometric in present studyPhase 6 in Ref. [15], s6 in Refs. [14] and [20]Assumed stoichiometric in present study, s6 in Ref. [14]Reported as s7 [20]

FIGURE 1. Calculated optimized isothermal section (mole fraction) of the (Ce + Mg + Zn) system at 350 �C showing data points of Kevorkov and Pekguleryuz [15] whichindicate single-phase regions. Compositions of the four samples used in the present ND experiments are also shown.
FIGURE 2. Calculated optimized isopleths with constant Zn content of 24 wt.% (a) and 34 wt.% (b) in the (Ce + Mg + Zn) system showing points from Drits et al. [21].
244 Z. Zhu et al. / J. Chem. Thermodynamics 93 (2016) 242–254
solution with constant Ce content of �6 at.% and Mg content of(�7.5 to 14.5) at.%. Due to its limited solubility and unknowncrystal structure, s6 is assumed to be a stoichiometric phase inthe present work as shown in table 1. The Ce(Mg0.9�0.5Zn0.1�0.5)10.1phase reported in Ref. [22] was shown to be part of the CeMg12
solution which can dissolve Zn up to 48.49 at.% according to theEDS measurements.
The (Ce + Mg + Zn) system was later investigated by Chiu et al.[28]. Ten samples were prepared and studied by Differential Scan-ning Calorimetry (DSC). However, only data from Mg-rich samples

Z. Zhu et al. / J. Chem. Thermodynamics 93 (2016) 242–254 245
were interpreted by the authors. Some of the tie-triangles wereexperimentally validated but no details of the experiments weregiven. Their results will be shown later in Section 5.
An isothermal section at 197 �C was later constructed byPavlyuk et al. [14] using XRD, wavelength dispersive spectrometry(WDS) and EPMA. Their diagram will be shown later in Section 5. Atotal of 53 samples were prepared covering the entire ternary com-position range. All ternary compounds reported by Kevorkov andPekguleryuz [15] were confirmed. In addition, two new com-pounds were identified: Ce3(Zn0.863Mg0.137)11 and Ce20Mg19Zn81
(s1 and s7 in the present work). Although Ce3(Zn0.863Mg0.137)11and Ce3Zn11 have the same structural prototype, Pavlyuk et al.[14] treated them as two separate phases. They argued that thelattice parameters of these two phases differ significantly and asample consisting of these two phases at equilibrium was observed.
The isothermal section at 300 �C was recently investigated byMostafa and Medraj [20] over the entire composition range usingdiffusion couples. Their reported isothermal section [20] is shownlater in figure 6(a). All the ternary phases reported by Pavlyuk et al.[14] were confirmed. In addition, the ternary solution phaseproposed by Huang et al. [23,24] was also reported, but its crystalstructure was not resolved.
Based on the available experimental data from the literature,the following phases with ternary phase fields are considered inthe present work (see figure 1 and table 1).
Ce(Mg,Zn): The CeMg and CeZn binary phases both havethe CsCl structure and in all reported isothermal sections[14,15,17,20] they form a continuous solution. The reported latticeconstant of CeMg at room temperature is 0.3898 nm [29] and thatof CeZn is 0.3696 nm [30], while that of the Ce(Mg,Zn) solution is0.3730 nm at 40 at.%Zn and 0.384 nm at 10 at.%Zn [14]. The Cecontent is nearly constant at 50 at.%. Consequently, the model(Ce,Mg)(Mg,Zn) was chosen in the present optimization, in whichMg and Zn substitute on one sublattice while Ce occupies a secondsublattice. A small amount of Mg can also occupy the RE sublattice,as evidenced by the slight solubility of Mg in REMg as consideredpreviously [8–11].
CeMg3: Zn can substitute for Mg in CeMg3 [14,15,17,20]. Conse-quently, the model (Ce,Mg)(Mg,Zn)3 is used. The phase has thesame structure as CeMg3. The solubility of Zn in CeMg3 as reportedby different authors is summarized in table 1. The lattice constantof binary CeMg3 was reported to be 0.7443 nm [31], decreasingwith increasing Zn content to 0.7077 nm at 40 at.%Zn [14] whichis due to the smaller atomic radius of Zn compared to Mg.
CeMg12: A ternary phase with approximately thesame mole fraction of Ce (�Ce(Mg0.50-0.85Zn0.5-0.15)9 [17], Ce(Mg0.9-0.5Zn0.1-0.5)10.1 [21], a ternary phase with �7.7 at.% Ce[23,24] and s8 in ref [20]) was reported by several investigatorswho treated the ternary phase and CeMg12 as separate phases.However, other investigators reported [14,15,28] that the ternaryphase is actually continuous with CeMg12 (see figure 1). This pointis still a subject of controversy. In the present work, we have foundthat one continuous phase with the model Ce(Mg,Zn)12 is mostconsistent with all the data.
s1: The structural prototype of both s1 and the Ce3Zn11 binaryphase is Al11La3. However, Pavlyuk et al. [14] showed that theyhave been observed to coexist and their lattice constants differsignificantly; the lattice constant of s1, when extrapolated to thebinary composition of Ce3Zn11, does not coincide with that ofCe3Zn11. Hence, in the present work, we treat them as two separatephases. In the Al11La3 prototype there are 6 distinct sites: 2a, 2c, 4g,4j and two 8l sites [32], the 2a and 4g sites being occupied by La.The crystal structure of s1 was resolved by Pavlyuk et al. from sin-gle crystal data [25]: the 2a and 4g sites are occupied solely by Ce(Ce does not enter the other sites, thereby giving a constant Cemole fraction); the two 8l sites are occupied solely by Zn and the
2c and 4j sites can be occupied by Mg and Zn. However, sincethe lowest Zn content reported by Pavlyuk et al. [14] was 64.2 at.%, which is the case when the 2c and the two 8l sites are fullyoccupied by Zn and the 4j sites are fully occupied by Mg, the modelCe2Zn2Ce4(Mg,Zn)4Zn8Zn8 (simplified to Ce3Zn9(Mg,Zn)2) seemsmore reasonable for s1.
s2: This phase was reported as phase 2 by Kevorkov and Pekgu-leryuz [15], as s2 by Pavlyuk et al. [14], and as s2 (CeMg29Zn25) byMostafa and Medraj [20]. The crystal structure remains unknown.EDS measurements [15] gave a composition of Ce1.82Mg53.14Zn45.04
in good agreement with EPMA measurements [14], which gave acomposition of Ce1.8Mg53.1Zn45.1. No solubility information on thisphase can be found. Consequently, it is treated in the present workas a stoichiometric compound, with the suggested formulaCe2Mg53Zn45.
s3: The s3 phase was first reported by Mel’nik et al. [17] with alattice constant of 0.7064 nm. The prototype was reported to beeither MgLi2Ag or AlMnCu2. The crystal structure was laterresolved by Pavluyk et al. [14,26]; the prototype was determinedfrom single crystal X-ray diffraction measurements to be AlMnCu2
with a lattice constant ranging from (0.7035 to 0.7036) nmdepending on the Zn content. Given that the maximum Zn contentof this phase is reported as 50 at.% [14,15], 45 at.% [17], or 52 at.%[20], the model CeMg(Mg,Zn)2 is used in the present work.
s4, s5, s6 and s7: Although some limited solubility is reportedfor these four phases [14,15,17,20], they are treated in the presentwork as stoichiometric phases, with suggested stoichiometriesCe2Mg5Zn9, Ce3Mg13Zn30, Ce6Mg11Zn83, and Ce20Mg19Zn81, respec-tively, based on the reported compositions. The crystal structuresof s4 and s5 were obtained by Pavlyuk et al. [14] from XRD powderdiffraction data while that of s7 was resolved from single crystaldata [27]. The crystal structure of s6 remains unknown.
It may be noted that phases similar to all the ternary phasesshown in table 1 have been observed in several other (RE + Mg+ Zn) systems with the exception of the s1, s2, s6 and s7 phases.However, investigations have not been carried out in the composi-tion regions where these four phases appear in any system otherthan the (Ce + Mg + Zn) and (Nd + Mg + Zn) systems (s1, s2, ands7 were reported in the (Nd + Mg + Zn) system [33]).
3. Experimental investigation
In-situ neutron diffraction (ND) was used in the present work toinvestigate the phase transformation behaviour in order to validateand refine the thermodynamic modelling.
Neutron diffraction data were acquired using the C2 powderdiffractometer of the Canadian Neutron Beam Centre, located atthe National Research Universal (NRU) reactor, Canadian NuclearLaboratories (CNL). Diffraction from the (531) reflection of a siliconsingle crystal monochromator produced incident neutrons with anominal wavelength of 0.133 nm. The C2 diffractometer isequipped with an 800-channel detector covering an 80� range inscattering angle 2h, allowing multiple diffraction peaks to beacquired simultaneously.
The four sample compositions shown in figure 1 and table 1were selected based on preliminary optimizations of the isother-mal phase diagram at 300 �C. Sample compositions correspondingto three-phase regions were chosen as they were expected to exhi-bit the greatest number of transitions, thereby providing the mostinformation.
All samples were prepared from Ce (99.9 wt.%, STREM Chemi-cals Inc., Newburyport, MA, USA), Mg (99.8 wt.%, CANMET Materi-als Technology Laboratory, Ottawa, ON, Canada) and Zn (99.9 wt.%,Alfa Aesar, Haverhill, MA, USA) in an induction furnace under anargon atmosphere. Crucibles were made from 0.15 mm thick Ta foilwith a purity of 99.5 wt.%. All samples were melted three times to

246 Z. Zhu et al. / J. Chem. Thermodynamics 93 (2016) 242–254
improve homogeneity. ICP tests (Inductively Coupled Plasma massspectrometry) showed that Zn losses of 5 wt.% by vaporizationoccurred during melting. Consequently, an excess of 5 wt.% Znwas added before melting.
Figure 3 shows the furnace used for the NPD experiments. Twoinfrared lamps were used to heat the samples. Crucibles weremade of 304 stainless steel for samples #1, #2 and #3. For sample#4, a Ta crucible was required because of the high melting point.The use of a Ta crucible also simplified the analysis of the diffrac-tion patterns since Ta has fewer diffraction peaks than stainlesssteel. Stainless steel, however, is less expensive. An eccentricallyloaded motor was attached to the top of the furnace to vibratethe sample in order to weaken preferred orientation and to avoidsuper-cooling that occurred during preliminary tests performedwithout vibrating the sample. All the ND experiments were carriedout under a flowing Ar atmosphere. The mass of the samples variedfrom 10 g to 20 g.
In an in-situ ND experiment, diffraction patterns are acquired asa function of temperature as a specimen is heated or cooled. Eachcrystallographic phase in the specimen produces a distinct set ofdiffraction peaks, with the intensity of each diffraction peakproportional to the quantity of the corresponding phase in the
FIGURE 3. Schematic drawing of the fur
specimen. During cooling or heating, a transition temperature isthus the temperature at which the diffraction peaks for a givenphase first appear or completely disappear. Due to limitations inthe sensitivity of the technique, diffraction peaks for new phasesare typically not detectable until the temperature is somewhatbelow or above the equilibrium transition temperature. In orderto quantify the offset associated with the sensitivity of the method,heating and cooling ND measurements on pure Mg were carriedout. The apparent melting temperature of pure Mg was determinedto be 640 �C upon heating and 635 �C upon cooling. The acceptedmelting temperature of pure Mg is 650 �C [34]. Hence, all reportedtemperatures shown in the present report have been corrected by15 �C because only in-situ data collected during cooling wereanalysed.
Several samples were prepared for preliminary tests. ICP mea-surements were performed on these samples before and after theND experiments. It was found that the change in composition dur-ing the ND experiments was very limited, typically less than 2 at.%for any component.
XRD was also performed to identify the phases present in theas-cast alloys. The information obtained from XRD was used as astarting point to index the subsequent ND results. Rietveld analysis
nace used for the ND experiments.

TABLE 2Sample compositions and transition temperatures measured in NPD experiments.
SampleNo.
Composition(at.%)
Transitiontemperatures(±2.5 �C)
Phase first appearing belowthis temperature
#1 Ce40Mg10Zn50 735 �C CeZn2
720 �C Ce(Mg,Zn)665 �C s3
#2 Ce16Mg40Zn44 700 �C s3615 �C s1550 �C CeMg12
#3 Ce4Mg58Zn38 555 �C CeMg12455 �C s6?365 �C (Mg), hcp
#4 Ce20Mg22Zn58 730 �C s1710 �C s3
? Possible phase.
Z. Zhu et al. / J. Chem. Thermodynamics 93 (2016) 242–254 247
was performed on the ND patterns as well as the XRD patternsusing the GSAS/EXPGUI software [35]. Transition temperaturesobtained from the ND experiments are summarized in table 2.
In the ND experiments it was found from initial tests that theintensity of the diffraction peaks for newly precipitated phases sta-bilized very quickly (within 3 min) as the temperature changed.Consequently, in later experiments, diffraction patterns wererecorded at intervals of 5 �C, with an acquisition time of 3 min ateach temperature. In this way, relatively accurate transformationtemperatures could be obtained within a reasonable amount ofbeam time.
3.1. Sample #1 (Ce40Mg10Zn50)
Figure 4(a) shows ND patterns for sample #1 obtained uponcooling. Although patterns were acquired every 5 �C, only a fewselected patterns are shown. A hump around 2h = 30� due to theliquid phase is visible at 765 �C. All other peaks above backgroundat this temperature correspond to the crucible or the thermocou-ples, indicating that the sample was entirely in the liquid state at765 �C. Patterns for 735 �C, 720 �C and 665 �C were obtained justafter the appearance of a new phase. Analysis of the patternsshows that CeZn2 is the first phase to appear upon cooling at735 �C, followed by Ce(Mg,Zn) at 720 �C and s3 at 665 �C. Thediffraction peaks corresponding to these precipitating phases areweak but discernible, despite the short acquisition time (3 min).The pattern at 645 �C shows no new peaks compared with thoseobserved at 665 �C. The derived transition temperatures for sample#1 are shown on figure 5(a).
The room temperature lattice constant of the Ce(Mg,Zn) phasewas 0.3712 nm which is closer to that of CeZn (0.3696 nm [30])than that of CeMg (0.3898 nm [29]), consistent with the phase rela-tionships in figure 1.
3.2. Sample #2 (Ce16Mg40Zn44)
ND patterns at selected temperatures for sample #2 are shownin figure 4(b). The primary phase for this sample is s3, which formsat 700 �C. s1 appears at 615 �C and CeMg12 is first detected at550 �C. At 370 �C, no new peaks other than those at 550 �C wereare observed. Phases s3 and s1 have their strongest diffractionpeak at 2h = �30�, making the analysis difficult. Furthermore,diffraction peaks from the sample are much weaker than thosefrom the crucible and thermocouple, further complicating theanalysis. The measured transition temperatures for sample #2are shown on figure 5(b).
3.3. Sample #3 (Ce4Mg58Zn38)
ND patterns at selected temperatures for sample #3 are shownin figure 4(c). The first phase that appears upon cooling is CeMg12which forms at 555 �C. At 505 �C, no additional peaks are observed.At 455 �C, a weak diffraction peak appears on the shoulder of thestrong stainless steel peak at a scattering angle of �37�. Thediffraction peak could not be indexed, but we believe it to corre-spond to s6, which would be consistent with our thermodynamicanalysis. Peaks from the hcp (Mg) phase are first observed at365 �C. The measured transition temperatures for sample #3 areshown on figure 5(c).
The lattice constants of CeMg12 measured for sample #3(a = b = 0.9592 nm; c = 0.5608 nm) are smaller than those mea-sured in sample #2 (a = b = 0.9791 nm; c = 0.5616 nm). Since theatomic size of Zn is smaller than that of Mg, this result indicatesa higher content of Zn in sample #3 than in sample #2 in agree-ment with the phase relationships in figure 1.
3.4. Sample #4 (Ce20Mg22Zn58)
Figure 4(d) shows selected ND patterns for Ce20Mg22Zn58. Anal-ysis of the patterns shows that only two phases were observed toform during cooling with s1 forming below 730 �C and s3 below710 �C. The s3 peak at 2h = �30� is very strong, indicating preferredorientation. The measured transition temperatures for sample #4are shown in figure 5(d).
Our refined values for the lattice constants of the s3 phase forsamples #1, 2 and 4 were nearly identical (0.7049(0), 0.7049(8)and 0.7048(5) nm respectively), indicating that the compositionsof this phase are very similar in the three samples, in agreementwith the phase relationships shown in figure 1.
3.5. Thermodynamic optimizations
Thermodynamic data for the pure elements were given previ-ously [7,8,12]. The optimized thermodynamic model parametersof the three binary sub-systems were taken from Ansara et al.[7] (Mg + Zn), Kang et al. [8] (Ce + Mg) and Zhu and Pelton [12](Ce + Zn).
For the three binary sub-systems, the Modified QuasichemicalModel (MQM) [36,37], which takes account of short-range ordering(SRO), was used to model the liquid phase. Consequently, the MQMis used to model the substantial amount of SRO in the liquid phasein the ternary system. For details of the model, see references[12,13,36,37]. The symmetric (Kohler-like) model [37] was usedto estimate the properties of the ternary liquid phase from theoptimized binary model parameters. No additional ternary modelparameters were introduced.
In the optimization of the (Mg + Zn) binary system, Ansara et al.[7] did not use the MQM for the liquid phase. Consequently, theliquid phase was remodelled by Spencer [7] using the MQM,keeping the same parameters as Ansara et al. for all other(Mg + Zn) binary phases. The ‘‘coordination numbers”, which areMQM model parameters, were set to
ZMgMg;Zn ¼ ZZn
Mg;Zn ¼ ZMgMg;Mg ¼ ZZn
Zn;Zn ¼ 6 ð1Þand the MQM model parameters were introduced as
DgMgZn ¼ �6778þ 3:138 T=Kþ ð�1966þ 2:008ÞXMgMg
þ ð�3975þ 1:6736ÞXZnZnðJ=g-atomÞ ð2ÞThe binary Bcc_A2, Fcc_A1 and Hcp_A3 solutions are described by asubstitutional solution model as discussed previously [12].
As shown in table 1, Mg and Zn can substitute for each other onone or two sublattices in some phases (s1, s3, Ce(Mg,Zn), CeMg3,CeMg12). These phases are modelled with the Compound Energy

FIGURE 4. Selected ND patterns for (a) Ce40Mg10Zn50, (sample #1), (b) Ce16Mg40Zn44, (sample #2), (c) Ce4Mg58Zn38, (sample #3) and (d) Ce20Mg22Zn58, (sample #4).
248 Z. Zhu et al. / J. Chem. Thermodynamics 93 (2016) 242–254

FIGURE 5. Calculated optimized isopleths of the (a) Ce40Mg60–Ce40Zn60, (b) Ce16Mg84–Ce16Zn84, (c) Ce4Mg96–Ce4Zn96 and (d) Ce20Mg80–Ce20Zn80 sections showingexperimental transition temperatures from samples #1, #2, #3 and #4, respectively.
Z. Zhu et al. / J. Chem. Thermodynamics 93 (2016) 242–254 249
Formalisim (CEF) [38]. For example, the Gibbs energy of the Ce(Mg,Zn) phase according to the model (Ce,Mg)(Mg,Zn) (per mole offormula) can be expressed as follows:
GðCe;MgÞðMg;ZnÞ ¼ y0Cey00MgG
0;ðCe;MgÞðMg;ZnÞCe:Mg þ y0Cey
00ZnG
0;ðCe;MgÞðMg;ZnÞCe:Zn
þ y0Mgy00MgG
0;ðCe;MgÞðMg;ZnÞMg:Mg þ y0Mgy
00ZnG
0;ðCe;MgÞðMg;ZnÞMg:Zn
þ RT y0Celn y0Ce þ y0Mgln y0Mg
� �
þ RT y00Mgln y00Mg þ y00Znln y00Zn� �
þXi
LiCe;Mg:Mg y0Ce � y0Mg
� �iy0Cey
0Mgy
00Mg
þXi
LiCe;Mg:Zn y0Ce � y0Mg
� �iy0Cey
0Mgy
00Zn
þXi
LiCe:Mg;Zn y00Mg � y00Zn� �i
y0Cey00Mgy
00Zn
þXi
LiMg:Mg;Zn y00Mg � y00Zn� �i
y0Mgy00Mgy
00Zn
þ LCe;Mg:Mg;Zny0Cey0Mgy
00Mgy
00Zn ð3Þ
where y0Ce and y0Mg are the site fractions of Ce and Mg in the firstsublattice and y00Mg and y00Zn are the site fractions of Mg and Zn in
the second sublattice, G0;ðCe;MgÞðMg;ZnÞCe:Mg , G0;ðCe;MgÞðMg;ZnÞ
Ce:Zn , G0;ðCe;MgÞðMg;ZnÞMg:Mg
and G0;ðCe;MgÞðMg;ZnÞMg:Zn are the Gibbs energies of the end-members
(CeMg, CeZn, MgMg and MgZn) at temperature T under the conven-tion that the enthalpies of the elements are equal to zero in their
stable states at T = 298.15 K, and LiCe;Mg:Mg, LiCe;Mg:Zn, L
iCe:Mg;Zn, L
iMg:Mg;Zn
and LCe;Mg:Mg;Zn are interaction parameters to be optimized. TheGibbs energies of s1, s3, CeMg3 and CeMg12 can be expressedsimilarly.
The s2, s4, s5, s6 and s7 phases are treated as stoichiometriccompounds.
No thermodynamic properties for the ternary compounds couldbe found in the literature. To obtain initial estimates of the enthal-pies and entropies of formation of the ternary compounds, threelines passing through the compound on the ternary Gibbs trianglewere drawn parallel to the three edges of the triangle. The sixintersection points of these lines with the edges defined six binarycompositions whose enthalpies and entropies calculated from thebinary model parameters were then averaged to give the initialestimates. Thereafter, these values were adjusted to best reproducethe available data.
All model parameters optimized in the present work are listedin table 3. All other model parameters (apart from the MQMparameters for liquid (Mg + Zn) shown in Section 4) have beengiven previously [7,8,12]. Very few model parameters are required.The enthalpies of formation of all compounds have reasonablevalues. The entropies of formation are all small and negative.
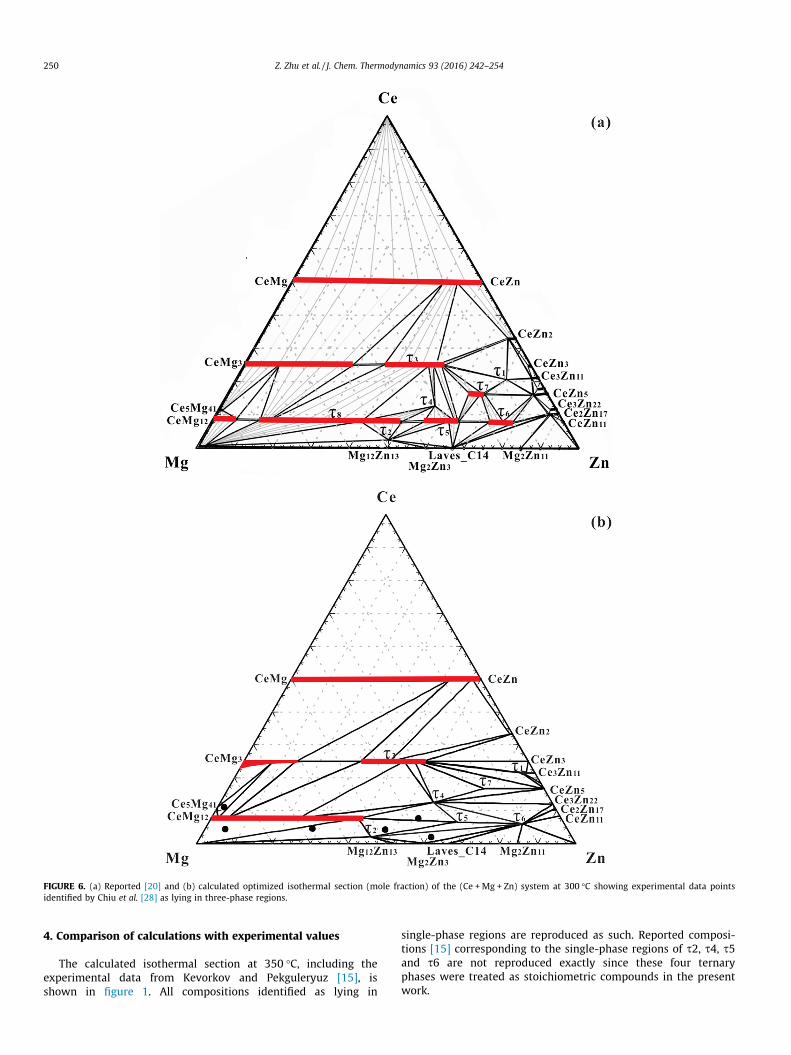
FIGURE 6. (a) Reported [20] and (b) calculated optimized isothermal section (mole fraction) of the (Ce + Mg + Zn) system at 300 �C showing experimental data pointsidentified by Chiu et al. [28] as lying in three-phase regions.
250 Z. Zhu et al. / J. Chem. Thermodynamics 93 (2016) 242–254
4. Comparison of calculations with experimental values
The calculated isothermal section at 350 �C, including theexperimental data from Kevorkov and Pekguleryuz [15], isshown in figure 1. All compositions identified as lying in
single-phase regions are reproduced as such. Reported composi-tions [15] corresponding to the single-phase regions of s2, s4, s5and s6 are not reproduced exactly since these four ternaryphases were treated as stoichiometric compounds in the presentwork.

FIGURE 7. (a) Reported [14] and (b) calculated optimized isothermal section (mole fraction) of the (Ce + Mg + Zn) system at 197 �C.
Z. Zhu et al. / J. Chem. Thermodynamics 93 (2016) 242–254 251
Figure 6(b) shows the calculated isothermal section at 300 �Calong with points which Chiu et al. [28] identified as lying inthree-phase regions. All these tie-triangles were reproduced inthe present work. The region containing the data point correspond-
ing to the highest Mg content was mistakenly interpreted as athree-phase region in ref [28]. The more recently reported isother-mal section at 300 �C from Mostafa and Medraj [20] is shown infigure 6(a). As expected, the reported solubility ranges of some of

FIGURE 8. Calculated optimized isopleths of the (a) Ce15Mg85–Mg85Zn15 and (b) Ce65Mg35–Mg35Zn65 sections showing data points of Chiu et al. [28]. N strong heating signal;. strong cooling signal; 4 weak heating signal; O weak cooling signal.
FIGURE 9. Tentative calculated liquidus projection for (Ce + Mg + Zn) system (mole fraction).
252 Z. Zhu et al. / J. Chem. Thermodynamics 93 (2016) 242–254
the ternary phases are not reproduced because we treated thesephases as stoichiometric compounds. The proposed phase relation-ships in the Zn-rich region were also not all reproduced.
In the optimizations, more weight was given to the experimen-tal data from the present ND experiments because these experi-ments were performed at higher temperatures and in thepresence of the liquid phase; hence, equilibrium is more likely tobe attained.
Reported [14] and calculated isothermal sections at 197 �C areshown in figure 7. The solubility of Zn in the CeMg12 phase is cal-culated as �8 at.%, which is much less than that reported in ref [14](44.5 at.%). Furthermore, the s7 phase is not stable at 197 �C
according to the calculations. It was not possible to reproduce allthe experimental data from the present ND experiments while alsoreproducing the reported large Zn solubility in CeMg12 and main-taining s7 stable at 197 �C. The samples of Pavlyuk et al. [14] wereannealed at 197 �C for four weeks which may have been insuffi-cient to reach equilibrium at such a low temperature. That theirsystem was not completely at equilibrium is supported by theirobservation of Mg51Zn20, which is metastable [7]. As mentionedabove, more weight was given to the current high temperatureND results in the optimization.
Calculated Zn solubilities in CeMg3 are less than those reportedat 350 �C, 300 �C and 197 �C. The ND results proved incompatible

FIGURE 10. Enlargement of part of figure 9.
TABLE 3Thermodynamic model parameters optimized in the present work for the (Ce + Mg+ Zn) system.
Phase name Model Parameters (J � g-atom�1)
Ce(Mg,Zn) (Ce,Mg)(Mg,Zn) L0;CeðMg;ZnÞCe:Mg;Zn ¼ �4812
CeMg3 (Ce,Mg)(Mg,Zn)3 G0;CeMg3Ce:Zn ¼ �34204þ 5:23 T/K
L0;CeMg3Ce:Mg;Zn ¼ �4184
L1;CeMg3Ce:Mg;Zn ¼ �2092
CeMg12 Ce(Mg,Zn)12 L0;CeMg12Ce:Mg;Zn ¼ �2248
s1 Ce3Zn9(Mg,Zn)2 G0;s1Ce:Zn:Mg ¼ �31380þ 2:99 T/K
G0;s1Ce:Zn:Zn ¼ �36334þ 6:45 T/K
s2 Ce2Mg53Zn45 G0;s2Ce:Mg:Zn ¼ �10547þ 0:92 T/K
s3 Ce(Mg,Zn)2Mg G0;s3Ce:Mg:Mg ¼ �19000þ 6:63 T/K
G0;s3Ce:Zn:Mg ¼ �34037þ 6:28 T/K
L0;s3Ce:Mg;Zn:Mg ¼ 1046
L1;s3Ce:Mg;Zn:Mg ¼ 4184
s4 Ce2Mg5Zn9 G0;s4Ce:Mg:Zn ¼ �25724þ 5:23 T/K
s5 Ce3Mg13Zn30 G0;s5Ce:Mg:Zn ¼ �20465þ 3:94 T/K
s6 Ce6Mg11Zn83 G0;s6Ce:Mg:Zn ¼ �23389þ 4:89 T/K
s7 Ce20Mg19Zn81 G0;s7Ce:Mg:Zn ¼ �30193þ 4:20 T/K
Z. Zhu et al. / J. Chem. Thermodynamics 93 (2016) 242–254 253
with the higher solubilities and, again, more weight was given tothe ND results, which are more likely to correspond to true equilib-rium conditions due to the presence of the liquid phase.
Two calculated isopleths with constant Zn contents of 24 and34 wt.% are shown in figure 2 along with experimental TA datafrom Drits et al. [21]. The experimental points [21] at low Ce con-tents cannot be reproduced since they are in disagreement withthe accepted liquidus in the (Mg + Zn) binary system.
Figure 8 shows calculated optimized isopleths along with theDTA data of Chiu et al. [28]. The data are reasonably wellreproduced.
TABLE 4Tentative calculated invariant reactions, maxima and minima and their temperatures (�C)
t/�C t/�C t/�C
P1 849 P2 833 U1 818U5 751 U6 709 U7 697P4 622 U10 601 U11 594U14 580 E1 574 U15 502U17 386 U18 351 P8 346max3 �533 min1 �632 min2 �484
Chiu et al. [28] proposed a thermodynamic optimization of thesystem. However, they focused mainly on Mg-rich compositionsand included only three ternary compounds. Their optimizationreproduced the values shown in figure 8(a) reasonably well, butnot the data in figure 8(b).
Calculated isopleths are shown in figure 5 along withexperimental data from the present ND experiments. Calculatedtransition temperatures and precipitation sequences are in goodagreement with the experiments. The higher transition tempera-tures (especially the liquidus temperatures) are considered morereliable than the lower transition temperatures because of kineticconstraints on attaining equilibrium at low temperature.
A tentative calculated liquidus projection for the (Ce + Mg + Zn)system is shown in figures 9 and 10 and a tentative list of thecalculated temperatures of invariant reactions, maxima andminima is given in table 4.
As mentioned in Section 2, an invariant equilibrium at (341 to343) �C was reported by Korol’kov and Sal’dau [16], which couldcorrespond to U18, P8 or E2, the most likely being E2 becauseeutectic reactions are the most easily detected by thermal analysis.
5. Discussion
In the optimization, greater weight was accorded to the ND datafrom the present investigation, firstly because the ND data wereobtained in situ at equilibrium at higher temperatures, and sec-ondly because, due to the high penetrating power of neutrons,large samples 10 g to 20 g could be used, thereby leading to bettercontrol of composition and increased resistance to oxidation.
In subsequent articles we shall report on thermodynamic mod-elling and ND experiments in the (Nd + Mg + Zn) system as well asthermodynamic optimizations of most other ternary (RE + Mg+ Zn) systems [39,40,41]. The model parameters will be includedin the FTlite light metals database of the FactSage databasecomputing system [42] which already contains optimized modelparameters for the solid and liquid phases of a large number ofbinary and ternary Mg- and Al-containing systems. Through themodels, the properties and phase equilibria of multicomponentsystems can thus be estimated and calculated.
All calculations in the present work were performed with theFactSage software [42].
6. Conclusions
All available phase diagram data for the (Ce + Mg + Zn) systemwere critically assessed. In-situ neutron diffraction (ND) experi-ments were performed on selected samples to identify phasesand transition temperatures. A critical thermodynamic evaluationand optimization of the (Ce + Mg + Zn) system was carried outand model parameters for the thermodynamic properties of allphases were obtained. The phase transformation behaviour ofselected samples was well resolved from the ND experimentsand experimental data were used to refine the thermodynamicmodel parameters.
in the (Ce + Mg + Zn) system.
t/�C t/�C t/�C
U2 816 U3 781 U4 775U8 656 U9 650 P3 639P5 592 U12 591 U13 584U16 498 P6 413 P7 410E2 346 max1 �782 max2 �743

254 Z. Zhu et al. / J. Chem. Thermodynamics 93 (2016) 242–254
All optimized model parameters from the present work aresummarized in table 3. Binary parameters were reported in previ-ous articles [7,8,12]. Very few model parameters are required, andall parameters have thermodynamically reasonable values. In par-ticular, no additional ternary parameters were required in theMQM model for the liquid phase.
Acknowledgements
This research was supported by funding from the NaturalSciences and Engineering Research Council of Canada (NSERC)Magnesium Strategic Research Network (Grant number: NETGP340821-06). More information on the Network can be found atwww.MagNET.ubc.ca. The authors would like to thank Dr. DmytroKevorkov and Dr. Ahmad Mostafa for helping prepare the samples.SYL was supported by the National Research Foundation of Korea(NRF) grant funded by the Korean government (MSIP) (No.2013R1A1A1076023).
References
[1] B.L. Mordike, T. Ebert, Magnesium: properties — applications — potential, Mat.Sci. Eng. A-Struct. 302 (2001) 37–45.
[2] I.P. Moreno, T.K. Nandy, J.W. Jones, J.E. Allison, T.M. Pollock, Microstructuralstability and creep of rare-earth containing magnesium alloys, Scr. Mater. 48(2003) 1029–1034.
[3] J. Bohlen, M.R. Nürnberg, J.W. Senn, D. Letzig, S.R. Agnew, The texture andanisotropy of magnesium-zinc-rare earth alloy sheets, Acta Mater. 55 (2007)2101–2112.
[4] R.K. Mishra, A.K. Gupta, P.R. Rao, A.K. Sachdev, A.M. Kumar, A.A. Luo, Influenceof cerium on the texture and ductility of magnesium extrusions, Scr. Mater. 59(2008) 562–565.
[5] N. Stanford, M.R. Barnett, The origin of ‘‘rare earth” texture development inextruded Mg-based alloys and its effect on tensile ductility, Mat. Sci. Eng. A-Struct. 496 (2008) 399–408.
[6] K. Hantzsche, J. Bohlen, J. Wendt, K.U. Kainer, S.B. Yi, D. Letzig, Effect of rareearth additions on microstructure and texture development of magnesiumalloy sheets, Scr. Mater. 63 (2010) 725–730.
[7] I. Ansara, A.T. Dinsdale, M.H. Rand, COST 507: definition of thermochemicaland thermophysical properties to provide a database for the development ofnew light alloys, Thermochemical database for light metal alloys, vol. 2, Officefor Official Publications of the European Communities, Luxembourg, 1998; P.Spencer, unpublished work.
[8] Y.-B. Kang, L. Jin, P. Chartrand, A.E. Gheribi, K. Bai, P. Wu, Thermodynamicevaluations and optimizations of binary Mg-light rare Earth (La, Ce, Pr, Nd, Sm)systems, CALPHAD 38 (2012) 100–116.
[9] Y.-B. Kang, A. Pelton, P. Chartrand, P. Spencer, C. Fuerst, Critical evaluation andthermodynamic optimization of the binary systems in the Mg–Ce–Mn–Ysystem, J. Phase Equilib. Diff. 28 (2007) 342–354.
[10] Y.-B. Kang, A.D. Pelton, P. Chartrand, C.D. Fuerst, Critical evaluation andthermodynamic optimization of the Al–Ce, Al–Y, Al–Sc and Mg–Sc binarysystems, CALPHAD 32 (2008) 413–422.
[11] Y.-B. Kang, unpublished work.[12] Z. Zhu, A. Pelton, Critical assessment and optimization of phase diagrams and
thermodynamic properties of RE–Zn systems-part I: Sc–Zn, La–Zn, Ce–Zn, Pr–Zn, Nd–Zn, Pm–Zn and Sm–Zn, J. Alloys Compd. 641 (2015) 249–260.
[13] Z. Zhu, A. Pelton, Critical assessment and optimization of phase diagrams andthermodynamic properties of RE–Zn systems-Part II: Y-Zn, Eu–Zn, Gd–Zn, Tb–Zn, Dy–Zn, Ho–Zn, Er–Zn, Tm–Zn, Yb–Zn and Lu–Zn, J. Alloys Compd. 641(2015) 261–271.
[14] V. Pavlyuk, B. Marciniak, E. Ró _zycka-Sokołowska, The isothermal section of thephase diagram of Ce–Mg–Zn ternary system at 470 K, Intermetallics 20 (2012)8–15.
[15] D. Kevorkov, M. Pekguleryuz, Experimental study of the Ce–Mg–Zn phasediagram at 350 �C via diffusion couple techniques, J. Alloys Compd. 478 (2009)427–436.
[16] A.M. Korol’kov, P.Y. Sal’dau, Solubility of zinc and cerium in magnesium in thesolid state, Izv. Sekt. Fiz.-Khim. Anal., Inst. Obshch. Neorg. Khim., Akad. NaukSSSR, 16 (1946) 295–306.
[17] E.V. Mel’nik, M.F. Kostina, Ya.P. Yarmlyuk, O.F. Zmii, Study of magnesium–zinc–cerium and magnesium–zinc–calcium ternary systems, MagnievyeSplavy, Mater. Vses. Soveshch. Issled., Razrab. Primen. Magnievyhk Splavov,(1978) 95–99.
[18] U. Kolitsch, P. Bellen, S. Kaesche, D. Macciò, N. Bochvar, Y. Liberov, P. Rogl, G.Effenberg, G. Petzow, Ternary Alloys–A Comprehensive Compendium ofEvaluated Constitutional Data and Phase Diagrams, 17, Weinheim: VCHVerlagsgesellschaft, MSI GmbH, Stuttgart, Germany, 2000. 168–176.
[19] R. Agarwal, S.G. Fries, H.L. Lukas, G. Petzow, F. Sommen, T.G. Chart, G.Effenberg, Assessment of the Mg–Zn system, Z. Metallkd. 83 (1992) 216–223.
[20] A. Mostafa, M. Medraj, Phase equilibria of the Ce–Mg–Zn ternary system at300 �C, Metals 4 (2014) 168–195.
[21] M.E. Drits, E.I. Drozdova, I.G. Korol’kova, V.V. Kinzhibalo, A.T. Tyvanchuk,Investigation of polythermal sections of the Mg–Zn–Ce system in the Mg-richregion, Russ. Metall-Metall-U (1989) 195–197.
[22] M.E. Drits, E.I. Drozdova, I.G. Korol’kova, V.V. Kinzhibalo, A.T. Tyvanchuk,Polythermal sections of the magnesium–zinc–cerium system in themagnesium-rich region, Izv. Akad. Nauk SSSR, Met. (1989) 198–200.
[23] M.-I. Huang, H.-X. Li, H. Ding, Y.-P. Ren, G.-W. Qin, S.-M. Hao, Partial phaserelationships of Mg–Zn–Ce system at 350 �C, Trans. Nonferr. Metal. Soc. 19(2009) 681–685.
[24] M.-L. Huang, H.-X. Li, H. Ding, L. Bao, X.-B. Ma, S.-M. Hao, Intermetallics andphase relations of Mg–Zn–Ce alloys at 400 �C, Trans. Nonferr. Metal. Soc. 22(2012) 539–545.
[25] V. Pavlyuk, E. Rozycka-Sokolowska, B. Marciniak, The new ternary phases ofLa3(Zn0.874Mg0.126)11 and Ce3(Zn0.863Mg0.137)11, Acta Crystallogr. C 66 (2010)i25–i28.
[26] V. Pavlyuk, P. Solokha, G. Dmytriv, B. Marciniak, V. Paul-Boncour, The Heusler-type alloy MgZn2Ce, Acta Crystallogr. E 63 (2007) i161.
[27] V. Pavlyuk, P. Solokha, O. Zelinska, V. Paul-Boncour, A. Nowik-Zajac,Ce20Mg19Zn81: A new structure type with a giant cubic cell, Acta Crystallogr.C 64 (2008) i50–i52.
[28] C.-N. Chiu, J. Gröbner, A. Kozlov, R. Schmid-Fetzer, Experimental study andthermodynamic assessment of ternary Mg–Zn–Ce phase relations focused onMg-rich alloys, Intermetallics 18 (2010) 399–405.
[29] H. Nowotny, The crystal structures of Ni5Ce, Ni5La, Ni5Ca, Cu5La, Cu5Ca, Zn5La,Zn5Ca, MgCe, MgLa and MgSr, Z. Metallkd. 34 (1942) 247–253.
[30] Y. Uwatoko, K. Suenaga, G. Oomi, X-ray diffraction study of the structuralchange in cerium-zinc (CeZn) under high pressure, J. Magn. Magn. Mater. 104–107 (1992) 645–646.
[31] G. Berger, A. Weiss, Ternary intermetallic phases with Heusler-phase-typestructure in the system Ag–Mg–RE (RE � La, Ce, Pr, Nd, Sm), J. Less-commonMet. 142 (1988) 109–121.
[32] A.H. Gomes de Mesquita, K.H.J. Buschow, The crystal structure of so-called a-LaAl4 (La3Al11), Acta Crystallogr. 22 (1967) 497–501.
[33] H. Xu, J. Fan, H.-L. Chen, R. Schmid-Fetzer, F. Zhang, Y. Wang, Q. Gao, T. Zhou,Experimental determination of the phase equilibria of the Mg–Nd–Zn systemat 320 �C, J. Alloys Compd. 603 (2014) 100–110.
[34] W.M. Haynes (Ed.), CRC Handbook of Chemistry and Physics, ninety-fifth ed.,(Internet Version 2015), CRC Press/Taylor and Francis, Boca Raton, FL.
[35] B. Toby, EXPGUI, a graphical user interface for GSAS, J. Appl. Crystallogr. 34(2001) 210–213.
[36] A. Pelton, S. Degterov, G. Eriksson, C. Robelin, Y. Dessureault, The modifiedquasichemical model I—Binary solutions, Metall. Mater. Trans. B 31 (2000)651–659.
[37] A. Pelton, P. Chartrand, The modified quasi-chemical model: Part II.Multicomponent solutions, Metall. Mater. Trans. A 32 (2001) 1355–1360.
[38] M. Hillert, The compound energy formalism, J. Alloys Compd. 320 (2001) 161–176.
[39] Zhijun Zhu, Michael A. Gharghouri, Arthur D. Pelton, ThermodynamicModeling and In-situ Neutron Diffraction Investigation of the Nd-Mg-Znsystem, J. Chem. Thermodyn, accepted for publication.
[40] Zhijun Zhu, Arthur D. Pelton, Thermodynamic Modeling of the La-Mg-Zn, Pr-Mg-Zn and Sm-Mg-Zn systems, J. Alloys Compd. 652 (2015) 415–425.
[41] Zhijun Zhu, Arthur D. Pelton, Thermodynamic Modeling of the Y-Mg-Zn, Gd-Mg-Zn, Tb-Mg-Zn, Dy-Mg-Zn, Ho-Mg-Zn, Er-Mg-Zn, Tm-Mg-Zn and Lu-Mg-Znsystems, J. Alloys Compd. 652 (2015) 426–443.
[42] C.W. Bale, E. Bélisle, P. Chartrand, S.A. Decterov, G. Eriksson, K. Hack, I.H. Jung,Y.B. Kang, J. Melançon, A.D. Pelton, C. Robelin, S. Petersen, FactSagethermochemical software and databases - recent developments, CALPHAD33 (2009) 295–311. <www.factsage.com>.
JCT 15-516