j. ksiam vol.20, no.3, 175–202, 2016 s industrial
TRANSCRIPT

J. KSIAM Vol.20, No.3, 175–202, 2016 http://dx.doi.org/10.12941/jksiam.2016.20.175
[SPECIAL SECTION : Mathematics in Industry ]
INDUSTRIAL MATHEMATICS IN ULTRASOUND IMAGING
JAESEONG JANG1 AND CHI YOUNG AHN2,†
1DEPARTMENT OFCOMPUTATIONAL SCIENCE AND ENGINEERING, YONSEI UNIVERSITY, SEOUL, KOREA
E-mail address: [email protected]
2DIVISION OF INTEGRATEDMATHEMATICS, NATIONAL INSTITUTE FORMATHEMATICAL SCIENCES,DAEJEON, KOREA
E-mail address: [email protected]
ABSTRACT. Ultrasound imaging is a widely used tool for visualizing human body’s inter-nal organs and quantifying clinical parameters. Due to its advantages such as safety, non-invasiveness, portability, low cost and real-time 2D/3D imaging, diagnostic ultrasound industryhas steadily grown. Since the technology advancements suchas digital beam-forming, Dopplerultrasound, real-time 3D imaging and automated diagnosis techniques, there are still a lot of de-mands for image quality improvement, faster and accurate imaging, 3D color Doppler imagingand advanced functional imaging modes. In order to satisfy those demands, mathematics shouldbe used properly and effectively in ultrasound imaging. Mathematics has been used commonlyas mathematical modelling, numerical solutions and visualization, combined with science andengineering. In this article, we describe a brief history ofultrasound imaging, its basic prin-ciple, its applications in obstetrics/gynecology, cardiology and radiology, domestic-industrialproducts, contributions of mathematics and challenging issues in ultrasound imaging.
1. INTRODUCTION
Ultrasound imaging system visualizes organs inside human body using sound waves withthe frequency range of1∼15 MHz higher than human audible frequency. Due to the variousadvantages of non-invasiveness, safety, portability(seeFig. 1), relatively low cost and real-time imaging over other imaging modalities such as CT and MRI, it is widely used in variousdiagnostic fields of obstetrics and gynecology, cardiology, radiology, and so on.
Recently, it was reported that ultrasound market size was growing and the ultrasound mar-ket including diagnostic ultrasound would be worth about6.23 billion USD in 2020 [1, 2]. In
Received by the editors August 17 2016; Revised August 28 2016; Accepted in revised form August 29 2016;Published online September 5 2016.
2000Mathematics Subject Classification.68U10, 92C50.Key words and phrases.Industrial Mathematics, Ultrasound Imaging, Ultrasound Examinations, Image Pro-
cessing, Technology Advances, Mathematical Modelling.† Corresponding author.
175

176 J. JANG AND C. Y. AHN
FIGURE 1. Ultrasound imaging systems of major companies: GE, Philips,Siemens, Samsung Medison and Alpinion (from their homepages). The threecompanies of (a)-(c) have over half of global ultrasound market share [3]. Thetwo companies of (d) and (e) are leading domestic companies.
order to have bigger market share, each global company triesto develop competitive imag-ing technologies and to expand ultrasound use in other applications. For example, one of themost promising technologies affected by increased computational power is real-time 3D ultra-sound imaging. It is capable of providing good 3D visualization of organs at the faster rateof about30 volumes per seconds compared to volumetric imaging modalities such as CT andMRI. However, its resolution is not good enough so that it often fails to discriminate featuressmaller than a few millimeters. Because of this resolution limitation, real-time 3D ultrasoundimaging is not frequently adopted for clinical examinations in radiology. Whereas, it is mean-ingfully used for observing cardiac wall motion in cardiology or for distinguishing betweentissues and surrounding fluids in obstetrics and gynecology. In order to circumvent the reso-lution problem, each company concentrates on fusion imaging technique that incorporates twoimages acquired from two different imaging modalities: real-time ultrasound images and CTor MRI images acquired earlier. It is able to provide more anatomical information indistin-guishable with the resolution of real-time 3D ultrasound imaging and expand ultrasound usein radiology. As other examples of the promising technologies, we can consider image qualityenhancement, faster imaging, 3D color Doppler imaging, computer-aided detection (CADe),computer-aided diagnosis (CADx) and advanced functional imaging modes such as elasticityimaging and vortex flow imaging. They are also very interesting and challenging issues to beimproved in ultrasound imaging.
Then how can we advance and innovate ultrasound imaging technologies? Like in otherindustries,Mathematicshas played an important role in ultrasound imaging and medical diag-nosis already. For acquiring gray-level echo images and color Doppler images,Mathematicsis used in various parts of time-delay computation for beam-forming, Fourier tranform of ul-trasound signal for signal processing or filter design, auto-correlation computation for meanfrequency estimation, linear interpolation for scan conversion, and so on [4, 5].Mathematics

INDUSTRIAL MATHEMATICS IN ULTRASOUND IMAGING 177
is also used to extract functional information from ultrasound images. In order to avoid labor-intensive and time-consuming manual measurements on gray-scale echo images, automatedsegmentation and motion tracking algorithms are demanded.The automated measurementmethods are based on partial differential equation, numerical analysis, statistics as well as theinterpretation of acoustic fields and speckles as inherent appearance in ultrasound imaging.Therefore, we can see that various levels of mathematical modelling and methods are appliedto acquire ultrasound images and to generate functional information for clinical evaluations.
Moreover,Mathematicsis essential in cases of elasticity imaging and vortex flow imagingmentioned above. Elasticity imaging is an imaging mode to map the stiffness of soft tissuessuch as liver or breast, and it can be implemented by reconstructing elastic modulus frommeasured displacements governed by the elastic equation:
∇ · (µ(∇u+∇ut)) +∇(λ∇ · u) = ρ
∂2
∂t2u, (1.1)
whereu denotes the displacement vector,∇ut the transpose of the matrix∇u, ρ the density
of the soft tissue as elastic material,µ the shear modulus withµ = E2(1+ν) andλ the Lamé
coefficient withλ = νE(1+ν)(1−2ν) . Here,E andν are Young’s modulus and Poisson’s modulus,
respectively.Vortex flow imaging is an imaging mode to quantify the vorticity of intra-ventricular blood
flows and to offer possible clinical indices. Since the vorticity fields are obtained by taking thecurl operator to velocity fields of flows, the velocity fields should be exactly computed. Thevelocity fields can be computed by solving the Navier-Stokesequation:
ρ
(
∂v
∂t+ v · ∇v
)
= −∇p+ µ∇2v in Ωt,
∇ · v = 0 in Ωt,
(1.2)
whereΩt denotes the intra-ventricular domain varying within the heartbeat cycleT , v thevelocity fields,ρ the blood density andµ the blood viscosity.
The displacements of soft tissues and the motion of blood flows are understood throughphysics-based mathematical modelling using elastic and fluid equations. Under those math-ematical models, we deal with measurements obtained through ultrasound imaging systems,construct the overall phenomenon from the partially measured data and quantify clinicallymeaningful information. The point is that ultrasound imaging technologies will be advancedand innovated throughMathematics.
The aim of this paper is to describe the importance and value of Mathematicsin ultrasoundimaging and to share them with other scientists and engineers. In this paper, we describe a briefhistory of ultrasound imaging, basic imaging principle, its applications in major diagnosticfields, domestic-industrial products and contributions ofmathematics, especially for beginnersto understand ultrasound imaging and pay much attention to it. Furthermore, we introduce hottopics and challenging issues related to ultrasound imaging. They have to be resolved for theadvancements of ultrasound imaging technology. We hope many mathematicians recognizehow mathematics is used and contributes much to ultrasound technology innovation.

178 J. JANG AND C. Y. AHN
2. THE HISTORY OFDIAGNOSTIC ULTRASOUND IMAGING
The history of ultrasound imaging starts with the history ofsonar, the abbreviation of SOundNavigation And Ranging, measuring the depth of water using sound wave. In the late 1800s,the theoretic and practical foundation for sonar and ultrasound imaging was established by amathematical equation describing sound wave and the discovery of piezo-electricity, electricityresulting from pressure. L. Rayleigh described sound wave as a mathematical equation in hispaper “the Theory of Sound” published in 1877 and P. Curie andhis brother J. Curie discoveredthe piezo-electric effect in certain crystals in 1880 [6–8].
Since the sinking of the Titanic in 1912 and World War I, echo-ranging systems were de-manded to detect icebergs or submarines. In 1917, P. Langevin, one of the Curie brothers’first students developed practical underwater echo-ranging systems using the piezo-electricityfor transducer, a device converting a voltage difference toa mechanical stress and reverselyconverting a mechanical pressure to an electric potential.During World War II, echo-rangingtechnique was applied to electromagnetic waves and became radar, the abbreviation of RAdioDetection And Ranging.
Echo-ranging system as a diagnostic device to probe the human body was not developeduntil the 1940’s. K. Dussik used ultrasound to diagnose brain tumor by transmitting an ultra-sound beam through the human skull in 1942 [6, 7, 9]. He is regarded as the first-time userof ultrasound for medical diagnosis. In 1948, G. Ludwig usedA-mode ultrasound system todetect gallstones [7, 10]. The A-mode shows a signal profile representing the instantaneousecho signal amplitude over time after transmission of the acoustic pulse.
FIGURE 2. Illustration of the A-mode and B-mode displays. A 2D B-modeimage consists of multiple and sequential B-mode lines.
After that time, innovative advances of ultrasound imagingtechnologies have followed. Inthe 1950s, 2D B-mode ultrasound imaging system was developed and applied to detect breasttumors and to diagnose in the obstetrics and gynecology fields [6,11]. The B-mode representsthe brightness converted from the amplitude of the echo signals. Fig. 2 illustrates the A-modeand B-mode displays.

INDUSTRIAL MATHEMATICS IN ULTRASOUND IMAGING 179
Since the first implementation of ultrasonic Doppler techniques in Japan in 1955 [12], var-ious Doppler techniques including the continuous wave Doppler, spectral wave Doppler, andcolor Doppler ultrasound were developed through the 1960s and the 1970s [7, 13–17]. Theemergency of 3D ultrasound technology in the 1980s was capable of capturing 3D images of afetus [18,19]. Thanks to the continuous improvements of image quality and 3D imaging capa-bilities, ultrasound technology became more sophisticated and capable of real-time 3D imagingin the 1990s [20].
From the 2000s to present, 2D arrays of transducers were usedfor real-time 3D imaging,ultrasound imaging system became miniaturized gradually and ultrasound imaging technologyis developing steadily for improving image quality, reducing costs, reducing exam times andbeing applied to wider diagnostic areas. Recently, hand-carried systems became available. Itis becoming common with significant growth and can be used forclinical assessments even indeveloping countries [21, 22] due to the portability and lowcost in addition to higher imagequality obtained by using special ultrasound probes for transesophageal echocardiography andtransverginal echo [23,24].
More detailed information about the history of ultrasound imaging can be found at the ref-erences [4,6].
3. BASIC PRINCIPLE OFULTRASOUND IMAGING
Probe(Transducers )
Beam-formingTime gain
compensation
Quadrature
demodulation
Log-
compression
Scan
conversion
Display
Envelope
detection
Logarithmic curve
amplitude of signals
gra
y-s
ca
le
bri
gh
tnes
s
(in frequency domain )
(I^2+Q^2)^0.5
I
Q
gain (dB) =
20 log10 (Aout/Ain)
scanlines
data s
ample
s
FIGURE 3. Block diagram of ultrasound B-mode imaging.
In this section, we describe the basic principle of ultrasound imaging, especially focusing ongray-scale echo images, called the B-mode images. Fig. 3 shows intuitively that mathematics,combined with science and engineering, is used in the process of ultrasound B-mode imaging.Furthermore, we deal with the mathematical models on acoustic fields, fundamental in ultra-sound imaging, and describe their applications. We can see that mathematics is applied usuallyas mathematical modelling, numerical solutions and visualization.

180 J. JANG AND C. Y. AHN
3.1. Ultrasound B-mode imaging. An ultrasound image consists of several sequential scan-lines (around128 ∼ 512 scanlines), each of which is usually acquired through transmissionand reception beam-forming using transducer arrays. The transmission beam-forming is tocontrol electronically time delays for ultrasound beam emitted from the transducer arrays tobe focused at a point on each scanline. The reception beam-forming is to control electron-ically time delays to accumulate back-scattered echo signals from a specific position, calledthe received focal point, on scanlines. We note that the received focal point can be changeddynamically on each scanline.
As sound travels through a material, the amplitude or intensity is decreased due to threefactors: absorption, scattering and beam divergence. We start describing mathematically theultrasound imaging principle, together with beam-forming, considering the time gain compen-sation of the received and beam-formed echo signals [25,26].
3.1.1. Beam-forming and gain compensation.LetN be the number of transducers,rj the po-sition of thej-th transducer andpj the received signal atrj for j = 1, · · · , N . We assume thattransducers are very small, sample positions on each scanline are far away from the transducersand the impulse response is given in the form of Dirac delta function. Then, for sample positionr = (x, y, z) on a given scanline, the amplitude of the received signal at time t is expressed as
p(t) =
N∑
j=1
pj(t− τj) = K
N∑
j=1
δ
(
t−|rj − r|
c
)
, (3.1)
whereτj is the delayed time andK a constant depending on depth.
3.1.2. Quadrature demodulation and envelope detection.Let f0 be the center frequency oftransmission signals. Then the amplitude (3.2) of the beam-formed signal along the givenscanline can be expressed as
p(t) = a(t) cos(2πf0t+ φ(t))
=a(t)
2
(
ei(2πf0t+φ(t)) + e−i(2πf0t+φ(t)))
,(3.2)
wherea(t) andφ(t) are the amplitude and the phase of the received signal, respectively. Inorder to remove signals with high-frequency and obtain meaningful signal with low-frequency,we perform the quadrature demodulation. By settingp(t) = p(t)e−2πf0t and applying a low-pass filter top(t), we can obtain a base-band complex signala(t)
2 eiφ(t). Its real and imaginaryparts are called In-phase and Quadrature signals, denoted by I(t) andQ(t), respectively.
I(t) = Re
(
a(t)
2eiφ(t)
)
,
Q(t) = Im
(
a(t)
2eiφ(t)
)
.
(3.3)
After the envelope detection by taking√
I(t)2 +Q(t)2 from the quadrature demodulated sig-nalsI(t) andQ(t), logarithmic compression follows.

INDUSTRIAL MATHEMATICS IN ULTRASOUND IMAGING 181
3.1.3. Logarithmic compression.Most of clinically meaningful signals are appeared with thesmall value in the wide range of amplitude. The logarithmic compression is required to displaythese meaningful signals in the 256 gray-scale values. The image intensityI(t) is expressed as
I(t) =Imax − Imin
lnAmax − lnAminln
(
A(t)
Amin
)
+ Imin, (3.4)
whereImax andImin are the maximum and minimum intensity values, to be displayed finallyin the gray-scale, respectively, andAmax andAmin the maximum and minimum amplitudevalues with the range of interest, respectively.
3.1.4. Digital scan conversion and display.These intensity values at the sample positionsalong each scanline are displayed on a video screen through scan conversion process for thespatially arrangement. Scan conversion is performed by using bi-linear interpolation.
In order to improve the B-mode image, some signal/image processing methods may be usedadditionally.
3.2. Acoustic fields. Jensen [27] derived an inhomogeneous wave equation describing thepropagation and scattering of ultrasound in an inhomogeneous medium, derived a mathemat-ical model for the received pulse-echo pressure fields by considering the surface shape of asingle transducer element used in diagnostic ultrasound and showed simulated pressure fieldcompared to a measured field. In this subsection, we describethe mathematical models andtheir applications.
3.2.1. Mathematical modelling.Let p(r, t) be the pressure variation caused by ultrasoundpropagation at the positionr and timet, c(r) the propagation speed andρ(r) the materialdensity. Then the inhomogeneous wave equation is derived as
∇2p−1
c02∂2p
∂t2= −
2(δc)
c03∂2p
∂t2+
1
ρ0∇(δρ) · ∇p, (3.5)
wherec0 is the mean propagation speed,ρ0 the mean density,δc the speed variation fromc0andδρ the density variation fromρ0.
Let pr(t) the received signal at the transducer surface andEm(t) at timet. Thenpr(t) iswritten as
pr(t) =ρ0
2c02Em(t) ∗
t
∂3v(t)
∂t3∗t
[(
δρ(r)
ρ0−
2(δc(r))
c0
)
∗r
H(r, t)
]
, (3.6)
where∗t
and ∗r
mean the time convolution and spatial convolution, respectively. Note that
ρ02c02
Em(t) ∗t
∂3v(t)∂t3
is the pulse-echo including the transducer excitation and the electrome-
chanical impulse response during the emission/reception of the pulse,δρ(r)ρ0− 2(δc(r))
c0is the
inhomogeneities in tissue andH(r, t) is the pulse echo spatial impulse response given byH(r, t) = h(r, t) ∗
th(r, t) with h(r, t) =
∫
Sδ(t−|r−r0|/c0)
2π|r−r0|dr0 for the transducer surfaceS.
For validating the derived mathematical model (3.6), a simulation was performed under thesetup that a plane reflector was placed at focal point. According to an excited Dirac impulse,

182 J. JANG AND C. Y. AHN
impulse responses were computed at the distances of three different positions from transducersurface and compared to measured responses.
3.2.2. Field II simulation program.Afterward Jensen [28, 29] improved the mathematicalmodel (3.6) for the propagation and scattering of acoustic fields by considering acoustic fieldsfrom arbitrarily shaped, apodized and excited transducersand dealing with the imaging prin-ciple, and developed a simulation program based on the derived mathematical model and run-ning under MATLAB software. It is called Field II. Using Field II simulation program, wecan simulate ultrasound transducer fields and generate somegray-level echo and color Dopplerimages similar to real ultrasound images acquired in ultrasound imaging system as depictedin Fig. 4. Field II is widely used in several companies, universities and departments because
FIGURE 4. Examples of ultrasound synthetic images generated by using Field II.
it is very helpful for scientists and engineers to understand ultrasound imaging and study im-age processing methods such as speckle reduction on the synthetic images. It is available at:http://field-ii.dk/.
4. APPLICATIONS OFDIAGNOSTIC ULTRASOUND IMAGING
Thanks to the advanced imaging technologies such as image quality enhancement, real-time 3D imaging and the miniaturization of equipment, ultrasound is widely applied to variousdiagnostic fields of obstetrics and gynecology(OB/GYN), cardiology, radiology, urology, andso on. We note that applications in OB/GYN, cardiology and radiology account for about70% of the entire ultrasound examinations. In this section,we provide brief explanations ofultrasound imaging applications in major three diagnosticareas.

INDUSTRIAL MATHEMATICS IN ULTRASOUND IMAGING 183
4.1. OB/GYN ultrasound. Since the 1950’s, ultrasound has been used for the diagnosisofgestation and women’s health. The ultrasound market for OB/GYN examinations has contin-ued to increase. The main issues of ultrasound imaging in OB/GYN is to improve the imagequality for detecting endometriosis and gynecological cancer, diagnosing early miscarriageand ectopic pregnancy, and evaluating fetal growth. Especially the performance enhancementof static and real-time 3D imaging is still a hot issue for easier detection of fetal abnormalitiesin obstetrics.
4.1.1. Ultrasound examinations.Fetal ultrasound examinations are classified into four parts:first-trimester examination, standard second- or third-trimester examination, limited examina-tion and specialized examinations [30]. Most of the examinations performed by observing ormeasuring target objects: the presence, size, location andnumber of gestational sac(s), fetalpresentation, amniotic fluid volume, cardiac activity, placental position, fetal biometry, fetalheart activity, and so on.
On the other hand, gynecological examinations such as the detection of endometriosis andgynecological cancer are performed commonly by transvaginal scans, with the probe designedto be placed in the vagina of patient. Since the scanhead of the probe is closely adjacentto uterus, the transvaginal scans provide better image qualities and are useful for the earlydiagnosis of miscarriage and ectopic pregnancies.
Recent advances of static and real-time 3D ultrasound imaging through various image pro-cessing and volume rendering techniques have enabled performing more accurate diagnosis forectopic pregnancy [31] and providing more accurate diagnostic information: abnormalities andanomalies by visualizing fetal face, brain, spine, and skeleton [32], fetal weight obtained bymeasuring abdominal, thigh, arm volumes and head circumference [33–35], and the volumesof lung and heart [36, 37]. High quality images and accurate boundary extraction are requiredfor fetal examinations.
In addition, Doppler ultrasound is indispensable for detecting fetal heartbeat as well as bloodflow characteristics in the various fetal blood vessels: umbilical artery, aorta, middle cerebralarteries, uterine arcuate arteries and inferior vena cava.Power or color Doppler images areused for examinations of fetal middle cerebral artery and cerebral venous [38,39]. Blood flowto fetus through umbilical cord is also observed by color Doppler images [40, 41]. Note thatcolor Doppler images reflect one-directional velocity components of blood flow along scanlinesand power Doppler shows the volume of blood, rather than its velocity.
4.1.2. Innovative technologies for OB/GYN.Samsung Medison, a leading domestic company,has released recently a premium ultrasound system ‘WS80A with Elite’ with superior ultra-sound imaging techniques for OB/GYN examinations:S-Harmonic, ClearVision
TM, Realistic
VueTM
, Crystal Vue, etc. Among them, we pay attention toCrystal Vuean advanced renderingtechnique to enhance the image contrast of 3D volume data. Itis capable of imaging the in-terface of bone and soft tissue with high accuracy and providing intuitive information on thecontour of fetal skeleton, face and brain. Lately,Crystal Vuehas been featured on the frontcover of Ultrasound in Obstetrics & Gynecology (UOG), a renowned journal in the women’s

184 J. JANG AND C. Y. AHN
healthcare industry [42]. The images of fetal spine and ribsobtained byCrystal Vuewereselected as the Picture of the Month by UOG. They provide remarkably clear and realisticinformation of fetal spine and ribs.
Together with the advanced rendering technique, ElastoScanTM
for gynecology is also beingpromoted. It is used to diagnose benign gynecological disorders and to differentiate uterinefibroids and adenomyosis. We can appreciate the remarkable images acquired by SamsungMedison’s innovative imaging technologies at: http://www.samsungmedison.com/ultrasound/ob-gyn/ws80a-with-elite/.
4.2. Cardiological ultrasound. Due to the high temporal resolution of ultrasound imaging,cardiac ultrasound (echocardiography) has been very successful in providing a quick assess-ment of the overall health of heart, a very fast moving complex organ positioned deep withinthe body. Ultrasound examinations of heart functions related to cardiac wall motion, valve mo-tion and blood flow are performed by various ultrasound imaging modes: gray-scale imaging,tissue Doppler imaging, color Doppler imaging and real-time 3D imaging. Note that tissueDoppler images represent the velocity of cardiac wall motion.
4.2.1. Ultrasound examinations.Echocardiographic examinations include numerous diagnos-ing items: valvular heart disease, hypertensive heart disease, ischemic heart disease, cardiactumors, evaluation of the left and right atrium, evaluationof left ventricle(LV) systolic/diastolicfunction, congenital heart disease, diseases of the aorta,and so on. For more detailed descrip-tion on echocardiographic examinations, we refer to the literature ‘The Echocardiographer’sPocket Reference’ by T. Reynolds(2013) [43].
Among echocardiographic examinations, we consider only evaluation of LV function in-cluding dimensions, volumes, wall thickness, LV mass, LV mass index, longitudinal motion,radial motion, circumferential, segmental wall motion, wall motion score index, etc. For itsquantitative assessment, wall motion tracking and LV volume quantification at each time isneeded. To avoid labor-intensive and time-consuming manual LV tracing process, demand forautomated LV tracking and analysis methods has been rapidlygrowing and there have beenplenty of studies on LV tracking methods. In Section 6, we represent a problem on LV motiontracking and solutions by mathematical modelling.
4.2.2. A software for quantifying cardiac function.Automated LV tracking methods can be ap-plied to analyze and quantify LV function. TomTec is a leading company in medical imagingsoftware solutions and offers industry partners or clinicians various solutions for quantifyingcardiac function based on 2D and 3D echocardiography. As an example of software solutions,TomTec developed AutoStrainc© by applying automated LV tracking method to visualize LVfunction quantitatively. AutoStrainc© provides automated LV function analysis based on car-diac apical long axis views. It visualizes longitudinal strain results, obtained by 2D speckletracking, to be color-coded in the individual clips and combined in a Bull’s-eye plot.
4.2.3. A software for visualizing and quantifying blood flows.On the other hand, anotherimaging software company AMID has recently developed ‘hi-def flow tracking’ a software

INDUSTRIAL MATHEMATICS IN ULTRASOUND IMAGING 185
for visualizing and quantifying the motion of blood flow (http://www.amid.net). It is alsocalled Omega Flow (Siemens, Mountain View, CA). It is not based on color Doppler images,but echo-PIV technique applied to contrast-enhanced echocardiographic images. Along withstudies on its clinical possibility and feasibility, this software continues to develop to be usedto evaluate cardiac function clinically.
4.3. Radiological ultrasound. Ultrasound examinations in radiology consist of abdominal,vascular, musculoskeletal, breast, thyroid ultrasonographies, and so on. Most of ultrasound ex-aminations are performed by observing main features or measuring the shape and size of targetobjects using gray-scale B-mode images. Doppler ultrasound is used typically for evaluatingblood flow through blood vessels.
4.3.1. Ultrasound examinations.Abdominal ultrasonography is used for diagnosing the dis-eases of liver, gallbladder, spleen, pancreas, kidneys andbladder. As an example, liver isscanned to examine focal liver disease, diffuse liver disease and hepatic vasculature.
Vascular ultrasound is adopted typically for observing common/internal carotid artery anddiagnosing carotid stenosis and chronic mesenteric ischaemia. According to carotid arterystenosis, gray-scale B-mode images is used for characterizing plaques into four types andDoppler ultrasound is used for evaluating both the macroscopic appearance of plaques andflow characteristics [44].
Musculoskeletal ultrasound is a fast and dynamic way to examine shoulder impingement,shoulder instability and rotator cuff disorders. It also allows evaluation of the joint, tendons andligaments by imaging elbow anatomy and wrist anatomy. Moreover, it is used for diagnosinghand, hip, knee, ankle/foot, etc.
Breast ultrasound enables evaluating a symptomatic young or pregnant patient, to evaluatea palpable lump with negative or equivocal mammographic findings, and to distinguish be-tween benign and malignant characteristics. Benign characteristics of breast lesions includewell-circumscribed and hyperechoic tissue, wider than deep and gently curving smooth lobu-lation. Meanwhile, malignant characteristics contain sonographic spiculation, deeper (taller)than wide, micro-lobulation, thick hyperechoic halo, angular margins and markedly hypoe-choic nodule [45].
Ultrasonography of thyroid is used to diagnose multi-nodular goitre, colloid cyst and thy-roglossal duct cyst. Especially for diagnosing intra-nodular vascularity, Doppler ultrasoundis required. Large cystic component, comet tail artifact and halo are regarded as benign sono-graphic features of multi-nodular goitre, while intra-nodular blood flow, large size and presenceof micro-calcification are classified as malignant features.
In addition, ultrasound elastography is used for evaluating liver disease or detecting tumorsof breast and thyroid by providing additional stiffness information of tissues [46, 47]. Differ-ent from the conventional ultrasound imaging modes, it is a relatively new imaging mode forvisualizing qualitatively or quantitatively the stiffness information of tissues.
4.3.2. High technologies for radiology ultrasound.For radiology examinations, Samsung Medi-son has released a premium ultrasound system ‘RS80A with Prestige’ with high technologies:

186 J. JANG AND C. Y. AHN
S-Harmonic, HQ Vision, NeedleMateTM
, CEUS+, S-Fusion, S-Tracking, S-DetectTM
for Breast,S-Detect
TMfor Thyroid, S-Shearwave, ElastoScan
TM, etc. We can see the Samsung Medison’s
high technologies at: http://www.samsungmedison.com/ultrasound/general-imaging/rs80a/.
5. DOMESTIC-INDUSTRIAL PRODUCTS AND IMAGING TECHNOLOGIES
Samsung Medison and Alpinion are leading companies in domestic ultrasound imaging in-dustry. They have released many ultrasound imaging systemsfor OB/GYN, cardiology andradiology examinations. In this section, we deal with majorimaging features contained in theultrasound systems of Samsung Medison and Alpinion, and seehow mathematics is related tothe imaging features.
Based on the product information provided through the website or brochure, we comparethe imaging technologies of WS80A with Elite and E-CUBE 15EX(Women’s Health), whichare high-performance imaging systems for OB/GYN application, of Samsung Medison andAlpinion, respectively. Table 1 shows most of imaging technologies are implemented by beam-forming methods, signal processing, image processing methods such as speckle reduction, edgeenhancement, contrast enhancement, edge detection and image segmentation, digital scan con-version and elasticity imaging methods. 3D volume rendering and visualization techniques areused very much, especially for OB/GYN applications. As we know already, these ultrasoundimaging technologies are basically based on mathematical modelling, numerical solution andvisualization.
TABLE 1. Comparison of imaging technologies of two domestic companies:Samsung Medison and Alpinion for OB/GYN ultrasound.(SCI: spatial com-pound imaging, FCI: frequency compound imaging, DSC: digital scan conversion)
Samsung Medison (WS80A with Elite) Alpinion (E-CUBE 15EX)Features Technologies
S-Harmonic Harmonic Imaging signal processing (filter design)ClearVision
TMOptimal Imaging Suite
TMspeckle reduction, edge enhancement,
contrast enhancement, SCI, FCI5D Heart Color (Fetal heart examination) - 3D volume rendering, visualization
5D Limb Vol. - edge detection, automated measurement5D CNS+ (Fetal brain measurement) - visualization, segmentation
5D NT (Nuchal translucency measurement) Auto NT (Nuchal Translucency) 3D volume rendering, segmentation5D Follicle (Follicle measurement) - 3D visualization, segmentation
Realistic VueTM
Volume MasterTM
, Live HQTM
3D volume rendering, 3D DSCCrystal Vue - 3D volume rendering, 3D DSC
ElastoScanTM
Elastography elasticity imagingE-Breast
TM(ElastoScan
TMfor Breast)
E-ThyroidTM
(ElastoScanTM
for Thyroid)S-Detect - segmentation, edge detection
S-Vue Transducer Crystal SignatureTM
transducer manufactureWide angle endocavity transducer Extreme High Density Endovaginal transducer beam-forming, DSC
(E3-12A, Max210o) (EV3-10X / EC3-10X, Max230o)- Flow State mathematical modelling, optimization- Auto Trace PW, CW edge detection- Xpeed
TMmathematical modelling, optimization
INDUSTRIAL MATHEMATICS IN ULTRASOUND IMAGING 187
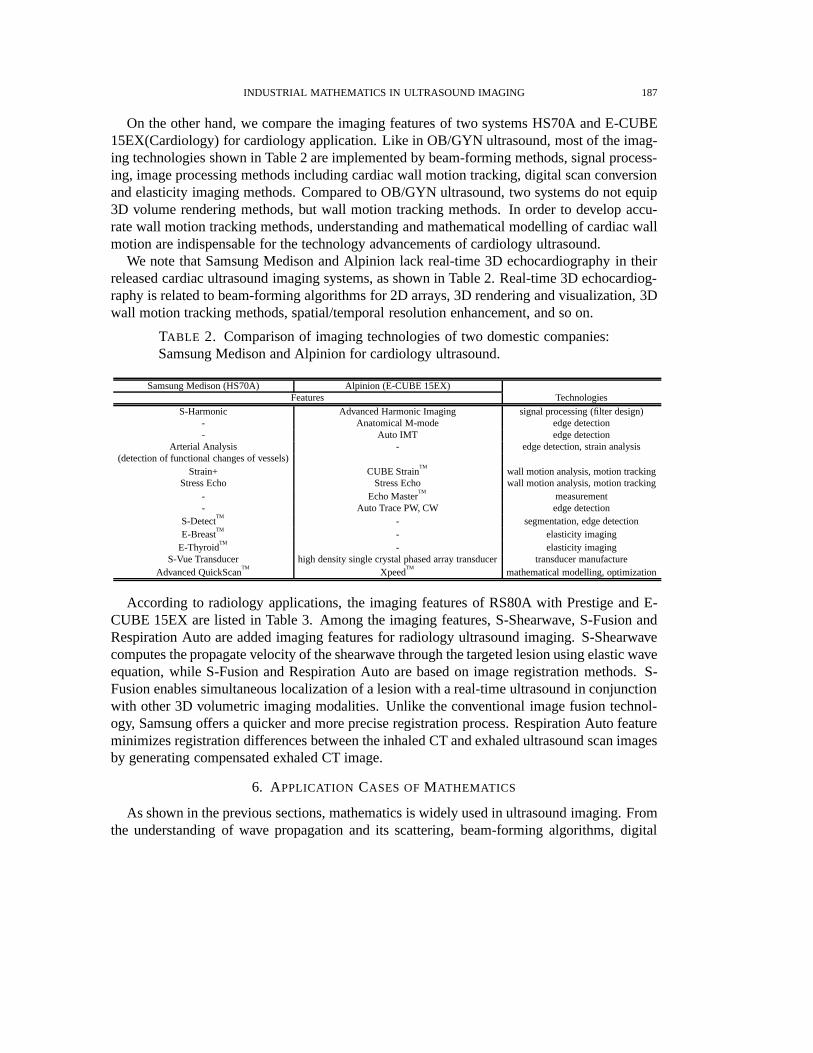
On the other hand, we compare the imaging features of two systems HS70A and E-CUBE15EX(Cardiology) for cardiology application. Like in OB/GYN ultrasound, most of the imag-ing technologies shown in Table 2 are implemented by beam-forming methods, signal process-ing, image processing methods including cardiac wall motion tracking, digital scan conversionand elasticity imaging methods. Compared to OB/GYN ultrasound, two systems do not equip3D volume rendering methods, but wall motion tracking methods. In order to develop accu-rate wall motion tracking methods, understanding and mathematical modelling of cardiac wallmotion are indispensable for the technology advancements of cardiology ultrasound.
We note that Samsung Medison and Alpinion lack real-time 3D echocardiography in theirreleased cardiac ultrasound imaging systems, as shown in Table 2. Real-time 3D echocardiog-raphy is related to beam-forming algorithms for 2D arrays, 3D rendering and visualization, 3Dwall motion tracking methods, spatial/temporal resolution enhancement, and so on.
TABLE 2. Comparison of imaging technologies of two domestic companies:Samsung Medison and Alpinion for cardiology ultrasound.
Samsung Medison (HS70A) Alpinion (E-CUBE 15EX)Features Technologies
S-Harmonic Advanced Harmonic Imaging signal processing (filter design)- Anatomical M-mode edge detection- Auto IMT edge detection
Arterial Analysis - edge detection, strain analysis(detection of functional changes of vessels)
Strain+ CUBE StrainTM
wall motion analysis, motion trackingStress Echo Stress Echo wall motion analysis, motion tracking
- Echo MasterTM
measurement- Auto Trace PW, CW edge detection
S-DetectTM
- segmentation, edge detectionE-Breast
TM- elasticity imaging
E-ThyroidTM
- elasticity imagingS-Vue Transducer high density single crystal phased array transducer transducer manufacture
Advanced QuickScanTM
XpeedTM
mathematical modelling, optimization
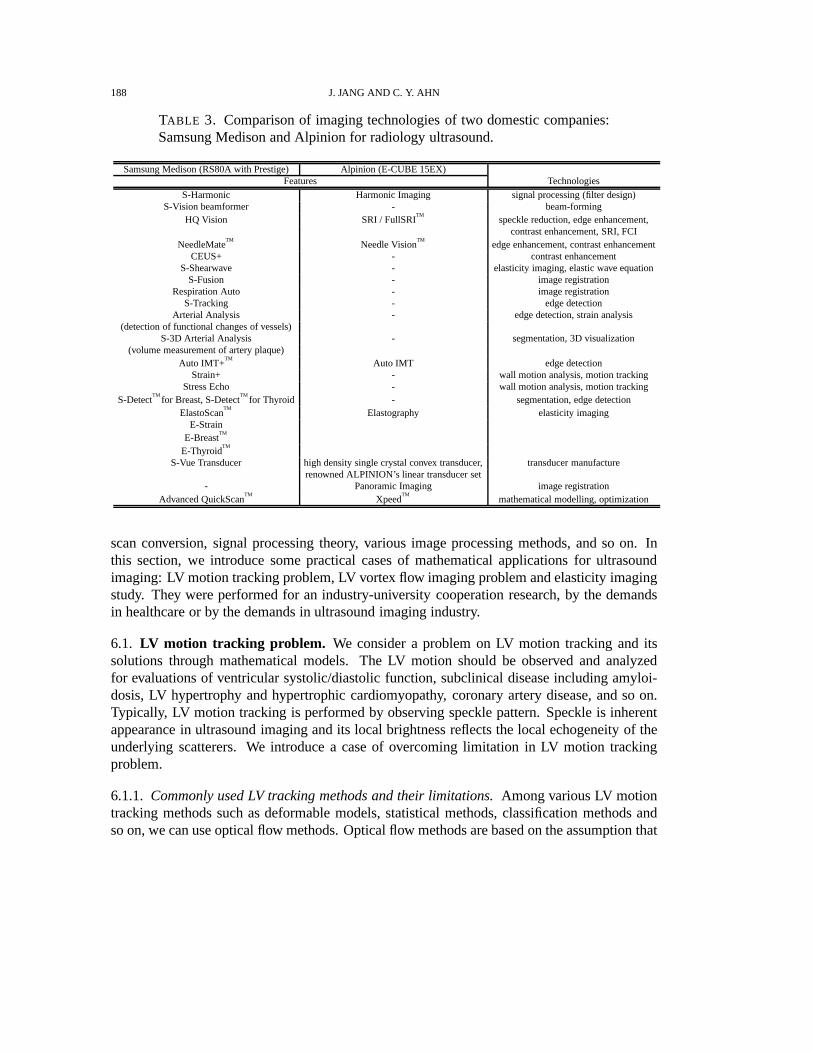
According to radiology applications, the imaging featuresof RS80A with Prestige and E-CUBE 15EX are listed in Table 3. Among the imaging features, S-Shearwave, S-Fusion andRespiration Auto are added imaging features for radiology ultrasound imaging. S-Shearwavecomputes the propagate velocity of the shearwave through the targeted lesion using elastic waveequation, while S-Fusion and Respiration Auto are based on image registration methods. S-Fusion enables simultaneous localization of a lesion with areal-time ultrasound in conjunctionwith other 3D volumetric imaging modalities. Unlike the conventional image fusion technol-ogy, Samsung offers a quicker and more precise registrationprocess. Respiration Auto featureminimizes registration differences between the inhaled CTand exhaled ultrasound scan imagesby generating compensated exhaled CT image.
6. APPLICATION CASES OFMATHEMATICS
As shown in the previous sections, mathematics is widely used in ultrasound imaging. Fromthe understanding of wave propagation and its scattering, beam-forming algorithms, digital
188 J. JANG AND C. Y. AHN
TABLE 3. Comparison of imaging technologies of two domestic companies:Samsung Medison and Alpinion for radiology ultrasound.
Samsung Medison (RS80A with Prestige) Alpinion (E-CUBE 15EX)Features Technologies
S-Harmonic Harmonic Imaging signal processing (filter design)S-Vision beamformer - beam-forming
HQ Vision SRI / FullSRITM
speckle reduction, edge enhancement,contrast enhancement, SRI, FCI
NeedleMateTM
Needle VisionTM
edge enhancement, contrast enhancementCEUS+ - contrast enhancement
S-Shearwave - elasticity imaging, elastic wave equationS-Fusion - image registration
Respiration Auto - image registrationS-Tracking - edge detection
Arterial Analysis - edge detection, strain analysis(detection of functional changes of vessels)
S-3D Arterial Analysis - segmentation, 3D visualization(volume measurement of artery plaque)
Auto IMT+TM
Auto IMT edge detectionStrain+ - wall motion analysis, motion tracking
Stress Echo - wall motion analysis, motion trackingS-Detect
TMfor Breast, S-Detect
TMfor Thyroid - segmentation, edge detection
ElastoScanTM
Elastography elasticity imagingE-Strain
E-BreastTM
E-ThyroidTM
S-Vue Transducer high density single crystal convex transducer, transducer manufacturerenowned ALPINION’s linear transducer set
- Panoramic Imaging image registrationAdvanced QuickScan
TMXpeed
TMmathematical modelling, optimization
scan conversion, signal processing theory, various image processing methods, and so on. Inthis section, we introduce some practical cases of mathematical applications for ultrasoundimaging: LV motion tracking problem, LV vortex flow imaging problem and elasticity imagingstudy. They were performed for an industry-university cooperation research, by the demandsin healthcare or by the demands in ultrasound imaging industry.
6.1. LV motion tracking problem. We consider a problem on LV motion tracking and itssolutions through mathematical models. The LV motion should be observed and analyzedfor evaluations of ventricular systolic/diastolic function, subclinical disease including amyloi-dosis, LV hypertrophy and hypertrophic cardiomyopathy, coronary artery disease, and so on.Typically, LV motion tracking is performed by observing speckle pattern. Speckle is inherentappearance in ultrasound imaging and its local brightness reflects the local echogeneity of theunderlying scatterers. We introduce a case of overcoming limitation in LV motion trackingproblem.
6.1.1. Commonly used LV tracking methods and their limitations.Among various LV motiontracking methods such as deformable models, statistical methods, classification methods andso on, we can use optical flow methods. Optical flow methods arebased on the assumption that

INDUSTRIAL MATHEMATICS IN ULTRASOUND IMAGING 189
that the intensity of a moving object is constant over time. Let I(r, t) represent the intensityof echocardiography at the locationr = (x, y) and the timet. Then the noisy time-varyingimagesI(r, t) approximately satisfy
u(r, t) · ∇I(r, t) +∂
∂tI(r, t) ≈ 0, (6.1)
whereu(r, t) is the velocity or displacement vector to be estimated. Especially, Lucas andKanade [48] used the locally constant motion to compute the velocity u(r0, t) at a targetlocation r0 = (x0, y0) and timet by forcing constant velocity in a local neighborhood ofr0 = (x0, y0) denoted byN (r0). Following them, Barronet al. [49] proposed an improvedmodel to estimate the velocityu(r0, t) by minimizing the weighted least square criterion in theneighborhoodN (r0):
u(r0, t) := argminu
∫
N (r0)
[
w(r− r0)
(
u(r, t) · ∇I(r, t) +∂
∂tI(r, t)
)2]
dr, (6.2)
wherew is a weight function.On the other hand, region-based method (also known as the block matching or pattern match-
ing method) can be also used as the LV motion tracking. Duanet al. [50] used the region-basedmethod with cross-correlation coefficient as similarity measure as follows. For given two con-secutive imagesI(·, t) andI(·, t +∆t), the displacementu(r, t) at each positionr and timetis estimated by maximizing the cross-correlation coefficient:
u(r0, t) := argmaxu
∫
N (r0)[I(r, t)I(r + u, t+∆t)]dr
√
∫
N (r0)[I(r, t)]2dr
√
∫
N (r0)[I(r+ u, t+∆t)]2dr
. (6.3)
However, there often exist some incorrectly tracked pointsin practical environment due to ul-trasound artifacts, dropouts, or shadowing phenomena of cardiac wall [51]. It is problematicto track the LV border in ultrasound images with unclear speckle pattern or weak signals. Inorder to overcome this problems, Ahn [52] proposed a mathematical model for robust myocar-dial border tracking by considering an affine transformation to describe a global motion that issynthesized by integrating local deformations.
6.1.2. A mathematical modelling for robust LV tracking.We denote the LV border traced atinitially selected frame by a parametric contourC∗ = r∗(s) = (x∗(s), y∗(s)) | 0 ≤ s ≤ 1that can be identified as itsn tracking pointsr∗1 = r
∗(s1), · · · , r∗n = r
∗(sn). Here,0 =s1 < s2 < · · · < sn = 1. Let C(t) = r(s, t) = (x(s, t), y(s, t)) | 0 ≤ s ≤ 1 bethe contour deformed fromC(0) = C∗ at time t. The motion of the contourC(t) will bedetermined by an appropriately chosen velocityU(t) indicating a time change of trackingpoints(r1(t), · · · , rn(t)):
U(t) :=
1(t)...
n(t)
=
d
dt
r1(t)...
rn(t)
with
r1(0)...
rn(0)
=
r∗1...r∗n

190 J. JANG AND C. Y. AHN
Here, we identify the contourC(t) with tracking points(r1(t), · · · , rn(t)). We computeU(t)for each timet by minimizing the following energy functional reflecting local-to-global defor-mation:
Et(U) :=1
2
n∑
i=1
∫
N (ri(t))w(r′ − ri(t))
ui · ∇I(r′, t) + ∂∂tI(r
′, t)2
dr′
+λ
∣
∣
∣
∣
ri(t) + ui −
[
a1(U) a2(U)a3(U) a4(U)
]
r∗i −
[
a5(U)a6(U)
]∣
∣
∣
∣
2
(6.4)
whereλ is a nonnegative parameter and the affine coefficientsa1(U), · · · , a6(U) at timet aregiven by
a1(U) a3(U)a2(U) a4(U)a5(U) a6(U)
=(
Φ(C∗)TΦ(C∗))−1
Φ(C∗)T
(r1(t) + u1)T
...(rn(t) + un)
T
, Φ(C∗) :=
r∗1T 1...
...r∗nT 1
.
This study has been performed as an industry-university cooperation research. Based on theproposed model, LV tracking methods of improved performance are being developed.
6.2. A new imaging mode: vortex flow imaging. Vortex flow imaging has recently attractedmuch attention as a new application for evaluating blood flow[53–55], because it visualizesand quantifies time-varying blood flow inside LV using available ultrasound data. It has shownthe potential possibility and availability for evaluatingblood flow. In order to compute thevelocity fields of blood flow, it is required to model blood flowbased on fluid equation.
6.2.1. A reconstruction problem of blood flow.With echo-PIV(particle image velocimetry)[56, 57] being representative, there are several methods tocompute and visualize the velocityfields of blood flow inside LV. Echo-PIV is based on optical flowmethods tracking the specklepatterns of blood flow to estimate blood motion. However, Echo-PIV is not completely nonin-vasive because it requires the intravenous injection of a contrast agent to obtain images suitablefor the speckle tracking algorithm. To develop less invasive techniques, methods to reconstructblood flows from color Doppler images have been proposed [58–63]. We represent mathe-matical models to reconstruct the velocity of blood flow, especially using color Doppler datareflecting one-directional velocity components of blood flow along scanlines.
6.2.2. A mathematical modelling of 3D blood flow.Let D be a 3D imaging domain,Ω(t) atime-varying LV region satisfyingΩ(t) ⊆ D ⊆ R
3, andT a beat cycle. For the beat cycleT ,we consider a spatial-temporal domainΩT defined byΩT :=
⋃
0<t<T
Ω(t)× t ⊆ D × (0, T ).
Let v(r, t) be a velocity field of the blood flow inΩt ∈ ΩT at timet. Then the fluid equationsgoverning the blood flowv is given by the 3D incompressible Navier-Stokes equations:
ρ
(
∂v
∂t+ v · ∇v
)
= −∇p+ µ∇2v in Ωt,
∇ · v = 0 in Ωt.
(6.5)

INDUSTRIAL MATHEMATICS IN ULTRASOUND IMAGING 191
In order to solve (6.5), we need proper boundary conditions or some conditions based onultrasound measurement data as follows:
Let a(r) be scanline directional unit vector at the positionr ∈ D andD(r, t) color Dopplerimage inΩt. GivenD(r, t), we then consider an inverse problem to find a 3D vector fieldv = (u, v, w) satisfying the following condition:
a(r) · v(r, t) = D(r, t). (6.6)
However, in clinical practice, it is currently very difficult to acquire 3D color Doppler imagesgiven by (6.6). A mathematical model appropriate to the measurements on 2D ultrasoundimaging should be considered.
6.2.3. A reconstruction model with mass-source term.Janget al. [64] suggested a 2D re-construction model using incompressible Navier-Stokes equations with mass-source terms toreflect 3D motion of blood flow as the following: LetD be a 2D imaging domain andΩ(t)the cross-section of the LV region in the A3CH view so that they satisfyΩ(t) ⊆ D ⊆ R
2 andv(x, t) = (u(x, t), v(x, t)) the velocity fields of flow at the positionx ∈ D and timet. Thenthe fluid equations governing the blood flow on the imaging planeD are modeled as
∂u
∂t+ u
∂u
∂x+ v
∂u
∂y= −
1
ρ
∂p
∂x+
µ
ρ∇2u+
µ
3ρ2∂s
∂x,
∂v
∂t+ u
∂v
∂x+ v
∂v
∂y= −
1
ρ
∂p
∂y+
µ
ρ∇2v +
µ
3ρ2∂s
∂y,
∂u
∂x+
∂v
∂y=
s
ρ,
(6.7)
We note that this model (6.7) is equivalent to a 2D incompressible flow having a source-sinkdistributions(x, t) [65]. In order to solve (6.7), we consider color Doppler images measuredpractically in the imaging planeD. We set the 3D coordinate system for thexy-plane to containΩ(t) and thez-axis to be normal to this plane. LetD(x, t) be the measured color Doppler data,expressed as the inner product of the scanline vector and thevelocity vector
D(x, t) = (a1(x), a2(x)) · (u(x, t), v(x, t)). (6.8)
Therefore, we obtain a mathematical problem to findv satisfying (6.7) and (6.8) simultane-ously. Some numerical simulations are performed for solving the given problem and validatingthe proposed mathematical model.
6.3. Acoustic radiation force-based elastography.Acoustic radiation force(ARF) is causedby absorbed ultrasound wave energy while ultrasound wave propagates through soft tissues.The absorbed energy accumulates in tissue and it generates volume force in the propagationdirection of ultrasound beam. This ARF technique enables inducing stress at desired positionand measuring response to the stress with a single ultrasound system, whereas other elastogra-phy techniques require manual push or additional devices toinduce stress or shear waves [66].We consider ARF-based shear wave elasticity imaging (SWEI)that maps tissue elasticity by
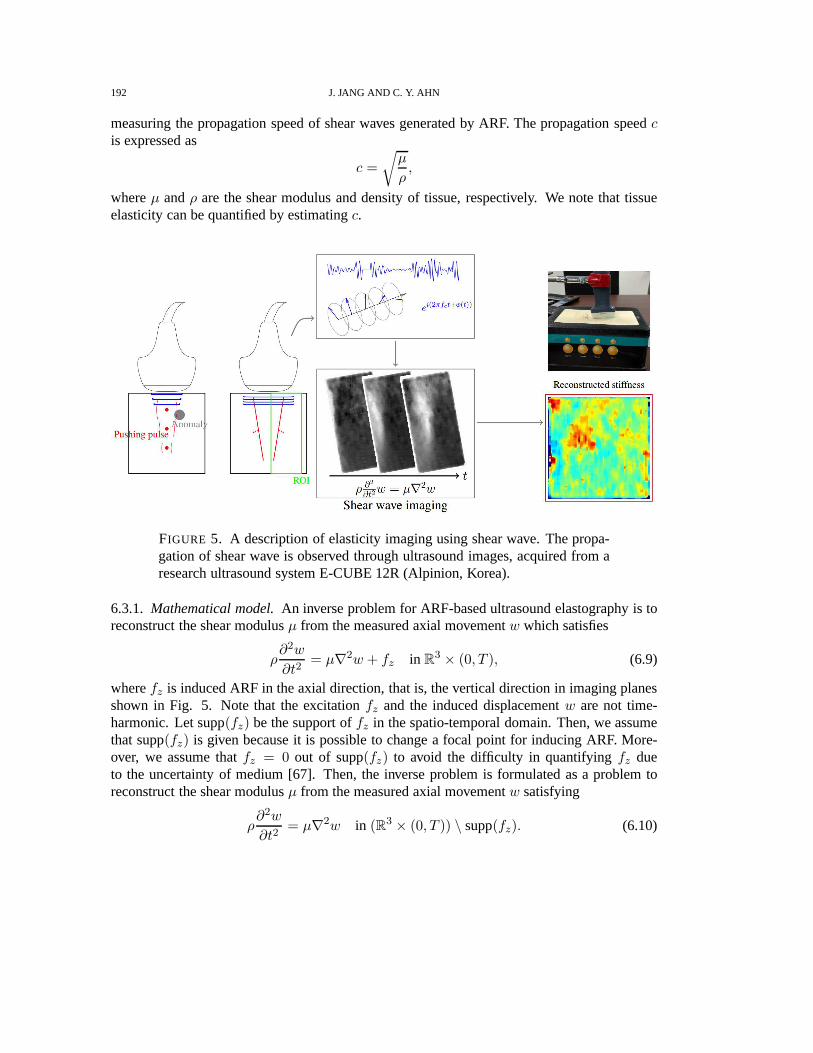
192 J. JANG AND C. Y. AHN
measuring the propagation speed of shear waves generated byARF. The propagation speedcis expressed as
c =
√
µ
ρ,
whereµ andρ are the shear modulus and density of tissue, respectively. We note that tissueelasticity can be quantified by estimatingc.
FIGURE 5. A description of elasticity imaging using shear wave. Thepropa-gation of shear wave is observed through ultrasound images,acquired from aresearch ultrasound system E-CUBE 12R (Alpinion, Korea).
6.3.1. Mathematical model.An inverse problem for ARF-based ultrasound elastography is toreconstruct the shear modulusµ from the measured axial movementw which satisfies
ρ∂2w
∂t2= µ∇2w + fz in R
3 × (0, T ), (6.9)
wherefz is induced ARF in the axial direction, that is, the vertical direction in imaging planesshown in Fig. 5. Note that the excitationfz and the induced displacementw are not time-harmonic. Let supp(fz) be the support offz in the spatio-temporal domain. Then, we assumethat supp(fz) is given because it is possible to change a focal point for inducing ARF. More-over, we assume thatfz = 0 out of supp(fz) to avoid the difficulty in quantifyingfz dueto the uncertainty of medium [67]. Then, the inverse problemis formulated as a problem toreconstruct the shear modulusµ from the measured axial movementw satisfying
ρ∂2w
∂t2= µ∇2w in (R3 × (0, T )) \ supp(fz). (6.10)

INDUSTRIAL MATHEMATICS IN ULTRASOUND IMAGING 193
Nightingaleet al. [68] suggested the algebraic inversion of the equation in (6.10) to estimateµρ :
µ
ρ=
∂2w∂t2
∇2w(6.11)
However, it could be unstable since numerical approximation of second-order derivatives in(6.10) are sensitive to noise. In many approaches, wave propagation speed is estimated bycomputingµ
ρ instead of the direct inversion [46,47,69].
t
w(r, t)
r
A
B
C
Tx
Tz
c =cxcz
√
c2x + c2zcx =
|rA − rB|
Txcz =
|rA − rC |
Tz
Wavefronts
A B
C
c
cx
cz
FIGURE 6. Illustration of time delaysTx and Tz for estimating the lateralspeedcx and axial speedcz of shear wave propagation.
We consider time delay to estimate the shear wave propagation speed. As shown in Fig. 6,let Tx be the time delay, that is, the difference between arrival times of the displacement signalby shear wave propagation at two positionsA andB placed on a lateral line. Then the shearwave propagation speedcx in the lateral direction is given by
cx =|rA − rB |
Tx, (6.12)
whererA andrB are the coordinates ofA andB, respectively. Therefore,Tx is computed by
Tx = arg maxτ∈(0,T )
∫ T
0w(x1, t)w(x2, t− τ)dt. (6.13)
Since the wave propagation direction may not be parallel to the lateral direction (Fig. 6) inmany cases of ARF-based excitation, we deal with the shear wave propagation speedcz in theaxial direction. Likewise, letTz be the time delay, that is, the difference between arrival times

194 J. JANG AND C. Y. AHN
of the displacement signal by shear wave propagation at two positionsA andC placed on aaxial line. Thencz is expressed as
cz =|rA − rC |
Tz, (6.14)
whererC is the coordinate ofC. From cx and cz, we can compute the propagation speedvelocity c [70]:
c =cxcy
√
c2x + c2z. (6.15)
t
w(r, t)
r
Soft
Hard
Softt = T (r)
Wav
epr
opag
ation
r
FIGURE 7. A simple description of TOF approach. The disturbance of bluecurve corresponds to the displacement at offset from the source. Arrival timeof the wave-front is tracked by the red line.
6.3.2. Eikonal equation-based approaches.As illustrated in Fig. 7, wave propagation speedcan be estimated from the slope between offset position and arrival time of wave-front. Thepropagation speedc can be estimated by the gradient of arrival timeT using the Eikonal equa-tion [71]:
|∇T | =1
c, (6.16)
whereT (r) is defined by
T (r) = inft > 0 : |w(r, t)| > 0. (6.17)
In a realistic case,T (r) is estimated by using a fixed thresholdδ above a noise level of theestimatedw(r, t) [72]:
T (r) ≈ inft > 0 : |w(r, t)| > δ. (6.18)
As an alternative way, the biased cross-correlationC is suggested by McLaughlinet al. [73]
T (r) ≈ arg maxτ∈(0,T )
1
T
∫ T
0w(rref, t)w(r, t− τ)dt for rref a reference point, (6.19)

INDUSTRIAL MATHEMATICS IN ULTRASOUND IMAGING 195
where
w(r, t) =
w(r, t) if 0 ≤ t ≤ T,
w(r, t − T ) if t ≥ T,
w(r, t + T ) if t ≤ 0.
(6.20)
7. CURRENT HOT TOPICS ANDCHALLENGING ISSUES
In this section, we introduce current hot topics in ultrasound imaging, especially in thedomestic ultrasound industry. Samsung Medison, a global medical equipment company and aleading domestic company, has recently published some white papers [74–80] on: S-Detect
TM,
5D CNS, E-ThyroidTM
, E-BreastTM
(breast ElastoScanTM
), S-Shearwave, Aterial Analysis, andso on. The white papers report the advantages and shortcomings of each technology.
7.1. Hot topics in ultrasound imaging.
• S-DetectTM
is a software analyzing the features of lesions and assessing the possibilityof malignancy. It uses a machine learning-based algorithm [81]. By showing excellentagreement of91.2% with the assessment of breast dedicated radiologist in interpretingthe breast mass, it is suggested as a good decision-making support for the beginnersor non-breast radiologists. However, with the sensitivityof 84.6% at the same time, itmissed two breast cancers of relatively circumscribed isoechoic and hypoechoic masseswith suspicious clinical findings. Therefore, it is reported that circumscribed malignantmasses may be remained as the limitation of S-Detect
TMand S-Detect
TMis not available
to find subtle suspicious features [74].• A semi-automatic method is proposed for biometric measurements of fetal central ner-
vous system(CNS) from 3D ultrasound volume data of brain. Itreduce the number ofoperations and examination time. Its high success rate>90% is reported under clinicalevaluation [75].
• E-ThyroidTM
uses carotid artery pulsation, not external compression byfree hands, as acompression source. While E-Thyroid
TMeffectively differentiates malignant from be-
nign in most thyroid nodules including calcified nodule, theextreme location of a nod-ule in the tyroid can affect the results [76].
• E-BreastTM
is helpful for characterizing different regions as a complementary diagnosticimaging technology, based on strain imaging technique. However, it would be impor-tant not to evaluate a lesion from an isolated manner with strain ratio generated fromE-Breast
TM[77].
• S-Shearwave is a technology enabling quantitative analysis of tissue stiffness for as-sessing liver fibrosis. Unlike the color map used in the conventional elasticity imaging,S-Shearwave displays the stiffness value and Reliable Measurement Index(RMI) forthe region of interest [78].
Among them, S-DetectTM
, 5D CNS and Aterial Analysis are CADe/CADx softwares. Thereare numerous demands of CADe and CADx for many medical imaging methodologies [82–85]as well as ultrasound [86–88]. According to the applications, CADe is implemented by various
196 J. JANG AND C. Y. AHN
image processing methods: histogram-based thresholding and active contours for segmentinganomaly [83], neural network-based approaches for robust segmentation [89–91]. In the lit-eratures [86, 87], it is reported that neural network and support vector machine techniques areused for CADx.
On the other hand, currently commercialized elasticity imaging modes:E-ThyroidTM
, E-Breast
TM, S-Shearwave [76–78] are commonly used as a complementary diagnostic tool. It
is required to quantify more accurately the stiffness of tissues.Fusion imaging techniques have been used for volume navigation of 2D ultrasound images
within other 3D CT or MR images. In order to register different images acquired from med-ical imaging modalities, the fusion imaging techniques have been developed with the help oflandmarks, position sensors, or electromagnetic needle tracking [92–94]. As real-time 3D ul-trasound imaging becomes feasible, fusion imaging technique for 3D volume data is consideredas a promising tool for computer-aided surgery [94–96]. In 3D fusion imaging, external devicessuch as landmarks, position sensors or electromagnetic needle tracking can be removed [97,98].Samsung Medison developed the fusion imaging techniques called S-Fusion.
Additionally, we introduce some issues in ultrasound imaging, related to mathematical mod-elling, numerical solutions, image processing and visualization.
7.2. Issues on LV tracking methods.
• Real-time 3D ultrasound imaging is capable of providing good 3D visualization of or-gans. However, its resolution is not good enough to discriminate features smaller thana few millimeters and LV tracking methods based on speckles are not appropriate tobe applied to 3D ultrasound images. We can consider 3D LV tracking by constructingthe motion of 3D LV shape from 2D LV borders, which are extracted by applying LVtracking methods to multiple 2D echocardiography data. Howcan we model the rela-tionship between the change of LV borders observed on 2D echocardiography and the3D LV shape?
• LV motion tracking methods include inevitable limitation on 2D echocardiographybecause of the helical structure of cardiac ventricular anatomy. For a heartbeat cycle,it is difficult to track a portion of LV border designated at the initial stage on a 2Dultrasound image. In fact, it gets out of the imaging plane. How can we model therelationship between the change of LV borders observed on 2Dechocardiography andthe 3D helical behavior of cardiac motion?
7.3. Issues on vortex flow imging.
• Vortex flow imaging consists of defining LV geometry from echocardiographic imagesand reconstructing the velocity field of blood flow in the moving LV region. Let usassume that the acquisition of 3D color Doppler imaging at high frame rate is available.Can we model an inverse problem for reconstructing the 3D velocity field of blood flowfrom the partial velocity information obtained through the3D color Doppler images?[99].
INDUSTRIAL MATHEMATICS IN ULTRASOUND IMAGING 197
7.4. Issues on elasticity imaging.
• Inherent low SNR of the estimatedw makes the direct inversion (6.11) difficult so thatmany models reconstructingc are based on the time-of-flight(TOF)-based approaches.However, they do not fully guarantee stability in practicalsituations since the inverseof time-delay or|∇T | are still necessary for the speed estimation. In order to overcomethe problem, Wanget al. suggest a fitting model for the estimatedT (r) [100]
T (r) = β · r+ t0, (7.1)
wheret0 is a fitting parameter andβ a fitting parameter vector satisfying
|β| = c. (7.2)
However, in inhomogeneous medium, the fitting model (7.1) could not describeT (r)properly because refraction on the boundary between different tissues makes non-lineardistortion of arrival-time. We need a modified fitting model for T (r) which assumesthe presence of anomaly.
8. CONCLUSION
Ultrasound imaging industry is very promising in terms of technology advancements as wellas the market size and growth. Like in other industries, the ultrasound imaging technologieshave been advanced and innovated throughMathematics. In this article, we described the his-tory of ultrasound imaging, its basic principle, its diagnostic applications, domestic-industrialproducts, practical use of mathematics, hot topics and challenging issues related to ultrasoundimaging. Through them, we confirmed thatMathematicshas been used commonly as mathe-matical modelling, numerical solutions and visualization, combined with science, engineeringand medicine in ultrasound imaging.
The practical use ofMathematicsin ultrasound imaging requires the understanding of humanbody and imaging system overall. Based on that understanding, we should perform physics-based mathematical modelling, deal with the measurement data acquired through ultrasoundimaging systems and solve various problems and challengingissues in ultrasound imaging.
Currently, there are still numerous demands of technology advancements in healthcare andultrasound imaging industry, especially in domestic ultrasound industry. As we have seen be-fore, Mathematicscan contribute to the advances and innovation of ultrasoundimaging tech-nology. We hope many mathematicians contribute much to ultrasound technology innovation.
ACKNOWLEDGEMENTS
This work was supported by the National Institute for Mathematical Sciences(NIMS) andthe National Research Foundation of Korea (NRF) grants funded by the Korea government(No.NRF-20151009350). We would like to thank reviewers for their detailed comments and sug-gestions to improve the paper. Also, we thank Haeeun Han for her help with rendering theTOC art.

198 J. JANG AND C. Y. AHN
REFERENCES
[1] Medical Equipment Market Size & Growth - Diagnostic Imaging[Ultrasound Systems] Market,Global 2006-2013, USD Constant Millions, Global Data, https://medical.globaldata.com.
[2] Medical Equipment Market Size & Growth - Diagnostic Imaging[Ultrasound Systems] Market,Global 2013-2020, USD Constant Millions, Global Data, https://medical.globaldata.com.
[3] Medical Equipment Market Size & Growth - Diagnostic Imaging[Ultrasound Systems] Company Shaare ByPercentage,Global 2012, USD Constant Millions, Global Data, https://medical.globaldata.com.
[4] T. Szabo,Diagnostic Ultrasound Imaging: Inside Out, Academic Press, Boston University, 2004.[5] D. H. Evans and W. N. McDicken,Doppler Ultrasound - Physics, Instrumentation and Signal Processing,
2nd ed., John Wiley and Sons, New York, 2000.[6] J. Woo, A short history of the developments of ultrasound in obstetrics and gynecology.http://www.ob-
ultrasound.net/hydrophone.html, 1999.[7] A.M. King, Development, advances and applications of diagnostic ultrasound in animals, The Veterinary
Journal,1713 (2006), 408–420.[8] J. Curie and P. Curie,Development par pression de l’ectricite polaire dans les cristaux hemidres a faces
inclinees, Compte Rendue de l’ Acadamie Scientifique,91 (1880), 294–295.[9] K. T. Dussik,Über die Möglichkeit, hochfrequente mechanische Schwingungen als diagnostisches Hilfsmittel
zu verwerten, Zeitschrift für die gesamte Neurologie und Psychiatrie,174(1) (1942), 153–168.[10] G. D. Ludwig and F. W. Struthers,Considerations underlying the use of ultrasound to detect gall stones and
foreign bodies in the tissues, United States Navy Medical Research Institute Report,4 (1949), 1–27.[11] I. Donald, J. Macvicar and T. G. Brown,Investigation of abdominal masses by pulsed ultrasound, Lancet,1
(1958), 1189–1195.[12] Y. Nimura, History of pulse and echo Doppler ultrasound in Japan, Cardiac Doppler Diagnosis, Martimus
Nijoff Publishers, Boston, 1983.[13] R. W. J. Felix, B. Sigel, R. J. Gibson, J. Williams and G. L. Popky,Pulsed Doppler ultrasound detection of
flow disturbances in arteriosclerosis, J. Clin. Ultrasound,4(4) (1976), 275–282.[14] D. S. Evans and F. B. Cockett,Diagnosis of deep-vein thrombosis with an ultrasonic Doppler technique, Br.
Med. J.,2 (1969), 802–804.[15] P. N. T. Wells,A range-gated ultrasonic Doppler system, Medical and Biological Engineering,7(6) (1969),
641–652.[16] G. R. Curry and D. N. White,Color coded ultrasonic differential velocity arterial scanner (Echoflow), Ultra-
sound Med. Biol.,4 (1978), 27–35.[17] B. Sigel,A brief history of Doppler ultrasound in the diagnosis of peripheral vascular disease, Ultrasound
Med. Biol.,24(2) (1998), 169–176.[18] J. F. Brinkley, S. K. Muramatsu, W. D. McCallum and R. L. Popp,In vitro evaluation of an ultrasonic three-
dimensional imaging and volume system, Ultrasonic Imaging,4(2) (1982), 126–139.[19] K. Baba, K. Satoh, S. Sakamoto, T. Okai and S. Ishii,Development of an ultrasonic system for three-
dimensional reconstruction of the fetus, Journal of Perinatal Medicine-Official Journal of the WAPM, 17(1)(1989), 19–24.
[20] J. Deng, J. E. Gardener, C. H. Rodeck and W. R. Lees,Fetal echocardiography in three and four dimensions,Ultrasound Med. Biol.,22(8) (1996), 979–986.
[21] S. L. Kobal, S. S. Lee, R. Willner, F. E. A. Vargas, H. Luo,C. Watanabe, Y. Neuman, T. Miyamoto andR. J. Siegel,Hand-carried cardiac ultrasound enhances healthcare delivery in developing countries, Am. J.Cardiol.,94(4) (2004), 539-541.
[22] H. Shmueli, Y. Burstein, I. Sagy, Z. H. Perry, R. Ilia, Y.Henkin, T. Shafat, N. Liel-Cohen and S. L.Kobal, Briefly Trained Medical Students Can Effectively Identify Rheumatic Mitral Valve Injury Using aHand?Carried Ultrasound, Echocardiography,30(6) (2013), 621–626.

INDUSTRIAL MATHEMATICS IN ULTRASOUND IMAGING 199
[23] J. S. Shanewise, A. T. Cheung, S. Aronson, W. J. Stewart,R. L. Weiss, J. B. Mark, R. M. Savage, P. Sears-Rogan, J. P. Mathew, M. A. Quiñones, M. K. Cahalan MK and J. S. Savino, ASE/SCA guidelines for per-forming a comprehensive intraoperative multiplane transesophageal echocardiography examination: recom-mendations of the American Society of Echocardiography Council for Intraoperative Echocardiography andthe Society of Cardiovascular Anesthesiologists Task Force for Certification in Perioperative TransesophagealEchocardiography, Anesth. Analg.,89(4) (1999), 870–884.
[24] H. F. Andersen,Transvaginal and transabdominal ultrasonography of the uterine cervix during pregnancy,Journal of Clinical Ultrasound,19(2) (1991), 77–83.
[25] J. A. Jensen, D. Gandhi and W. D. O’Brien,Ultrasound fields in an attenuating medium, Proceedings of theIEEE 1993 Ultrasonics Symposium, 1993.
[26] A. Macovski,Ultrasonic imaging using arrays, Proceedings of the IEEE, 1979.[27] J. A. Jensen,A Model for the Propagation and Scattering of Ultrasound in Tissue, J. Acoust. Soc. Am.,89
(1991), 182–191.[28] J. A. Jensen and N. B. Svendsen,Calculation of pressure fields from arbitrarily shaped, apodized, and excited
ultrasound transducers, IEEE Trans. Ultrason., Ferroelec., Freq. Contr.,39 (1992), 262–267.[29] J. A. Jensen,Field: A Program for Simulating Ultrasound Systems, the 10th Nordic-Baltic Conference on
Biomedical Imaging Published in Medical & Biological Engineering & Computing,34 (1996), 351–353.[30] AIUM, AIUM Practice Parameter for the Performance of Obstetric Ultrasound Examinations,
http://www.aium.org/resources/guidelines/obstetric.pdf, 2013.[31] R. Rastogi, G. L. Meena, N. Rastogi and V. Rastogi,Interstitial ectopic pregnancy: A rare and difficult
clinicosonographic diagnosis, J. Hum. Reprod. Sci.,1(2) (2008), 81–82.[32] L. F. Gonçalves, W. Lee, J. Espinoza and R. Romero,Three-and 4-Dimensional Ultrasound in Obstetric Prac-
tice Does It Help?, J. Ultrasound Med.,24(12) (2005), 1599–1624.[33] N. J. Dudley,A systematic review of the ultrasound estimation of fetal weight, Ultrasound Obstet. Gynecol.,
25(1) (2005), 80–89.[34] S. Feng, K. S. Zhou and W. Lee,Automatic fetal weight estimation using 3D ultrasonography, Proceedings of
Medical Imaging 2012: Computer-Aided Diagnosis, California, USA 2012.[35] I.-W. Lee, C.-H. Chang, Y.-C. Cheng, H.-C. Ko and F.-M. Chang,A review of three-dimensional ultrasound
applications in fetal growth restriction, Journal of Medical Ultrasound,20(3) (2012), 142–149.[36] S. Yagel, S. M. Cohen, I. Shapiro and D. V. Valsky,3D and 4D ultrasound in fetal cardiac scanning: a new
look at the fetal heart, Ultrasound Obstet. Gynecol.,29(1) (2007), 81–95.[37] B. Messing, S. M. Cohen, D. V. Valsky, D. Rosenak, D. Hochner-Celnikier, S. Savchev and S. Yagel,Fetal
cardiac ventricle volumetry in the second half of gestationassessed by 4D ultrasound using STIC combinedwith inversion mode, Ultrasound Obstet. Gynecol.,30(2) (2007), 142–151.
[38] H. Laurichesse–Delmas, O. Grimaud, G. Moscoso and Y. Ville, Color Doppler study of the venous circula-tion in the fetal brain and hemodynamic study of the cerebraltransverse sinus, Ultrasound in Obstetrics andGynecology,13(1) (1999), 34–42.
[39] R. K. Pooh and K. Pooh, K,.Transvaginal 3D and Doppler ultrasonography of the fetal brain, Seminars inperinatology 2001,25(1) (2001), 38–43.
[40] W. Sepulveda, I. Rojas, J. A. Robert, C. Schnapp and J. L.Alcalde,Prenatal detection of velamentous insertionof the umbilical cord: a prospective color Doppler ultrasound study, Ultrasound in obstetrics & gynecology,21(6) (2003), 564–569.
[41] D. E. Fitzgerald and J. E. Drumm,Non-invasive measurement of human fetal circulation usingultrasound: anew method, Br. Med. J.,2(6100) (1977), 1450–1451.
[42] A. Dall’Asta, G. Paramasivam, C. C. Lees,Crystal Vue technique for imaging fetal spine and ribs, Ultrasoundin Obstetrics & Gynecology ,47(3) (2016), 383–384.
[43] T. Reynolds,The Echocardiographer’s Pocket Reference, 4th Edition, Arizona Heart Institute, Phoenix, Ari-zona, USA, 2013.

200 J. JANG AND C. Y. AHN
[44] E. G. Grant, C. B. Benson, G. L. Moneta, A. V. Alexandrovet al., Carotid artery stenosis: gray-scaleand Doppler US diagnosis–Society of Radiologists in Ultrasound Consensus Conference, Radiology,229(2)(2003), 340–346.
[45] A. T. Stavros, D. Thickman, C. L. Rapp, M. A. Dennis, S. H.Parker and G. A. Sisney,Solid breast nodules:use of sonography to distinguish between benign and malignant lesions, Radiology,196(1) (1995), 123–134.
[46] M. L. Palmeri, M. H. Wang, J. J. Dahl, K. D. Frinkley and K.R. Nightingale,Quantifying hepatic shearmodulus in vivo using acoustic radiation force, Ultrasound in Medicine & Biology,34(4) (2008), 546–558.
[47] M. Tanter, J. Bercoff, A. Athanasiou, T. Deffieux, J.-L.Gennisson, G. Montaldo, M. Muller, A. Tardivonand M. Fink,Quantitative assessment of breast lesion viscoelasticity: initial clinical results using supersonicshear imaging, Ultrasound in Medicine & Biology,34(9) (2008), 1373–1386.
[48] B. Lucas, T. Kanade,An iterative image restoration technique with an application to stereo vision, Proceedingsof DARPA IU Workshop, (1981), 121–130.
[49] J. L. Barron, D. J. Fleet, S. S. Beauchemin,Performance of optical flow techniques, Int. J. Comput. Vision,12(1) (1994), 43–77.
[50] Q. Duan, E. D. Angelini, S. L. Herz, C. M. Ingrassia, K. D.Costa, J. W. Holmes, S. Homma and A. F. Laine,Region-Based Endocardium Tracking on Real-Time Three-Dimensional Ultrasound, Ultrasound Med. Biol.,35(2) (2009), 256–265.
[51] K. Y. E. Leung, M. G. Danilouchkine, M. van Stralen, N. deJong, A. F. van der Steen and J. G. Bosch,Left ventricular border tracking using cardiac motion models and optical flow, Ultrasound Med. Biol.,37(4)(2011), 605–616.
[52] C. Y. Ahn, Robust Myocardial Motion Tracking for Echocardiography: Variational Framework IntegratingLocal-to-Global Deformation, Computational and Mathematical Methods in Medicine,2013(2013), 974027.
[53] G.-R. Hong, G. Pedrizzetti, G. Tonti, P. Li, Z. Wei, J. K.Kim, A. Baweja, S. Liu, N. Chung, H. Houle, J.Narula, and M. A. Vannan,Characterization and Quantification of Vortex Flow in the Human Left Ventricleby Contrast Echocardiography Using Vector Particle Image Velocimetry, JACC: Cardiovascular Imaging,1(6)(2008), 705-717.
[54] P. P. Sengupta, G. Pedrizzetti, P. J. Kilner, A. Kheradvar, T. Ebbers, G. Tonti, A. G. Fraser and J. Narula,Emerging Trends in CV Flow Visualization, JACC: Cardiovascular Imaging,5(3) (2012), 305-316.
[55] D. R. Muñoz, M. Markl, J. L. Moya Mur, A. Barker, C. Fernández-Golfin, P. Lancellotti and J. L. Z. Gómez,Intracardiac flow visualization: current status and futuredirections, European Heart Journal- CardiovascularImaging,14 (2013), 1029-1038.
[56] H. Gao, P. Claus, M.-S. Amzulescu, I. Stankovic, J. D’Hooge and J.-U. Voigt,How to optimize intracardiacblood flow tracking by echocardiographic particle image velocimetry? Exploring the influence of data ac-quisition using computer-generated data sets, European Heart Journal Cardiovascular Imaging,13(6) (2012),490-499.
[57] H. Gao, B. Heyde and J. D’Hooge,3D Intra-cardiac flow estimation using speckle tracking: a feasibility studyin synthetic ultrasound data, Proceedings of the IEEE International Ultrasonics Symposium (IUS’13), Prague,Czech Republic, July 2013.
[58] D. Garcia, J. C. Del Álamo, D. Tanné, R. Yotti, C. Cortina, É. Bertrand, J. C. Antoranz, E. Pérez-David, R.Rieu, F. Fernández-Avilés and others,Two-dimensional intraventricular flow mapping by digital processingconventional color-doppler echocardiography images,IEEE Transactions on Medical Imaging,29(10) (2010),1701–1713.
[59] S. Ohtsuki and M. Tanaka,The flow velocity distribution from the Doppler informationon a plane in three-Dimensional flow,Journal of Visualization,9(1) (2006), 69–82.
[60] M. Arigovindan, M. Suhling, C. Jansen, P. Hunziker and M. Unser,Full motion and flow field recovery fromecho Doppler data,IEEE Transactions on Medical Imaging,26(1) (2007), 31–45.
[61] A. Gomez, K. Pushparajah, J. M. Simpson, D. Giese, T. Schaeffter and G. Penney,A sensitivity analysis on 3Dvelocity reconstruction from multiple registered echo Doppler views,Medical Image Analysis,17(6) (2013),616–631.

INDUSTRIAL MATHEMATICS IN ULTRASOUND IMAGING 201
[62] A. Gomez, A. de Vecchi, M. Jantsch, W. Shi, K. Pushparajah, J. M. Simpson, N. P. Smith, D. Rueckert, T.Schaeffter and G. P. Penney,4D blood flow reconstruction over the entire ventricle from wall motion andblood velocity derived from ultrasound data,IEEE Trans. on Medical Imaging,34(11) (2015), 2298–2308.
[63] F. Mehregan, F. Tournoux, S. Muth, Pibarot, Philippe and R. Rieu, G. Cloutier and D. Garcia,Doppler vor-tography: a color doppler approach to quantification of intraventricular blood flow vortices,Ultrasound inMedicine and Biology,40(1) (2014), 210–221.
[64] J. Jang, C. Y. Ahn, K. Jeon, J. Heo, D. Lee, C. Joo, J.-i. Choi and J. K. Seo,A reconstruction method ofblood flow velocity in left ventricle using color flow ultrasound, Computational and Mathematical Methods inMedicine,2015(2015), 108274.
[65] G. K. BatchelorAn Introduction to Fluid Dynamics, Cambridge Mathematical Library, Cambridge UniversityPress, Cambridge, UK, 2000.
[66] A. Sarvazyan, T. J. Hall, M. W. Urban, M. Fatemi, S. R. Aglyamov and B. S. Garra,An overview of elastog-raphy - an emrging branch of medical imaging, Current Medical Imaging Reviews,7 (2011), 255–282.
[67] J. Bercoff, M. Tanter and M. Fink,Supersonic shear imaging: a new technique for soft tissue elasticity map-ping, IEEE Transactions on Ultrasonics, Ferroelectrics, and Frequency Control,51 (2004), 396–409.
[68] K. Nightingale, S. McAleavey and G. Trahey,Shear-wave generation using acoustic radiation force: in vivoand ex vivo results, Ultrasound in Medicine & Biology,29(12) (2003), 1715–1723.
[69] N. C. Rouze, M. H. Wang, M. L. Palmeri and K. R. Nightingale,Robust estimation of time-of-flight shear wavespeed using a radon sum transformation, IEEE Transactions on Ultrasonics, Ferroelectrics, and FrequencyControl,57(12) (2010), 2662–2670.
[70] P. Song, A. Manduca, H. Zhao, M. W. Urban, J. F. Greenleafand S. Chen,Fast shear compounding usingrobust 2-d shear wave speed calculation and multi-directional filtering, Ultrasound in Medicine & Biology,40(6) (2014), 1343–1355.
[71] L. Ji, J. R. McLaughlin, D. Renzi and J.-R. Yoon,Interior elastodynamics inverse problems: shear wave speedreconstruction in transient elastography, Inverse Problems,19(6) (2003), S1.
[72] J. McLaughlin and D. Renzi,Using level set based inversion of arrival times to recover shear wave speed intransient elastography and supersonic imaging, Inverse Problems,22(2) (2006), 707.
[73] J. McLaughlin and D. Renzi,Shear wave speed recovery in transient elastography and supersonic imagingusing propagating fronts, Inverse Problems,22(2) (2006), 681.
[74] E. Y. Ko, S-DetectTM
in Breast Ultrasound : Initial Experience, White Paper, WP201411-SMC-SDetect, Sam-sung Medison, 2014.
[75] K. Lee, J. Yoo and S. Kim,A novel semi-automatic method for biometric measurements of the fetal brain,White Paper, WP201412-5D-CNS, Samsung Medison, 2014.
[76] V. F. Duda and C. Köhler,An improved quantification tool for breast ElastoScanTM
: E-BreastTM
, White Paper,WP201503-E-Breast
TM, Samsung Medison, 2015.
[77] D. J. Lim and M. H. Kim,Experiences of Intrinsic Compression Ultrasound Elastography (E-ThyroidTM
)
in Differentiating Benign From Malignant Thyroid Nodule, White Paper, WP201504-E-ThyroidTM
, SamsungMedison, 2015.
[78] W. K. Jeong,Liver stiffness measurement using S-Shearwave : initial experience, White Paper, CS201505-S-Shearwave, Samsung Medison, 2015.
[79] J. H. Yoon, H. J. Chang, J. W. Kim and N. ChungThe value of multi-directional movement of carotid artery asa novel surrogate marker for acute ischemic stroke assessedby Arterial Analysis, White Paper, WP201506-ArterialAnalysis, Samsung Medison, 2015.
[80] A. Martegani and L. Aiani,Technological advancements improve the sensitivity of CEUS diagnostics, WhitePaper, WP201507-CEUS, Samsung Medison, 2015.
[81] Samsung Applies Deep Learning Technology to Diagnostic Ultrasound Imaging,Samsung Newsroom,https://news.samsung.com.
[82] R. A. Castellino,Computer aided detection (CAD): an overview, Cancer Imaging,5(1) (2005), 17–19.

202 J. JANG AND C. Y. AHN
[83] A. Jalalian, S. B. Mashohor, H. R. Mahmud, M. I. B. Saripan, A. R. B. Ramli and B. Karasfi,Computer-aideddetection/diagnosis of breast cancer in mammography and ultrasound: a review, Clin. Imaging,37(3) (2013),420–426.
[84] K. Doi, Computer-aided diagnosis in medical imaging: historical review, current status and future potential,Comput. Med. Imaging Graph.,31(4) (2007), 198–211.
[85] B. van Ginneken, C. M. Schaefer-Prokop and M. Prokop,Computer-aided diagnosis: how to move from thelaboratory to the clinic, Radiology,261(3) (2011), 719–732.
[86] B. Lei, E. L. Tan, S. Chen, L. Zhuo, S. Li, D. Ni and T. Wang,Automatic recognition of fetal facial standardplane in ultrasound image via fisher vector, PloS one,10(5) (2015), e0121838.
[87] S. Joo, Y. S. Yang, W. K. Moon and H. C. Kim,Computer-aided diagnosis of solid breast nodules: use of anartificial neural network based on multiple sonographic features, IEEE Trans. Med. Imaging,23(10) (2004),1292–1300.
[88] S. H. Kim, J. M. Lee, K. G. Kim, J. H. Kim, J. Y. Lee, J. K. Hanand B. I. Choi,Computer-aided image analysisof focal hepatic lesions in ultrasonography: preliminary results, Abdom. Imaging,34(2) (2009), 183–191.
[89] R. Llobet, J. C. Pérez-Cortés, A. H. Toselli and A. Juan,Computer-aided detection of prostate cancerInter-national Journal of Medical Informatics,76(7) (2007), 547–556.
[90] D. R. Chen, R. F. Chang, W. J. Kuo, M. C. Chen and Y. L. Huang, Diagnosis of breast tumors with sonographictexture analysis using wavelet transform and neural networks, Ultrasound Med. Biol.,28(10) (2002), 1301–1310.
[91] Y. L. Huang and D. R. Chen,Watershed segmentation for breast tumor in 2-D sonography, Ultrasound Med.Biol., 30(5) (2004), 625–632.
[92] D. L. Sandulescu, D. Dumitrescu, I. Rogoveanu and A. Saftoiu,Hybrid ultrasound imaging techniques (fusionimaging), World J. Gastroenterol.,17(1) (2011), 49–52.
[93] W. Wein, S. Brunke, A. Khamene, M. R. Callstrom and N. Navab,Automatic CT-ultrasound registration fordiagnostic imaging and image-guided intervention, Med. Image Anal.,12(5) (2008), 577–585.
[94] T. Lange, N. Papenberg, S. Heldmann, J. Modersitzki, B.Fischer, H. Lamecker and P. M. Schlag,3Dultrasound-CT registration of the liver using combined landmark-intensity information, Int. J. Comput. Assist.Radiol. Surg.,4(1) (2009), 79–88.
[95] M. W. Lee, Fusion imaging of real-time ultrasonography with CT or MRI for hepatic intervention, Ultra-sonography,33(4) (2014), 227–239.
[96] C. Ewertsen, A. Saftoiu, L. G. Gruionu, S. Karstrup and M. B. Nielsen,Real-time image fusion involvingdiagnostic ultrasound, Am. J. Roentgenol.,200(3) (2013), W249–W255.
[97] B. C. Porter, D. J. Rubens, J. G. Strang, J. Smith, S. Totterman and K. J. Parker,Three-dimensional registrationand fusion of ultrasound and MRI using major vessels as fiducial markers, IEEE Trans. Med. Imaging,20(4)(2001) 354–359.
[98] A. Roche, S. Pennec, G. Malandain and N. Ayache,Rigid registration of 3-D ultrasound with MR images:a new approach combining intensity and gradient information, IEEE Trans. Med. Imaging,20(10) (2001),1038–1049.
[99] J. Jang, C. Y. Ahn, J.-I. Choi and J. K. Seo,Inverse Problem for Color Doppler Ultrasound-Assisted Intracar-diac Blood Flow Imaging, Computational and Mathematical Methods in Medicine,2016(2016), 6371078.
[100] M. H. Wang, M. L. Palmeri, V. M. Rotemberg, N. C. Rouze and K. R. Nightingale,Improving the robust-ness of time-of-flight based shear wave speed reconstruction methods using ransac in human liver in vivo,Ultrasound in Medicine & Biology,36(5) (2010), 802–813.