jacchia-bowman 2008 dst density model
DESCRIPTION
Jacchia-Bowman 2008 Dst Density Model. Bruce R Bowman Elizabeth A Wolfe Space Analysis/A9A Air Force Space Command. DOD Distribution A Approved for public release Distribution unlimited. Introduction. JB2008 Dst storm model 2003 (Oct, Nov) and 2004 (Nov) Major Storms - PowerPoint PPT PresentationTRANSCRIPT

Jacchia-Bowman 2008Dst Density Model
Bruce R BowmanElizabeth A Wolfe
Space Analysis/A9AAir Force Space Command DOD Distribution A
Approved for public releaseDistribution unlimited
DOD Distribution AApproved for public release
Distribution unlimited

Presentation Title
2
Presentation Date
IntroductionIntroduction
• JB2008 Dst storm model
• 2003 (Oct, Nov) and 2004 (Nov) Major Storms
• Pre-storm conditioning
• Dst sub-dip variations
• Extended density variations at storm max
• Storm recovery relaxation parameters
• Post storm base recovery

Presentation Title
3
Presentation Date
JB2008 Geomagnetic Storm ModelingJB2008 Geomagnetic Storm Modeling
• All previous empirical models use ap geomagnetic index for storm modeling
• The 3-hour ap is a measure of general magnetic activity over the Earth, and responds primarily to currents flowing in the ionosphere and only secondarily to magnetospheric variations
• The ap index is determined by observatories at high latitudes which can be blind to energy input during large storms (Huang and Burke, 2004)
• The Disturbance Storm Time (Dst) index is primarily used to indicate the strength of the storm-time ring current in the inner magnetosphere
• During the main phase of magnetic storms, the ring current becomes highly energized and produces a southward-directed magnetic field perturbation at low latitudes on the Earth’s surface
• The Dst index is determined from hourly measurements of the magnetic field made at four points around the Earth’s equator

Presentation Title
4
Presentation Date
JB2008 Dst Equation DevelopmentJB2008 Dst Equation Development
• The thermosphere acts during storm periods as a driven-but-dissipative system whose dynamics can be represented by a differential equation
• The driver is the magnetospheric electric field. Burke (2008) determined the relationship for the exospheric temperature responses as a function of Dst:
1 0 1 0
1 2
1 1dTc = (1- ) dTc + S Dst - 1- Dst
τ τ
parameters are empirically determined relaxation constants
• The above equation must be integrated from storm beginning throughout the entire storm period in-order to compute ΔTc at every point during the storm
• The above equation was optimized to fit the CHAMP and GRACE accelerometer density data, along with HASDM global densities.
• Additional optimized equations based on different values were developed for use during the Dst recovery phase period

Presentation Title
5
Presentation Date
Single Event Major Geomagnetic StormSingle Event Major Geomagnetic Storm
2003 Solar Flux and Geomagnetic Indices
0
50
100
150
200
250
300
315 320 325 330 335
Year Day
F1
0 F
lux
0
50
100
150
200
250
300
350
400
ap
F10
F10B
ap

Presentation Title
6
Presentation Date
Typical Dst Storm PlotTypical Dst Storm Plot
2003 Dst with ap
-450
-400
-350
-300
-250
-200
-150
-100
-50
0
50
323 324 325 326 327 328
Day of Year
Ds
t
0
50
100
150
200
250
300
350
400
ap
Dst
ap
2003 Dst with ap
-450
-400
-350
-300
-250
-200
-150
-100
-50
0
50
323 324 325 326 327 328
Day of Year
Ds
t
0
50
100
150
200
250
300
350
400
ap
Dst
ap

Presentation Title
7
Presentation Date
Multiple Density Peak ExampleMultiple Density Peak Example
2003 Dst with Density Ratios: (CHAMP / Acc Ave) and (Model / Acc Ave)
-50
0
50
100
150
200
250
300
350
400
450
323 324 325 326 327
Day of Year
-Ds
t
0.0
1.0
2.0
3.0
4.0
5.0
6.0
7.0
Rh
o R
ati
o
DstapCHAMPMSISHASDMJB2008J70

Presentation Title
8
Presentation Date
GRACE Density DataGRACE Density Data
2003 Dst with Density Ratios: (GRACE / Acc Ave) and (Model / Acc Ave)
-50
0
50
100
150
200
250
300
350
400
450
323 324 325 326 327
Day of Year
-Dst
0.0
1.0
2.0
3.0
4.0
5.0
6.0
Rh
o R
ati
o
DstapGRACEMSISHASDMJB2008J70

Presentation Title
9
Presentation Date
2004 Multiple CME Storm2004 Multiple CME Storm
2004 Solar Flux Indices
0
50
100
150
200
250
300 305 310 315 320 325 330
Year Day
F1
0 F
lux
0
50
100
150
200
250
300
350
400
ap
F10
F10B
ap
Presentation Title
10
Presentation Date
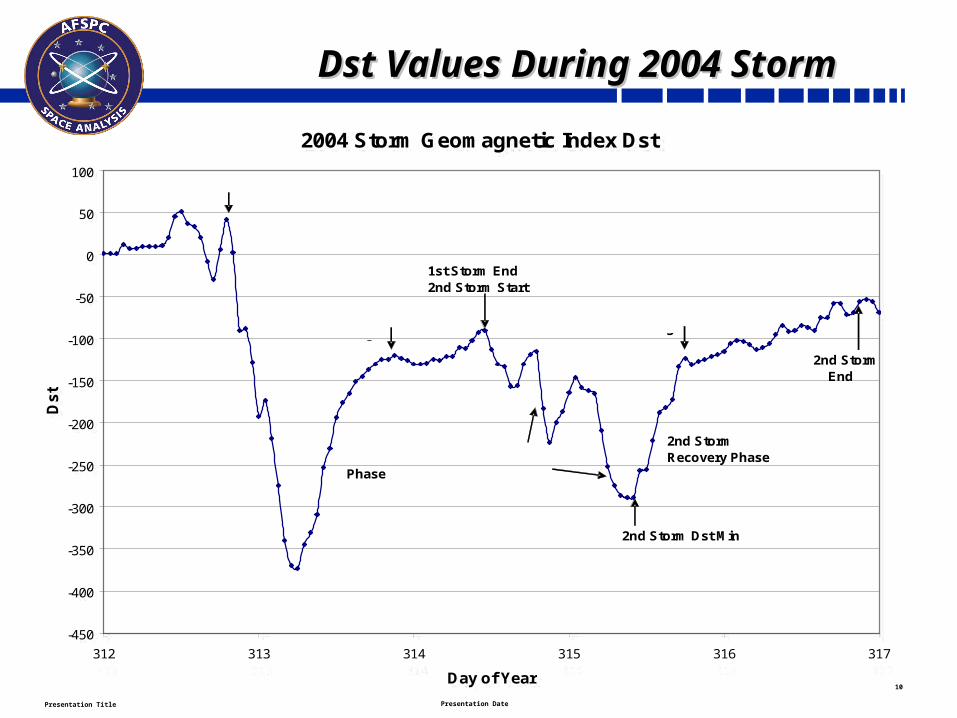
Dst Values During 2004 StormDst Values During 2004 Storm
2004 Storm Geomagnetic Index Dst
-450
-400
-350
-300
-250
-200
-150
-100
-50
0
50
100
312 313 314 315 316 317
Day of Year
Ds
t
1st Storm Start
1st StormMain Phase
1st Storm Dst MinMain Phase End
1st StormRecovery Phase
Recovery Slope Change
1st Storm End2nd Storm Start
2nd Storm Dst Min
Recovery Slope Change
2nd Storm End
2nd StormRecovery PhaseMain Phase

Presentation Title
11
Presentation Date
2004 Storm Model Density Ratios2004 Storm Model Density Ratios
2004 Dst with Orbit Averaged Density Ratios
-50
0
50
100
150
200
250
300
350
400
450
312 313 314 315 316 317
Day of Year
-Ds
t
0.0
1.0
2.0
3.0
4.0
5.0
6.0
7.0
Rh
o R
ati
o
DstapGRACEHASDMJB2008MSISJ70
2004 Dst with Orbit Averaged Density Ratios
-50
0
50
100
150
200
250
300
350
400
450
312 313 314 315 316 317
Day of Year
-Ds
t
0.0
1.0
2.0
3.0
4.0
5.0
6.0
7.0
Rh
o R
ati
o
DstapGRACEHASDMJB2008MSISJ70

Presentation Title
12
Presentation Date
Dst Sub-Dip ExampleDst Sub-Dip Example
2004 Dst with Density Ratios: (GRACE / Acc Ave) and (Model / Acc Ave)
-450
-400
-350
-300
-250
-200
-150
-100
-50
0
314 315 316
Day of Year
Ds
t
0.0
1.0
2.0
3.0
4.0
5.0
6.0
7.0
Rh
o R
ati
o
Dst
GRACE
HASDM
JB2008

Presentation Title
13
Presentation Date
2003 Multiple CME Storm Event2003 Multiple CME Storm Event
2003 Solar Flux and Geomagnetic Indices
0
50
100
150
200
250
300
285 290 295 300 305 310 315
Year Day
F1
0 F
lux
0
50
100
150
200
250
300
350
400
ap
F10
F10B
ap

Presentation Title
14
Presentation Date
JB2008 Model with Main Phase JB2008 Model with Main Phase Values Values
2003 Dst with Density Ratios: (CHAMP / Acc Ave) and (Model / Acc Ave)
-50
0
50
100
150
200
250
300
350
400
301 302 303 304 305
Day of Year
-Ds
t
0.0
1.0
2.0
3.0
4.0
5.0
6.0
7.0
Rh
o R
ati
o
DstapCHAMPMSISHASDMJB2008J70

Presentation Title
15
Presentation Date
JB2008 Model with Adjusted JB2008 Model with Adjusted Values Values
2003 Dst with Density Ratios: (CHAMP / Acc Ave) and (Model / Acc Ave)
-50
0
50
100
150
200
250
300
350
400
301 302 303 304 305
Day of Year
-Ds
t
0.0
1.0
2.0
3.0
4.0
5.0
6.0
7.0
Rh
o R
ati
o
Dst
CHAMP
HASDM
JB2008

Presentation Title
16
Presentation Date
Relaxation ParametersRelaxation Parameters
1 SW n+1 SW n n+1 n
1 1 2 2
1 1T (t ) = 1 - T (t ) + Dst(t ) - 1 - Dst(t )
τ α τ
Main phase relaxation parameters: 1 = 6.5 hrs 2 = 7.7 hrs
Recovery phase parameters: 1 = hrs 2 = 1.0 hrs
Main phase relaxation parameters: 1 = 6.5 hrs 2 = 7.7 hrs
Recovery phase parameters: 1 = hrs 2 = 1.0 hrs
1 SW n+1 SW n n+1
1 2
T (t ) = T (t ) + Dst(t ) α

Presentation Title
17
Presentation Date
Dst Sub-Dip ExampleDst Sub-Dip Example
2003 Dst with Density Ratios: (CHAMP / Acc Ave) and (Model / Acc Ave)
-400
-350
-300
-250
-200
-150
-100
-50
0
302 303 304
Day of Year
Ds
t
0.0
1.0
2.0
3.0
4.0
5.0
6.0
7.0
Rh
o R
ati
o
Dst
CHAMP
HASDM
JB2008
2003 Dst with Density Ratios: (CHAMP / Acc Ave) and (Model / Acc Ave)
-400
-350
-300
-250
-200
-150
-100
-50
0
302 303 304
Day of Year
Ds
t
0.0
1.0
2.0
3.0
4.0
5.0
6.0
7.0
Rh
o R
ati
o
Dst
CHAMP
HASDM
JB2008

Presentation Title
18
Presentation Date
GRACE Density with Adjusted GRACE Density with Adjusted Values Values
2003 Dst with Density Ratios: (GRACE / Acc Ave) and (Model / Acc Ave)
-50
0
50
100
150
200
250
300
350
400
301 302 303 304 305
Day of Year
-Ds
t
0.0
1.0
2.0
3.0
4.0
5.0
6.0
7.0
Rh
o R
ati
o
DstapGRACEMSISHASDMJB2008J70

Presentation Title
19
Presentation Date
Storm Recovery ExampleStorm Recovery Example
2003 Dst with Density Ratios: (GRACE / Acc Ave) and (Model / Acc Ave)
-50
0
50
100
150
200
250
300
350
400
304 305 306 307 308
Day of Year
-Ds
t
0.0
1.0
2.0
3.0
4.0
5.0
6.0
7.0
Rh
o R
ati
o
DstapGRACEMSISHASDMJB2008J70

Presentation Title
20
Presentation Date
Density Ratios with CHAMP and GRACEDensity Ratios with CHAMP and GRACE
HASDM Density Ratios
R2 = 0.9762
0.0
3.0
6.0
9.0
0.0 3.0 6.0 9.0
JB2008 Density Ratios
R2 = 0.8240
0.0
3.0
6.0
9.0
0.0 3.0 6.0 9.0
NRLMSIS Density Ratios
R2 = 0.7976
0.0
3.0
6.0
9.0
0.0 3.0 6.0 9.0
J70 Density Ratios
R2 = 0.6873
0.0
3.0
6.0
9.0
0.0 3.0 6.0 9.0
Horizontal axis: CHAMP and GRACE Density Ratios Vertical axis: Model Density Ratios

Presentation Title
21
Presentation Date
Geomagnetic Storm Model ErrorsGeomagnetic Storm Model Errors
Orbit Averaged Model Density Errors
0
10
20
30
40
50
60
70
50 100 150 200 250 300 350
Average 3-hour ap
Mo
de
l S
TD
(%
)
J70 (JB2006)MSISJB2008HASDM
Major StormsModerate Storms
Minor Storms

Presentation Title
22
Presentation Date
JB2008 Web SiteJB2008 Web Site

Presentation Title
23
Presentation Date
Backup SlidesBackup Slides

Presentation Title
24
Presentation Date
All 2003 Solar DataAll 2003 Solar Data
2003 Solar Flux Indices
-100
-50
0
50
100
150
200
250
300
0 20 40 60 80 100 120 140 160 180 200 220 240 260 280 300 320 340 360
Year Day
F1
0 F
lux
0
50
100
150
200
250
300
350
400
ap
F10
F10B
ap