james m. - nber
TRANSCRIPT

NBER WORKING PAPER SERIES
A NON'PARAMETRIC APPROACHTO PRICING AND HEDGING
DERIVATiVE SECURI'IlES VIALEARNING NETWORKS
James M. HutchinsonAndrew W. LoTomaso Poggio
Working Paper No. 4718
NATIONAL BUREAU OF ECONOMIC RESEARCH1050 Massachusetts Avenue -
Cambridge, MA 02138April 1994
This paper reports research done within the MIT Artificial Intelligence Laboratory and theSloan School of Management's Research Program in Computational Finance. We thankHarrison Hong and Terence Lim for excellent research assistance, and Pet Mamek, FedericoGirosi, Chung-Ming Kuan, Barbara Jansen, Blake LeBaron, and seminar participants at theDAIS Conference, the Harvard Business School, and the American Finance Association forhelpful comments and discussion. JH and TP gratefully acknowledge the supportof anARPA AASERT grant administered under the Office of Naval Research contract N00014-92J-1879. Additional support was provided by the Office of Naval Research under contractN00014-93-1-0385. by a grant from the National Science Foundation under contract ASC-9217041 [this award includes funds from ARPA provided under the HPCC program], by theResearch Program in Computational Finance, and by Siemens AG. A portion of thisresearch
was conducted during AL's tenure as an Alfred P. Sloan Research Fellow. This paper is partof NBER's research program in Asset Pricing. Any opinions expressed are those of theauthors and not those of the National Bureau of Economic Research.

NBER Working Paper #4718April 1994
A NONPARAMETRIC APPROACHTO PRICING AND HEDGING
DERIVATIVE SECURITIES VIALEARNING NETWORKS
ABflACF
We propose a nonparametric method for estimating the pricing formula of a derivative
asset using learning networks. Although not a substitute for the more traditional arbitrage-based
pricing fomiulas, network pricing formulas may be more accurate and computationaily more
efficient alternatives when the underlying asset's price dynamics are unknown, or when the
pricing equation associated with no-arbiaage condition cannot be solved analytically. To assess
the potential value of network pricing formulas, we simulate Black-Scholes option prices and
show that learning networks can recover the Black-Scholes fonnula from a two-year training set
of daily options prices, and that the resulting network fonnula can be used successfully to both
price and delta-hedge options out-of-sample. For comparison, we estimate models using four
popular methods: ordinary least squares, radial basis function networks, multilayer peivepfln
networks, and projection pursuit To illustrate the practical relevance of our network pricing
approach, we apply it to the pricing and delta-hedging of S&P 500 fuwres options from 1987 to
1991.
James M. Hutchinson Andrew W. LoPHi Partners Sloan School of ManagementOne Cambridge Center M.I.T.Cambridge, MA 02142 Cambridge, MA 02142-1347
and NBER
Tomaso PoggioArtificial Intelligence Laboratory and the
Center for Biological and Computational LearningM.I.T.Cambridge, MA 02139

1 IntroductionMuch of the success and growth of the market for options and other derivative securities may
be traced to the seminal papers by Black and Scholes (1973) and Merton (1973), in which
closed-form option pricing formulas were obtained through a dynamic hedging argument and
a no-arbitrage condition. The celebrated Black-Scholes and Merton pricing formulas have
now been generalized, extended, and.applied to such a vast array of securities and contexts
that it is virtually impossible to provide an exhaustive catalog. Moreover, while closed-
form expressions are not available in many of these generalizations and extensions, pricing
formulas may still be obtained numerically.
In each case, the derivation of the pricing formula via the hedging/no-arbitrage approach,
either analytically or numerically, depends intimately on the particular paranietric form of
the underlying asset's price dynamics S(i). A misspecification of the stochastic process for
5(1) will lead to systematic pricing and hedging errors for derivative securities linked to 5(1).
Therefore, the success or failure of the traditional approach to pricing and hedging derivative
securities, which we call a parametricpricing method, is closely tied to the ability to capture
the dynamics of the underlying asset's price process.
In this paper, we propose an alternative data-driven method for pricing and hedging
derivative securities, a nonparametric pricing method, in which the data is allowed to de-
termine both the dynamics of 5(1) and its relation to the prices of derivative securities
with minimal assumptions on 5(1) and the derivative pricing model. We take as inputs the
primary economic variables that influence the derivative's price, e.g., current fundamental
asset price, strike price, time-to-maturity, etc., and define the derivative price to be the out-
put into which the learning network maps the inputs. When properly trained, the network
"becomes" the derivative pricing formula which may be used in the same way that foimulas
obtained from the parametric pricing method are used: for pricing, delta-hedging, simulation
exercises, etc.
These network-based models have several important advantages over the more traditional
parametric models. First, since they do not rely on restrictive parametric assumptionssuch
as lognormality or sample-path continuity, they are robust to the specification errors that
1

plague parametric models. Second, they are adaptive, and respond to structural changes
in the data-generating processes in ways that parametric models cannot. Finally, they are
flexible enough to encompass a wide range of derivative securities and fundamental asset
price dynamics, yet relatively simple to implement.
Of course, all these advantages do not come without some cost—the nonparametric pric-
ing method is highly data-intensive, requiring large quantities of historical prices to obtain
a sufficiently well-trained network. Therefore, such an approach would be inappropriate
for thinly-traded derivatives, or newly-created derivatives that have no similar counter-
parts among existing securities.' Also, if the fundamental asset's price dynamics axe well-
understood and an analytical expression for the derivative's price is available under these
dynamics, then the parametric formula will almost always dominate the network formula in
pricing and hedging accuracy. Nevertheless, these conditions occur rarely enough that there
may still be great practical value in constructing derivative pricing formulas by learning
networks.
In Section 2, we provide a brief review of learning networks and related statistical meth-
ods. To illustrate the promise of learning networks in derivative pricing applications, in
Section 3 we report the results of several Monte Carlo simulation experiments in which
radial basis function (REF) networks "discover" the Black-Scholes formula when trained
on Black-Scholes call option prices. Moreover, the REF network pricing formula performs
as well as the Black-Scholes formula in delta-hedging a hypothetical option, and in some
cases performs even better Ibecause of the discreteness-error in the Black-SchoJes case aris-
ing from delta-hedging daily instead of continuously]. To gauge the practical relevance of
our nonparametric pricing method, in Section 4 we apply the RBF pricing model to daily
call option prices on 5&P 500 futures from 1987 to 1991 and compare its pricing and delta-
hedging performance to the naive Black-Scholes model. We find that in many cases, the
network pricing formula outperforms the Black-Scholes model. We suggest several directions
for future research and conclude in Section 5.
However, since newly-created derivativescan often be replicated by a combination of existing derivatives,this is not as much of a limitation as it may seem at first.
2

2 Learning Networks: A Brief Review
Over the past 15 years, a number of techniques have been developed for modeling nonlinear
statistical relations nonparaanetrica.lly. In particular, projection pursuit regression, multi-
layer perceptrons (often called "backpropagation networks"2], and radial basis functions are
three popular examples of such techniques. Although originally developed in different con-
texts for seemingly different purposes, these techniques may all be viewed as nonparametric
methods for performing nonlinear regressions. Following Barton and Barron (1988) we call
this general class of methods learning networks to emphasize this unifying view and acknowl-
edge their common history. In the following sections, we shall provide a brig review of their
specification and properties. Readers already familiar with these techniques may wish to
proceed immediately to the Monte Ca4o simulation experiments of Section 3.
2.1 Standard Formulations
In this section we describe the standard formulations of the learning networks to be used
in this paper. For expositional simplicity, we shall focus our attention on the problem of
mapping multiple input variables into a univariate output variable, much like regression
analysis, although the multivariate-.output case is a straightforward extension.
Given the well-known trade-offs between degrees of freedom and approximation error in
general statistical inference, we shall also consider the number of parameters implied by each
model so that we can make comparisons between them on a roughly equal footing. Note,
however, that the number of free parameters is a crude measure of the complexity of nonlinear
models, and more refined measures may be available, e.g., the nonlinear generalizations of
the influence matrix in Wáhba (1990).
A common way to visualize the structure of these networks is to draw them as a graph
showing the connections between inputs, nonlinear "hidden" units, and outputs [see Fig-
ure 1].
2More accurately, the term "backpropagation" is now typically used to refer to the particular gradientdescent method of estimating parameters, while the term "multilayer perceptron" is used to refer to thespecific functional form described below.
3

xl Xd
Figure 1: Structure of the learning networks used in this paper.
4
I S S
C CK
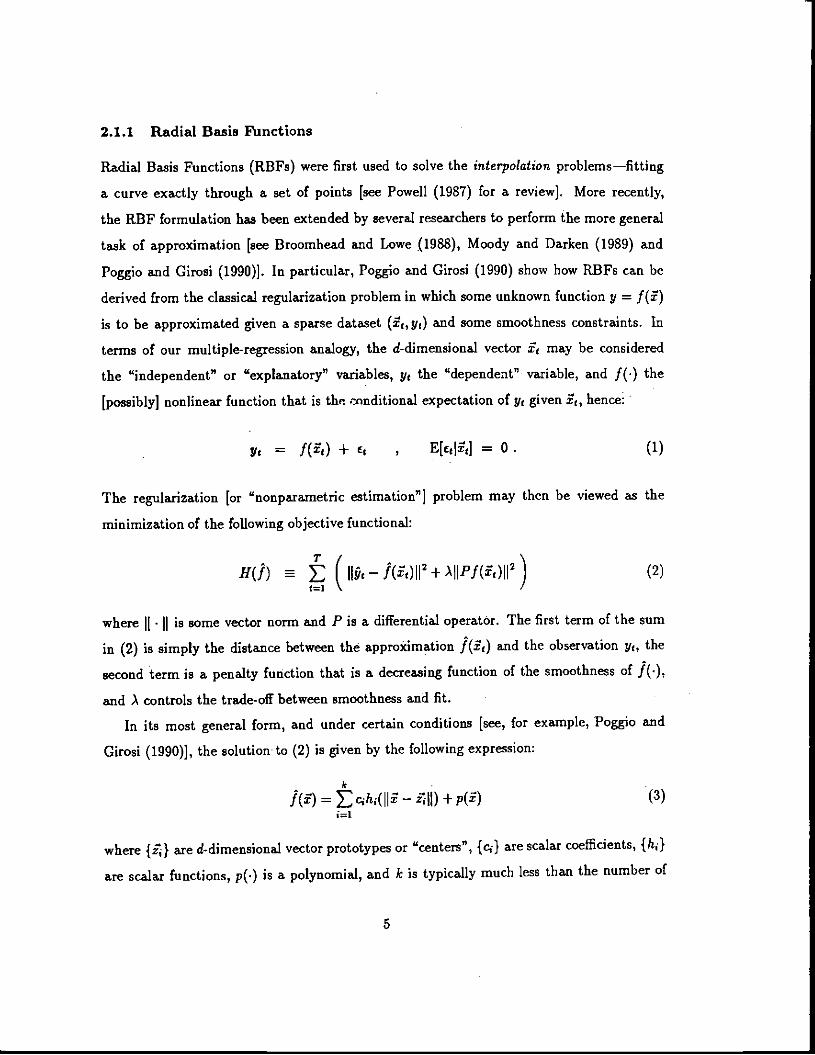
2.1.1 Radial Basis Functions
Radial Basis Functions (RBFs) were first used to solve the interpolation problems—fitting
a curve exactly through a set of points [see Powell (1987) for a review]. More recently,
the RBF formulation has been extended by several researchers to perform the more general
task of approximation [see Broomhead and Lowe (1988), Moody and Darken (1989) and
Poggio and Girosi (1990)]. In particular, Poggio and Girosi (1990) show how RBFs can be
derived from the classical regularization problem in which some unknown function y = f(f)is to be approximated given a sparse dataset (Z, y) and some smoothness constraints. In
terms of our multiple-regression analogy, the d-dimensional vector may be considered
the 9ndependent" or "explanatory" variables, Vt the "dependent" variable, and f(.) the
[possibly] nonlinear function that is the rMnditional expectation of Vt given 2, hence:
= 1(Z) + ct , E[qt] = 0 (1)
The regularization [or "nonparametric estimation"] problem may then be viewed as the
minimization of the following objective functional:
T
H(J) L ( ' — 1Z112 + ).IIPf(z)112 ) (2)
where . is some vector norm and P is a differential operatOr. The first term of the sum
in (2) is simply the distance between the approximation 1(Z) and the observation y, the
second term is a penalty function that is a decreasing function of the smoothness of f(.),
and A controls the trade-off between smoothness and fit.
In its most general form, and under certain conditions [see, for example, Poggio and
Girosi (1990)], the solutionto (2) is given by the following expression:
k
f(z) = Ecihi(II1 — Zil) + fri (3)
where {1} are d-dimensional vector prototypes or "centers", {ci} are scalar coefficients, {h1)
are scalar functions, p(.) is a polynomial, and k is typically much less than the number of
5

observations T in the sample. Such approximants have been termed "hyperbasis functions"
by Poggio and Girosi (1990) and are closely related to splines, smoothers such as kernel
estimators, and other nonparametric estimators.3
For our current purposes, we shall take the vector norm to be a weighted Eudidean norm
defined by a (d x d) weighting matrix W, and the polynomial term shall be taken to be just
the linear and constant terms, yielding the following specification for J(.):
= ho + ao + 51 (4)
where o and 5 are the coefficients of the polynomial p(.). Micchelli (1986) shows that a
large class of basis functions h1(.) are appropriate, but the most common choices for basis
functions h(z) are Gaussians c1" and'multiquadrics VIZ + u2.
That networks of thi type can generate any real-valued output, but in applications where
we have some a priori knowledge of the range of the desired outputs, it is computationally
more efficient to apply some nonlinear transfer function to the outputs to reflect that knowl-
edge. This will be the case in our application to derivative pricing models, in which some
of the RBF networks will be augmented with an "output sigmoid", which maps the range
(—co, oo) into the fixed range (0, 1). In particular, the augmented network will be of the
form g(J(i)) where g(u) = 11(1 + c").For a given set of inputs {$j and outputs {y}, RBF approximation amounts to estimat-
ing the parameters of the RBF network the d(d+1)/2 unique entries of the matrix W'W,
the dlv elements of the centers {Z}, and the d-j-k+1 coefficients Og, cF, and {cj}. Thus the
total number of parameters that must be estimated for d-dimensional inputs and lv centers
is
2.1.2 Multilayer Perceptrons
Multilayer perceptrons (MLPs) are arguably the most popular type of "neural network",
the general category of methods that derive their original inspiration from simple models of
3To economize on terminology, in this paper we use the term "radial basis functions" toencompass boththe intempolation techniques used by Powell and its subsequent generalizations.
6

biological nervous systems. They were developed independently by Parker (1985) and Rumel-
hart et al. (1986) and popularized by the latter. Following the notation of Section 2,1.1, a
general formulation of MLPs with univariate outputs may be written as follows:
k
j() = Ii(£1h(1+$1i) + (5)
where h(.) is typically taken to be a smooth, monotonically increasing function such as the
"sigmoid" function 11(1 + rt), {8} and are coefficients, and k is the number of "hidden
units". The specification (5) is generally termed an MLP with "one hidden layer" because
the basic "sigmoid-of-a-dot-product" equation is nested once—the nesting may of course be
repeated arbitrarily many times, hence the term "multilayer" perceptron. Unlike the RUF
formulation, the nonlinear function ii in-the MLP formulation is usually fixed for the entire
network.
For a given set of inputs {$} and outputs {yj}, fitting an MLP model amounts to
estimating the (d+1)k parameters {9j} and {ö), and the k-I-i parameters {ö}, for a total
of (d+2)k+1 parameters.
2.1.3 Projection Pursuit Regression
Projection pursuit is a method that emerged from the statistics community for analyzing
high-dimensional datasets by looking at their low-dimensional projections. Friedman and
Stuetzle (1981) developed a version for the nonlinear regression problem called projection
pursuit regression (PPR). Similar to MLPs, PPR models are composed of projections of
the data, i.e., dot products of the data with estimated coefficients, but unlike MLPs they
also estimate the nonlinear combining functions from the data. Following the notation of
Section 2.1.2, the formulation for PPR with univariate outputs can be written as
k
J(5) = E5ihi($) + So (6)
where the functions h1() are estimated from the data [typically with a smoother], the {8)
and fi are coefficients, and k is the number of projections. Note that 8 is commonly taken
7

to be the sample mean of the outputs f(i).
In counting the number of parameters that PPR models require, a difficulty arises in
how to treat its use of smoothers in estimating the inner it functions. A naive approach is
to count each smoothing estimator as a single parameter, its bandwidth. In this case,the
total number of parameters is dic projection indices, k linear coefficients, and k smoothing
bandwidths, for a total of (d+2)k parameters. However, a more refined method of counting
the degrees of freedom, e.g., Wahba (1990), may yield a slightly different count.
2.2 Network Properties
Although the various leaning network techniques originated from a variety of backgrounds,
with implications and characteristics that are not yet fully understood, some common and
well-established properties are worth ndting.
2.2.1 Approximation
All of the above learning networks have been shown to possess some form of a universal
approximation property. For example, Huber (1985) and Jones (1987) prove that with
sufficiently many terms, any square-integrable function can be approximated arbitrarily well
by PPR. Cybenko (1988) and Hornilc (1989) demonstrate that one-hidden layer MLPs can
represent to arbitrary precision most classes of linear and nonlinear continuous functions
with bounded inputs and outputs. Finally, Poggio and Cirosi (1990) show that RBFs can
approximate arbitrarily well any continuous function on a compact domain. In a related vein,
Poggio and Cirosi also show that RBFs have the "best" approximation property—there is
always a choice for the parameters that is better than any other possible choice—a property
that is not shared by MLPs.
2.2.2 Error Convergence
The universal approximation results, however, say nothing about howeasy it is to find those
good approximations, or how computationally efficient they are. In particular, does the
number of data points we will need to estimate the parameters of a network grow exponen-
tially with its size [the so-called "curse of dimensionality"]? Recent results show that this
8

is not necessarily true if we are willing to restrict the complexity of the function we wish
to modeL For example, Barron (1991) derives bounds on the rate of convergence of the
approximation error in MLPs based on the number of examples, given assumptions about
the smoothness of the function being approximated. Chen (1991) obtains similar results for
PPR. Girosi and Anzellotti (1992) derive bounds on convergence in RBFs using somewhat
more natural assumptions about the smoothness of the function being approximated. Niyogi
and Girosi (1994) extend this result for the estimation problem, and derive a bound on the
"generalization error" of RBFs, the error an REFnetwork will make on unseen data.
The importance and centrality of generalization error bounds it the process of data-
driven modeling is worth noting. In particular, these bounds show that for a fixed number
of data points, the generalization error that we can expect from a network first decreases
as the network complexity—number of parameters—increases, then after a certain point the
error increases [see Figure 2]. For the financial modeling problems considered in this paper,
the data set size is, to some extent, fixed and thus these results indicate that there will be
an optimal number of parameters to use for that size of data set.
Other interesting estimation properties have been investigated fof PPR in particular.
Diaconis and Shahshahani (1984) provide necessary and sufficient conditions for functions
to be represented exactly using PPR. Donoho and Johnstone (1989) demonstrate the du-
ality between PPR and kernel regression in two dimensions, and show that PPR is more
parsimonious for modeling functions with angular smoothness.
2.2.3 Model Specification
A key question for most approximation techniques and in particular for neural network-
like schemes concerns the type and the complexity of the model or the network to be used
for a specific problem. Different approaches and different network architectures correspond
to different choices of the space of approximating functions. A specific choice implies a
specific assumption about the nature of the nonlinear relation to be approximated. For
example, Girosi, Jones and Poggio (1993) have shown that different assumptions about
smoothness of the function to be approximated lead to different approximation schemes,
such as different types of Radial Basis Functions, as well as different kinds of splines and
9

z
C'IU
Figure 2: Generalization error E(N,n) for a Gaussian RBF network as a function of thenumber of data points N and the number of network parameters a [reprinted with permissionfrom Niyogi and Girosi (1994)].
10
'Vr

of ridge approximators. Certain classes of smoothness assumptions in the different variables
even lead to multilayer perceptron architectures. The number of basis functions, and more in
general of network parameters, is a related and difficult issue. Even if one type of architecture
can be chosen based on prior knowledge about the smoothness to be expected in the specific
problem, the question remains about the appropriate complexity of the architecture, that
is the number of parameters. A general answer does not yet exist and is unlikely to be
discovered any time soon. The standard approach to the problem relies on cross-validation
techniques and variations of them [Wahba (1990)]. A related, more fundamental approach—
called structural risk minimization—has been developed by Vapnik (1982).
2.2.4 Parameter Estimation Methods
In our discussion abov!, we have focused primarily on the specification of J(.) for each
method, but of course a critical concern is how each of the model's parameters are to be
estimated. To some extent, the estimation issue may be divorced from the specification issue.
Jndeed, there is a large body of literature concerned solely with the estimation of network
parameters. Much of this literature shows that the speed and accuracy of the estimation
process depends on the kind of derivative information used, whether all parameters are
estimated simultaneously or sequentially, and whether all the data is used at once in a "batch"
mode or sequentially in an "on-line" mode. In Hutchinson (1993), estimation techniques for
RBF networks are more fully explored.
However, a rigorous comparison of estimation methods is not the primary goal of our
paper; rather, our objective is to see if any method can yield useful results. As such we
have adopted the most common estimation schemes for our use of the other types of learning
networks. In particular we adopt Levenberg-Marquardt for batch mode estimation of the
RBF networks, gradient descent [with momentum] for on-line mode estimation of the MLP
networks, and the Fiedman and Stuetzle algorithm for PPR [which uses a Newton method
to compute the projection directions and the "supersmoother" for finding the nonlinear
functions hJ.
Although not pursued here, readers interested in exploring the trade-offs between on-
line and batch-mode estimation are encouraged to consult the "stochastic approximation"
11

literature [see Robbins and Monro (19510, Ljung & Soderstrom (1986), and Widrow and
Stearns (1985)]. In general, it is not known why on-line methods used with neural net-
work techniques often seem to perform better than batch methods on large-scale, nonconvex
problems. It seems difficult to extract any general conclusions from the diverse body of
literature reporting the use of different on-line and batch techniques across many disparate
applications.
2.2.5 Equivalence of Different Learning Networks
There is another reason that we do not focus on the merits of one type of learning network
over another: recent theoretical developments suggest that there are significant connections
between many of these networks. For example, Maruyama, Girosi, and Poggio (1991) show
an equivalence between MLP networks with normalized inputs and RBF networks. Girosi,
Jones and Poggio (1993) prove that a wide class of approximation schemes can be derived
from regularization theory, including RBF networks and some forms of PPR and MLP net-
works. Nevertheless, we expect each formulation to be more efficient at approximating some
functions than others, and as argued by Ng and Lippman (1991), the practical differences
in using each method, e.g., in running time or memory used, may be more important than
model accuracy.
3 Learning the Black-Scholes Formula
Given the power and flexibility of learning networks to approximate complex nonlinear re-
lations, a natural application is to derivative securities whose pricing formulas are highly
nonlinear even when they are available in closed form. In particular, we pose the following
challenge: if option prices were truly determined by the Black-Scholes formula exactly, can
learning networks "learn" the Blacic-Scholes formula? In more standard statistical Jargon:
can the Black-Scholes formula be estimated nonparametrica.lly via learning networks with a
sufficient degree of accuracy to be of practical use?
In this section, we face this challenge by performing Monte Carlo simulation experiments
in which various learning networks are trained on artificially generated Black-Scholes option
12

prices, and then compared to the Black-Scholes formula both analytically and in out-of-
sample hedging experiments to see how close they come. Even with training sets of only six
months of daily data, learning network pricing formulas can approximate the Black-Scholes
formula with remarkable accuracy.
While the accuracy of the learning network prices is obviously of great interest, this
alone is not sufficient to ensure the practical relevance of our nonparametric approach. In
particular, the ability to hedge an option position is as important, since the very existence
of an arbitrage-based pricing formula is predicated on the ability to replicate the option
through a dynamic hedging strategy. This additional constraint motivates the regularization
techniques and, in particular, the RBF networks used in this study. SpecifIcally, delta-
hedging strategies require an accurate approximation of the derivative of the underlying
pricing formula, and the need for accurate approximations of derivatives leads directly to
the smoothness constraint imposed by regularization techniques such as RBF networks.4 Of
course, whether or not the delta-hedging errors are sufficiently small in practice is an em-
pirical matter, and we shall investigate these errors explicitly in our simulation experiments
and empirical application described below.
However, the accuracy we desire cannot be achieved without placing some structure on
the function to be approximated. For example, we begin by asserting that the option pricing
formula f(-) is smooth in all its arguments, and that its arguments are: the stock price S(i),
the strike price X, and the time-to-maturity T—i. In fact, we know that the Black-Scholes
formula also depends on the risk-free rate of interest r and the volatility a of the underlying
asset's continuously-compounded returns, e.g.,
C(t) = S(t)'Z'(d1) — Xe_T_o)tZ(d2) (7)
4Th fact, it is well known that the problem of numerical differentiation is ill-posed. The classical approach[Rheinach (1967)1 is to regularize it by finding a sufficiently smooth function that solves the variational
problem in (2). As we discued earlier, RBF networks as well as splinesand several forms of ML!' networks
follow directly from the regularization approach and are therefore expected to approximate not only the
pricing formulabut also its derivatives (provided the basis function corresponding to a smoothness prior is of
a sufficient degree, see (Poggio and Girosi, 1991): in particular, the Gaussian is certainly sufficiently smooth
for our problem]. A special case of this general argument is the result of Gallant and White (1992) and
Rornik, Stinchcombe, and White (1990) who show that single-hidden-layer MLP networks can approximate
the derivative of an arbitrary nonlinear mapping arbitrarily wellas the number of hidden units increases.
13

where
ln(S(t)/X) + (r + '-)(T —2) = — crvYiuVT—i
and (.) is the standard normal cumulative distribution function. However, if r and a are
fixed throughout the network's training sample as we shall assume, then the dependence
of the option's price on these two quantities cannot be identified by any nonparametric
estimator of f(.) in the way that (7) does.5 Of course, if interest rates and volatility vaty
through time as they do in practice, learning networks can readily capture their impact on
option prices explicitly.
One further simplification we employ is to assume that the statistical distribution of
the underlying asset's return is independent of the level of the stock price S(t), hence by
Theorem 8.9 of Merton(1990, Chapter 8), the option pricing formula f() is homogeneous
of degree one in both S(t) and X, so that we need only estimate f(S(t)/X,I,T—t). By
requiring only two rather than three inputs to our learning networks we may be lessening
the number of data points required tor learning, but it should also be possible to relax these
assumptions and use all three inputs.
We can now outline the components of our Monte Carlo simulation experiment, which
consists of two phases: training and testing. The training phase entails generating sample
paths of stock and option prices on which the learning networks are "trained", i.e.; the
network parameters are fitted t each sample path so as to minimize a quadratic loss function.
This yields a network pricing formula which is then "tested" on newly-simulated sample paths
of stock and option prices, i.e., various performance measures are calculated for the network
pricing formula using the test path.
To obtain a measure of the success of the "average" network pricing formula, we repeat the
training phase for many independent option/stock price sample paths, apply each network
formula to the same test path, and average the performance measures across training paths.
To obtain a measure of the "average success" of any given network pricing formula, we do the
5This .s one sense in which analytical pricing formulas for derivative securities are preferred wheneveravailable.
14

reverse: for a single training path, we apply the resulting network pricing formula on many
independent option/stock price test paths, and average the performance measures across test
paths.
Since we conduct multiple training-path and test-path simulations, our simulation design
is best visualized as a matrix of results: each row corresponds to a separate and independent
training path, each column corresponds to a separate and independent test path, and each cell
contains the performance measures for a network trained on a particular training path and
applied to a particular test path. Therefore, the "average success" of a given network may
be viewed as an average of the performance measures across the columns of a given row, and
the performance of the "average network" on a given test path may be viewed as an average
of the performance measures across the rows of a given column. Although these two averages
obviously closely related, they do address different aspects of the performance of learning
networks, and the results of each must be interpreted with the appropriate motivation in
mind.
3.1 Calibrating the Simulations
In the first phase of our Monte Carlo simulation experiment—the training phase—we simu-
late a two-year sample of daily stock prices, and create a cross-section of options each day
according to the rules used by the Chicago Board Options Exchange (CBOE) with prices
given by the Black-Scholes formula. We refer to this two-year sample of stock and [multiple]
option prices as a single "training path", since the network is trained on this sample.
We assume that the underlying asset for our simulation experiments is a "typical" NYSE
stock, with an initial price 5(0) of $50.00, an annual continuously-compounded expected rate
of return p of 10%, and an annual volatility a of 20%. Under the Black-Scholes assumption
of a geometric Brownian motion:
dS(i) = pS(t)dt + cS(t)dW(t) (8)
and taking the number of day8 per year to be 253, we draw 506 pseudorandom vari-
ates Z from the distribution N(p/253, 2/253) to obtain two years of daily continuously-
15
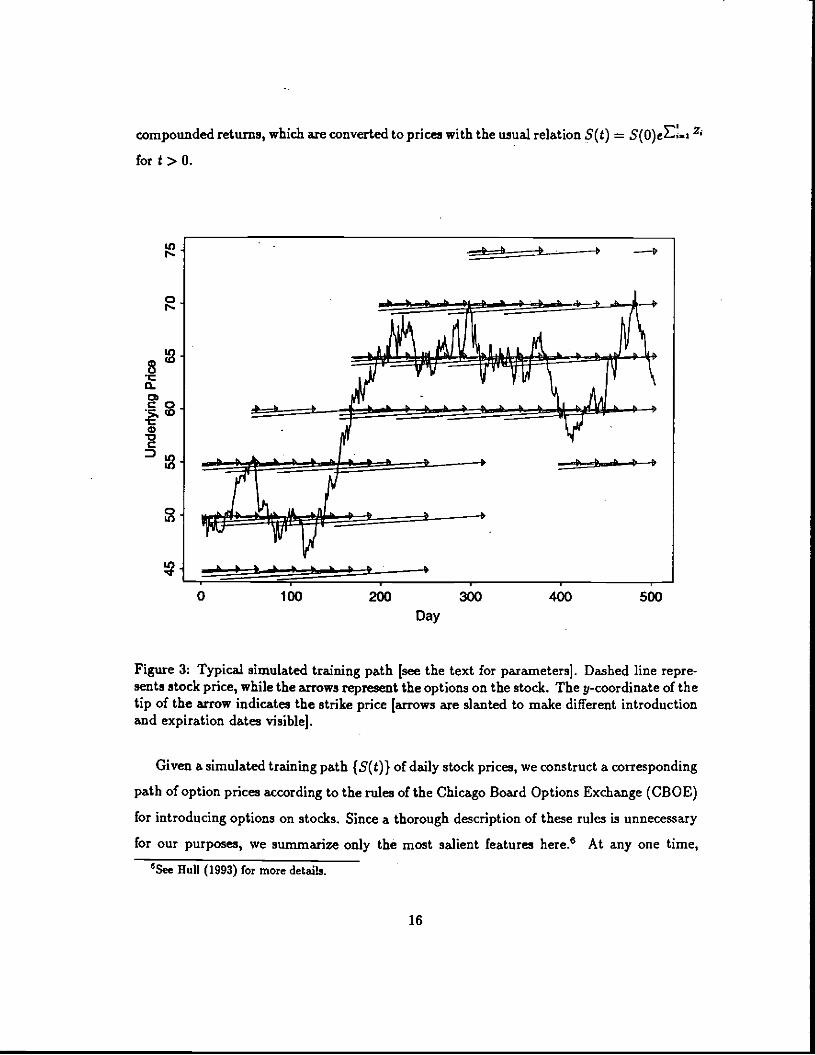
compounded returns, which are converted to prices with the usual relation 5(t) =S(O)eE.i Z
for t> 0.
80.
Co0VC
Figure 3: Typical simulated training path Isee the text for parameters]. Dashed line repre-sents stock price, while the arrows represent the options on the stock. The y-coordinate of thetip of the arrow indicates the strike price [arrows are slanted to make different introductionand expiration dates visiblej.
Given a simulated training path {S(t)} of daily stock prices, we construct a corresponding
path of option prices according to the rules of the Chicago Board Options Exchange (CBOE)
for introducing options on stocks. Since a thorough description of these rules is unnecessary
for our purposes, we summarize only the most salient features here.° At any one time,
16
In.N
0N
10
0 100 200 300 400 500
Day
6 HUH (1993) for more detai!s.

CBOE stock options outstanding on a particular stock have four unique expiration dates:
the current month, the next month, and the following two expirations from a quarterly
schedule. The CBOE sets strike prices at multiples of $5 for stock prices in the $25 to $200
range, which all of our simulated prices fall into. When options expire and a new expiration
date is introduced, the two strike prices closest to the current stock price are used. If the
current price is very close to one of those strike prices—within $1 in our simulations—a third
strike price is used to better bracket the current price. If the stock price moves outside of
the current strike-price range, another strike price is generally added for all expiration dates
to bracket that price.7 We assume that all of the options generated according to these rules
are traded every day, although in practice, far-from-the-money and long.dated options are
often very illiquid.
A typical training path is shown lts Figure 3. We can also plot the training path as a
3-dimensional surface if we normalize stock and option prices by the appropriate strike price
and consider the option price as a function of the form f(S/X, 1, T—i) (see Figure 4]. Because
the options generated for a. particular sample path are a function of the (random] stock price
path, the size of this data matrix [in terms of number of options and total number of data
points] varies across sample paths. For our training set, he number of options per sample
path range from 71 to 91, with an averáge of 81. The total number of data points range
from 5,227 to 6,847, with an average of 6,001.
3.2 Training Network Pricing Formulas
Now we are set to estimate or train pricing formulas of the form of f(S/X, 1, T —1) on the
simulated training paths, using two "inputs": S(t)/X and T—i. For comparison, we first
estimate two simple linear models estimated using ordinary least squares (OLS). The first
thàdel is linear regressiOn of the option price on S(i)/X and T—t. The second is a pair of
linear regressions, one for options currently in the money, and another for those currently
out of the money. Typical estimates of these models are shown in Table 1.
Although these linear models seem to fit quite well, with R2s well above 80%, theyhave
particularly naive implications for delta-hedging strategies. In particular, delta-hedging with
'In our simulations, this was not done for options with less than one week to expiration.
17

(00U,010
Oo040r00
Figure 4: Simulated call option prices normalized by strike price and plotted versus stockprice and time to expiration. Points represent daily observations. Note the denser samplingof points close to expiration is due to the CBOE strategy of always having options whichexpire in the current and next month.
18

the first linear model would amount to purchasing a certain number of shares of stock in the
beginning (0.6886 in the example in Table 1J and holding them until expiration, regardless
of stock price movements during the option's life. The second linear model improves on this
slightly by switching between hedging with a large number (0.9415 in Table lb] and a small
number of shares [0.1882 in Table lcJ depending on whether the current stock price is less
than or greater than the strike price.
The nonlinear models obtained from learning networks, on the other hand, yield estimates
of option prices and deltas that are difficult to distinguish visually from the true Black-Scholes
values. An example of the estimates and errors for an REF network is shown in Figure 5,
which was estimated from the same data as the linear models from Table 1. The estimated
equation for this particular RBF network is
O73. o.oJ{71I'[ 5 J[: 1+2.55
I SIX — 1.18 1' 59.79 —0.03 S/X — 1.18
T—t—0.24 j —0.03 10.24 T—t—0.24 +1. 7
+0031 S/X—0.98 59.79 —0.03 SIX—0.98N T—i+0.20 —0.03 10.24 T—t+0.20
0101 SIX—LOS'
59.79 —0.03 [ SIX—LOS +162+N T—t+0.10 —0.03 10.24 T—i+0.l0
+ 0.145/X — O.24(T—t) — 0.O1 (9)
Observe from (9) that the centers in the REF model are not constrained to lie within the
range of the inputs, and in fact do not in the third and fourth centers in our example. The
largest errors in these networks tend to occur at the kink-point for options at the money at
expiration, and also along the boundary of the sample points.
PPR and MLP networks of similar complexity generate similar response surfaces, al-
though as we shall see in the next section, each method has its own area of the input space
that it models slightly more accurately than the others.
19

Residual Standard Error = 0.027, fl2 = 0.9098, N = 6782F2,grw-statistic = 34184.97, p-value = 0
coef std.err 1-stat p-valueIntercept —0.6417 0.0028 —231.4133 0
SIX 0.6886 0.0027 259.4616 0T —1 0.0688 0.0018 38.5834 0
(a) Single linear model.
Residual Standard Error = 0.0062, R = 0.9955, N = 3489Fj,statistic = 385583.4, p-value = 0
coef std.err i-stat p-valueIntercept —0.9333 0.0012 —763.6280 0
S/X 0.9415 0.0011 875.0123 0T — t 0.0858 0.0006 150.6208 0
(b) "In-the-money" linear model.
Residual Standard Error = 0.007, B2 = 0.8557, N = 3293F2,gq-statistic = 9753.782, p-value = 0
coef std.err i-stat p-valueIntercept —0.1733 0.0022 —80.3638 0
SIX 0.1882 0.0023 80.6965 0T —2 0.0728 0.0007 108.2335 0
(c) "Out-of-the-money" linear model.
Table 1: Regression summaries for typical linear models.
20

(d) Delta error ft — ft
Figure 5: Typical behavior of 4 nonlinear term RBF model.
21
(a) Network call price 07k (b) Network delta
(c) Call price error CIX — C/X
0

Our choice of model-complexity is not arbitrary, and in fact is motivated by our desire to
minimize error and maximize "fit" for out-of-sample data. In this regard, a critical issue in
specifying learning networks is how many nonlinear terms—"hidden units", basis functions,
projections, etc.—to use in the approximation. Following the discussion in Section 2.2.2,
for actual market data, we might expect an optimal number of parameters that minimizes
out-of-sample error. But in the simulations of this section, the data are noise-free [in the
sense that there is a deterministic formula generating the outputs from the inputs], hence we
are interested primarily in how quickly adding more parameters reduces the error. Prelirni-
nary outof-sample tests with independent sample paths have indicated diminishing returns
beyond 4 nonlinear terms [as measured by the percent of variance explained], thus we adopt
this specification for all the learning networks considered in this paper.! In the next sections
we will assess how well we have done in meeting our goal of minimizing out-of-sample error.
3.3 Performance Measures
Our learning networks estimate the option prices ô7k, thus our first performance measure
is simply the usual coefficient of determination, IV,of those estimated values compared with
the true option prices C/X, computed for the out-of-sample data.
However, the Ft2 measure is not ideal for telling us the practical value of any improvement
in pricing accuracy that the learning networks might give us. A more meaningful measure of
performance for a given option pricing formula is the "tracking error" of various replicating
portfolios designed to delta-hedge an option position, using the formula in question to cal-
culate the hedge ratios or deltas. In particular, suppose at date 0 we sell one call option and
undertake the usual dynamic trading strategy in stocks and bonds to hedge this call during
its life. If we have correctly identified the option pricing model, and if we can costlessly and
continuously hedge, then at expiration the combined value of our stock and bond positions
should exactly offset the value of the call. The difference between the terminal value of the
call and the terminal combined value of the stock and bond positions may then serve as
a measure of the accuracy of our network approximation. Of course, since it is impossible
to hedge continuously in practice, there will always be some tracking error due to discrete-
84 nonlinear terms corresponds to approximately 20 total parameters.
22

ness, therefore we shall compare the REF tracking error with the tracking error of discrete
delta-hedging under the exact Black-Scholes formula.
More formally, denote by V(t) the dollar value of our replicating portfolio at date i and
let
V(t) = Vs(t) .4- V8(i) + Vc(t) (10)
where Vs(t) is the dollar value of stocks, VB(i) is the dollar value of bonds, and Vc(1) is the
dollar value of call options held in the portfolio at date 1. The initial composition of this
portfolio at date 0 is assumed to be:
Vs(O) = S(0)AE(0) aflBF(o)OFRBF(0)
(11)
Vc(0) —FBS(O) (12)
V8(0) = — (vs(o) + Vc(0)) (13)
where FBS(•) is the Black-Scholes call option pricing formula and FPSF(-) is its RBF approx-
imation. The portfolio positions (11) — (13) represent the sale of one call option at date
0, priced according to the theoretical Black-Scholes formula F95(0), and the simultaneous
purchase of Ag8p(O) shares of stock at price S(0), where 'p.BF(0) is the derivative of the
RBF approximation FJthF(0) with respect to the stock price.9 Since the stock purchase is
wholly financed by the combination of riskless borrowing and proceeds from the sale of the
call option, the initial value of the replicating portfolio is identically zero1 thus
17(0) = Vs(O) + VB(O) + Vc(0) = 0.
Prior to expiration, and at discrete and regular intervals of length r [which we take to be
one day in our simulations], the stock and bond positions in the replicating portfolio will be
9Note that for the RBF and MLP learning networks, A can be computed analytically by taking thederivative of the network approximation. For PPR, however, the use of a smoother for estimating thenonlinear functions h forces a numerical approximation of A, which we accomplish with a first-order finite-difference with an increment SS of size 1/1000 of the range of S.
23

rebalanced so as to satisfy the following relations: -
Vs(i) = S(4ARBF(t) ,8F1(i)
(14)
Vfl(i) = er?VB(t_r) — 5(t)(AJF(t)_&iaF(t—r)) (15)
where t = kr � T for some integer k. The tracking error of the replicating portfolio is then
defined to be the value of the replicating portfolio V(T) at expiration date T. From this, we
obtain the following performance measure:
4 C'TE[ IV(T)I] (16)
The quantity 4 is simply the present 9lue of the expected absolute tracking error of the
replicating portfolio. Although for more complex option portfolios, 4may not be the most
relevant criterion, nevertheless 4 does provide some information about the accuracy of our
option pricing formula.1°
A third measure of performance may be defined by combining the information contained
in the expected tracking error with the variance of the tracking error. In particular, we
define the "prediction error" 'i as:
e_TTE2[V(T)] + Var[V(T)] (17)
which is the present value of the square root of the sum of the squared expected tracking
error and its variance. The inclusion of the variance of V(T) is significant—the expected
tracking error of a delta-hedging strategy might be zero, but the strategy is a poor one if
the variance of the tracking error were large. We shall use all three measures FL2, 4,and tin our performance analysis below.
'01n particular, other statistics of the sample path {V(i)} for the entire portfolio may he of more concern,such as its maximum and Snimum, and the interaction between {V(t)) and other asset returns.
24

Linear-i Linear-2 RBF PPR. MLP B-SMiii 14.72 94.34 98.58 55.23 76.60 100.00Mean 83.40 99.27 99.95 99.08 99.48 100.00Max 95.57 99.82 99.99 100.00 99.96 100.00
Table 2: Out-of-sample R2 values [in percent] for the learning networks, summarized acrossall training and out-of-sample test sets. "Linear-i" refers to the single-regression model ofthe data; "Linear-2" refers to the two-regression model, one for in-the-money options andone for out-of-the-money options; "RBF" refers to a radial-basis-function network with 4multiquadric centers and an output sigmoid; "PPR" refers to a projection pursuit regressionwith four projections; and "MLP" refers to a rnultilayer perceptron with a single hiddenlayer containing four units.
3.4 Testing Network Pricing Formulas
To assess the quality of the RBF pricing formula obtained from each training path, we
simulate an independent six-month sample of daily stock prices—a "test path" —and use the
trained network to delta-hedge various options [individually, not as a portfolio] introduced
at the start of the test path. By simulating many independent test paths, 500 in our case,
and averaging the absolute tracking errors over these paths, we can obtain estimates and
, of the expected absolute tracking error eand the prediction error i for each of the ten
network pricing fonnulas. The performance of the network delta-hedging strategy may then
be compared to the performance of a delta-hedging strategy using the Black-Scholes formula.
3.4.1 Out-of-Sample R2 Comparisons
As a preliminary check of out-of-sample performance, we observe that the pricing errors of
the direct model outputs C/X are typically quite small for all of the networks examined,
with out-of-sample R2's of 99% and above for the "average" network [except for the single
linear model). These results are presented in Table 2. From the minimum .112 values, it is
also evident that not all types of networks yield consistently good results, perhaps because
of the stochastic nature of the respective estimation processes.
25

3.4.2 Tracking Error Comparisons
Table 3 reports selected raw simulation results for a call option with 3 months to expiration
and a strike price X of $50. In each row, the absolute tracking errors for delta-hedging this
option are reported for the network pricing formula training on a single training path, the
entries in each column corresponding to a different test path for which the absolute tracking
error is calculated. For example, the (1,2)-entry 0.2719 is the absolute tracking error for
delta-hedging this 3-month $50-strike option over test path #100, using the network pricing
formula trained on training path #1.
Test #100 Test #200 Test #300 Test #400 Test #500Train #1 0.6968 0-2719 0.1154 0.0018 0.5870Train #2 0.6536 03667 0.0882 0.0903 0.5523Train #3
•0.6832 0.2622 0.0698 0.0370 0.5534
Train #4 0.7175 0.2682 0.0955 0.0155 0.5918Train #5 0.6933 0.2767 0.1055 0.0229 0.5993Train #6 0.6755 0.2692 0.1085 0.0083 0.5600Train #7 0.6971 0.2690 0.1104 0.0054 0.5809Train #8 0.7075 0.2717 0.1087 0.0022 0.5859Train #9 0.6571 0.2652 0.1016 0.0013 0.5389Train #10 0.7105 0.2706 0.1135 0.0038 0.5913B-S 0.0125 0.3461 0.0059 0.0677 0.0492
Table 3: Simulations of absolute delta-hedging errors for RBF networks for an at-the-moneycall option with X = 50, T—t = 3 months, and Black-Scholes price $2.2867. The current stockprice 5(0). is assumed to be $50. The last row displays the same errors for the Black-Scholesformula.
For comparison, over the same test path the absolute tracking error for a delta-hedging
strategy using the Black-Scholes formula is 0.3461, reported in the last row. The fact that
the REF network pricing formula can yield a smaller delta-hedging error than the Black-
Scholes formula may seem counterintuitive. After all, the Black-Scholes formula is indeed
the correct pricing formula in the context of our simulations. The source of this apparent
paradox lies in the fact that we are delta-hedging discretely [once a day], whereas the Black-
Scholes formula is based on a continuously-adjusted delta-hedging strategy. Therefore,.even
the Black-Scholes formula will exhibit some tracking error when applied to Black-Scholes
26

prices at discrete time intervals. In such cases, an RBF pricing formula may well be more
accurate since it is trained directly on the discretely-sampled data, and not based on a
continuous-time approximation.
Of course, other columns in Table 3 show that Black-Scholes can perform significantly
better than the RUF formula [for example, compare the (1, 1)-entry of 0.6968 with the Black-
Scholes value of 0.0125]. Moreover, as the delta-hedging interval shrinks, the Black-Scholes
formula will become increasingly more accurate and, in the limit, will have no tracking
error whatsoever. However, since such a limit is empirically unattainable for a variety of
institutional reasons, the benefits ofnetwork pricing formulas may be quite significant.
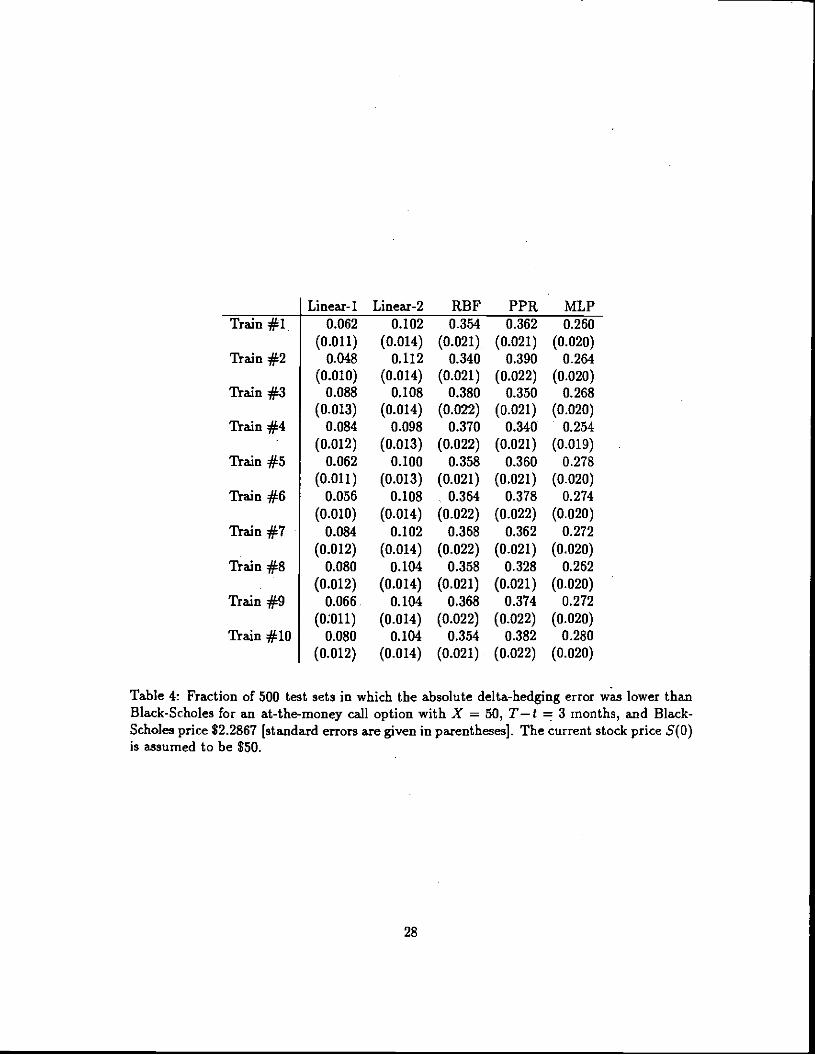
For a more complete comparison between REF networks and the Black-Scholes formula
across all 500 test paths, Table 4 reports the fraction of test paths for which each of the
ten REF networks exhibit lower absoffite tracking error than the Black-Scholes formula.
Similar comparisons are also performed for the single-regression model L"Linear-1"), the two-
regression model ("Linear-2'], a projection pursuit regression ["PPR"] with four projections,
and a. multilayer perceptron ["MLP"] with one hidden layer containing four units.
The third column of entries in Table 4 show that in approximately 36 percentof the 500
test paths, RBF networks have lower tracking error than the Black-Scholes formula. For
this particular option RBF networks and PPR networks have quite similar performance, and
both are superior to the three other pricing models—the next closest competitor is the ML?,
which outperforms the Black-Scholes formula for approximately 26 percent of the test paths.
Of course, tracking errors tend to vary with the terms of the option such as its time-
to-maturity and strike price. To gauge the accuracy of the REF and other pricing models
across these terms, we report in Tables 5 — 9 the fraction of test paths for which each of the
four pricing models outperforms Black-Scholes for strike prices X =40, 45, 50, 55, and 60,
and times-to-maturity T—t = 1, 3, and 6 months.
Table 5 shows that the average RBF network—averaged over the ten training paths—
performs reasonably well for near-the-money options at all three maturities, outperforming
Black-Scholes between 12% and 36% of the time for options with strike prices between $45
and $55. As the maturity increases, the performance of the average RBF network improves
for deep-out-of-the money options as well, outperforming Black-Scholes for 30% of the test
27
________ Linear-i Linear-2 RBF PPR MLPTrain #1. 0.062 0.102 0.354 0.362 0.260
(0.011) (0.014) (0.021) (0.021) (0.020)Train #2 0.048 0.112 0.340 0.390 0.264
(0.010) (0.014) (0.021) (0.022) (0.020)Train #3 0.088 0.108 0.380 0.350 0.268
(0.013) (0.014) (0.022) (0.021) (0.020)Train #4 0.084 0.098 0.370 0.340 0.254
(0.012) (0.013) (0.022) (0.021) (0.019)Train #5 0.062 0.100 0.358 0.360 0.278
(0.011) (0.013) (0.021) (0.021) (0.020)Train #6 0.056 0.108 0.364 0.378 0.274
(0.010) (0.014) (0.022) (0.022) (0.020)Train #7 0.084 0.102 0.368 0.362 0.272
(0.012) (0.014) (0.022) (0.021) (0.020)Train #8 0.080 0.104 0.358 0.328 0.262
(0.012) (0.014) (0.021) (0.021) (0.020)Train #9 0.066. 0.104 0.368 0.374 0.272
(0;011) (0.014) (0.022) (0.022) (0.020)Train #10 0.080 0.104 0.354 0.382 0.280
(0.012) (0.014) (0.021) (0.022) (0.020)
Table 4: Fraction of 500 test sets in which the absolute delta-hedging error was lower thanBlack-Scholes for an at-the-money call option with X = 50, T—t = 3 months, and Black-Scholes price $2.2867 [standard errors are given in parentheses]. The current stock price S(0)is assumed to be $50.
28

REF X=40 X=45 X=50 X=55 X=60T—t = 1 Mean
(SE)Mm
Max
0.001 0.120 0.278 0.266 0.032
(0.000) (0.005) (0.006) (0.006) (0.003)0.000 0.108 0.270 0.176 0.0220.002.e 0.140 0.284 0.332 0.040
T—t = 3 Mean(SE)Mm
Max
0.072 0.296 0.361 0.269 0.254
(0.004) (0.006) (0.007) (0.006) (0.006)0.054 0.242 0.340 0.248 0.1700.084 0.336 0.380 0.322 0.336
= 6 Mean(SE)Mm
Max
0.164 0.263 0.316 0.243 0.304
(0.005) (0.006) (0.007) (0.006) (0.007)0.120 0.220 0.298 0.234 0.2760.200 0.310 0.324 0.258 0.320
Table 5: Fraction of 500 test sets in which the absolute delta-hedging error using an RBFnetwork with 4 rnultiquadric centers and an output sigrnoid is lower than the Black-Scholesdelta-hedging error, for call options with strike price X and time-to-maturity T—t monthson a non-dividend-paying stock currently priced at $50. Within each panel, the top entry ofeach column is the average of this fraction across the 10 training paths, the second entry [inparentheses] is the standard error of that average, and the third and fourth entries are theminimum and maximum across the 10 training paths.
29

paths for the call with a strike price of $60.
Tables 6 and 7 provides similar comparisons for the average MLP and PPR networks,
respectively—averaged over the same training paths as the RBF model—with similar results:
good performance for near-the-money options at all maturities, and good performance for
deep-out-of-the-money options at longer maturities.
MLP X=40 X=45 X=50 X=55 X=60T—t = 1 Mean
(SE)Mm
Max
0.000 0.046 0.238 0.125 0.019
(0.000) (0.003) (0.006) (0.005) (0.002)0.000 0.034 0.228 0.110 0.0080.000 0.066 0.246 0.132 0.028
T—t = 3 Mean(SE)Mm
Max
0.022 0.174 0.268 0.354 0.280
(0.002) (0.005) (0.006) (0.007) (0.006)0.004 0.130 0.254 0.324 0.2160.040 0.220 0.280 0.386 0.384
T—t = 6 Mean(SE)Mm
Max
0.030 0.187 0.252 0.330 0.253
(0.002) (0.006) (0.006) (0.007) (0.006)0.004 0.152 0.204 0.298 0.216
0.074. 0.212 0.302 0.354 0.274
Table 6: Fraction of 500 test sets in which the absolute delta-hedging error using an MLPnetwork with a single hidden layer containing four units is lower than the Black-Scholesdelta-hedging error, for call options with strike price X and time-to-maturity T—t monthson a non-dividend-paying stock currently priced at $50. See Table 5 for details.
Not surprisingly, Tables 8 and 9 show that the linear models exhibit considerably weaker
performance than either of the network models, with fractions of outperforming test paths
between 0.0% and 10.3% for the single-regression model, and between 0.0% and 14.6% for
the two-regression model. However, these results do offer one important insight: even simple
linear models can sometimes, albeit rarely, outperform the Black-Scholes model when delta-
hedging is performed on a daily frequency.
Finally it is important to note that network pricing formulas should be monitored care-
fully for extrapolation. Because the networks are trained on a sampling of points covering a
specific region of input space, it should not be surprising that they may not perform as well
on points outside of this region. For example, Figure 6 illustrates that the worst tracking
error for RBF networks in our simulations occurred for test data that was well outside of

PPR X=40 X=45 X=50 X=55 X=60T—i = 1 Mean
(SE)Mm
Max
0.000 0.165 0.316 0.303 0.024
(0.000) (0.005) (0.007) (0.006) (0.002)0.000 0.118 0.272 0.208 0.0060.002 0.198 0.394 0.364 0.052
T—t = 3 Mean(SE)Mm
Max
0.060 0.282 0.363 0.325 0.177
(0.003) (0.006) (0.007) (0.007) (0.005)0.006 0.202 0.328 0.244 0.0760.126 0.344 0.390 0.420 0.286
T—t = 6 Mean(SE)Mm
Max
0.125 0.287 0.315 0.293 0.197
(0.005) (0.006) (0.007) (0.006) (0.006)0.020 0.190 0.290 0.234 0.1160.202 0.346 0.352 0.358 0.286
Table 7: Fraction of 500 test sets in which the absolute delta-hedging error using a PPRnetwork with four projections is lower than the Black-Scholes delta-hedging error, for calloptions with strike price X and time-to-maturity T—t months on a non-dividend-payingstock currently priced at $50. See Table 5 for details.
Linear-i X=40 X=45 X=50 X=55 X=60T—i = 1 Mean
(SE)Mm
Max
0.000 0.020 0.103 0.016 0.002
(0.000) (0.002) (0.004) (0.002) (0.001)0.000 0.012 0.068 0.010 0.0020.000 0.032 0.124 0.026 0.002
T—t = 3 Mean(SE)Mm
Max
0.003 0.029 0.071 0.018 0.007
(0.001) (0.002) (0.004) (0.002) (0.001)0.000 0.016 0.048 0.010 0.0060.010 0.060 0.088 0.032 0.012
T—t = 6 Mean
(SE)Mm
Max
0.012 0.035 0.039 0.037 0.019
(0.002) (0.003) (0.003) (0.003) (0.002)0.010 0.026 0.024 0.034 0.0100.016 0.046 0.050 0.042 0.026
Table 8: Fraction of 500 test sets in which the absolute delta-hedging error using a single-regression model is lower than the Black-Scholes delta-hedging error, for call options withstrike price X and time-to-maturity T—t months on a non-dividend-paying stock currentlypriced at $50. See Table 5 for details.
31

Linear-2 X=40 X=45 X=50 X=55 X=60T—t = 1 Mean
(SE)Mm
Max
0.000 0.080 0.146 0.068 0.004
(0.000) (0.004) (0.005) (0.004) (0.001)0.000 0.060 0.128 0.058 0.0040.000 0.090 0.170 0.092 0.004
T—i = 3 Mean(SE)Mm
Max
0.018 0.107 0.104 0.095 0.033
(0.002) (0.004) (0.004) (0.004) (0.003)0.010 0.088 0.098 0.080 0.0200.024 0.116 0.112 0.112 0.052
T—t = 6 Mean(SE)Mm
Max
0.045 0.082 0.072 0.082 0.059
(0.003) (0.004) (0.004) (0.O04) (0.003)0.032 0.074 0.056 0.068 0.0380.054 0.090 0.080 0.096 0.072
Table 9: Fraction of 500 test sets in which the absolute delta-hedging error using a two-regression model is lower than the Bla&-Scholes delta-hedging error, for call options withstrike price X and timeto-maturity T—t months on a non-dividend-paying stock currentlypriced at $50. See Table 5 for details.
the range of the training data.
3.4.3 Prediction Error Comparisons
To complete our performance analysis of the networking option pricing formulas, we compare
the estimated prediction errors of the network delta-hedging strategies to those of the
Black-Scholes formula. Recall from (17) that the prediction error combines the expectation
and variance of the absolute tracking error, hence the estimated prediction error is calculated
with the sample mean and sample variance of IV(T)I, taken over the 500 test paths. The
benchmarks for comparison are the estimated prediction errors for the Black-Scholes delta-
hedging strategy, given in Table 10.
Once again, we see from Table 10 that delta-hedging with the Black-Scholes at discrete
intervals does not yield a perfect hedge. The estimated prediction errors are all strictly
positive, and are larger for options near the money and with longer times-to-maturity.
However, under the prediction error performance measure the Bla.ck.Scholes formula is
superior to all of the learning network approaches for this simulated data [see Tables 11 —15].
For example, these tables show that the average RBF network has larger estimated prediction
32

Figure 6: Input points in the training set anderror measure
Table 10: Estimated prediction errors for the absolute tracking error of a delta-hedgingstrategy using the Black-Scholes formula, for call options with strike price X and time-to-maturity T— i months on a non-dividend-paying stock currently priced at $50, estimatedacross 500 independent test paths. Since the Black-Scholes parameters are assumed to beknown, not estimated, these errors do not vary across training paths.
33
0('1
r
e.J
0
0
0.0 0.2 0.4 0.6I
test set for the RBF network with the largest
B-ST—t=1T—t=3T—i=6
X=40 X=45 X=50 X=55 X=600.001o.O430.088
0.0690.1460.157
0.2170.2130.208
0.1160:1550.211
0.0070.0980.147

errors than Black-Scholes for all option types [although REF networks have smaller errors
than the other learning network types] and that the linear models are significantly worse
than the others.1' We also note that the pattern of errors is somewhat different for each
learning network, indicating that each may have its own area of dominance
Overall, we are encouraged by the ease with which the learning, networks achieved error
levels similar to those of the Black-Scholes formula, and on a problem posed in the latter's
favor. We suspect that the learning network approach will be a promising alternative for
pricing and hedging derivatives where there is uncertainty about the specification of the asset
return process.
X=40 X=45 X=50 K=55X=1ORBFT—t•= 1 Mean
(SE)MinMax
0.044 0.164 0.310 . 0.157 0.O39(0.603). (0.002) (0.0O2). (0.001) : (0.001)
0.031 0.150 0.298 0.152 0.0350.059 0.172 0.316 0.163 0.045
T—i = 3 Mean
(SEJMm
Max
0.142 0.215 0.296 0.257 0.155
(0.008) (0.002) (0.001) (0.001) (0.001)0.113 0.208 0.291 0.249 0.1520.177 0.225 0.299 0.263 0.161
= 6 Mean
(SE)Mm
Max
0.236 0.271 0.309 0.340 0.214
(0.011) (0.006) (0.002) (0.002) (0.001). 0.236 0.243 0.299 0.329 0.207
0.334 0.300 0.315 0.347 0.224
Table 11: Estimated prediction errors for the absolute tracking error of a delta-hedgingstrate' using an REF network with 4 multiquadric centers and an output sigmoid, for calloptions with strike price X and time-to-maturity T—tmonths on a non-dividend-paying stockcurrently priced at $50, estimated across 500 independent test paths. Within each panel,the top entry of each column is the average of the estimated prediction error across the 10training paths, the second entry (in parenthesesi is the standard error of that average, andthe third and fourth entries are the minimum and maximum across the 10 training paths.
"We caution the reader from drawing too strong a conclusion from the ordering of the RBF, MLP, andPPR results, however, due to the sensitivity of these nonparametric techniques to the "tuning" of theirspecifications, e.g., number of hidden nodes, network architecture, etc. In particular, the superiority of theRBF network results may be due to the fact that we have bad more experience in tuning their specification.
34

MLP X=40 X=45 X=50 X=55 X=60T—i = 1 Mean
(SE)Mm
Max
0.214 0.264 0.389 0.209 0.060
(0.024) (0.008) (0.006) (0.004) (0.002)0.124 0.228 0.365 0.194 0.0500.386 0.314 0.429 0.234 0.075
T—i = 3 Mean
(SE)Mm
Max
0.690 0.323 0.366 0.285 0.178
(0.118) (0.016) (0.003) (0.004) (0.002)0.271 0.261 0.356 0.270 0.1711.477 0.417 0.388 0.308 0.194
T—i = 6 Mean
(SE)Mm
Max
1.187 0.733 0.400 0.356 0.264
(0.174) (0.087) (0.007) (0.004) (0.002)0.538 0.425 0.373 0.344 0.2552.377 1.352 0.448 0.377 0.274
Table 12: Estimated prediction errors for the absolute tracking error of a delta-hedgingstrategy using an MLP network with a single hidden layer containing four units, for calloptions with strike price X and time-to-maturity T—t months on a non-dividend-payingstock currently priced at $50, estimated across 500 independent test paths. See Table 11 forfurther details.
PPR X=40 X=45 X=50 X=55 X=60= 1 Mean
(SE)Mm
Max
0.198 0.121 0.271 0.147 0.081
(0.094) (0.005) (0.006) (0.004) (0.024)0.028 0.101 0.245 0.131 0.0280.991 0.144 0.301 0.167 0.261
T—t = 3 Mean(SE)MliiMax
1.180 0.275 0.276 0.238 0.247
(0.299) (0.056) (0.006) (0.011) (0.046)0d34 0.174 0.254 0.202 0.1363.113 0.759 0.309 0.320 0.555
T—t = 6 Mean
(SE)Mm
Max
2.140 1.056 0.383 0.367 0.443
(0.383) (0.201) (0.045) (0.029) (0.074)0.511 0.246 0.259 0.268 0.2244.337 2.325 0.719 0.589 0.931
Table 13: Estimated prediction errors for the absolute tracking error of a delta-hedgingstrategy using a PPR network with four projections, for call options with strike price Xand time-to-maturity T—t months on a non-dividend-paying stock currently priced at $501estimated across soo independent test paths. See Table 11 for further details.
35

Linear-i X=40 Xrr45 X=50 X=55 X=60TLt = 1 Mean
(SE)Mm
Max
1.047 0.967 0.911 1.672. 1.879
(0.096) (0.091) (0.036) (0.091) (0.098)0.561 0.507 0S13 1.251 1.4251.492 L393 1.132 2.135 2.375
T—t = 3 Mean,
(SE)Mm
Max
1.849 1.486 1.697 2.624 3.015
(0.1.72) (0.117) (0.049) (0.153) (0.163)0.983 0.959, 1.580 1.936 2.2602.649 2.091 2.013 3.411 3.845
= 6 Mean
(SE)Mm
Max
2.276 2.124 2d70 2.910 3.780
(0.213) (0.149) (0.073) (0.173) (0.214)1.208 1.495 2.000 2.170.2.8053.275 2.926 2.629 3.821 4.879
Table 14: Estimated prediction errors for the absolute tracking error of a delta-hedgingstrategy using a single-regression model, for call options with strike price X and time-to-maturity T —i months on a non-dividend-paying stock currently priced at $50, estimatedacross 500 independent test paths. See Table 11 for further details.
Linear-2 X=40 X=45 X=50 X55 X60T—t = 1 Mean
(SE)MiiiMax
0.212 0.207 0.724 0.455 0.518
(0.018) (0.013) (0.011) (0.034) (0.045)0.154 0.168 0.681 0.335 0.344
0.340 0.304 0.776 0.628 0.739T—t = 3 Mean
(SE)Mm
Max
0.371 0.555 1.054 0.836 0.790
(0.029) (0.003) (0.013) (0.024) (0.067)0.277 0.539 0.995 0.767 0.5390.586 0.566 1.118 0.972 1.130
T—i = 6 Mean(SE)MiiiMax
0.500 0.955 1.544 1.454 1.042
(0.027) (0.008) (0.022) (0.019) (0.055)0.412 0.909 1.452 1.373 0.8800.709 0.988 1.650 1.563 1.342
Table 15; Estimated prediction errors for the absolute tracking error of a delta-hedgingstrategy using a two-regression model, for call options with strike price X and time-to-maturity T — t months on a non-dividend-paying stock currently priced at $50, estimatedacross 500 independent test paths. See Table 11 for further details.
36

4 An Application to S&P 500 Futures Options
In Section 3 we have shown that learning networks can efficiently approximate the Black-
Scholes pricing formula if the data were generated by it, and this provides some hope that
our nonparametric approach may be useful in practice. After all, if there is some uncertainty
about the parametric assumptions of a typical derivative pricing model, it should come as
no surprise that a nonparametric model can improve pricing and hedging performance. To
gauge the practical relevance of learning networks in at least one context, we apply it to the
pricing and hedging of S&P 500 futures options, and compare it to the Black-Scholes model
applied to the same data. Despite the fact that the Black-Scholes model is generally not used
in its original form in practice, we focus on it here because it is still a widely-used benchmark
model, and because it serves as an example of a parametric model whose assumptions are
questionable in the context of this data.
4.1 The Data and Experimental Setup
The data for our empirical analysis are daily closing prices of S&P 500 futures and futures
options for the 5-year period from January 1987 to December 1991. Futures prices over this
period are shown in Figure 7. There were 24 different futures contracts and 998 futures call
options active during this period.'2 The futures contracts have quarterly expirations, and
on a typical day 40 to 50 call options based on 4 different futures contracts were traded.
Our specification is similar to that given in Section 3.1 for the simulated data. We divide
the S&P 500 data into 10 non-overlapping six-month subperiods for training and testing the
learning networks. Six-month subperiods were chosen to match approximately the number
of data points in each training path with those of our simulations in Section 3. Data for the
second half of 1989 is shown in Figures 8 and 9. Notable differences between this data and
the simulated data of Section 3 are the presence of "noise" in the real data and the irregular
trading activity of the options, especially for near-term out-of-the-money options.
For the S&P 500 data, the number of futures call options per subperiod ranged from
70 to 179, with an average of 137. The total number of data points per subperiod ranged
'2For simplicity, we focus only on call options in our analysis.
37

80.U)
U-
Date
Figure 7: Overlay of S&P 500 futures prices for all contracts active from January 1987 toDecember 1991.
38
C
8701870587098801880588098901890589099001900590099101 91059109
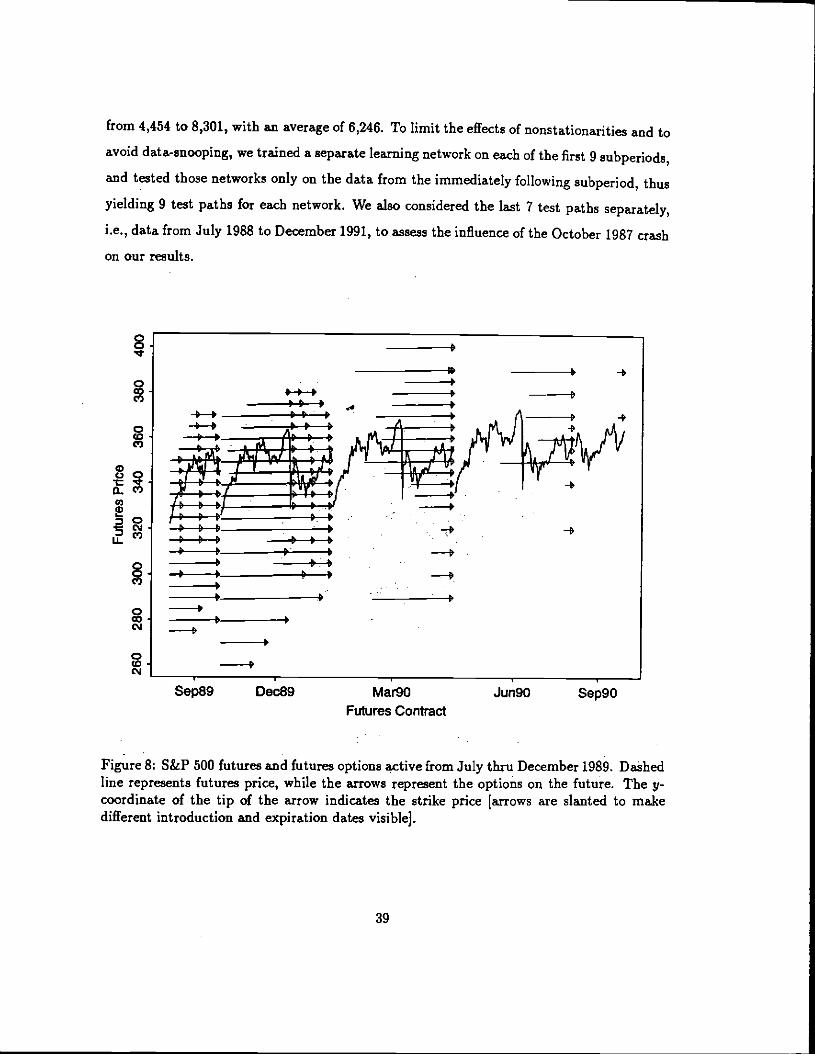
from 4,454 to 8,301, with an average of 6,246. To limit the effects of nonstationarjtjes and toavoid data-snooping, we trained a separate learning network on each of the first 9subperiods,and tested those networks only on the data from the immediately following subperiod, thusyielding 9 test paths for each network. We also considered the last 7 test paths separately,
i.e., data from July 1988 to December 1991, to assess the influence of the October 1987 crash
on our results.
C ______ _________C0 ________________ ____0, _______________________ _____
LL
Figure 8: S&P 500 futures and futures options active from July thru December 1989. Dashedline represents futures price, while the arrows represent the options on the future. The y-coordinate of the tip of the arrow indicates the strike price [arrows are slanted to makedifferent introduction and expiration dates visible].
39
S1 : 4I
i
I
tz
-ixtvtWW:
:Sep89 Dec89 Mar90
Futures ContractJun90 Sep90

'I.0
0
Co
00
Figure 9: July thru December 1989 S&P 500 futures call option prices, normalized by strikeprice and plotted venus stock price and time to expiration. Points represent daily observa-tioni. Note the bumpiness of the surface, and the irregular sampling away from the money.
40

4.2 Estimating Black-Scholes Prices
Estimating and comparing models on the S&P 500 data will proceed much as it did in
Section 3 for the linear and learning network models. However, the Black-Scholes parameters
r and a must be estimated when using actual market data. horn a theoretical perspective,
the Black-Scholes model assumes that both of these parameters are constant over time, and
thus we might be tempted to estimate them using all available past data. Few practitioners
adopt this approach, however, due to substantial empirical evidence of nonstationarities
in interest rates and asset-return distributions. A common compromise is to estimate the
parameters using only a window of the most recent data. We follow this latter approach for
the S&P 500 data. Specifically, we estimate the Black-Scholes volatility a for a given S&P
500 futures contract using
(18)
where s is the standard deviation of the 60 most recent continuously-compounded daily
returns of the contract. We approximate the risk free rate rfor each futures option as the
yield of the 3-month fteasury bill on the close of the month before the initial activity in
that option [see Figure 10].
4.3 Out-of-Sample Pricing and Hedging
In this section we present the out-of-sample results of fitting the various models to the S&P
500 data. Based on our experience with the simulated data, we chose learning networks with
4 nonlinear terms as a good compromise between accuracy and complexity, although it may
be worth re-examining this trade-off on actual S&P 500 data.'3
The out-of-sample tests show, some evidence that the learning networks outperform the
naive Black-Scholes model on this data. This is hardly surprising, given the fact that many
of the assumptions of the Black-Scholes formula are violated by the data, e.g., geometric
Brownian motion, constant volatility, frictionless markets, etc.
'3A sample re-use technique such as cross-validation would be appropriate in this context for choosing thenumber of nonlinear terms.
41
2
irs
III.
2
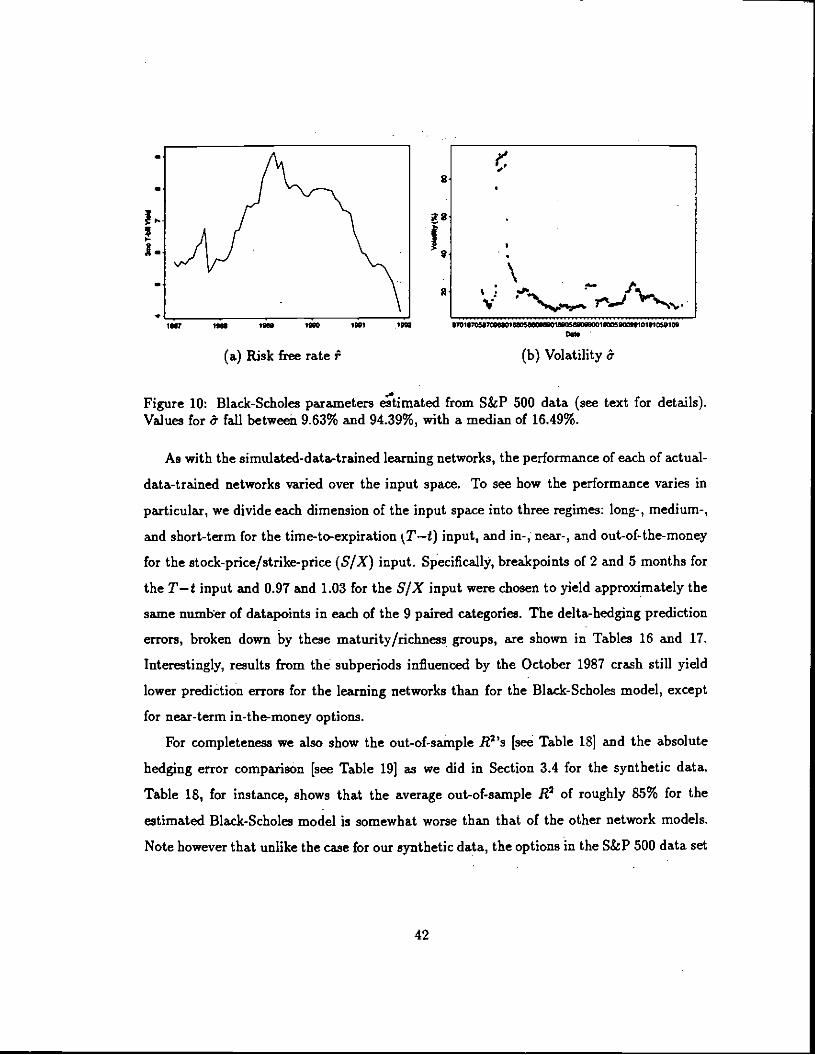
III? I'll 'Oil lOgo IDOl 102C-
(a) Risk free rate (b) Volatility &
Figure 10: Black-Scholes parameters eimated from S&P 500 data (see text for details).Values for & fall between 9.63% and 94.39%, with a median of 16.49%.
As with the simulated-data-trained learning networks, the performance of each of actual-
data-trained networks varied over the input space. To see how the performance varies in
particular, we divide each dimension of the input space into three regimes: long-, medium-,
and short-term for the time-to-expiration 7—i) input, and in-, near-, and out-of-the-money
for the stock-price/strike-price (S/X) input. Specifica1ly breakpoints of 2 and 5 months for
the T—t input and 0.97 and 1.03 for the S/X input were chosen to yield approximately the
same number of datapoints in each of the 9 paired categories. The delta-hedging prediction
errors, broken down by these maturity/richness groups, are shown in Tables 16 and 17.
Interestingly, results from the subperiods influenced by the October 1987 crash still yield
lower prediction errors for the learning networks than for the Black-Scholes model, except
for near-term in-the-money options.
For completeness we also show the out-of-sample .R21s isee Table 18] and the absolute
hedging error comparison [see Table 191 as we did in Section 3.4 for the synthetic data.
Table 18, for instance, shows that the average out-of-sample 112 of roughly 85% for the
estimated Black-Scholes model is somewhat worse than that of the other network models.
Note however that unlike the case for our synthetic data, the options in the S&P 500 data set
42
a
a
a'I
V

Table 16: Delta-hedging prediction error for the out-of-sample S&P 500 data from July 1988to December 1991, i.e., excluding the subperiods directly influenced by the October 1987crash, averaged across all training/test sets.
Table 17: Delta-hedging prediction error for the out-of-sample S&P 500 data from July 1987to July 1988, i.e., the subperiods directly influenced by the October 1987 crash, averagedacross all training/test sets.
43
Short term Linear-i Linear-2 RBF PPR MLP B-S 0(0)In the moneyNear the moneyOut of the money
Medium term
6.70 4.92 5.04 4.52 4.94 4.428.70 4.12 3.49 3.37 3.42 2.768.38 2.71 2.17 2.31 1.63 1.59
Linear-i Linear-2 RBF PPR MLP B-S
24.268.041.00
0(0)in the moneyNear the moneyOut of the money
Long term
9.48 6.41 6.70 6.53 5.62 5.938.82 6.93 4.18 5.02 4.54 5.31
11.27 4.69 2.53 2.73 2.32 2.55
Linear-i Linear-2 RBF PPR MLP B-S
35.8810.622.74
0(0)In the moneyNear the moneyOut of the money
8.23 6.14 7.24 11.40 5.60 7.588.55 8.58 6.37 5.55 5.17 6.18
12.13 7.35 3.54 5.39 4.36 5.02
39.2716.146.86
Short term Linear-i Linear-2 RBF PPR MLP B5 c(0)In the moneyNear the moneyOut of the money
Medium term
10.61 8.80 7.27 9.23 9.12 3.9416.30 12.73 7.77 7.48 8.08 9.0923.76 8.48 7.43 5.51 5.34 10.53
Linear-i Linear-2 RBF PPR MLP B-S
20.1810.765.44
0(0)In the moneyNear the moneyOut of the money
Long term
9.18 11.17 7.13 12.57 13.90 16.0024.48 13.36 7.59 5.65 5.11 6.1234.31 14.80 12.30 9.44 9.64 13.46
Linear-i Linear-2 ROF PPR MLP B-S
36.0512.987.45
0(0)In the moneyNear the moneyOut of the money
24.97 22.37 13.84 23.75 27.13 30.3635.06 12.93 10.78 10.11 12.27 16.0329.07 14.05 9.50 8.59 8.10 10.86
28.0816.9810.26

Linear-i Linear-2 RBF PPR MLP B-SMm 7.85 82.63 81.33 92.26 92.28 37.41Mean 75.57 95.54 93.26 96.56 95.53 84.76Max 95.74 99.44 98.41 99.54 98.98 99.22
Table 18: Out-of-sample R2 values [in percent for the learning networks, summarized acrossthe 9 out-of-sample S&P 500 futures options test sets.
____________ Linear-i Linear-2 RBF PPR MLPJul 87 - Dec 87 0.160 0.377 0.506 0.593 0.580Jan 88 -. Jun 88 0.189 0.357 0.476 0.497 0.538Jul 88 - Dec 88 0.122 0.341 0.382 0.358 0.301Jan 89 - Jun 89 0.221 0.405 0.534 0.550 0.481Jul 89 - Dec 89 0.355 0.428 0.529 0.609 0.543Jan 90 - Jun 90 0.329 0.423 0.557 0.550 0.631Jul 90 -.Dec 90 0.230 0.425 0.540 0.569 0.649Jan 91 - Jun 91 0.296 0.419 0.497 0.346 0.313Jul 91 - Dec 91 0.248 0.337 0.218 0.327 0.317
Table 19: Fraction of out-of-sample test set S&P 500 futures options in which the absolutedelta-hedging error for each learning network was lower than the Black-Scholes delta-hedgingerror, shown for each test period.
are not independent, and thus we must look at these results with caution. Furthermore, we
only have one test set for each trained ne.work, and thus for the hedging error comparison
in Table 19 we show these results broken down by test period instead of the summary
statistics shown in Section 3.4.2. Nonetheless, this table shows that the learning networks
exhibit less hedging error than the estimated Black-Scholes formula in a substantial fraction
of the options tested—up to 65% of the options tested against the MLP network for the
July — December 1990 testing period.
From these results, it is difficult to infer which network type performs best in general.
Hypothesis tests concerning the relative sizes of hedging error are difficult to formulate
precisely because of the statistical dependence of the option-price paths. Focusing on a
single non-overlapping sequence of options would solve the dependence problem, but would
throw out 98% of the available options. Instead, we present a less formal test on all of the
44

Pair t-statistic p-valueLinear-i vs B-S -15.1265 1.0000Linear-2 vs B-S -5.7662 1.0000RBF vs B-S 2.1098 0.0175PPR vs B-S 2.0564 0.02MLP vs B-S 3.7818 0.0001
Table 20: Paired t-test comparing relative magnitudes of absolute hedging error, using resultsfrom all S&P 500 test sets, i.e., data from July 1987 to December 1991. The degrees offreedom for each test were 1299, although see comments in the text concerning dependence.
data, but caution the reader not to give it undue weight. Since we have hedging errors for
each option and learning network, we can use a paired t-test to compare the Black-Scholes
absolute hedging error on each option wjjh the network's absolute hedging error on the same
option. The null hypothesis is that the average difference of the two hedging errors is zero,
and the [one-sided] alternative hypothesis is that the difference is positive, i.e., the learning
network hedging error is smaller. Results of this simple test show evidence that all three
learning networks outperform the Black-Scholes model, while the linear models do not Isee
Table 20).
It is also interesting to compare the computing time required to estimate these models,
although no effort was made to optimize our code, nor did we attempt to optimize the
estimation method for each type of learning network. With these qualifications in mind, we
find that second order methods seem preferred for our application. For example, the MLP
network gradient descent equations were updated for 10,000 iterations, requiring roughly 300
minutes per network on a multiuser SUN SPARCstation II, while the Levenberg-Marquardt
method for the RBF networks used from 10 to 80 iterations and took roughly 7 minutes per
network. Similarly, the PPR networks [with a Newton method at the core] took roughly 120
minutes per network.
5 Conclusions
Although parametric derivative pricing formulas are preferred when they are available, our
results show that nonparametric learning-network alternatives can be useful substitutes when
45

parametric methods fail. While our findings are promising, we cannot yet claim that our
approach will be successful in general—for simplicity, our simulations have focused only on
the Black-Scholes model, and our application has focused only on a single instrument and
time period, S&P 500 futures options for 1987 to 1991. In particular, there are a host of
parametric derivative pricing models, as well as many practical extensions of these models
that may improve their performance on any particular data set We hope to provide a more
comprehensive analysis of these alternatives in the near future.
However, we do believe there is reason to be cautiously optimistic about our general
approach, with a number of promising directions for future research. Perhaps the most
pressing item on this agenda is the specification of additional inputs, inputs that are not
readily captured by parametric models such as the return on the market, general market
volatility, and other measures of business conditions. A related issue is the incorporation
of the predictability of the underlying asset's return, and cross-predictability among several
correlated assets [see Lo and Wang (1993) for a parametric example]. This may involve the
construction of a factor model of the underlying asset's return and volatility processes.
Other research directions are motivated by the need for proper statistical inference in the
specification of learning networks. First, we require some method of matching the network
architecture—number of nonlinear units, number of centers, type of basis functions, etc.—to
the specific dataset at hand in some optimal [and, preferably, automatic) fashion.
Second, the relation between sample size and approximation error should be explored,
either analytically or through additional Monte Carlo simulation experiments. Perhaps some
data-dependent metric can be constructei, such as the model prediction error, that can
provide real-time estimates of approximation errors in much the same way that standard
errors may be obtained for typical statistical estimators.
And finally, the need for better performance measures is clear. While typical measures
of goodness-of-fit such as It2 do offer some guidance for model selection, they are only
incomplete measures of performance. Moreover, the notion of degrees of freedom is no longer
well-defined for nonlinear models, and this has implications for all statistical measures of fit.
46

References[1] A.R. Barron. Universal approximation bounds for superpositions of a sigmoidal func-
tion. Technical Report 58, Department of Statistics, University of Illinois at Urbana-Champaign, Champaign, IL, March 1991.
[2] A.R.. Barron and R.L. Barron. Statistical learning networks: a unifying view. In 20thSymposium on the Interface: Computing Science and Statistics, pages 192—203, 1988.
131 D.S. Broomhead and D. Lowe. Multivariable functional interpolation and adaptivenetworks. Complex Systems, 2:321 —355, 1988.
141 H. Chen. Estimation of a projection-pursuit type regression model. Ann. Statistics,19:142—157, 1991.
151 0. Cybenko. Approximation by superpositions of a sigmoidal function. Technical Report856, University of illinois, Dept. of Electrical and Computer Engineering, 1988.
16] P. Diaconis and M. Shahshahani. On nonlinear functions of linear combinations. SIAMJ. Sci. Stat. Comput., 5(1):175—191, 1984.
171 D.L. Donoho and I. Johnstone. Projection-based approximation and a duality withkernel methods. Ann. Stat., 17:58—106, 1989.
[8] J.H. Friedman and W. Stuetzle. Projection pursuit regression. Journal of the AmericanStatistical Association, Theory and Methods Section, 76(376), December 1981.
[9] A. Gallant and H. White. On learning the derivatives of an unknown mapping withmultilayer feedforward networks. Neural Networks, 5:128—138, 1992.
[10] F. Girosi and G. Anzellotti. Rates of convergence of approximation by translates. A.I.Memo 1288, Massachusetts Institute of Technology Artificial Intelligence Laboratory,1992.
[11] F. Girosi, M. Jones, and T. Poggio. Priors, stabilizers and basis functions: from reg-ularization to radial, tensor and additive spilnes. Artificial Intelligence Memo 1430,Massachusetts Institute of Technology, 1993.
[12] F. Girosi and T. Poggio. Networks and the best approximation property. BiologicalCybernetics, 63:169—176, 1990.
[13] K. Hornik. Multilayer feedforward networks are universal approximators. Neural Net-works, 2(5):359—366, 1989.
[14) K. Hornik, M. Stinchcombe, and H. White. Universal approximation of an unknownmapping and its derivatives. Neural Networks, 3:551—560, 1990.
[15] P.J. Huber. Projection pursuit. Ann. Stat., 13(2):435—525, 1985.
[16] J. C. Hull. Options, Futures, and Other Derivative Securitie.'. Prentice-Hall, EnglewoodCliffs, New Jersey, 2nd edition, 1993.
47

[17] L.K. Jones. On a conjecture of Huber concerning the convergence of projection pursuitregression. Ann. Stat., 15(2):880—882, 1987.
[18] L. Ljung and T. Sôderström. Theory and Practice of Recursive Identification. MITPress, Cambridge, 1986.
[19] A. Lo and J. Wang. Implementing option pricing models when asset returns are pre-dictable. Research Program in Computational Finance Working Paper RPCF—1001-93,MIT Sloan School of Management, 1993.
[201 M. Maruyarna, F. (lirosi, and T. Poggio. A connection between GRBF and MLP.Artificial Intelligence Memo 1291, Massachusetts Institute of Technology, 1991.
[21] Charles A. Micehelli. Interpolation of scattered data: Distance matrices and condition-ally positive definite functions. Constructive Approximation, 2:11—22, 1986.
[22] J. Moody and C. Darken. Fast learning in networks of locally tuned processing units.Neural Computation, 1(2):281—294, 1989.
[231 K. Ng and R. Lippman. A comparative study of the practical characteristics of neuralnetwork and conventional pattern classifiers. In R. Lippman, 3. Moody, and D. Touret-sky, editors, Advances in Neural Information Processing Systems 3. Morgan-Kaufman,1991.
[241 P. Niyogi and F. Girosi. On the relationship between generalization error, hypothesiscomplexity, and sample complexity for radial basis functions. A.J. Memo 1467, MITArtificial Intelligence Laboratory, 1994.
[25] D.B. Parker. Learning logic. Technical Report 47, Center for Computational Researchin Economics and Management Science, MIT, April 1985.
[26J T. Poggio and F. Girosi. Networks for approximation and learning. Proceedings ofIEEE, 78(9):1481—1497, 1990.
[271 M. J. D. Powell. Radial basis functions for multivariable interpolation: A review. In3. C. Mason and M. C. Cox, editors, Algorithms for Approximation, pages 143—167.Clarendon Press, Oxford, 1987.
[28) C. H. Reinsch. Smoothing by spline functions. Numer Math, 10:177—183, 1967.
[29] H. Robbins and S. Monro. A stochastic approximation model. Annals of MathematicalStatistics, 22:400—407, 1951.
[30] D.E. Rumelhart, G.E. Hinton, and R.J. Williams. Learning internal representation byerror propagation. In D.E. Rumelhart and IL. McClelland, editors, Parallel DistributedProcessing: Explorations in the Microstntcture of Cognition, Volume 1: Foundations,chapter 8. MIT Press, Cambridge, MA, 1986.
[31] V. N. Vapnik. Estimation of Dependences Based on Empirical Data. Springer-Verlag,Berlin, 1982.
48

[32] 0. Wahba. Spline Models for Observational Data, volume 59 of Regional ConferenceSeries in Applied Mathematics. SIAM Press, Philadelphia, 1990.
[33] B. Widrow and S. D. Stearns. Adaptive Signal Processing. Prentice-Hall, EnglewoodCliffs, NJ, 1985.
49