january 2007 - september 2008 (2000=100 · · 2012-05-04table 1 value of production index (vapi),...
TRANSCRIPT

Table 1 Value of Production Index (VaPI), Year-on-Year and Month-on-Month Growth Rates for Manufacturing Sector January 2007 - September 2008 (2000=100) ============================================================================================ | TOTAL MANUFACTURING | FOOD MANUFACTURING Year/Month | Index | Year-on-Year | Month-on-Month | Index | Year-on-Year | Month-on-Month | | Growth Rates | Growth Rates | | Growth Rates | Growth Rates -------------------------------------------------------------------------------------------- 2007 142.4 -3.8 213.7 0.3 Jan 137.4 -0.5 -10.9 203.0 9.7 -23.4 Feb 124.5 -10.4 -9.4 192.9 -2.0 -5.0 Mar 143.2 -5.7 15.0 227.8 -0.7 18.1 Apr 135.1 -4.3 -5.6 188.5 -6.0 -17.3 May 137.6 -8.4 1.9 178.6 -8.7 -5.2 Jun 142.7 -4.0 3.7 198.7 6.3 11.2 Jul 145.5 0.1 2.0 203.3 14.3 2.4 Aug 145.0 -2.4 -0.4 201.6 2.8 -0.9 Sep 142.4 -3.4 -1.8 207.1 4.5 2.8 Oct 149.5 -3.3 5.0 233.5 -9.9 12.7 Nov 147.7 -6.1 -1.2 243.3 -9.0 4.2 Dec 158.3 2.6 7.2 286.1 8.0 17.6 2008 Jan 133.3 -3.0 -15.8 185.1 -8.8 -35.3 Feb 133.8 7.5 0.4 202.6 5.0 9.5 Mar 136.8 -4.4 2.2 218.9 -3.9 8.0 Apr 145.9 8.0 6.7 230.8 22.4 5.4 May 151.2 9.9 3.6 227.1 27.2 -1.6 Jun 156.0r 9.4 3.2 236.8 19.2 4.3 Jul 163.8r 12.6 5.0 255.5r 25.6 7.9 Aug 159.3r 9.8 -2.8 257.5r 27.8 0.8 Sep 170.3 19.7 6.9 271.2 30.9 5.3 --------------------------------------------------------------------------------------------

Table 1 (continued) ============================================================================================ | PROCESSED MEAT AND FISH a/ | PROCESSED FRUITS AND VEGETABLES a/ Year/Month | Index | Year-on-Year | Month-on-Month | Index | Year-on-Year | Month-on-Month | | Growth Rates | Growth Rates | | Growth Rates | Growth Rates -------------------------------------------------------------------------------------------- 2007 118.0 4.8 269.8 -1.6 Jan 107.8 3.8 -16.8 184.8 -9.0 -55.4 Feb 108.4 4.4 0.5 206.5 11.3 11.8 Mar 119.6 11.3 10.3 240.5 -4.2 16.5 Apr 113.1 16.8 -5.4 229.6 6.8 -4.5 May 109.2 -0.5 -3.4 244.4 0.2 6.4 Jun 109.1 -2.0 -0.1 289.8 26.7 18.6 Jul 128.0 14.9 17.3 279.3 5.8 -3.6 Aug 114.4 0.3 -10.6 301.4 0.0 7.9 Sep 120.8 5.5 5.6 262.8 -15.7 -12.8 Oct 124.7 1.9 3.2 318.4 -3.1 21.2 Nov 128.8 2.3 3.3 319.8 -6.9 0.4 Dec 131.9 1.7 2.4 360.1 -13.2 12.6 2008 Jan 103.7 -3.9 -21.4 220.5 19.3 -38.8 Feb 99.7 -8.0 -3.9 204.8 -0.8 -7.1 Mar 117.7 -1.5 18.2 187.6 -22.0 -8.4 Apr 117.3 3.7 -0.4 193.6 -15.7 3.2 May 133.3 22.1 13.7 191.0 -21.9 -1.4 Jun 128.6 17.9 -3.5 194.9 -32.7 2.1 Jul 151.6 18.5 17.9 212.4 -24.0 9.0 Aug 142.1r 24.2 -6.3 233.3r -22.6 9.8 Sep 151.5 25.4 6.6 250.7 -4.6 7.5 --------------------------------------------------------------------------------------------- a/ - Subsector of Food Manufacturing

Table 1 (continued) ============================================================================================= | VEGETABLES/ANIMAL OILS AND FATS a/ | MILK AND DAIRY PRODUCTS a/ Year/Month | Index | Year-on-Year | Month-on-Month | Index | Year-on-Year | Month-on-Month | | Growth Rates | Growth Rates | | Growth Rates | Growth Rates --------------------------------------------------------------------------------------------- 2007 89.4 -11.4 537.0 13.8 Jan 106.9 8.7 -1.5 216.3 18.7 -69.9 Feb 90.9 -0.5 -14.9 258.4 -1.2 19.5 Mar 101.8 -12.5 11.9 350.6 7.1 35.7 Apr 97.8 9.9 -3.9 370.6 11.1 5.7 May 70.3 -35.1 -28.1 433.5 10.6 17.0 Jun 126.8 36.5 80.4 522.4 17.3 20.5 Jul 110.7 13.8 -12.7 572.6 20.2 9.6 Aug 90.9 -25.8 -17.9 619.4 4.8 8.2 Sep 106.5 -3.5 17.2 656.7 10.2 6.0 Oct 88.1 -1.6 -17.3 758.2 18.6 15.5 Nov 28.4 -67.0 -67.8 805.1 15.5 6.2 Dec 53.9 -50.3 90.3 879.8 22.3 9.3 2008 Jan 139.9 31.0 159.4 284.5 31.5 -67.7 Feb 116.1 27.7 -17.0 364.8 41.2 28.2 Mar 181.1 77.9 55.9 408.3 16.4 11.9 Apr 143.8 47.1 -20.6 486.8 31.4 19.2 May 111.8 59.0 -22.3 550.8 27.0 13.1 Jun 146.6 15.6 31.2 625.2 19.7 13.5 Jul 127.6r 15.3 -13.0 694.6 21.3 11.1 Aug 108.5 19.4 -14.9 735.8r 18.8 5.9 Sep 70.2 -34.1 -35.3 822.3 25.2 11.8 --------------------------------------------------------------------------------------------- a/ - Subsector of Food Manufacturing

Table 1 (continued) ============================================================================================= | GRAIN MILL PRODUCTS a/ | ANIMAL FEEDS a/ Year/Month | Index | Year-on-Year | Month-on-Month | Index | Year-on-Year | Month-on-Month | | Growth Rates | Growth Rates | | Growth Rates | Growth Rates --------------------------------------------------------------------------------------------- 2007 188.9 15.6 180.3 9.8 Jan 175.2 -7.5 15.2 183.1 20.2 16.5 Feb 162.3 -3.8 -7.4 152.5 7.2 -16.7 Mar 184.9 9.5 13.9 180.9 5.6 18.6 Apr 167.9 22.6 -9.2 168.8 11.8 -6.7 May 192.4 22.0 14.6 181.5 9.9 7.5 Jun 190.4 17.9 -1.0 185.6 18.3 2.3 Jul 184.5 16.9 -3.1 192.8 22.1 3.9 Aug 192.0 20.0 4.1 181.9 3.3 -5.7 Sep 194.6 28.5 1.4 179.5 -1.9 -1.3 Oct 217.0 26.1 11.5 197.6 9.2 10.1 Nov 198.4 7.6 -8.6 181.1 2.1 -8.4 Dec 207.0 36.1 4.3 178.5 13.5 -1.5 2008 Jan 178.9 2.1 -13.6 187.8 2.5 5.2 Feb 195.2 20.2 9.1 171.0 12.1 -8.9 Mar 191.4 3.6 -1.9 181.2 0.2 6.0 Apr 203.5 21.2 6.3 189.3 12.2 4.5 May 204.0 6.0 0.2 194.2 7.0 2.6 Jun 210.7 10.6 3.3 180.2 -3.0 -7.2 Jul 233.8 26.7 11.0 209.0 8.4 16.0 Aug 253.0r 31.8 8.2 204.7 12.6 -2.1 Sep 211.4 8.6 -16.5 214.8 19.7 4.9 -------------------------------------------------------------------------------------------- a/ - Subsector of Food Manufacturing

Table 1 (continued) ============================================================================================= | BAKERY PRODUCTS a/ | MILLED AND REFINED SUGAR a/ Year/Month | Index | Year-on-Year | Month-on-Month | Index | Year-on-Year | Month-on-Month | | Growth Rates | Growth Rates | | Growth Rates | Growth Rates --------------------------------------------------------------------------------------------- 2007 194.6 -12.1 286.9 -28.1 Jan 170.4 -24.0 -26.4 761.0 28.8 89.3 Feb 157.8 -25.8 -7.4 616.8 -7.6 -18.9 Mar 160.4 -30.7 1.6 739.1 2.2 19.8 Apr 170.3 -18.3 6.2 370.6 -40.4 -49.9 May 171.4 -22.3 0.7 147.2 -59.5 -60.3 Jun 217.8 -17.3 27.1 67.4 -68.0 -54.2 Jul 190.5 -13.8 -12.5 80.0 21.0 18.8 Aug 176.1 -7.8 -7.6 27.6 -12.7 -65.5 Sep 216.6 -8.0 23.0 31.9r 49.5 15.6 Oct 222.6 -2.8 2.8 43.2 -91.9 35.6 Nov 226.6 20.3 1.8 155.5 -72.2 259.6 Dec 254.6 10.0 12.4 402.5 0.1 158.8 2008 Jan 224.4 31.8 -11.9 335.6 -55.9 -16.6 Feb 202.7 28.4 -9.7 426.7 -30.8 27.2 Mar 202.8 26.4 0.1 409.4 -44.6 -4.1 Apr 221.1 29.9 9.0 403.1 8.8 -1.6 May 229.6 33.9 3.8 254.8 73.2 -36.8 Jun 239.0 9.7 4.1 229.0 239.9 -10.1 Jul 242.3r 27.2 1.4 214.2 167.6 -6.5 Aug 214.1 21.5 -11.6 188.8 584.5 -11.9 Sep 228.5 5.5 6.7 235.2 637.7 24.6 -------------------------------------------------------------------------------------------- a/ - Subsector of Food Manufacturing

Table 1 (continued) ============================================================================================= | COCONUT PRODUCTS a/ | MISCELLANEOUS FOODS a/ Year/Month | Index | Year-on-Year | Month-on-Month | Index | Year-on-Year | Month-on-Month | | Growth Rates | Growth Rates | | Growth Rates | Growth Rates --------------------------------------------------------------------------------------------- 2007 141.0 11.0 108.2 18.1 Jan 123.2 45.9 7.8 87.7 -8.2 -7.4 Feb 151.8 26.6 23.2 93.4 12.6 6.5 Mar 148.6 2.3 -2.1 96.5 -12.2 3.3 Apr 143.3 38.1 -3.6 88.0 13.9 -8.8 May 173.9 14.9 21.3 110.7 24.3 25.8 Jun 151.1 9.7 -13.1 117.3 31.5 6.0 Jul 137.7 -5.2 -8.9 107.9 21.6 -8.0 Aug 143.2 8.7 4.0 111.8 29.7 3.6 Sep 122.1 -6.6 -14.8 101.7 14.9 -9.1 Oct 136.3 2.0 11.7 128.6 24.5 26.5 Nov 128.0 0.8 -6.1 133.0 41.5 3.4 Dec 132.8 16.1 3.8 121.7 28.5 -8.5 2008 Jan 154.2 25.2 16.2 108.7 24.0 -10.6 Feb 170.7 12.5 10.7 128.5 37.6 18.2 Mar 144.9 -2.5 -15.1 139.1 44.1 8.2 Apr 206.2 43.9 42.2 156.0 77.3 12.2 May 328.6 89.0 59.4 166.5 50.4 6.8 Jun 293.7 94.4 -10.6 155.0 32.2 -6.9 Jul 357.3r 159.5 21.6 175.8r 62.8 13.4 Aug 347.9r 142.9 -2.6 186.6r 66.8 6.2 Sep 327.7 168.5 -5.8 187.3 84.3 0.4 -------------------------------------------------------------------------------------------- a/ - Subsector of Food Manufacturing
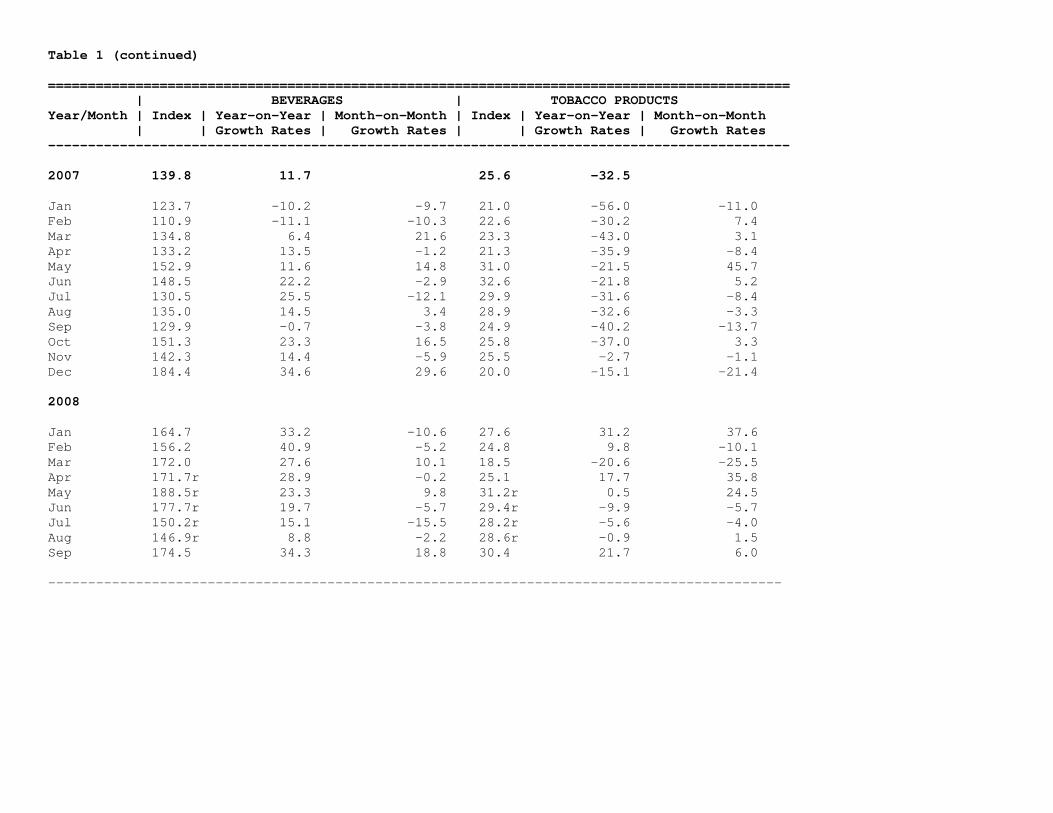
Table 1 (continued) ============================================================================================= | BEVERAGES | TOBACCO PRODUCTS Year/Month | Index | Year-on-Year | Month-on-Month | Index | Year-on-Year | Month-on-Month | | Growth Rates | Growth Rates | | Growth Rates | Growth Rates --------------------------------------------------------------------------------------------- 2007 139.8 11.7 25.6 -32.5 Jan 123.7 -10.2 -9.7 21.0 -56.0 -11.0 Feb 110.9 -11.1 -10.3 22.6 -30.2 7.4 Mar 134.8 6.4 21.6 23.3 -43.0 3.1 Apr 133.2 13.5 -1.2 21.3 -35.9 -8.4 May 152.9 11.6 14.8 31.0 -21.5 45.7 Jun 148.5 22.2 -2.9 32.6 -21.8 5.2 Jul 130.5 25.5 -12.1 29.9 -31.6 -8.4 Aug 135.0 14.5 3.4 28.9 -32.6 -3.3 Sep 129.9 -0.7 -3.8 24.9 -40.2 -13.7 Oct 151.3 23.3 16.5 25.8 -37.0 3.3 Nov 142.3 14.4 -5.9 25.5 -2.7 -1.1 Dec 184.4 34.6 29.6 20.0 -15.1 -21.4 2008 Jan 164.7 33.2 -10.6 27.6 31.2 37.6 Feb 156.2 40.9 -5.2 24.8 9.8 -10.1 Mar 172.0 27.6 10.1 18.5 -20.6 -25.5 Apr 171.7r 28.9 -0.2 25.1 17.7 35.8 May 188.5r 23.3 9.8 31.2r 0.5 24.5 Jun 177.7r 19.7 -5.7 29.4r -9.9 -5.7 Jul 150.2r 15.1 -15.5 28.2r -5.6 -4.0 Aug 146.9r 8.8 -2.2 28.6r -0.9 1.5 Sep 174.5 34.3 18.8 30.4 21.7 6.0 --------------------------------------------------------------------------------------------

Table 1 (continued) ============================================================================================ | TEXTILES | TEXTILE PRODUCTS b/ Year/Month | Index | Year-on-Year | Month-on-Month | Index | Year-on-Year | Month-on-Month | | Growth Rates | Growth Rates | | Growth Rates | Growth Rates -------------------------------------------------------------------------------------------- 2007 93.1 -37.6 88.0 -40.4 Jan 88.9 -48.2 7.0 83.9 -51.6 8.0 Feb 96.2 -45.6 8.2 91.0 -48.8 8.5 Mar 95.8 -49.5 -0.5 90.2 -52.7 -0.9 Apr 91.2 -52.9 -4.8 85.8 -56.1 -4.9 May 99.2 -48.0 8.7 94.0 -50.9 9.6 Jun 91.3 -49.1 -7.9 86.7 -51.8 -7.8 Jul 101.4 -22.7 11.1 96.3 -24.7 11.0 Aug 102.0 -19.9 0.5 96.9 -21.1 0.6 Sep 90.8 -26.1 -10.9 85.2 -29.5 -12.0 Oct 92.3 -21.8 1.6 87.1 -23.8 2.1 Nov 85.2 -18.5 -7.7 80.3 -19.8 -7.8 Dec 82.7 -0.6 -2.9 78.4 0.9 -2.3 2008 Jan 84.9 -4.5 2.7 79.1 -5.7 0.9 Feb 81.4 -15.4 -4.1 75.6 -17.0 -4.5 Mar 78.8 -17.7 -3.1 73.0 -19.1 -3.4 Apr 82.6 -9.5 4.7 76.9 -10.4 5.3 May 79.7 -19.6 -3.4 73.6 -21.8 -4.3 Jun 75.3 -17.5 -5.5 70.3 -18.9 -4.5 Jul 70.9 -30.1 -5.8 64.7 -32.8 -7.9 Aug 73.9r -27.5 4.1 67.0r -30.8 3.5 Sep 77.7 -14.4 5.2 71.1 -16.5 6.2 -------------------------------------------------------------------------------------------- b/ - Subsector of Textiles

Table 1 (continued) ============================================================================================ | CORDAGE, ROPE AND TWINE b/ | FOOTWEAR AND WEARING APPAREL Year/Month | Index | Year-on-Year | Month-on-Month | Index | Year-on-Year | Month-on-Month | | Growth Rates | Growth Rates | | Growth Rates | Growth Rates -------------------------------------------------------------------------------------------- 2007 178.2 3.4 95.1 -11.8 Jan 172.9 17.2 -0.4 101.9 21.8 -11.7 Feb 182.2 11.4 5.4 94.8 -11.6 -7.0 Mar 188.6 11.1 3.5 85.8 -24.8 -9.6 Apr 181.1 15.9 -4.0 86.3 -20.5 0.7 May 185.1 3.2 2.2 95.6 -9.1 10.8 Jun 168.5 -3.3 -9.0 97.8 -12.6 2.2 Jul 187.9 -0.1 11.5 106.1 -9.1 8.5 Aug 187.2 -7.3 -0.4 93.9 -14.6 -11.5 Sep 184.5 19.3 -1.4 102.9 -4.9 9.6 Oct 179.3 -0.7 -2.8 94.9 -14.8 -7.8 Nov 167.0 -6.8 -6.9 87.2 -13.6 -8.1 Dec 154.3 -11.1 -7.6 93.6 -18.9 7.4 2008 Jan 181.2 4.8 17.4 109.4 7.3 16.8 Feb 178.6 -2.0 -1.5 125.4 32.3 14.7 Mar 177.1 -6.1 -0.8 121.5 41.7 -3.2 Apr 177.9 -1.8 0.4 118.8 37.6 -2.2 May 182.6 -1.4 2.6 116.6 21.9 -1.8 Jun 159.8 -5.1 -12.4 114.4 17.0 -1.9 Jul 175.1 -6.8 9.5 124.5 17.3 8.8 Aug 188.9r 0.9 7.9 105.1r 12.0 -15.5 Sep 187.9 1.8 -0.6 103.9 0.9 -1.2 -------------------------------------------------------------------------------------------- b/ - Subsector of Textiles

Table 1 (continued) ============================================================================================ | LEATHER PRODUCTS | WOOD AND WOOD PRODUCTS Year/Month | Index | Year-on-Year | Month-on-Month | Index | Year-on-Year | Month-on-Month | | Growth Rates | Growth Rates | | Growth Rates | Growth Rates -------------------------------------------------------------------------------------------- 2007 4.9 11.0 61.8 4.0 Jan 4.0 -17.8 1.9 48.9 -12.3 -25.2 Feb 3.8 -21.5 -2.7 53.5 -1.4 9.5 Mar 3.9 -19.8 1.7 56.8 -14.7 6.0 Apr 3.9 -8.0 -0.1 56.2 -5.2 -1.0 May 4.3 -7.3 9.2 57.6 -5.7 2.4 Jun 5.0 12.8 16.8 69.2 15.8 20.1 Jul 5.6 21.0 13.2 69.3 15.7 0.3 Aug 5.9 36.1 4.6 72.5 7.2 4.5 Sep 6.1 43.5 3.4 69.2 18.5 -4.6 Oct 5.4 20.1 -12.1 68.2 29.9 -1.4 Nov 6.3 61.7 16.6 58.5 10.9 -14.2 Dec 5.1 30.5 -19.0 62.0 -5.1 5.9 2008 Jan 6.1 53.3 19.7 61.1 24.9 -1.5 Feb 5.6 46.3 -7.2 61.4 14.6 0.5 Mar 6.2 58.2 10.0 64.3 13.2 4.8 Apr 5.3 35.4 -14.5 68.3 21.5 6.2 May 5.9 38.5 11.7 77.3 34.3 13.2 Jun 6.2 24.5 5.0 75.8 9.5 -2.0 Jul 7.1 25.5 14.1 70.3 1.3 -7.2 Aug 5.9 -0.4 -17.1 76.7r 5.9 9.2 Sep 6.4 5.4 9.5 63.9 -7.5 -16.7 --------------------------------------------------------------------------------------------

Table 1 (continued) ============================================================================================ | PLANING AND SAWMILL c/ | VENEER AND PLYWOOD c/ Year/Month | Index | Year-on-Year | Month-on-Month | Index | Year-on-Year | Month-on-Month | | Growth Rates | Growth Rates | | Growth Rates | Growth Rates -------------------------------------------------------------------------------------------- 2007 81.2 -5.8 58.2 48.4 Jan 63.5 -17.0 -41.7 43.3 27.4 -4.9 Feb 62.2 -16.4 -2.1 53.4 65.0 23.2 Mar 60.3 -40.6 -3.0 56.8 60.2 6.4 Apr 61.8 -25.3 2.4 60.2 70.9 6.1 May 68.5 -28.0 10.8 55.7 67.5 -7.5 Jun 80.7 -6.8 17.9 67.6 72.7 21.3 Jul 97.6 30.2 20.9 61.2 48.9 -9.4 Aug 97.2 -2.3 -0.4 72.1 59.8 17.9 Sep 103.0 9.8 6.0 62.1 56.5 -13.9 Oct 103.2 39.6 0.2 62.3 45.0 0.4 Nov 74.0 9.8 -28.2 54.3 15.8 -12.9 Dec 102.9 -5.5 39.0 49.4 8.4 -9.0 2008 Jan 100.7 58.6 -2.1 43.7 0.8 -11.6 Feb 98.5 58.3 -2.2 48.2 -9.8 10.3 Mar 97.8 62.1 -0.7 47.7 -16.0 -0.9 Apr 109.9 77.9 12.4 55.1 -8.5 15.5 May 122.6 79.0 11.5 55.0 -1.3 -0.2 Jun 117.6 45.7 -4.0 58.4 -13.6 6.1 Jul 101.0 3.5 -14.1 59.4 -3.0 1.7 Aug 113.2 16.4 12.0 61.1r -15.3 2.9 Sep 82.2 -20.2 -27.4 63.7 2.6 4.2 -------------------------------------------------------------------------------------------- c/ - Subsector of Wood and Wood Products

Table 1 (continued) ============================================================================================ | OTHER WOOD PRODUCTS c/ | PAPER AND PAPER PRODUCTS Year/Month | Index | Year-on-Year | Month-on-Month | Index | Year-on-Year | Month-on-Month | | Growth Rates | Growth Rates | | Growth Rates | Growth Rates -------------------------------------------------------------------------------------------- 2007 44.4 -22.5 108.0 0.7 Jan 39.8 -36.8 -7.6 108.1 11.8 0.2 Feb 43.7 -30.2 9.7 100.7 -4.0 -6.9 Mar 52.7 -25.4 20.6 110.9 3.6 10.2 Apr 43.9 -34.1 -16.6 106.5 8.2 -4.0 May 47.5 -22.6 8.3 107.4 1.3 0.8 Jun 57.9 -0.3 21.9 112.0 -4.2 4.3 Jul 48.2 -30.9 -16.9 101.4 -8.6 -9.5 Aug 44.0 -29.8 -8.6 117.5 12.1 15.9 Sep 39.8 -9.4 -9.5 108.9 -1.3 -7.3 Oct 35.9 -13.0 -9.9 119.1 8.6 9.3 Nov 46.5 5.5 29.6 103.2 -8.8 -13.4 Dec 32.4 -24.8 -30.3 100.0 -7.3 -3.1 2008 Jan 39.8 2/ 22.8 119.9 10.9 19.9 Feb 37.1 -15.0 -6.8 102.3 1.6 -14.7 Mar 49.2 -6.6 32.5 104.4 -5.9 2.1 Apr 38.7 -11.8 -21.3 103.5 -2.8 -0.8 May 56.8 19.4 46.6 111.1 3.5 7.3 Jun 51.9 -10.3 -8.5 107.4r -4.1 -3.3 Jul 50.1 4.1 -3.5 106.2r 4.7 -1.1 Aug 56.7 28.8 13.1 103.1r -12.3 -2.9 Sep 42.9 7.8 -24.3 118.1 8.4 14.5 -------------------------------------------------------------------------------------------- c/ - Subsector of Wood and Wood Products 2/ - less than 0.1 percent decrease

Table 1 (continued) ============================================================================================ | PUBLISHING AND PRINTING | PETROLEUM PRODUCTS Year/Month | Index | Year-on-Year | Month-on-Month | Index | Year-on-Year | Month-on-Month | | Growth Rates | Growth Rates | | Growth Rates | Growth Rates -------------------------------------------------------------------------------------------- 2007 138.3 7.0 153.6 -0.8 Jan 134.8 4.9 -5.7 159.2 -5.4 -8.1 Feb 137.1 12.5 1.7 79.5 -49.4 -50.1 Mar 145.3 14.0 6.0 112.3 -3.2 41.3 Apr 126.9 12.3 -12.7 171.9 2.1 53.1 May 138.5 8.9 9.2 165.1 -6.3 -4.0 Jun 157.0 23.4 13.4 161.7 -11.7 -2.1 Jul 153.1 15.2 -2.5 170.4 10.4 5.4 Aug 120.6 -7.7 -21.2 165.5 4.9 -2.9 Sep 145.4 14.5 20.6 147.4 6.7 -10.9 Oct 135.9 0.2 -6.6 158.5 29.4 7.5 Nov 123.3 -9.9 -9.3 162.8 14.1 2.7 Dec 141.2 -1.2 14.5 188.4 8.8 15.7 2008 Jan 129.7 -3.7 -8.2 148.7 -6.6 -21.1 Feb 138.1 0.8 6.5 140.8 77.2 -5.3 Mar 125.2 -13.8 -9.4 120.9 7.6 -14.2 Apr 116.4 -8.3 -7.1 164.7 -4.2 36.2 May 143.4 3.5 23.2 172.7 4.6 4.9 Jun 156.6r -0.3 9.2 192.9 19.3 11.7 Jul 144.6r -5.6 -7.7 216.4 26.9 12.2 Aug 125.2r 3.8 -13.4 225.6 36.4 4.3 Sep 122.1 -16.1 -2.5 286.1 94.0 26.8 --------------------------------------------------------------------------------------------

Table 1 (continued) ============================================================================================ | REFINED PETROLEUM PRODUCTS d/ | COKE AND OTHER FUEL PRODUCTS d/ Year/Month | Index | Year-on-Year | Month-on-Month | Index | Year-on-Year | Month-on-Month | | Growth Rates | Growth Rates | | Growth Rates | Growth Rates -------------------------------------------------------------------------------------------- 2007 154.2 -0.8 54.9 18.9 Jan 159.8 -5.5 -8.1 60.4 72.8 28.7 Feb 79.6 -49.5 -50.2 58.2 33.6 -3.6 Mar 112.8 -3.3 41.6 45.4 8.3 -22.0 Apr 172.6 2.0 53.1 63.4 79.4 39.6 May 165.7 -6.4 -4.0 63.5 62.6 0.1 Jun 162.4 -11.7 -2.0 42.8 10.9 -32.5 Jul 171.1 10.5 5.4 60.0 -2.7 40.1 Aug 166.2 5.0 -2.9 52.2 -3.6 -12.9 Sep 148.0 6.7 -10.9 57.3 7.4 9.7 Oct 159.2 29.4 7.6 50.6 21.1 -11.7 Nov 163.4 14.1 2.6 68.4 9.4 35.2 Dec 189.3 8.9 15.9 36.4 -22.4 -46.8 2008 Jan 149.2 -6.6 -21.2 55.8 -7.6 53.2 Feb 141.4 77.6 -5.3 51.6 -11.4 -7.6 Mar 121.3 7.6 -14.2 46.4 2.3 -9.9 Apr 165.3 -4.2 36.2 61.1 -3.6 31.6 May 173.5 4.7 4.9 46.0 -27.6 -24.8 Jun 193.8 19.3 11.7 49.3 15.1 7.2 Jul 217.4 27.0 12.2 53.6 -10.5 8.9 Aug 226.7 36.4 4.3 51.2 -2.0 -4.6 Sep 287.5 94.2 26.8 62.0 8.3 21.2 -------------------------------------------------------------------------------------------- d/ - Subsector of Petroleum Products

Table 1 (continued) =========================================================================================================== | CHEMICAL PRODUCTS (including plastic products | CHEMICAL PRODUCTS (excluding plastic products Year/Month | Index | Year-on-Year | Month-on-Month | Index | Year-on-Year | Month-on-Month | | Growth Rates | Growth Rates | | Growth Rates | Growth Rates ----------------------------------------------------------------------------------------------------------- 2007 138.0 -6.0 150.5 -6.2 Jan 117.6 -12.0 -25.3 125.2 -8.4 -29.8 Feb 122.8 -8.5 4.5 132.7 -4.9 6.0 Mar 139.2 -11.5 13.4 151.7 -7.8 14.3 Apr 133.0 -6.3 -4.5 147.2 -6.3 -3.0 May 139.0 -1.3 4.5 152.3 -0.6 3.5 Jun 155.9 8.2 12.1 172.4 8.1 13.2 Jul 136.4 -12.3 -12.5 147.3 -14.3 -14.5 Aug 156.3 -3.0 14.6 173.5 -3.5 17.8 Sep 145.7 19.6 -6.7 159.7 21.8 -8.0 Oct 131.4 -13.9 -9.9 139.6 -17.7 -12.6 Nov 139.1 -14.0 5.9 152.0 -17.3 8.9 Dec 139.8 -11.1 0.5 152.5 -14.5 0.3 2008 Jan 138.4 10.6 -9.2 Feb 144.9 9.2 4.7 Mar 153.7 1.4 6.1 Apr 165.4 12.4 7.6 May 172.5 13.2 4.3 Jun 209.0 21.2 21.1 Jul 159.7r 8.4 -23.6 Aug 151.0r -13.0 -5.4 Sep 174.1 9.1 15.3 ----------------------------------------------------------------------------------------------------------

Table 1 (continued) ============================================================================================ | BASIC CHEMICALS AND INDL GASES e/ | FERTILIZERS e/ Year/Month | Index | Year-on-Year | Month-on-Month | Index | Year-on-Year | Month-on-Month | | Growth Rates | Growth Rates | | Growth Rates | Growth Rates -------------------------------------------------------------------------------------------- 2007 177.9 -29.7 120.9 -8.8 Jan 195.1 -6.5 -49.3 60.2 -23.5 49.9 Feb 152.1 -32.5 -22.0 122.0 1.5 102.7 Mar 186.9 -29.4 22.9 97.6 -47.3 -20.0 Apr 188.0 -27.4 0.6 131.8 -23.4 35.0 May 192.6 -22.7 2.5 127.0 -19.5 -3.7 Jun 194.1 -18.0 0.7 148.2 8.7 16.7 Jul 187.1 -23.2 -3.6 128.9 -46.2 -13.0 Aug 181.6 -19.1 -2.9 145.1 -12.1 12.5 Sep 175.6 37.8 -3.3 150.3 127.1 3.6 Oct 113.6 -56.1 -35.3 125.8 -2.3 -16.3 Nov 169.9 -51.9 49.5 107.8 6.1 -14.3 Dec 198.5 -48.5 16.8 105.8 163.7 -1.8 2008 Jan 197.1 1.0 -0.7 142.1 136.1 34.2 Feb 200.6 31.9 1.8 118.4 -2.9 -16.7 Mar 206.2 10.3 2.8 119.3 22.2 0.8 Apr 204.1 8.6 -1.0 181.3 37.6 52.0 May 195.4 1.4 -4.3 229.9 81.1 26.8 Jun 184.5 -4.9 -5.6 213.6 44.2 -7.1 Jul 234.7r 25.4 27.2 150.2 16.5 -29.7 Aug 114.1r -37.2 -51.4 169.2r 16.7 12.7 Sep 207.5 18.2 81.9 250.5 66.7 48.0 -------------------------------------------------------------------------------------------- e/ - Subsector of Chemical Products (excluding plastic products)

Table 1 (continued) ============================================================================================ | PAINTS e/ | DRUGS AND MEDICINES e/ Year/Month | Index | Year-on-Year | Month-on-Month | Index | Year-on-Year | Month-on-Month | | Growth Rates | Growth Rates | | Growth Rates | Growth Rates -------------------------------------------------------------------------------------------- 2007 168.8 11.3 150.1 -4.0 Jan 167.0 10.8 19.2 86.1 -17.1 -62.4 Feb 160.6 3.3 -3.8 134.1 28.1 55.7 Mar 177.5 26.4 10.5 159.0 1.5 18.6 Apr 168.2 16.4 -5.3 128.8 -13.5 -19.0 May 189.1 6.3 12.4 121.5 5.8 -5.7 Jun 188.3 10.8 -0.4 191.1 23.4 57.3 Jul 173.8 2.6 -7.7 112.6 -30.6 -41.1 Aug 152.4 25.8 -12.3 224.9 54.5 99.7 Sep 162.2 16.9 6.4 177.8 8.0 -20.9 Oct 173.2 13.2 6.8 138.3 -23.9 -22.2 Nov 161.8 2.1 -6.6 150.1 -28.1 8.5 Dec 152.0 8.5 -6.0 176.9 -22.8 17.9 2008 Jan 177.1 6.0 16.5 104.8 21.7 -40.8 Feb 170.9 6.4 -3.5 146.7 9.4 39.9 Mar 170.5 -4.0 -0.2 166.9 5.0 13.8 Apr 206.4 22.7 21.0 140.6 9.2 -15.8 May 212.8 12.5 3.1 156.4 28.7 11.2 Jun 198.2 5.2 -6.9 182.0 -4.7 16.4 Jul 195.7 12.6 -1.3 105.8 -6.0 -41.9 Aug 163.9 7.6 -16.2 188.0r -16.4 77.6 Sep 165.1 1.8 0.7 212.5 19.6 13.0 -------------------------------------------------------------------------------------------- e/ - Subsector of Chemical Products (excluding plastic products)

Table 1 (continued) ============================================================================================ | COSMETIC AND TOILET PREPARATIONS e/| MISCELLANEOUS CHEMICALS e/ Year/Month | Index | Year-on-Year | Month-on-Month | Index | Year-on-Year | Month-on-Month | | Growth Rates | Growth Rates | | Growth Rates | Growth Rates -------------------------------------------------------------------------------------------- 2007 150.9 7.0 115.1 -19.5 Jan 137.3 -1.0 24.6 107.0 -31.7 -20.7 Feb 124.9 -6.0 -9.1 117.1 -22.3 9.5 Mar 146.1 7.9 17.0 119.9 -26.4 2.4 Apr 152.3 13.3 4.3 114.3 -4.3 -4.6 May 166.6 13.7 9.3 116.0 -12.9 1.5 Jun 164.9 14.8 -1.0 115.7 -12.0 -0.2 Jul 160.6 11.1 -2.6 131.5 -14.8 13.7 Aug 156.4 -26.0 -2.6 108.6 -23.3 -17.5 Sep 151.9 29.3 -2.9 114.3 -15.6 5.3 Oct 151.3 6.0 -0.4 116.2 -25.8 1.7 Nov 161.3 19.5 6.6 116.9 -16.4 0.6 Dec 137.6 24.8 -14.7 104.2 -22.7 -10.8 2008 Jan 137.9 0.4 0.2 121.5 13.6 16.6 Feb 131.9 5.6 -4.4 107.9 -7.8 -11.2 Mar 141.0 -3.4 6.9 97.3 -18.9 -9.9 Apr 169.5 11.3 20.2 117.7 3.0 21.1 May 170.3 2.2 0.4 115.4 -0.5 -2.0 Jun 257.2 55.9 51.0 125.1 8.1 8.4 Jul 171.3r 6.7 -33.4 142.7 8.5 14.1 Aug 138.4r -11.5 -19.2 117.6 8.3 -17.6 Sep 132.2 -13.0 -4.5 123.9 8.4 5.3 -------------------------------------------------------------------------------------------- e/ - Subsector of Chemical Products (excluding plastic products)

Table 1 (continued) ============================================================================================ | RUBBER AND PLASTIC PRODUCTS | RUBBER PRODUCTS f/ Year/Month | Index | Year-on-Year | Month-on-Month | Index | Year-on-Year | Month-on-Month | | Growth Rates | Growth Rates | | Growth Rates | Growth Rates -------------------------------------------------------------------------------------------- 2007 108.1 -4.8 153.0 -4.3 Jan 114.5 -15.2 18.4 191.7 10.4 38.6 Feb 101.2 -19.3 -11.6 143.0 -8.2 -25.4 Mar 111.2 -21.7 9.9 162.0 -7.6 13.2 Apr 97.5 -4.1 -12.3 143.9 0.4 -11.2 May 105.2 -2.5 7.9 147.0 3.1 2.2 Jun 112.9 7.8 7.3 161.5 6.1 9.9 Jul 110.7 -5.2 -1.9 151.6 -14.0 -6.1 Aug 110.1 -4.8 -0.6 156.1 -13.8 3.0 Sep 109.0 3.6 -1.0 148.2 -5.0 -5.1 Oct 115.9 5.2 6.3 159.9 -5.2 7.9 Nov 103.4 2.5 -10.7 134.5 -13.0 -15.9 Dec 105.2 8.8 1.7 136.5 -1.3 1.5 2008 Jan 107.3 -6.2 2.0 147.1 -23.3 7.7 Feb 112.7 11.4 5.0 148.6 3.9 1.0 Mar 116.1 4.4 3.1 149.9 -7.5 0.9 Apr 120.0 23.1 3.4 152.2 5.8 1.5 May 123.7 17.6 3.1 167.1 13.6 9.8 Jun 125.2 10.9 1.2 165.8 2.6 -0.8 Jul 134.6r 21.6 7.5 199.9r 31.8 20.5 Aug 124.7r 13.3 -7.4 177.8r 13.9 -11.0 Sep 122.3 12.2 -2.0 156.1 5.3 -12.2 -------------------------------------------------------------------------------------------- f/ - Subsector of Rubber and Plastic Products
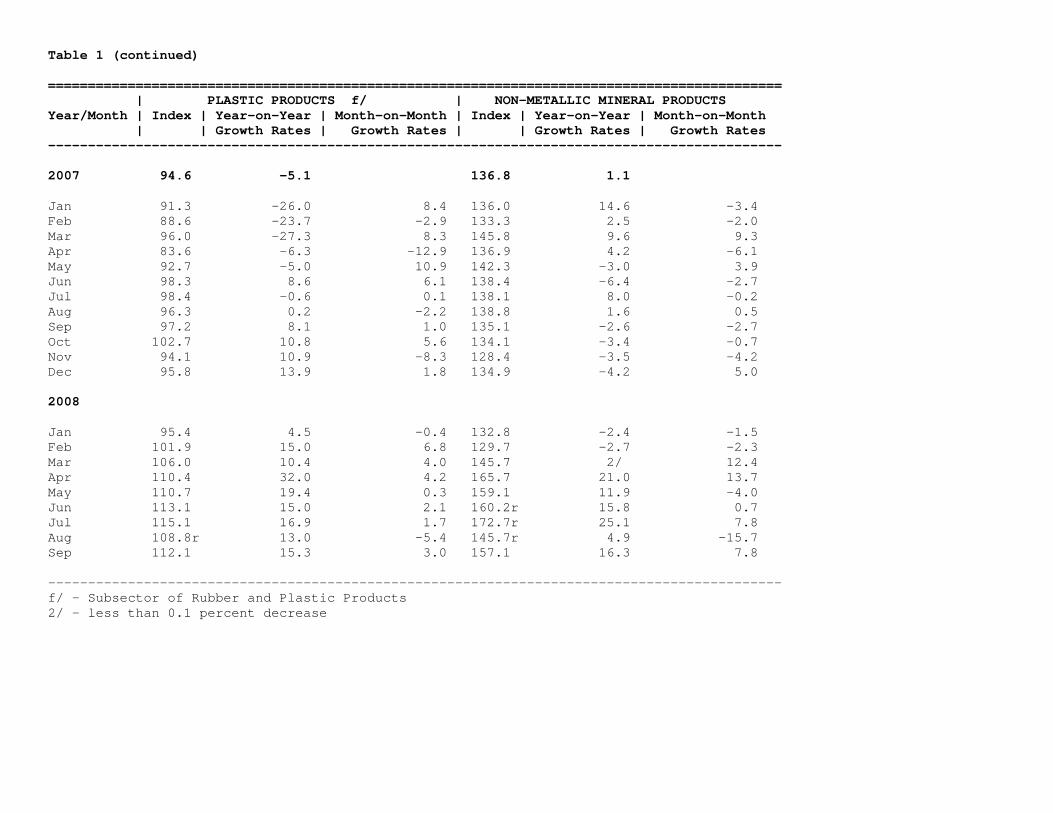
Table 1 (continued) ============================================================================================ | PLASTIC PRODUCTS f/ | NON-METALLIC MINERAL PRODUCTS Year/Month | Index | Year-on-Year | Month-on-Month | Index | Year-on-Year | Month-on-Month | | Growth Rates | Growth Rates | | Growth Rates | Growth Rates -------------------------------------------------------------------------------------------- 2007 94.6 -5.1 136.8 1.1 Jan 91.3 -26.0 8.4 136.0 14.6 -3.4 Feb 88.6 -23.7 -2.9 133.3 2.5 -2.0 Mar 96.0 -27.3 8.3 145.8 9.6 9.3 Apr 83.6 -6.3 -12.9 136.9 4.2 -6.1 May 92.7 -5.0 10.9 142.3 -3.0 3.9 Jun 98.3 8.6 6.1 138.4 -6.4 -2.7 Jul 98.4 -0.6 0.1 138.1 8.0 -0.2 Aug 96.3 0.2 -2.2 138.8 1.6 0.5 Sep 97.2 8.1 1.0 135.1 -2.6 -2.7 Oct 102.7 10.8 5.6 134.1 -3.4 -0.7 Nov 94.1 10.9 -8.3 128.4 -3.5 -4.2 Dec 95.8 13.9 1.8 134.9 -4.2 5.0 2008 Jan 95.4 4.5 -0.4 132.8 -2.4 -1.5 Feb 101.9 15.0 6.8 129.7 -2.7 -2.3 Mar 106.0 10.4 4.0 145.7 2/ 12.4 Apr 110.4 32.0 4.2 165.7 21.0 13.7 May 110.7 19.4 0.3 159.1 11.9 -4.0 Jun 113.1 15.0 2.1 160.2r 15.8 0.7 Jul 115.1 16.9 1.7 172.7r 25.1 7.8 Aug 108.8r 13.0 -5.4 145.7r 4.9 -15.7 Sep 112.1 15.3 3.0 157.1 16.3 7.8 -------------------------------------------------------------------------------------------- f/ - Subsector of Rubber and Plastic Products 2/ - less than 0.1 percent decrease
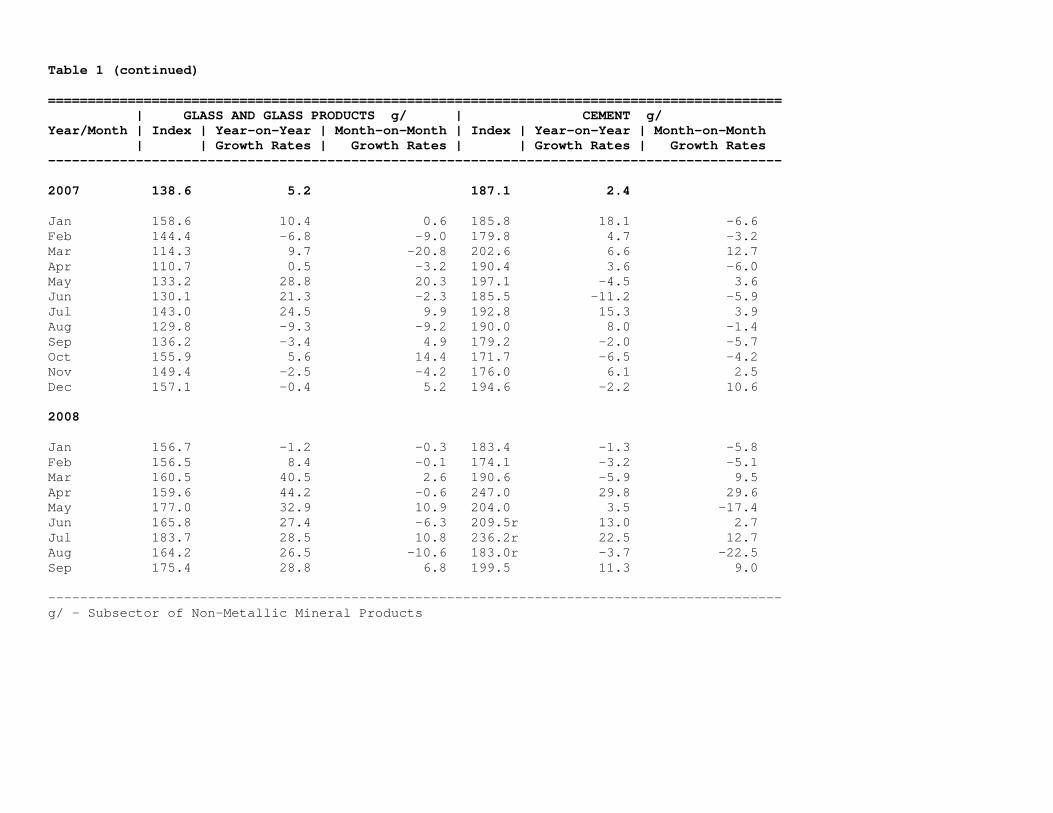
Table 1 (continued) ============================================================================================ | GLASS AND GLASS PRODUCTS g/ | CEMENT g/ Year/Month | Index | Year-on-Year | Month-on-Month | Index | Year-on-Year | Month-on-Month | | Growth Rates | Growth Rates | | Growth Rates | Growth Rates -------------------------------------------------------------------------------------------- 2007 138.6 5.2 187.1 2.4 Jan 158.6 10.4 0.6 185.8 18.1 -6.6 Feb 144.4 -6.8 -9.0 179.8 4.7 -3.2 Mar 114.3 9.7 -20.8 202.6 6.6 12.7 Apr 110.7 0.5 -3.2 190.4 3.6 -6.0 May 133.2 28.8 20.3 197.1 -4.5 3.6 Jun 130.1 21.3 -2.3 185.5 -11.2 -5.9 Jul 143.0 24.5 9.9 192.8 15.3 3.9 Aug 129.8 -9.3 -9.2 190.0 8.0 -1.4 Sep 136.2 -3.4 4.9 179.2 -2.0 -5.7 Oct 155.9 5.6 14.4 171.7 -6.5 -4.2 Nov 149.4 -2.5 -4.2 176.0 6.1 2.5 Dec 157.1 -0.4 5.2 194.6 -2.2 10.6 2008 Jan 156.7 -1.2 -0.3 183.4 -1.3 -5.8 Feb 156.5 8.4 -0.1 174.1 -3.2 -5.1 Mar 160.5 40.5 2.6 190.6 -5.9 9.5 Apr 159.6 44.2 -0.6 247.0 29.8 29.6 May 177.0 32.9 10.9 204.0 3.5 -17.4 Jun 165.8 27.4 -6.3 209.5r 13.0 2.7 Jul 183.7 28.5 10.8 236.2r 22.5 12.7 Aug 164.2 26.5 -10.6 183.0r -3.7 -22.5 Sep 175.4 28.8 6.8 199.5 11.3 9.0 -------------------------------------------------------------------------------------------- g/ - Subsector of Non-Metallic Mineral Products

Table 1 (continued) ============================================================================================ | MISC. NON-METALLIC MINERALS g/ | BASIC METALS Year/Month | Index | Year-on-Year | Month-on-Month | Index | Year-on-Year | Month-on-Month | | Growth Rates | Growth Rates | | Growth Rates | Growth Rates -------------------------------------------------------------------------------------------- 2007 65.3 -6.7 217.0 -8.0 Jan 56.3 4.8 8.7 197.6 21.0 -10.3 Feb 63.2 3.9 12.2 204.1 5.8 3.3 Mar 79.1 22.4 25.1 244.4 9.2 19.8 Apr 72.8 9.1 -7.9 199.0 -9.1 -18.6 May 68.8 -15.1 -5.5 218.7 -21.2 9.9 Jun 75.5 -4.3 9.7 191.3 -26.8 -12.5 Jul 59.1 -24.1 -21.7 233.8 -16.4 22.2 Aug 70.6 -10.2 19.4 243.9 -3.0 4.3 Sep 72.5 -4.0 2.7 201.9 -20.6 -17.2 Oct 71.8 0.0 -0.9 236.6 4.5 17.2 Nov 52.5 -33.1 -26.9 220.8 -15.2 -6.7 Dec 41.3 -20.4 -21.4 212.1 -3.8 -3.9 2008 Jan 51.4 -8.8 24.5 217.0 9.8 2.3 Feb 55.8 -11.6 8.7 236.8 16.0 9.1 Mar 76.3 -3.5 36.6 264.6 8.3 11.8 Apr 53.8 -26.1 -29.5 258.5 29.9 -2.3 May 88.4 28.5 64.4 305.4 39.7 18.1 Jun 88.5 17.1 0.0 264.3 38.2 -13.4 Jul 78.7r 33.2 -11.0 330.7 41.4 25.1 Aug 85.2r 20.8 8.3 290.0r 18.9 -12.3 Sep 89.7 23.8 5.2 231.6 14.7 -20.2 -------------------------------------------------------------------------------------------- g/ - Subsector of Non-Metallic Mineral Products

Table 1 (continued) ============================================================================================ | IRON AND STEEL h/ | NON-FERROUS METALS h/ Year/Month | Index | Year-on-Year | Month-on-Month | Index | Year-on-Year | Month-on-Month | | Growth Rates | Growth Rates | | Growth Rates | Growth Rates -------------------------------------------------------------------------------------------- 2007 166.7 5.4 336.9 -20.0 Jan 146.8 33.5 9.6 318.8 9.7 -25.2 Feb 171.4 23.2 16.8 281.9 -12.2 -11.6 Mar 201.3 17.4 17.4 347.1 -0.5 23.1 Apr 139.3 -2.3 -30.8 341.3 -14.8 -1.7 May 164.5 -10.4 18.0 347.8 -30.7 1.9 Jun 163.4 -10.6 -0.6 257.7 -42.6 -25.9 Jul 159.6 -7.9 -2.3 410.6 -23.0 59.3 Aug 196.7 12.9 23.2 356.3 -18.2 -13.2 Sep 148.0 -10.9 -24.8 330.5 -29.0 -7.2 Oct 174.4 28.6 17.9 384.8 -13.1 16.4 Nov 164.5 -11.1 -5.7 354.8 -19.4 -7.8 Dec 170.5 27.3 3.6 311.3 -27.0 -12.2 2008 Jan 168.4 14.7 -1.2 332.7 4.4 6.9 Feb 181.2 5.7 7.6 369.2 31.0 11.0 Mar 220.4 9.5 21.6 370.0 6.6 0.2 Apr 188.7 35.4 -14.4 424.8 24.5 14.8 May 258.7 57.3 37.1 416.7 19.8 -1.9 Jun 195.1 19.4 -24.6 429.3 66.6 3.0 Jul 252.7 58.3 29.5 516.6 25.8 20.3 Aug 222.6r 13.2 -11.9 450.7 26.5 -12.8 Sep 178.9 20.9 -19.7 357.2 8.1 -20.7 -------------------------------------------------------------------------------------------- h/ - Subsector of Basic Metals

Table 1 (continued) ============================================================================================ | FABRICATED METAL PRODUCTS | MACHINERY EXCEPT ELECTRICAL Year/Month | Index | Year-on-Year | Month-on-Month | Index | Year-on-Year | Month-on-Month | | Growth Rates | Growth Rates | | Growth Rates | Growth Rates -------------------------------------------------------------------------------------------- 2007 279.6 6.4 68.9 -8.3 Jan 230.7 1.1 -1.6 67.7 -17.7 0.1 Feb 258.4 3.4 12.0 64.7 -18.4 -4.4 Mar 288.6 -4.0 11.7 69.6 -20.1 7.5 Apr 260.3 12.1 -9.8 65.5 -11.7 -5.9 May 294.3 6.7 13.0 63.7 -15.4 -2.8 Jun 304.9 8.5 3.6 67.5 -10.9 6.0 Jul 295.9 11.5 -3.0 68.5 -16.8 1.5 Aug 318.5 21.0 7.7 69.5 -2.2 1.5 Sep 256.4 3.9 -19.5 70.3 3.4 1.2 Oct 294.2 10.2 14.8 80.5 16.3 14.5 Nov 306.0 -0.7 4.0 70.7 2.5 -12.2 Dec 246.9 5.3 -19.3 68.7 1.5 -2.8 2008 Jan 284.4 23.3 15.2 41.2 -39.2 -40.0 Feb 259.4 0.4 -8.8 36.5 -43.7 -11.5 Mar 252.4 -12.5 -2.7 36.7 -47.2 0.7 Apr 278.7 7.1 10.4 37.7 -42.5 2.5 May 283.9 -3.5 1.8 42.9 -32.7 13.9 Jun 287.7 -5.6 1.4 36.1 -46.4 -15.7 Jul 309.5r 4.6 7.6 39.8 -41.8 10.2 Aug 326.5r 2.5 5.5 36.9r -46.8 -7.2 Sep 354.7 38.4 8.7 42.4 -39.7 14.7 --------------------------------------------------------------------------------------------

Table 1 (continued) ================================================================================================== | MACHINERY AND EQUIPMENT N.E.C. i/ | OFFICE,ACCOUNTING AND COMPUTING MACHINERY i/ Year/Month | Index | Year-on-Year | Month-on-Month | Index | Year-on-Year | Month-on-Month | | Growth Rates | Growth Rates | | Growth Rates | Growth Rates -------------------------------------------------------------------------------------------------- 2007 121.4 15.8 54.0 -18.9 Jan 110.7 15.8 -3.1 55.5 -29.2 1.9 Feb 106.7 16.2 -3.6 52.9 -30.3 -4.8 Mar 127.5 10.3 19.6 53.2 -32.7 0.5 Apr 120.9 29.7 -5.2 49.8 -27.6 -6.3 May 116.3 17.2 -3.8 48.8 -28.8 -2.1 Jun 122.1 23.3 4.9 52.0 -24.8 6.7 Jul 122.5 12.6 0.3 53.2 -28.9 2.2 Aug 125.3 18.1 2.3 53.7 -12.2 1.0 Sep 117.2 4.1 -6.4 57.0 3.0 6.2 Oct 151.3 36.9 29.1 60.5 5.1 6.0 Nov 119.4 6.8 -21.1 56.9 0.2 -5.9 Dec 117.0 2.5 -2.0 55.0 0.9 -3.3 2008 Jan 97.0 -12.4 -17.1 25.4 -54.3 -53.8 Feb 75.0 -29.7 -22.7 25.6 -51.6 0.7 Mar 99.8 -21.8 33.0 18.9 -64.5 -26.1 Apr 94.2 -22.1 -5.6 21.6 -56.5 14.6 May 113.3 -2.7 20.2 22.9 -52.9 6.0 Jun 106.2 -13.0 -6.3 16.3 -68.7 -28.9 Jul 92.8 -24.2 -12.6 24.8 -53.3 52.1 Aug 98.1r -21.7 5.7 19.6 -63.5 -20.9 Sep 97.5 -16.8 -0.6 26.8 -53.0 36.5 ------------------------------------------------------------------------------------------------- i/ - Subsector of Machinery Except Electrical

Table 1 (continued) ============================================================================================ | ELECTRICAL MACHINERY | ELECTRICAL APPLIANCES j/ Year/Month | Index | Year-on-Year | Month-on-Month | Index | Year-on-Year | Month-on-Month | | Growth Rates | Growth Rates | | Growth Rates | Growth Rates -------------------------------------------------------------------------------------------- 2007 115.5 -11.5 83.9 -13.4 Jan 121.5 -3.5 3.5 85.4 -13.5 6.7 Feb 108.5 -5.8 -10.7 81.2 -18.3 -4.8 Mar 119.8 -13.1 10.4 87.7 -19.7 8.0 Apr 112.6 -4.3 -6.0 75.8 -15.0 -13.5 May 111.6 -13.0 -0.9 83.6 -15.0 10.3 Jun 116.6 -5.9 4.5 96.5 -8.8 15.4 Jul 123.1 -6.5 5.6 90.4 -4.4 -6.4 Aug 107.3 -20.9 -12.9 84.5 -15.8 -6.5 Sep 123.2 -22.9 14.9 84.3 -7.7 -0.2 Oct 114.0 -20.8 -7.5 80.1 -18.5 -5.0 Nov 113.9 -12.1 -0.1 77.2 -20.6 -3.7 Dec 113.9 -3.0 0.0 80.6 0.7 4.5 2008 Jan 117.6 -3.2 3.2 87.9 3.0 9.1 Feb 105.8 -2.5 -10.0 85.3 5.0 -3.0 Mar 104.1 -13.1 -1.6 86.5 -1.4 1.5 Apr 105.6 -6.2 1.4 92.6 22.1 7.1 May 113.0 1.3 7.0 87.4r 4.5 -5.6 Jun 114.9 -1.5 1.7 73.9r -23.4 -15.4 Jul 124.1r 0.8 8.0 89.8r -0.7 21.4 Aug 121.1r 12.9 -2.4 81.2 -3.9 -9.5 Sep 121.2 -1.7 0.1 70.7 -16.2 -13.0 -------------------------------------------------------------------------------------------- j/ - Subsector of Electrical Machinery

Table 1 (continued) ============================================================================================ | WIRES AND WIRINGS j/ | BATTERIES j/ Year/Month | Index | Year-on-Year | Month-on-Month | Index | Year-on-Year | Month-on-Month | | Growth Rates | Growth Rates | | Growth Rates | Growth Rates -------------------------------------------------------------------------------------------- 2007 116.5 1.6 72.0 -5.0 Jan 118.9 19.4 2.0 85.4 24.7 15.9 Feb 114.8 10.0 -3.5 82.6 22.6 -3.3 Mar 124.0 10.4 8.1 88.9 -5.1 7.7 Apr 98.7 4.7 -20.4 61.1 37.6 -31.2 May 113.4 7.7 14.9 77.9 55.3 27.4 Jun 125.0 7.3 10.2 51.5 -18.8 -33.8 Jul 125.5 1.7 0.4 76.0 -5.7 47.6 Aug 137.7 2.1 9.7 73.0 -21.0 -4.0 Sep 137.8 5.7 0.1 81.1 0.6 11.1 Oct 111.2 -7.7 -19.3 74.5 -0.5 -8.1 Nov 100.4 -14.6 -9.7 63.6 -46.5 -14.7 Dec 90.4 -22.4 -9.9 47.9 -34.9 -24.6 2008 Jan 101.3 -14.8 12.0 62.3 -27.1 29.9 Feb 116.2 1.2 14.7 69.1 -16.3 11.0 Mar 111.3 -10.3 -4.2 51.4 -42.2 -25.7 Apr 109.8 11.2 -1.3 58.9 -3.7 14.6 May 110.3 -2.7 0.5 63.7 -18.2 8.3 Jun 124.0 -0.8 12.4 55.5 7.8 -12.8 Jul 123.6 -1.5 -0.3 63.0 -17.2 13.4 Aug 119.4r -13.2 -3.4 64.3 -11.8 2.2 Sep 116.4 -15.5 -2.5 56.2 -30.6 -12.6 -------------------------------------------------------------------------------------------- j/ - Subsector of Electrical Machinery

Table 1 (continued) ============================================================================================ | LAMPS AND FIXTURES j/ | MICROCIRCUITS j/ Year/Month | Index | Year-on-Year | Month-on-Month | Index | Year-on-Year | Month-on-Month | | Growth Rates | Growth Rates | | Growth Rates | Growth Rates -------------------------------------------------------------------------------------------- 2007 96.2 20.0 130.6 -13.9 Jan 91.1 17.7 6.0 139.6 -3.8 2.5 Feb 89.5 12.8 -1.8 121.2 -4.9 -13.2 Mar 92.6 12.5 3.5 135.5 -14.3 11.8 Apr 92.1 45.5 -0.6 130.8 -5.4 -3.5 May 96.0 16.6 4.3 124.6 -16.1 -4.7 Jun 104.7 31.5 9.0 126.8 -8.3 1.8 Jul 96.7 41.1 -7.6 139.6 -10.0 10.1 Aug 97.4 36.1 0.7 115.9 -26.5 -16.9 Sep 99.1 28.7 1.7 140.8 -29.4 21.5 Oct 102.6 5.3 3.6 129.0 -24.0 -8.4 Nov 97.4 0.9 -5.1 131.5 -10.3 1.9 Dec 94.8 10.4 -2.6 131.6 -3.4 0.1 2008 Jan 128.8 41.4 35.8 129.4 -7.3 -1.7 Feb 134.8 50.7 4.7 110.0 -9.2 -15.0 Mar 116.2 25.4 -13.9 110.0 -18.8 1/1 Apr 121.4 31.9 4.5 109.3 -16.4 -0.6 May 125.5 30.8 3.4 122.2 -1.9 11.8 Jun 132.1 26.3 5.2 128.7 1.5 5.3 Jul 135.9 40.5 2.8 136.8r -2.0 6.3 Aug 128.6 32.0 -5.3 136.3r 17.5 -0.4 Sep 127.6 28.8 -0.8 140.8 0.0 3.3 -------------------------------------------------------------------------------------------- j/ - Subsector of Electrical Machinery 1/ - less than 0.1 percent increase

Table 1 (continued) ============================================================================================ | TRANSPORT EQUIPMENT | FURNITURE AND FIXTURES Year/Month | Index | Year-on-Year | Month-on-Month | Index | Year-on-Year | Month-on-Month | | Growth Rates | Growth Rates | | Growth Rates | Growth Rates -------------------------------------------------------------------------------------------- 2007 133.1 7.5 164.8 -4.2 Jan 129.6 5.4 16.1 178.6 29.0 -4.4 Feb 129.1 8.2 -0.4 185.8 19.9 4.0 Mar 132.2 5.0 2.5 209.7 5.6 12.9 Apr 108.9 13.8 -17.7 161.8 -6.1 -22.9 May 132.3 4.0 21.5 156.8 3.1 -3.1 Jun 127.6 -2.6 -3.5 165.7 -14.8 5.7 Jul 146.3 13.5 14.6 160.9 -9.4 -3.0 Aug 152.3 11.6 4.1 160.2 -9.2 -0.4 Sep 145.7 8.1 -4.3 149.8 -14.0 -6.5 Oct 154.9 21.4 6.3 147.0 -12.1 -1.9 Nov 126.5 1.3 -18.3 149.8 -12.2 1.9 Dec 112.1 0.4 -11.4 151.7 -18.8 1.3 2008 Jan 113.4 -12.5 1.2 148.7 -16.7 -2.0 Feb 120.7 -6.5 6.4 138.3 -25.6 -7.0 Mar 119.8 -9.4 -0.8 133.0 -36.6 -3.8 Apr 117.2 7.6 -2.2 143.0 -11.6 7.5 May 98.3 -25.7 -16.1 146.5 -6.6 2.5 Jun 116.5 -8.6 18.6 141.1 -14.8 -3.6 Jul 134.6 -8.0 15.5 132.5 -17.6 -6.1 Aug 117.8r -22.7 -12.5 130.6r -18.5 -1.4 Sep 120.4 -17.4 2.2 129.0 -13.9 -1.3 -------------------------------------------------------------------------------------------

Table 1 (concluded) ==================================================== | MISCELLANEOUS MANUFACTURES Year/Month | Index | Year-on-Year | Month-on-Month | | Growth Rates | Growth Rates ---------------------------------------------------- 2007 150.1 -5.2 Jan 127.9 0.9 6.3 Feb 141.4 1.1 10.5 Mar 160.4 -4.9 13.4 Apr 134.4 0.3 -16.2 May 156.9 -11.3 16.7 Jun 159.6 -13.9 1.7 Jul 151.9 -15.4 -4.8 Aug 169.9 -5.0 11.8 Sep 162.6 -9.1 -4.3 Oct 160.7 -0.6 -1.1 Nov 143.8 -3.9 -10.6 Dec 132.2 9.9 -8.0 2008 Jan 109.3 -14.6 -17.4 Feb 106.1 -25.0 -2.9 Mar 100.4 -37.4 -5.4 Apr 107.9 -19.8 7.5 May 104.0 -33.7 -3.6 Jun 104.7 -34.4 0.6 Jul 112.8 -25.8 7.8 Aug 111.9 -34.1 -0.8 Sep 109.5 -32.6 -2.1 -------------------------------------------------------------------------------------------- Note: r - revised due to updating of data from late responding establishments and revision of industry disaggregation. Source: Monthly Integrated Survey of Selected Industries (MISSI) Industry Statistics Division Industry and Trade Statistics Department National Statistics Office Republic of the Philippines