january 5th social media review and practices
TRANSCRIPT
Social Media Event Review
January 5, 2015
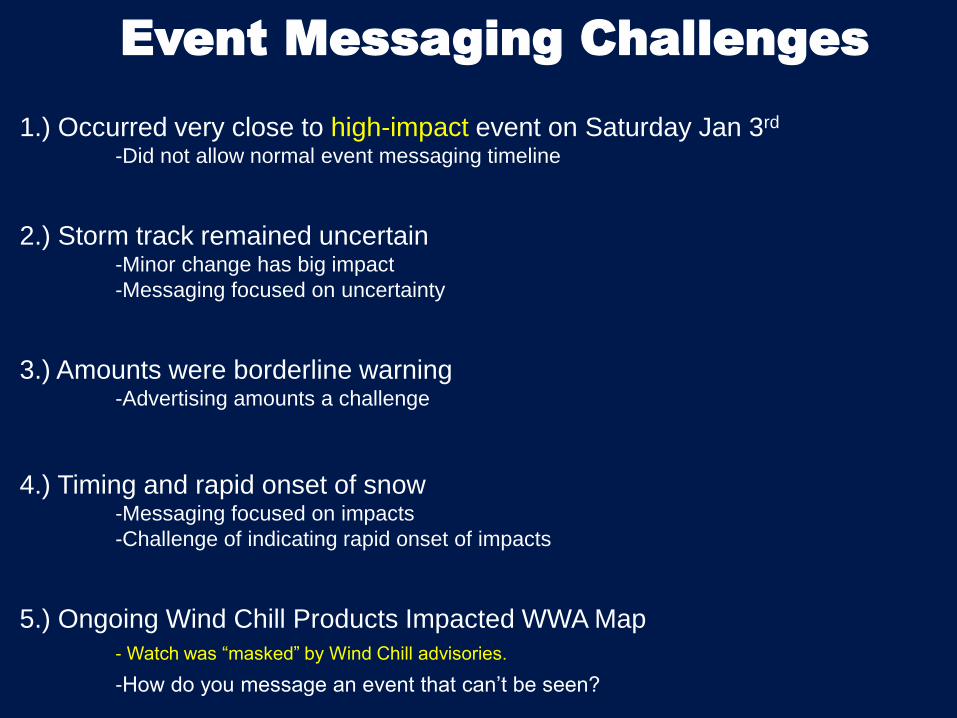
Event Messaging Challenges
1.) Occurred very close to high-impact event on Saturday Jan 3rd
-Did not allow normal event messaging timeline
2.) Storm track remained uncertain-Minor change has big impact
-Messaging focused on uncertainty
3.) Amounts were borderline warning-Advertising amounts a challenge
4.) Timing and rapid onset of snow-Messaging focused on impacts
-Challenge of indicating rapid onset of impacts
5.) Ongoing Wind Chill Products Impacted WWA Map
- Watch was “masked” by Wind Chill advisories.
-How do you message an event that can’t be seen?
Facebook Statistics
(January 3-6)
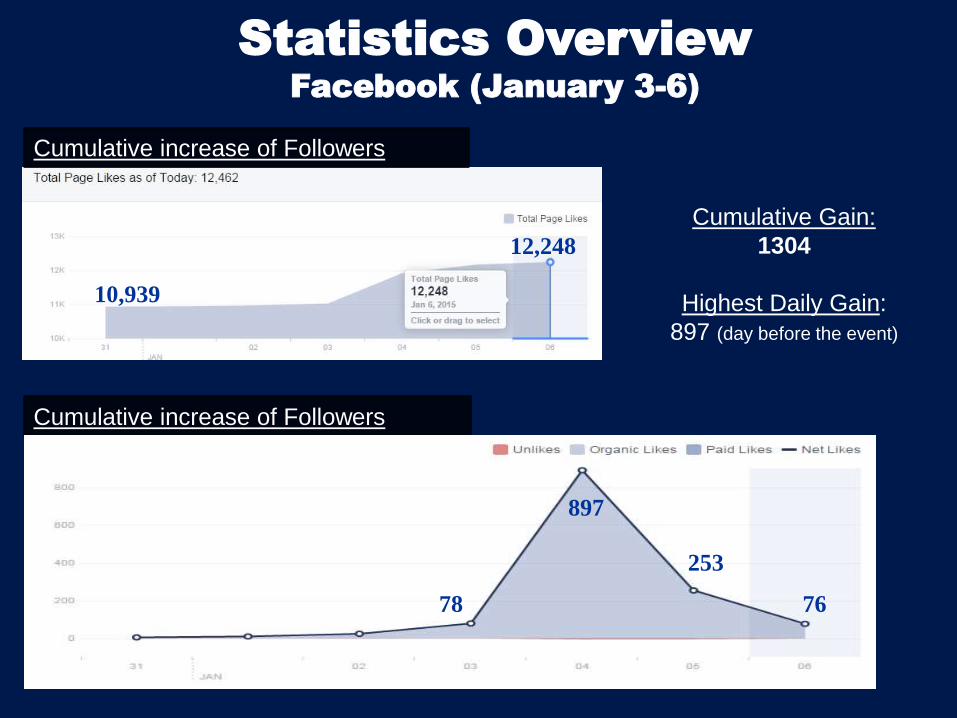
Statistics Overview
Facebook (January 3-6)
Cumulative Gain:
1304
Highest Daily Gain:
897 (day before the event)
Cumulative increase of Followers
Cumulative increase of Followers
10,939
897
253
78 76
12,248
Statistics Overview
Facebook (January 3-6)
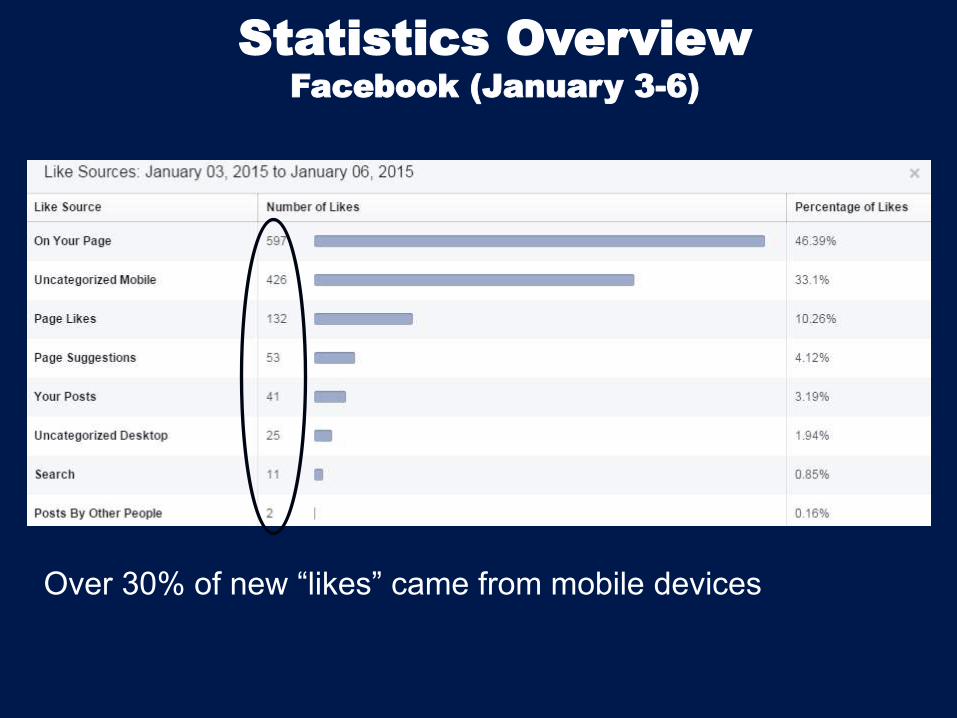
Over 30% of new “likes” came from mobile devices
Statistics Overview
Facebook (January 3-6)
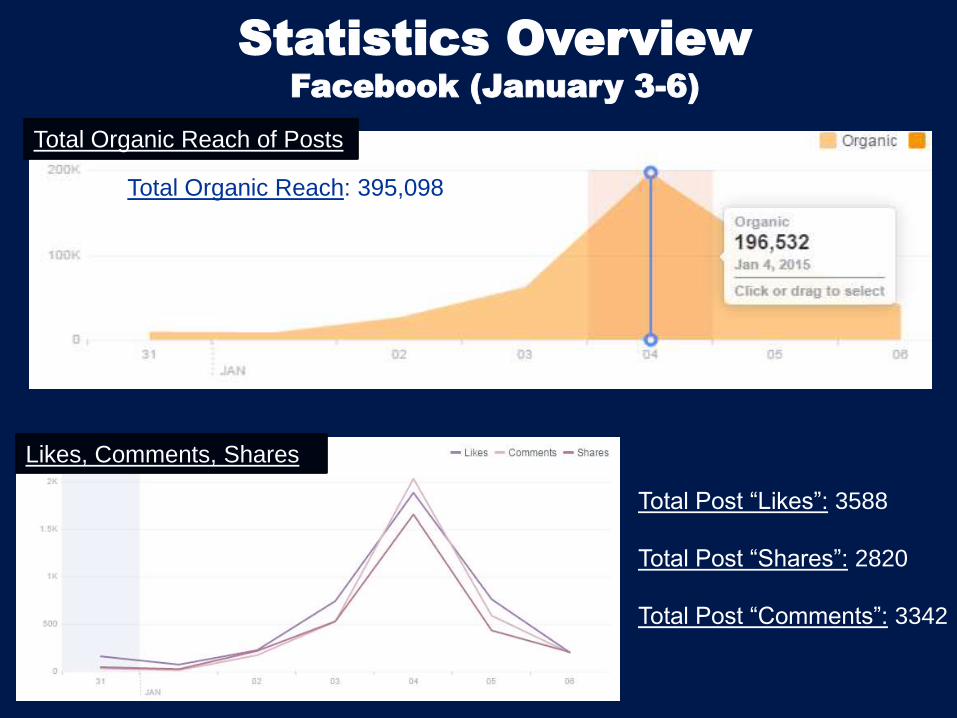
Total Organic Reach of Posts
Total Organic Reach: 395,098
Total Post “Likes”: 3588
Total Post “Shares”: 2820
Total Post “Comments”: 3342
Likes, Comments, Shares
Twitter Statistics
(January 3-6)
Statistics Overview
Twitter (January 3-6)
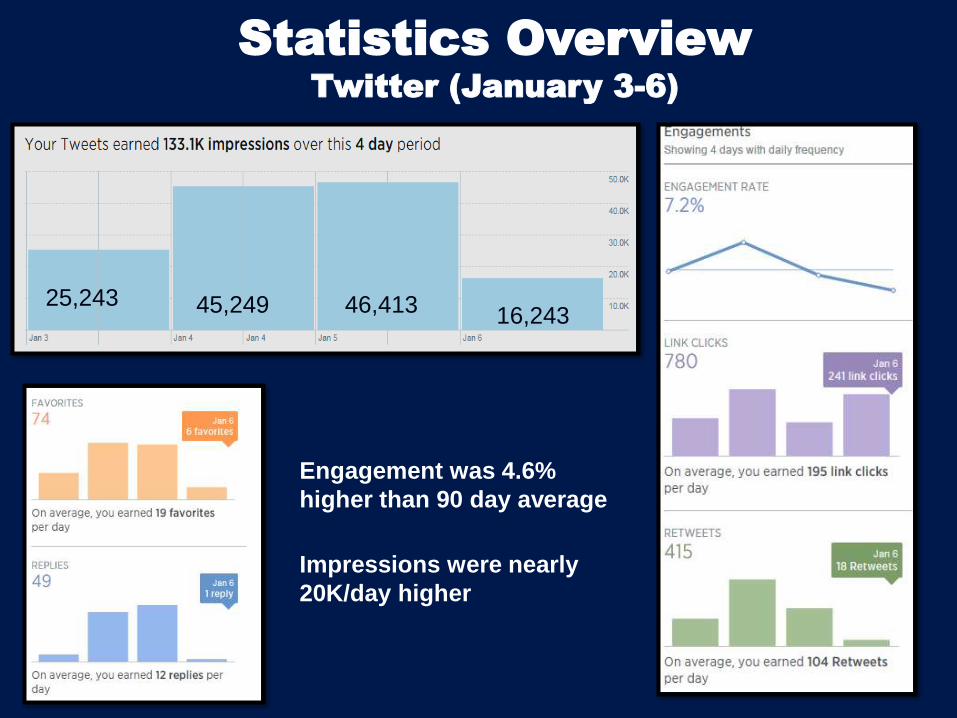
25,243 45,249 46,413 16,243
Engagement was 4.6%
higher than 90 day average
Impressions were nearly
20K/day higher
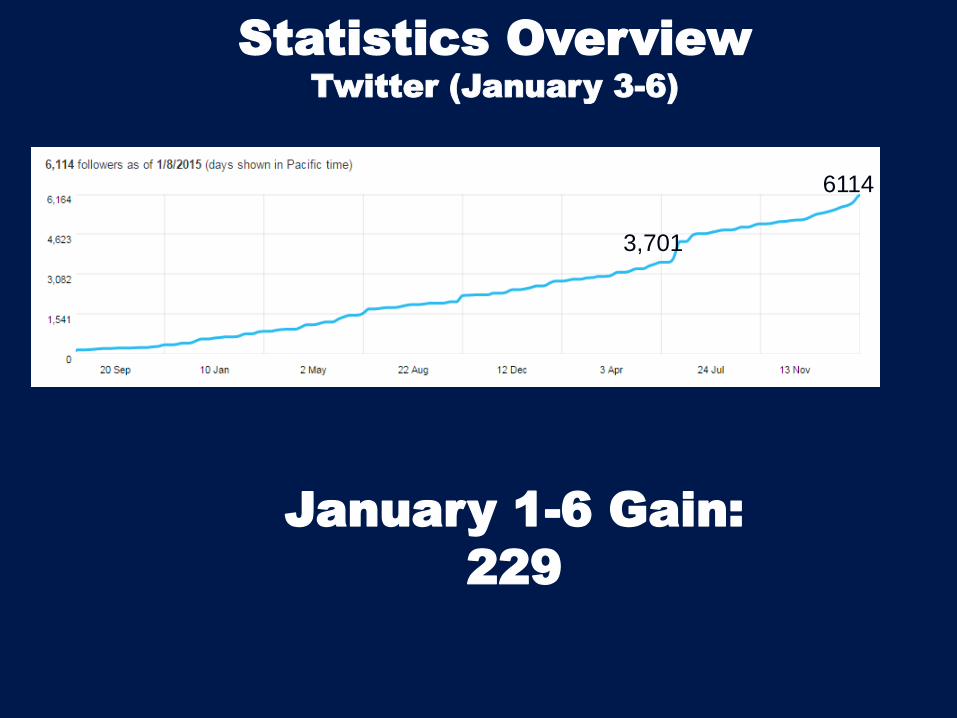
Statistics Overview
Twitter (January 3-6)
3,701
6114
January 1-6 Gain:
229
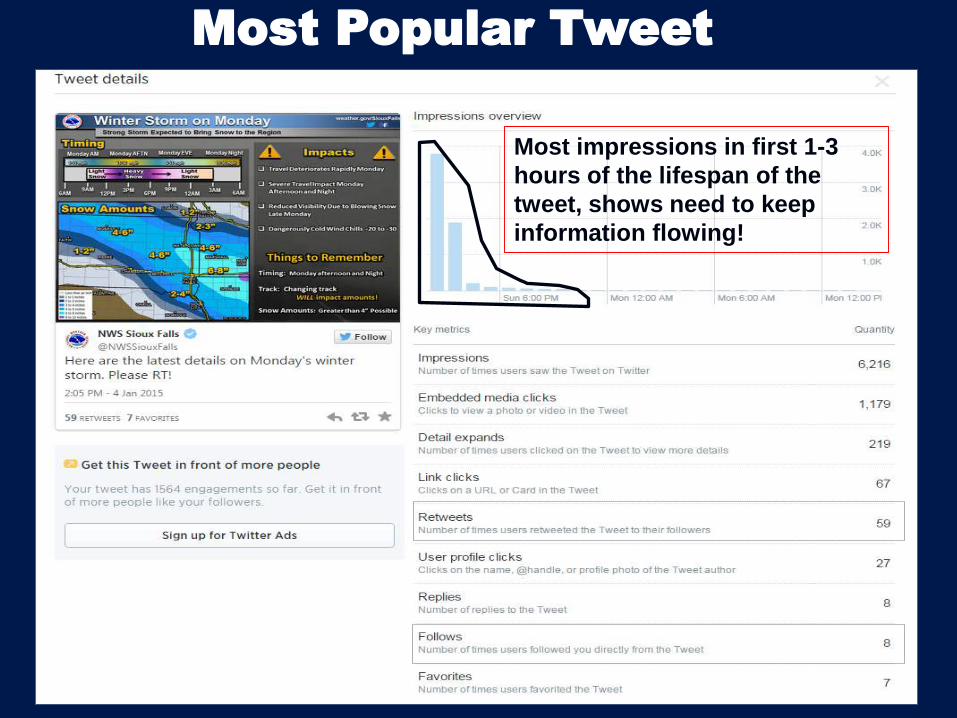
Most Popular Tweet
Most impressions in first 1-3
hours of the lifespan of the
tweet, shows need to keep
information flowing!
Facebook Specifics
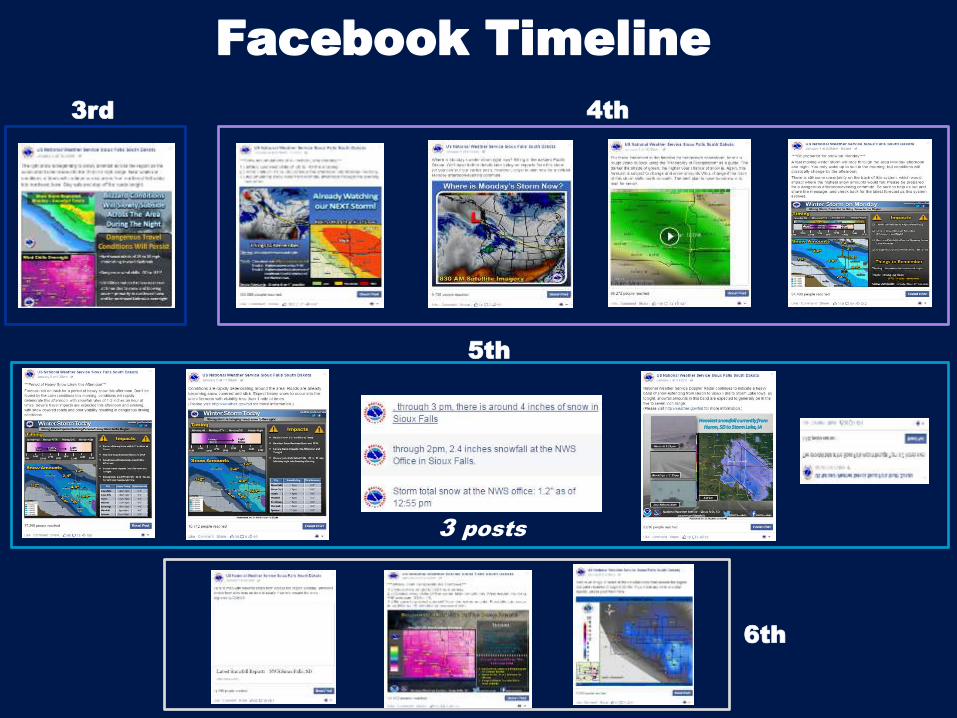
Facebook Timeline
3rd 4th
5th
6th
3 posts
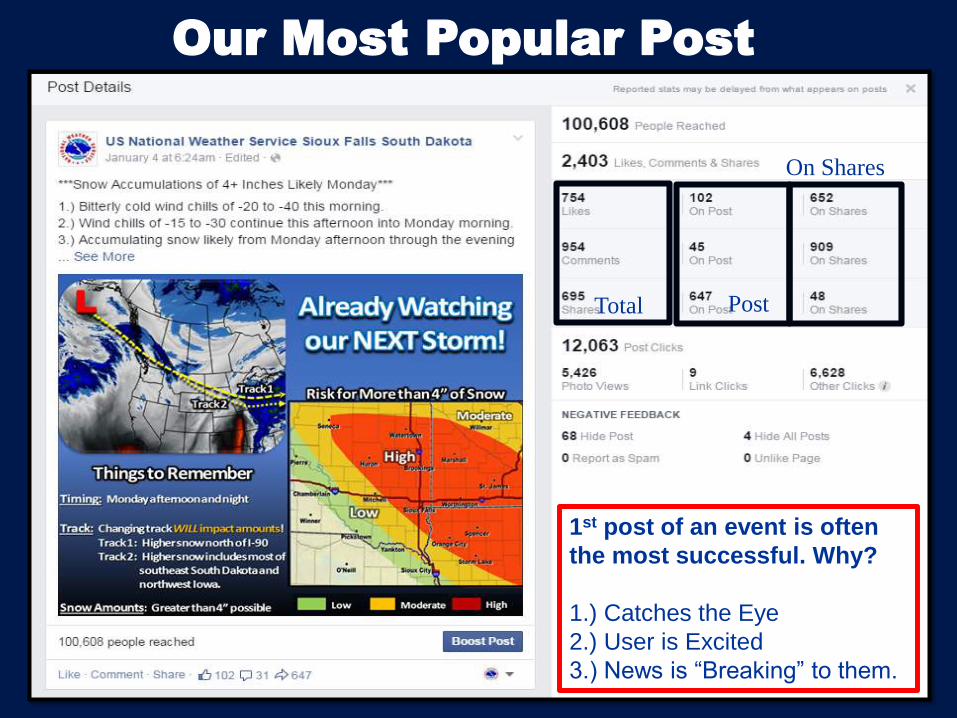
Our Most Popular Post
Total Post
1st post of an event is often
the most successful. Why?
1.) Catches the Eye
2.) User is Excited
3.) News is “Breaking” to them.
On Shares
Addressing
Event Challenges
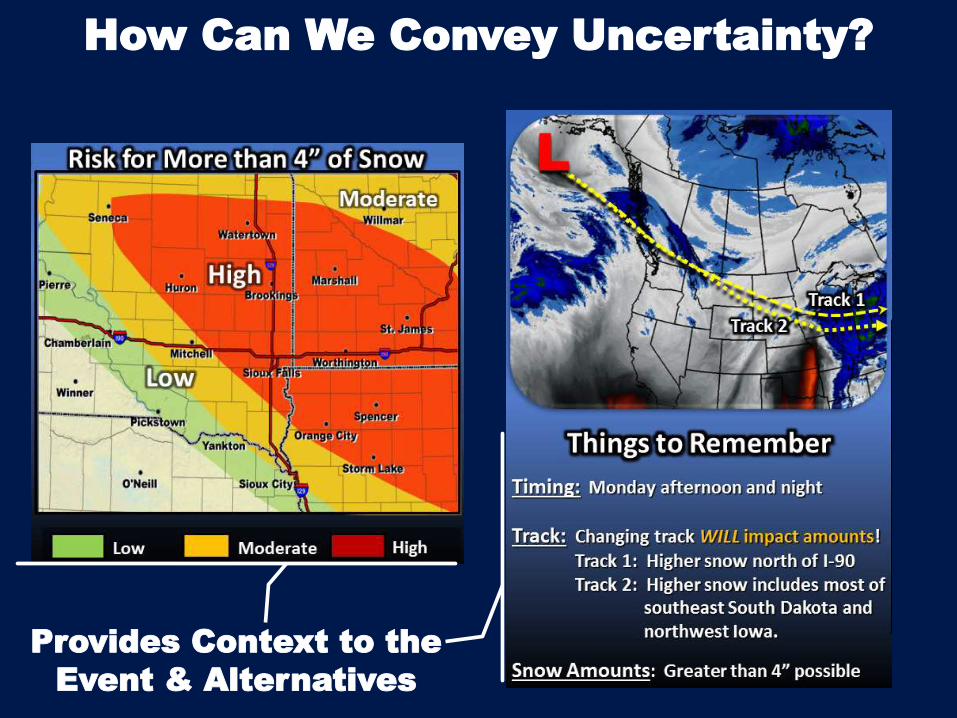
How Can We Convey Uncertainty?
Provides Context to the
Event & Alternatives
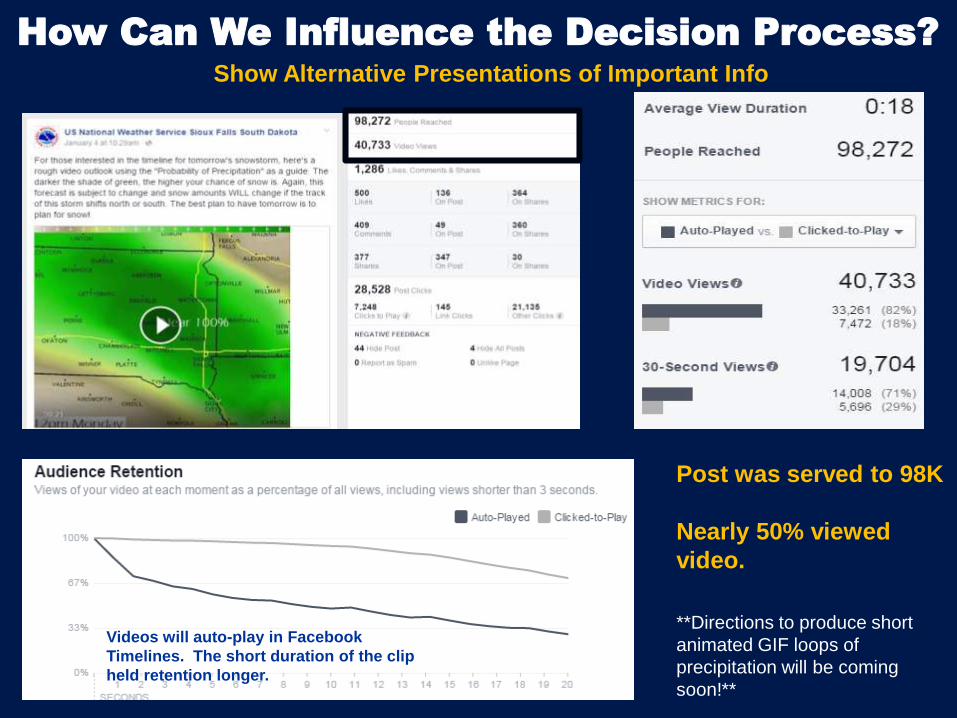
How Can We Influence the Decision Process?
**Directions to produce short
animated GIF loops of
precipitation will be coming
soon!**
Videos will auto-play in Facebook
Timelines. The short duration of the clip
held retention longer.
Post was served to 98K
Nearly 50% viewed
video.
Show Alternative Presentations of Important Info
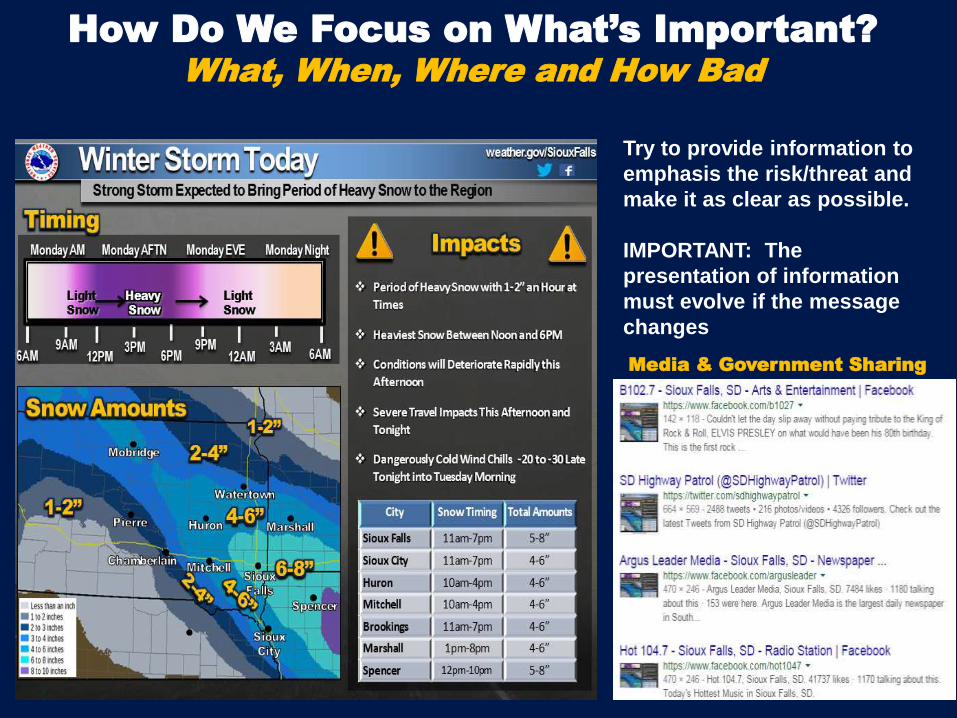
How Do We Focus on What’s Important?
What, When, Where and How Bad
Media & Government Sharing
Try to provide information to
emphasis the risk/threat and
make it as clear as possible.
IMPORTANT: The
presentation of information
must evolve if the message
changes
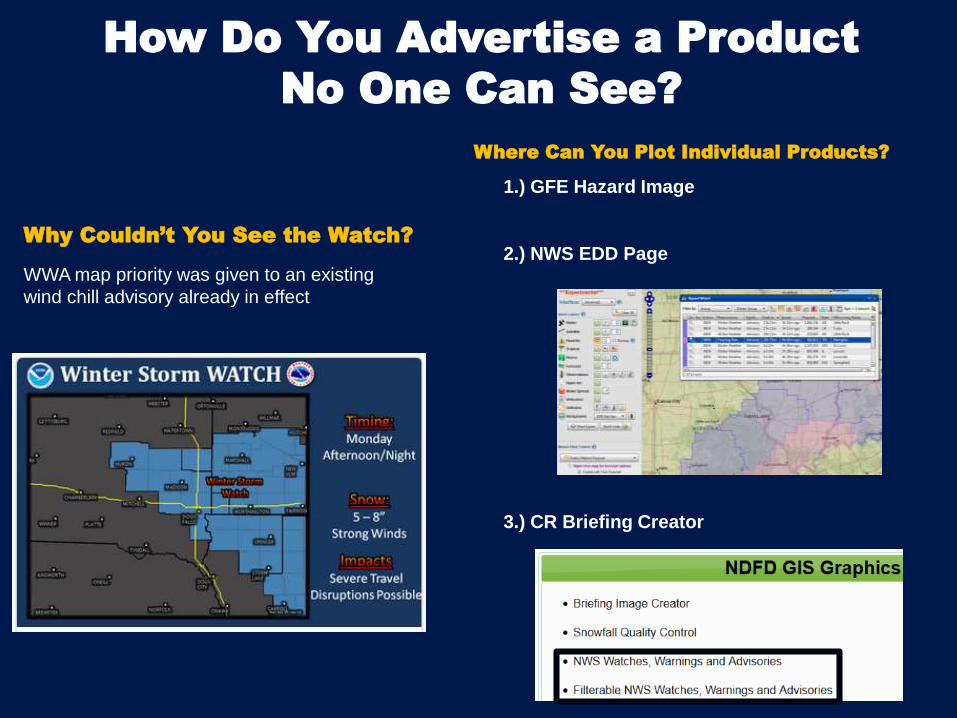
How Do You Advertise a Product
No One Can See?
Why Couldn’t You See the Watch?
WWA map priority was given to an existing
wind chill advisory already in effect
Where Can You Plot Individual Products?
1.) GFE Hazard Image
2.) NWS EDD Page
3.) CR Briefing Creator
Social Media Suggestions
Moving Forward
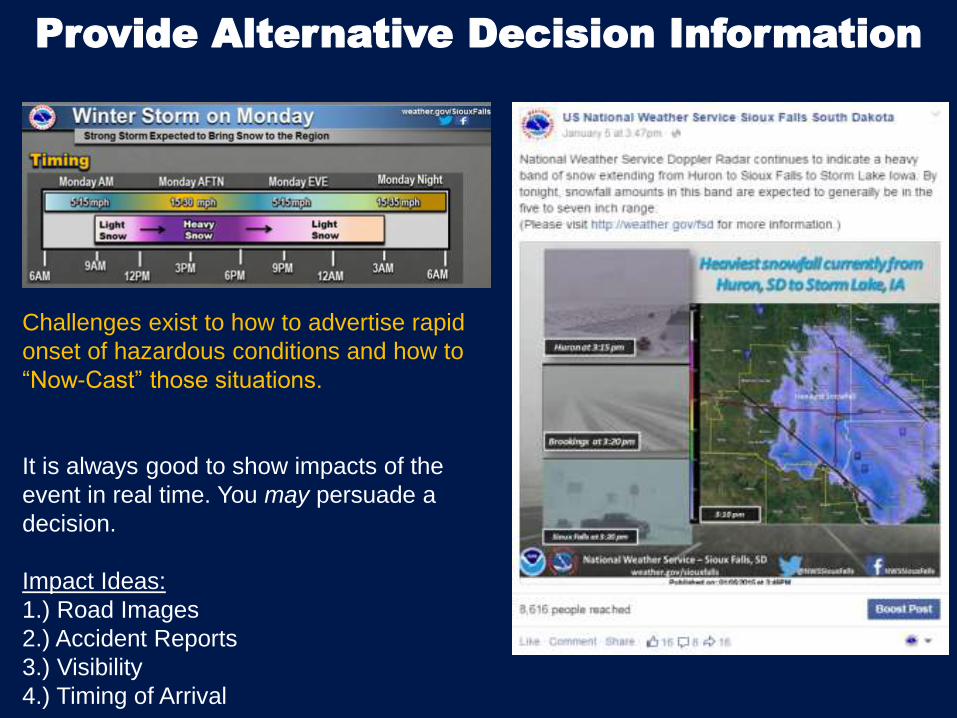
Provide Alternative Decision Information
Challenges exist to how to advertise rapid
onset of hazardous conditions and how to
“Now-Cast” those situations.
It is always good to show impacts of the
event in real time. You may persuade a
decision.
Impact Ideas:
1.) Road Images
2.) Accident Reports
3.) Visibility
4.) Timing of Arrival
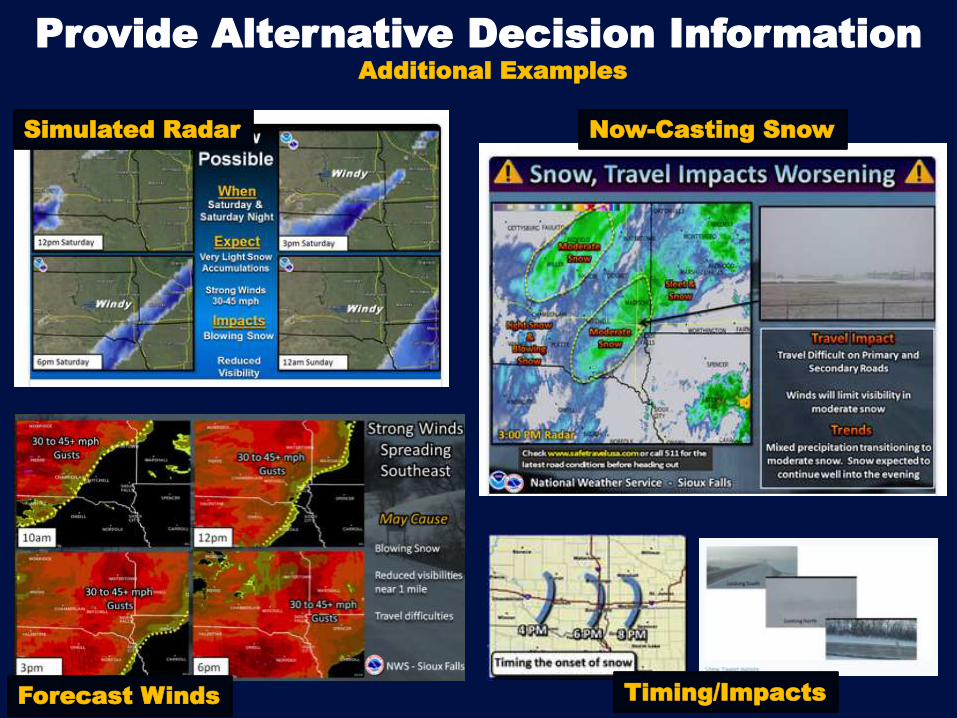
Provide Alternative Decision Information
Additional Examples
Simulated Radar
Forecast Winds Timing/Impacts
Now-Casting Snow
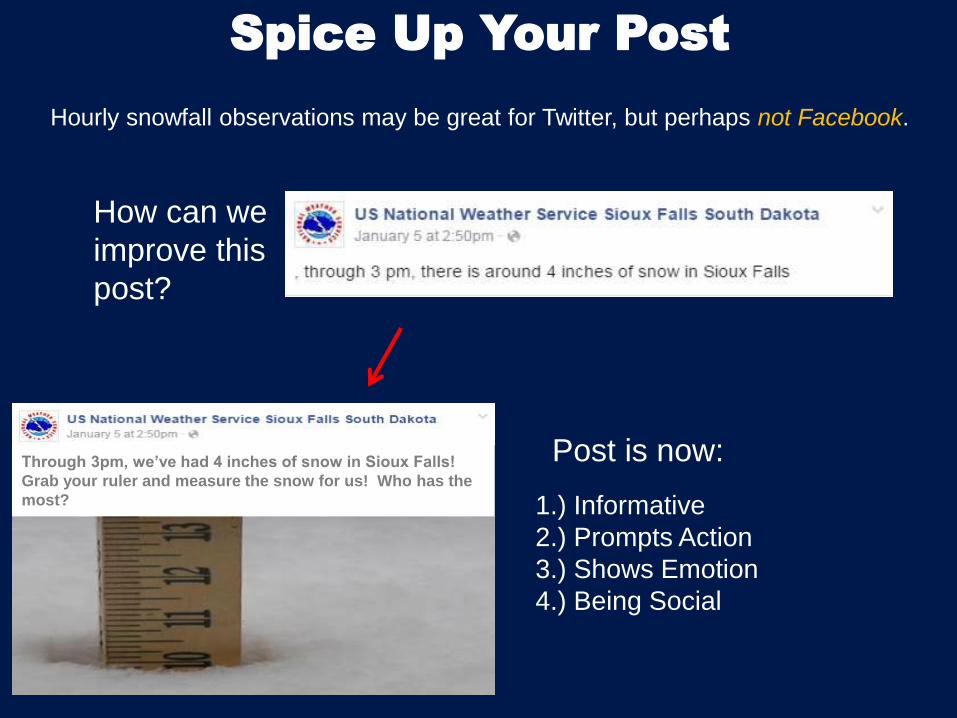
Spice Up Your Post
Hourly snowfall observations may be great for Twitter, but perhaps not Facebook.
How can we
improve this
post?
Post is now:Through 3pm, we’ve had 4 inches of snow in Sioux Falls!
Grab your ruler and measure the snow for us! Who has the
most? 1.) Informative
2.) Prompts Action
3.) Shows Emotion
4.) Being Social
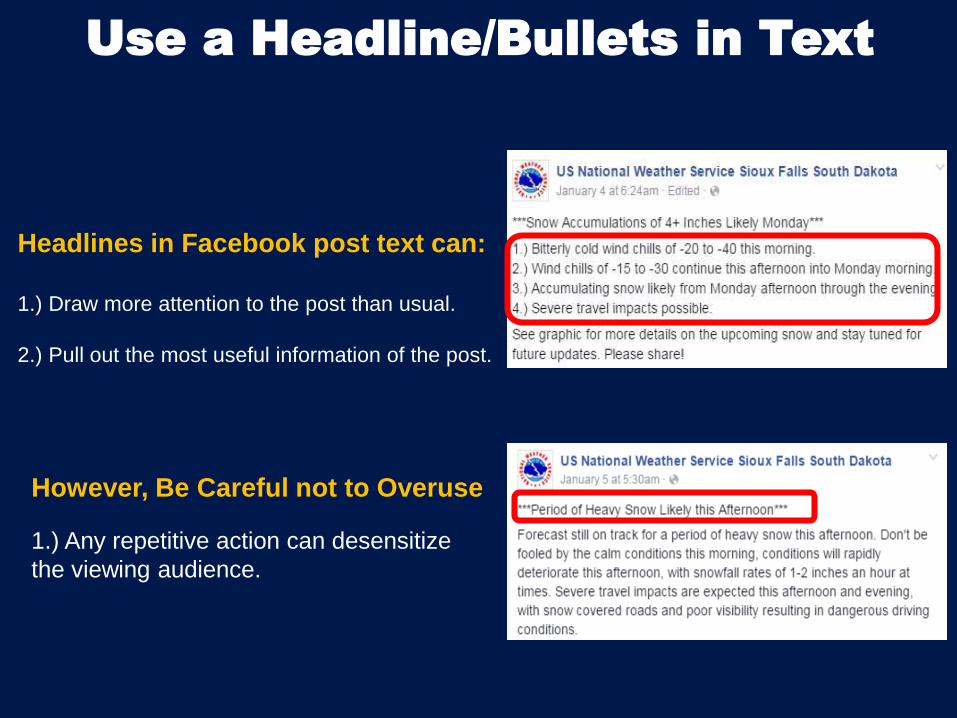
Use a Headline/Bullets in Text
Headlines in Facebook post text can:
1.) Draw more attention to the post than usual.
2.) Pull out the most useful information of the post.
However, Be Careful not to Overuse
1.) Any repetitive action can desensitize
the viewing audience.
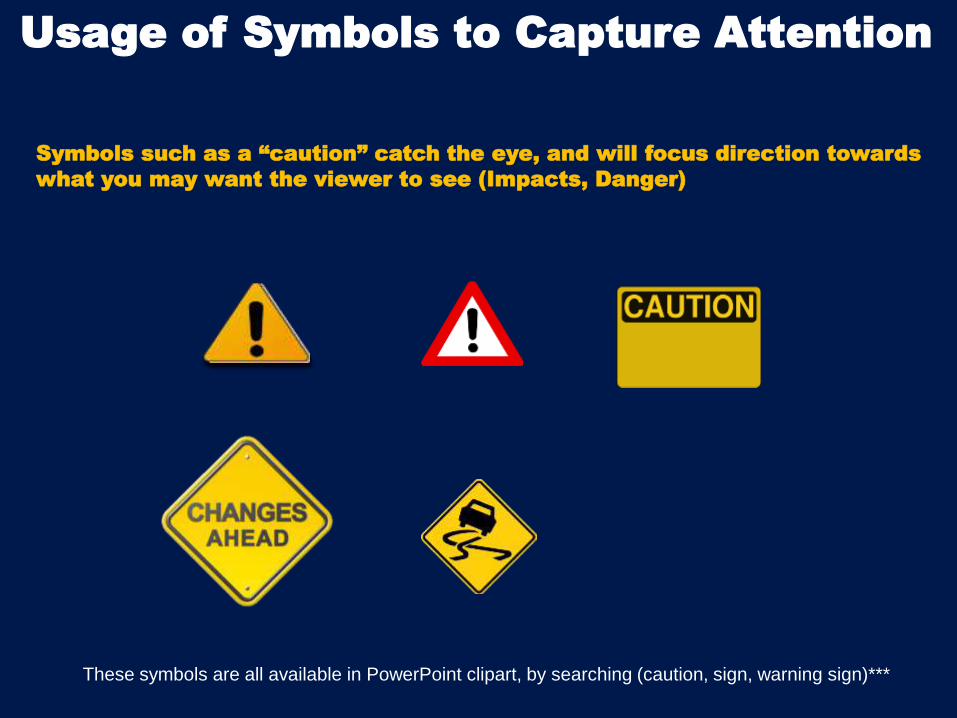
Usage of Symbols to Capture Attention
Symbols such as a “caution” catch the eye, and will focus direction towards
what you may want the viewer to see (Impacts, Danger)
These symbols are all available in PowerPoint clipart, by searching (caution, sign, warning sign)***
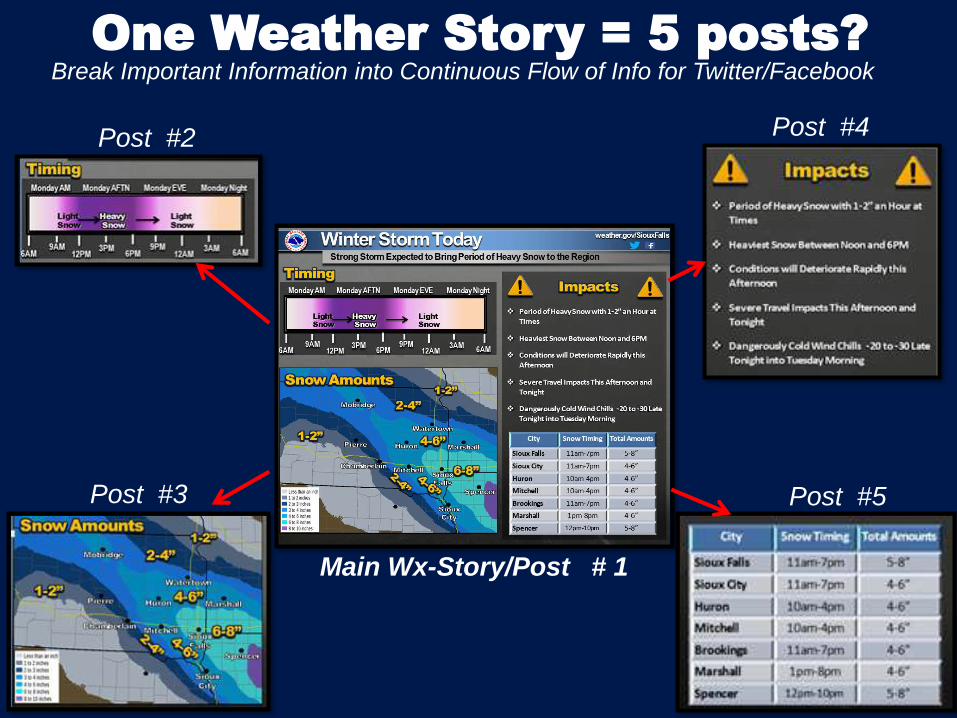
One Weather Story = 5 posts?Break Important Information into Continuous Flow of Info for Twitter/Facebook
Main Wx-Story/Post # 1
Post #2
Post #3
Post #4
Post #5
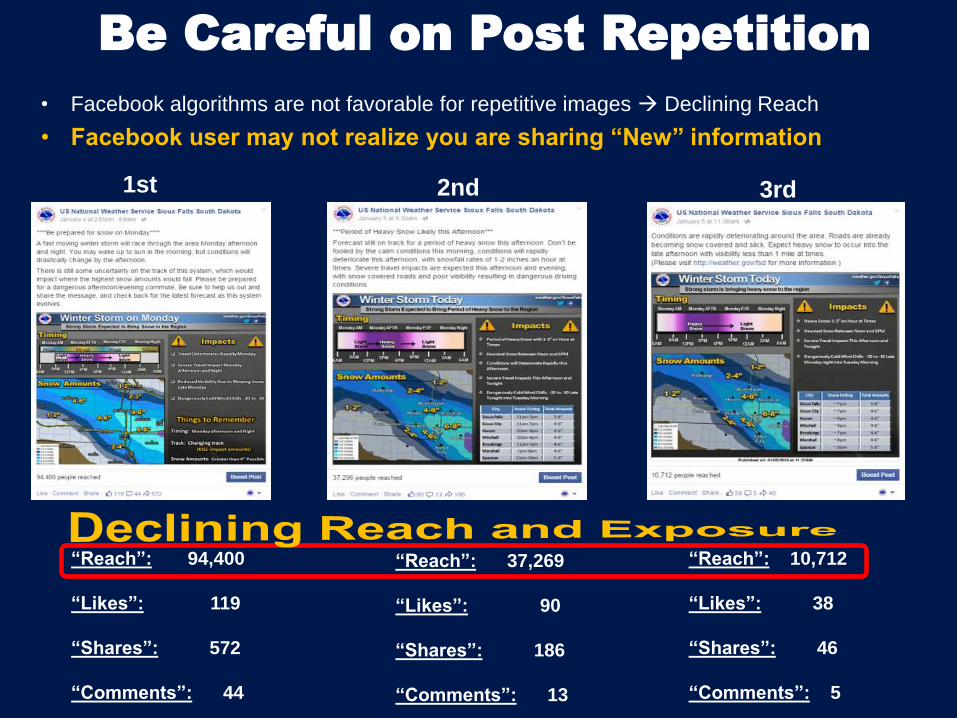
Be Careful on Post Repetition
“Reach”: 10,712
“Likes”: 38
“Shares”: 46
“Comments”: 5
“Reach”: 37,269
“Likes”: 90
“Shares”: 186
“Comments”: 13
“Reach”: 94,400
“Likes”: 119
“Shares”: 572
“Comments”: 44
• Facebook algorithms are not favorable for repetitive images Declining Reach
• Facebook user may not realize you are sharing “New” information
1st 2nd 3rd
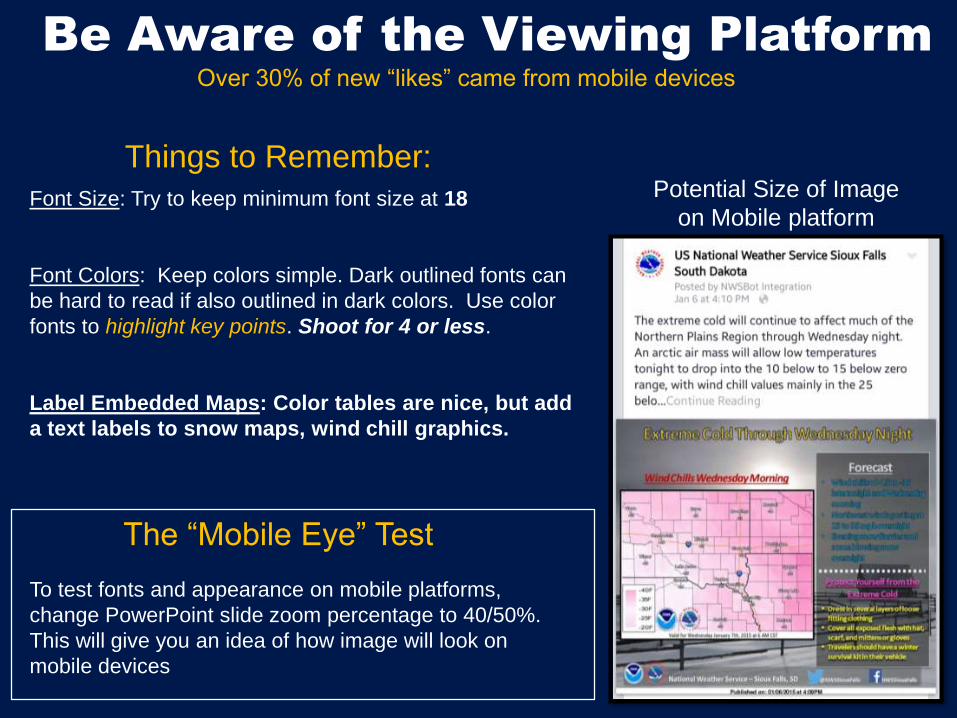
Over 30% of new “likes” came from mobile devices
Be Aware of the Viewing Platform
Things to Remember:
Font Size: Try to keep minimum font size at 18
Font Colors: Keep colors simple. Dark outlined fonts can
be hard to read if also outlined in dark colors. Use color
fonts to highlight key points. Shoot for 4 or less.
Label Embedded Maps: Color tables are nice, but add
a text labels to snow maps, wind chill graphics.
Potential Size of Image
on Mobile platform
The “Mobile Eye” Test
To test fonts and appearance on mobile platforms,
change PowerPoint slide zoom percentage to 40/50%.
This will give you an idea of how image will look on
mobile devices
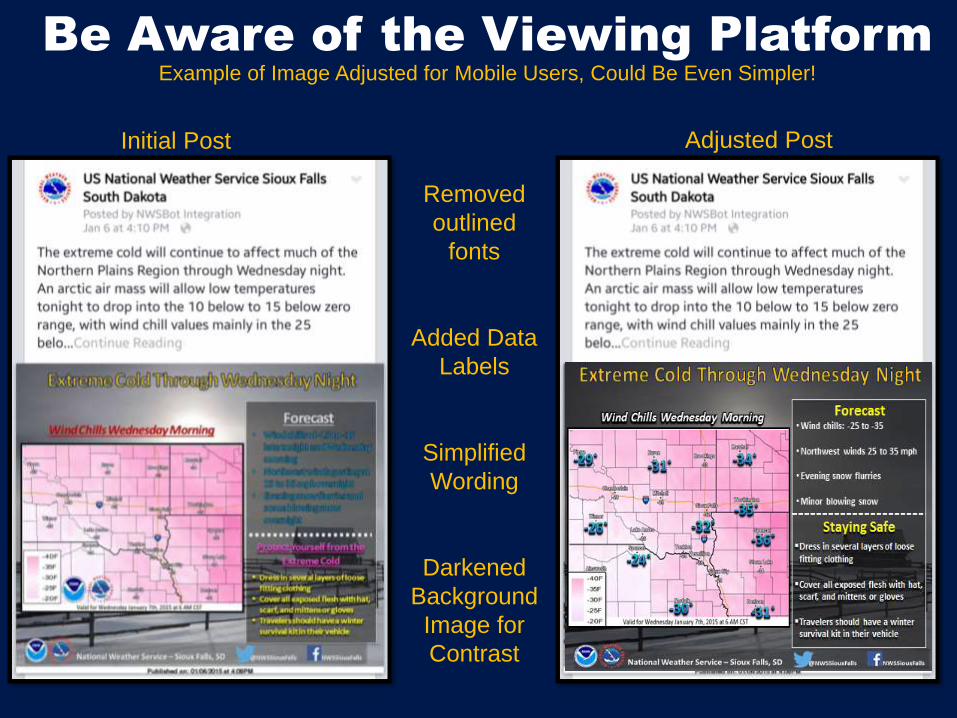
Be Aware of the Viewing Platform
Initial Post Adjusted Post
Removed
outlined
fonts
Added Data
Labels
Simplified
Wording
Darkened
Background
Image for
Contrast
Example of Image Adjusted for Mobile Users, Could Be Even Simpler!
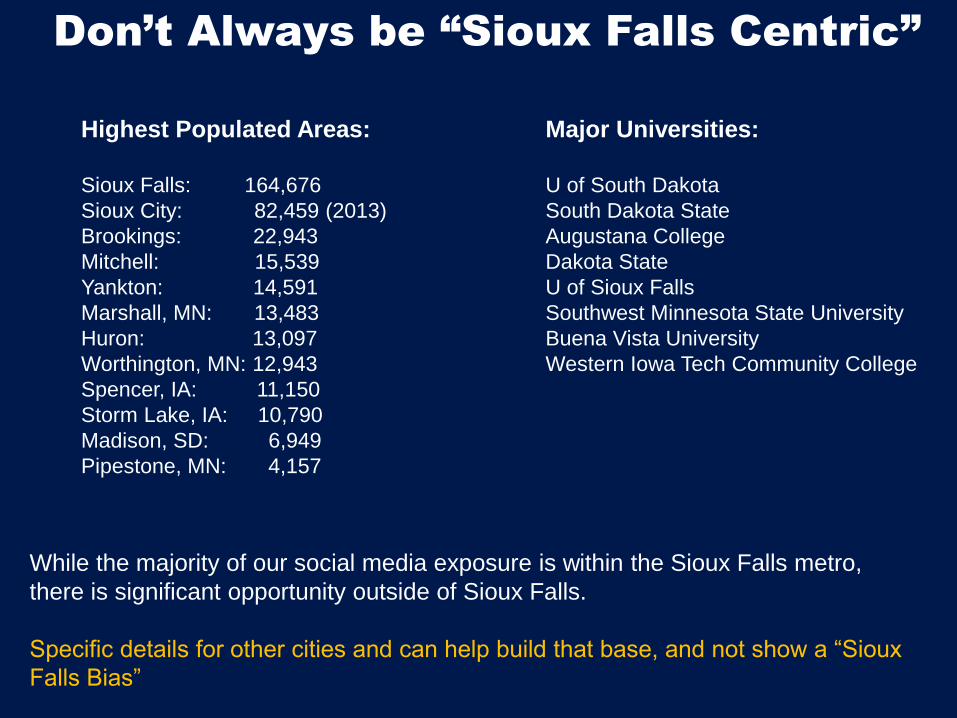
Don’t Always be “Sioux Falls Centric”
Highest Populated Areas:
Sioux Falls: 164,676
Sioux City: 82,459 (2013)
Brookings: 22,943
Mitchell: 15,539
Yankton: 14,591
Marshall, MN: 13,483
Huron: 13,097
Worthington, MN: 12,943
Spencer, IA: 11,150
Storm Lake, IA: 10,790
Madison, SD: 6,949
Pipestone, MN: 4,157
Major Universities:
U of South Dakota
South Dakota State
Augustana College
Dakota State
U of Sioux Falls
Southwest Minnesota State University
Buena Vista University
Western Iowa Tech Community College
While the majority of our social media exposure is within the Sioux Falls metro,
there is significant opportunity outside of Sioux Falls.
Specific details for other cities and can help build that base, and not show a “Sioux
Falls Bias”
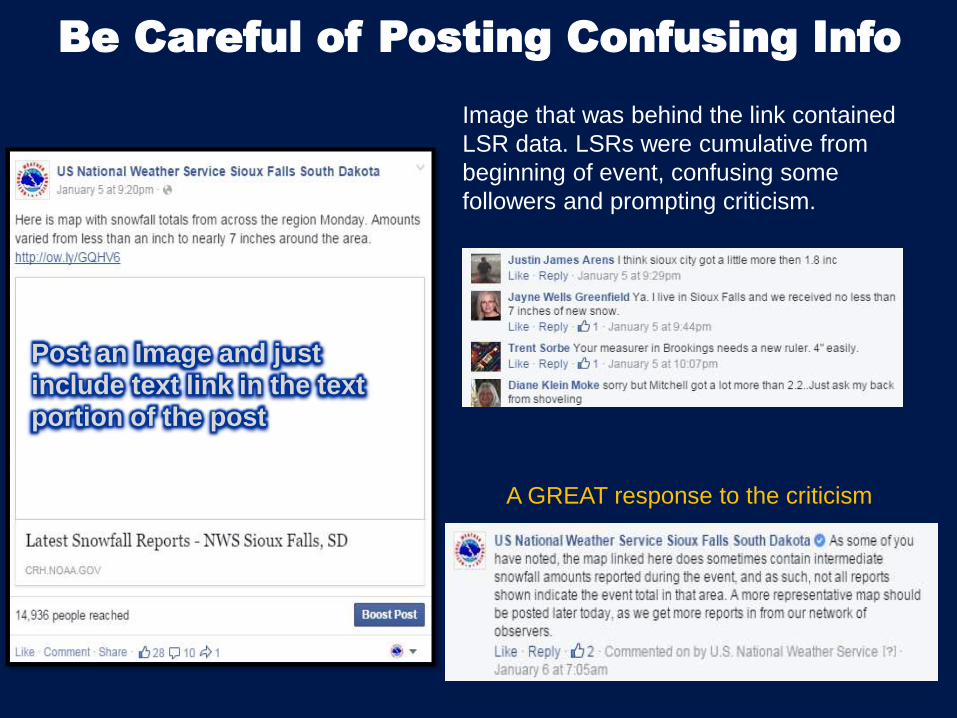
Be Careful of Posting Confusing Info
Image that was behind the link contained
LSR data. LSRs were cumulative from
beginning of event, confusing some
followers and prompting criticism.
A GREAT response to the criticism
Post an Image and just
include text link in the text
portion of the post
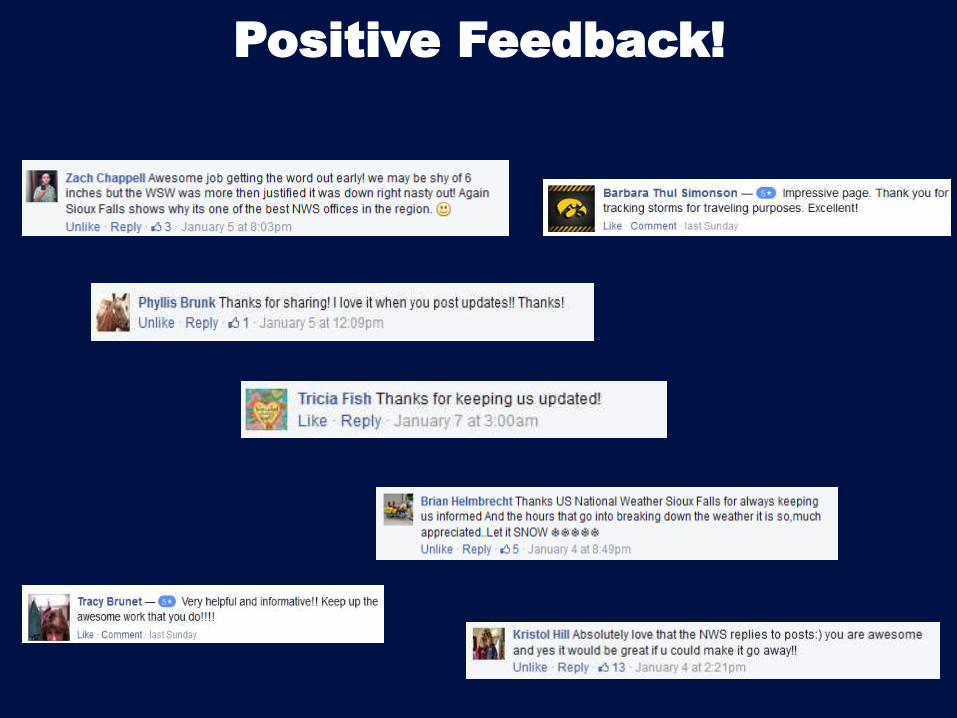
Positive Feedback!
Summary
WE did many great things as an office to enhance the messaging given this
challenging event.
For the most part, information continued to flow as the event unfolded.
Responses to questions asked were timely, and accurate.
Plenty of positive responsive was had by the social media community!
It’s Important to:
• Continue to experiment with new ideas for presenting the most important
message.
• Keep presenting decision making materials
• Be cautious about posting continual hourly snowfall reports on Facebook
• Make sure to check older posts for new questions