january 8, 1999 - resolution copper · water level and/or hydraulic pressure response in the alt...
TRANSCRIPT

~ MONTGOMERY & ASSOCIATES Water Resource Consultants
TECHNICAL MEMORANDUM
www.elmontgomery.com
4500 Cherry Creek Drive South Suite 870 Denver, CO 80246
TEL 303-927-6820 FAX 720-269-4859
DATE: January 15, 2014 PROJECT: 605.413
TO:
FROM:
COPY:
SUBJECT:
Introduction
Heather Gluski, Resolution Copper Mining LLC
Daniel Weber
Greg Ghidotti, Resolution Copper Mining LLC Todd Keay, Montgomery & Associates
Well HRES-20 - Results of 90-day Aquifer Test, Resolution Copper Mining, Pinal County, Arizona
In accordance with a request from Ms. Heather Gluski, Resolution Copper Mining LLC (RCM), Montgomery & Associates (M&A) has prepared this Technical Memorandum to document results and analysis of a 90-day aquifer test conducted by RCM at well HRES-20 completed in the Apache Leap Tuff (ALT) aquifer.
Summary
A summary of the long-tenn pumping test operations and results is as follows:
1. The long-term pumping test was conducted at well HRES-20 for 90 days beginning April 2, 2013 and ending July 1, 2013. Recovery was monitored for 90 days after pumping stopped.
2. Pumping rate at HRES-20 averaged 77 gallons per minute (gpm).
3. Water level and/or hydraulic pressure response in the ALT aquifer was monitored at: pumped well HRES-20, fifteen observation wells, and one annular grouted piezometer. Distances from the pumped well range from 72 to 12,935 feet. Discernible water level drawdown due to pumping was evident in wells HRES-15, HRES-14, HRES-16, A-06, HRES-07, MJ-11, and grouted piezometer DHRES-14_1071.
,:::, a: UJ "-
UJ _J
5: '-'
0 0 <t a: 0 _J
0 '-'
<t z 0 !::i er <t
Page 2
4. After 90 days of pumping, water level drawdown was strongly asymmetric with a north-south orientation; largest drawdown was observed to the north of the pumped well at well HRES-14 and south to well A-06.
5. Analysis of drawdown and recovery data indicates a geometric mean of hydraulic conductivity of 0.079 meters per day (m/d) (0.26 feet per day (ft/d)); using an aquifer thickness equivalent to the depth penetrated at well HRES-15 of 983 feet, transmissivity averages about 24 square meters per day (m2/d) (258 square feet per day (ft2/d)).
6. Specific storage is estimated to range from 4.2E-07 to 1.5E-05 1/ft; using an aquifer thickness equivalent to the penetration at well HRES-15 of 983 feet, storativity ranges from about 4.1E-04 to 1.5E-02 (dimensionless). The smaller of these values are obtained at distant observation wells and are indicative of the elastic response of the aquifer; the larger values are obtained near the pumped well and are indicative of specific yield or drainable porosity value of the aquifer.
Background
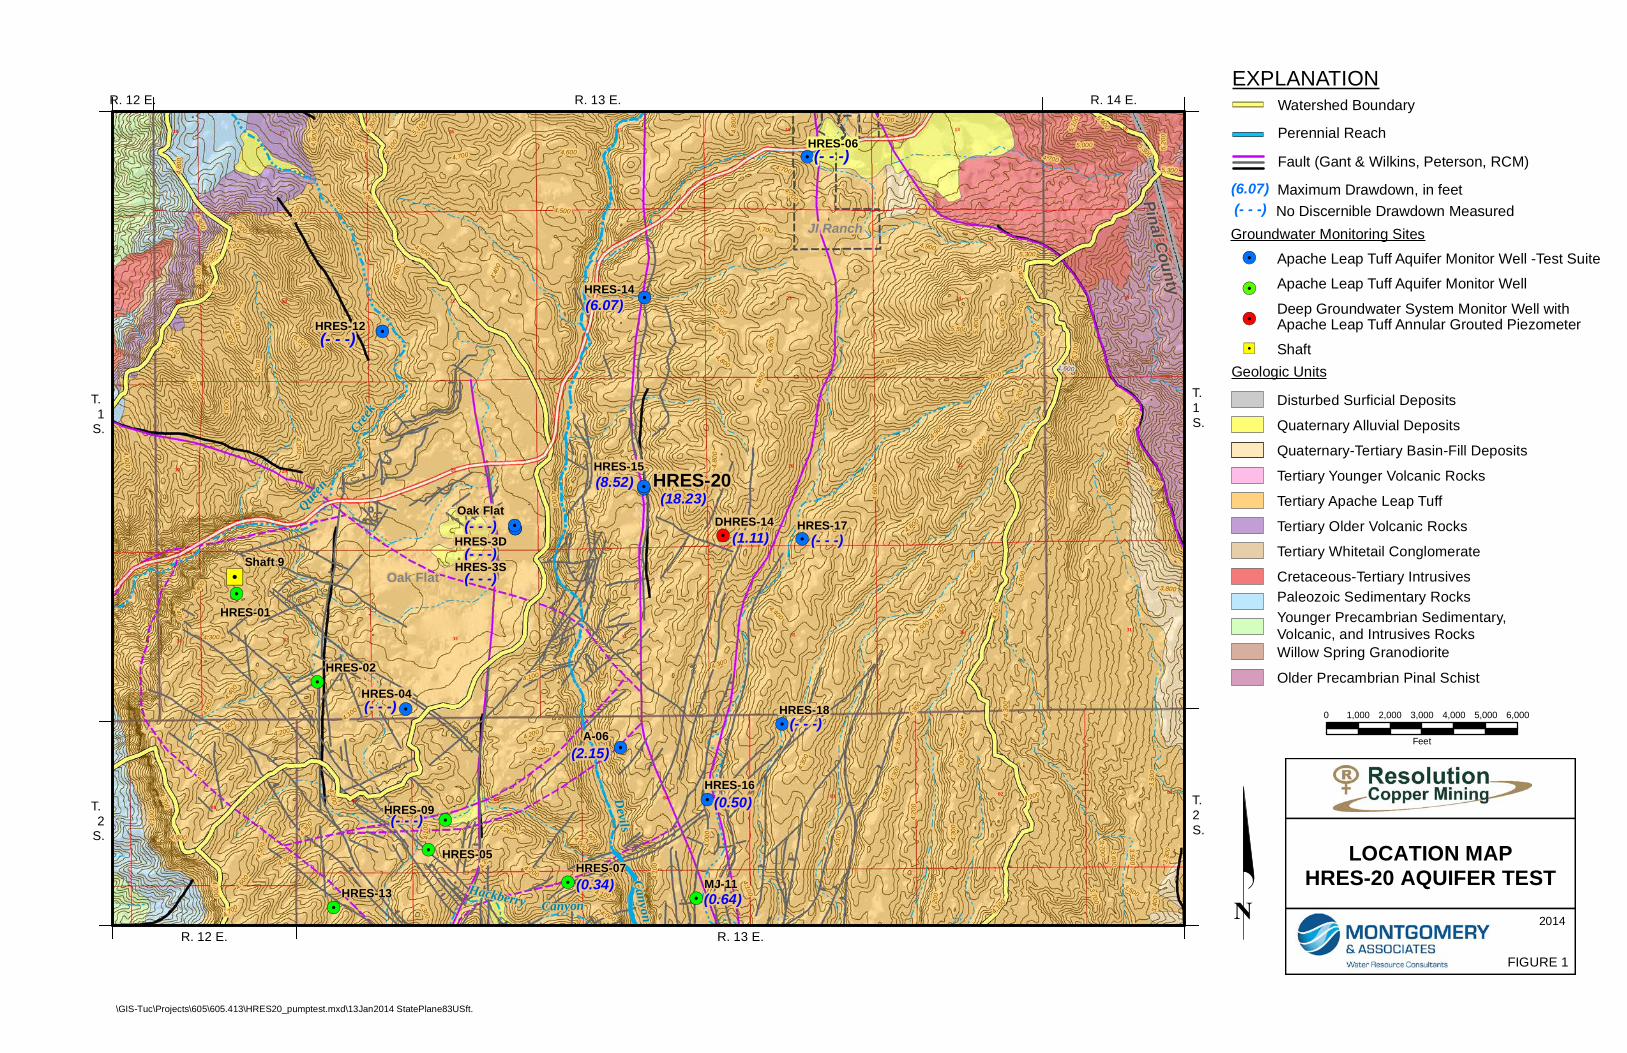
Well HRES-20 is collared east of Devils Canyon and west of Rawhide Canyon in the Devils Canyon watershed. The well was completed on December 7, 2012. Well HRES-20 is a “partially penetrating” well that is completed in the upper 390 feet of the ALT aquifer, which is approximately 980 feet thick at this location. The locations for pumped well HRES-20, and the surrounding ALT monitor wells and piezometer used as observation wells during the test, are shown on Figure 1. The ALT monitor wells referred to as part of the “Test Suite” were designated prior to testing as potential wells that may show discernible water level drawdown during pumping at well HRES-20. These include twelve wells and one annular grouted piezometer, at distances ranging from 72 to 11,590 feet from well HRES-20. These locations were routinely monitored during the test period. Other ALT monitor wells on the map were monitored less frequently during testing given their significant distance from the pumped well (e.g., wells HRES-07, HRES-09, and MJ-11). RCM personnel conducted all field operations for the test; M&A provided technical input prior to and during the test, as well as data processing of water levels and analytical modeling of results.
Well construction details for the pumped well and observation wells are summarized in Table 1. For purposes of analytical modeling of aquifer test data, the saturated thickness of the ALT aquifer was assumed to be 983 feet, equivalent to the ALT aquifer thickness at well HRES-15 which fully penetrates the ALT aquifer.
9 MONTGOMERY & ASSOCIATES

Page 3
Field Methods and Results
The test pump and discharge assembly was installed in hydrologic test well HRES-20 by Boart Longyear, of Peoria, Arizona on February 5, 2013. Well HRES-20 was equipped with a Grundfos Model 150S300-16 pump with a 30-horsepower, 460-volt, three-phase Grundfos Model MS-6000 electric motor. The pump was installed on 3-inch diameter galvanized steel column pipe with galvanized steel couplings; depth to the pump intake was 700 feet below land surface (ft/bls). The well was equipped with a 1-inch Schedule 80 PVC sounder/transducer access tube which extended from the wellhead to the top of the pump. The access tube was capped on the bottom and factory slotted in the lowermost 60 feet.
The discharge assembly included a McCrometer UltraMag digital flowmeter, a pressure gage, gate valves to adjust flow rate, and a hose bib for obtaining water samples. Best management practices were employed to manage discharge of pumped groundwater, and prevent its entry into Devils Canyon. Discharge water was dispersed using more than 2500 feet of flexible dispersion lines and sprinkler sections, resulting in zero discharge into Devils Canyon. Flow rate and water quality parameters were monitored daily in accordance with discharge authorization number AZDGP – 60821 under the Arizona Pollutant Discharge Elimination System General Permit for De Minimus Discharges to Waters of the U.S.
During testing, water levels at HRES-20 were measured and recorded using an In Situ Level TROLL integrated datalogger/pressure transducer. Pumping rate and discharge line pressure were also measured, as well as water quality parameters. Sand content of the water was measured using a 1-liter calibrated Imhoff cone. After the constant-rate test pumping period was complete, water level recovery was measured for a period equal to the pumping period.
At observation wells, water levels during the test were monitored with In Situ Level TROLL integrated datalogger/pressure transducers. At piezometer DHRES-14_1071, hydraulic pressure is measured using a Geokon pressure transducer grouted in the annulus of the well. Water levels were also measured manually using water level sounders on a regular basis at the pumped well and observations wells. Barometric pressure was monitored at several stations during the pumping test in order to correct pressure from non-vented pressure transducers and to distinguish water level stresses due to pumping from stresses caused by changes in atmospheric pressure.
The average pumping rate measurement during the test was 77 gpm. Maximum drawdown at the pumped well was 18.23 feet and occurred near the end the pumping period. Operational parameters for the HRES-20 pumping test are as follows:
9 MONTGOMERY & ASSOCIATES

Page 4
Well Identifier
Date and Time Pumping Started
Duration of Pumping
Period (days)
Average Pumping
Rate (gpm) a
Pre-pumping
Water Level (ft bmp) b
Maximum Water Level Drawdown
(ft)
Specific Capacity
(gpm/ft) c
HRES-20 02-Apr 2013 12:00 90 77 646.82 18.23 4.2
a gpm = gallons per minute b ft bmp = feet below measuring point c gpm/ft = gallons per minute per foot of drawdown
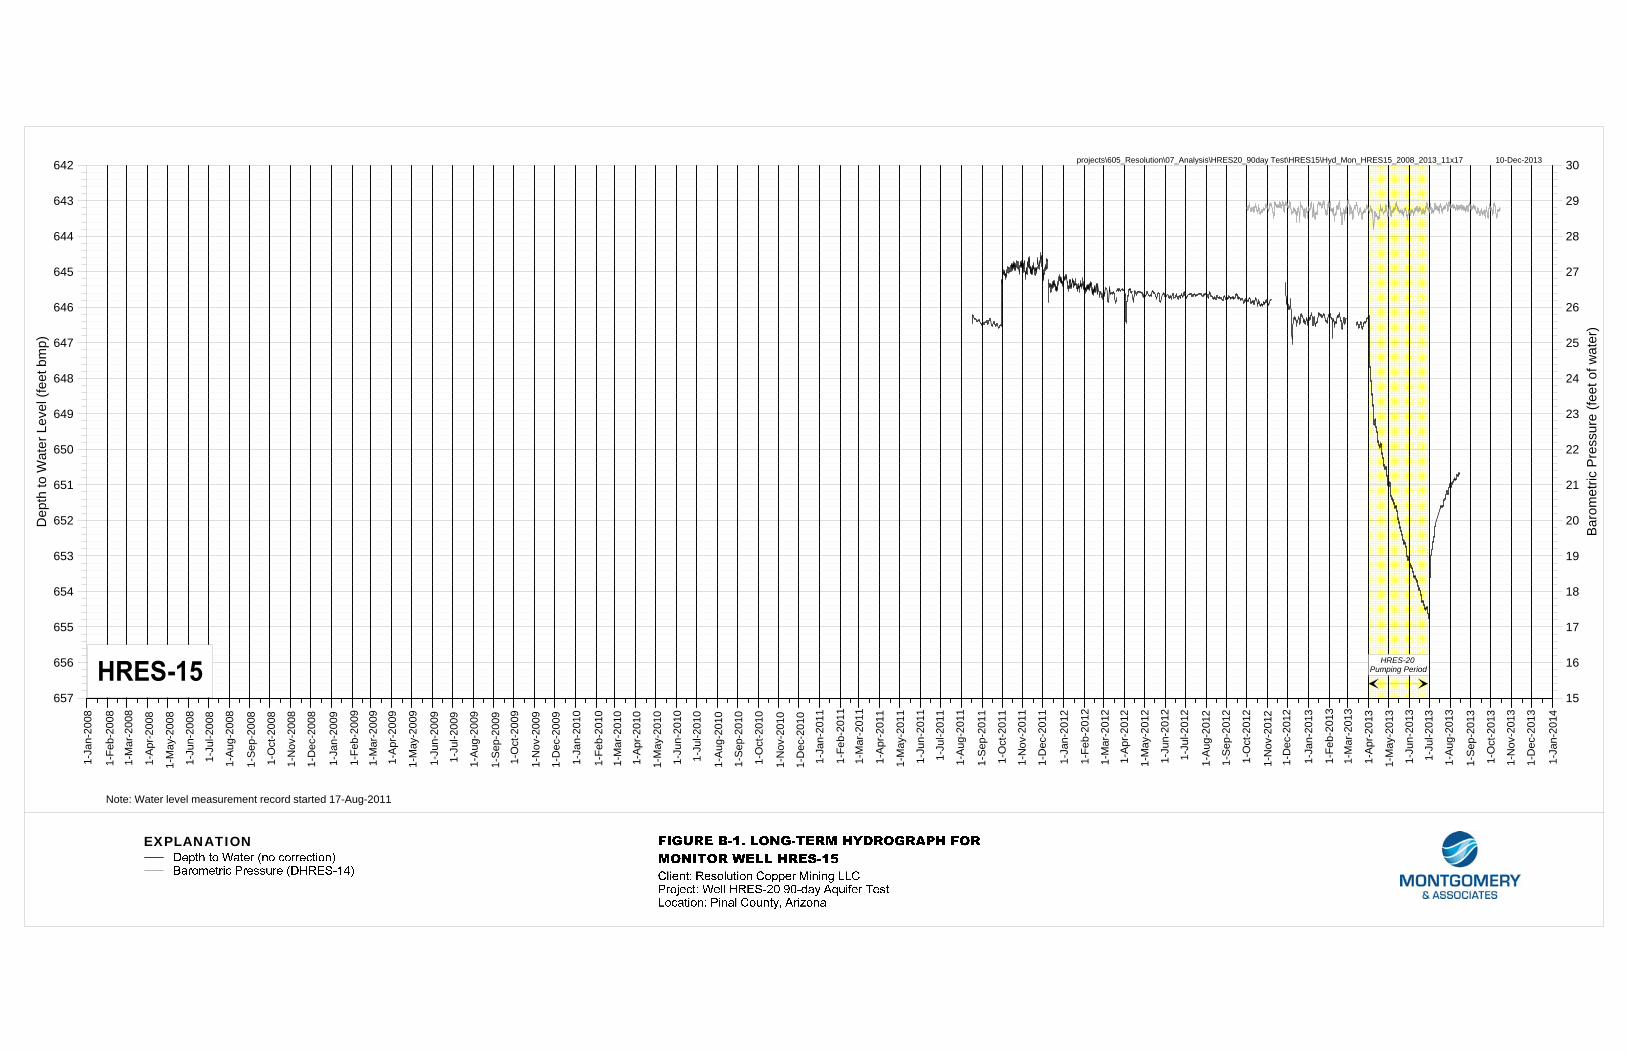
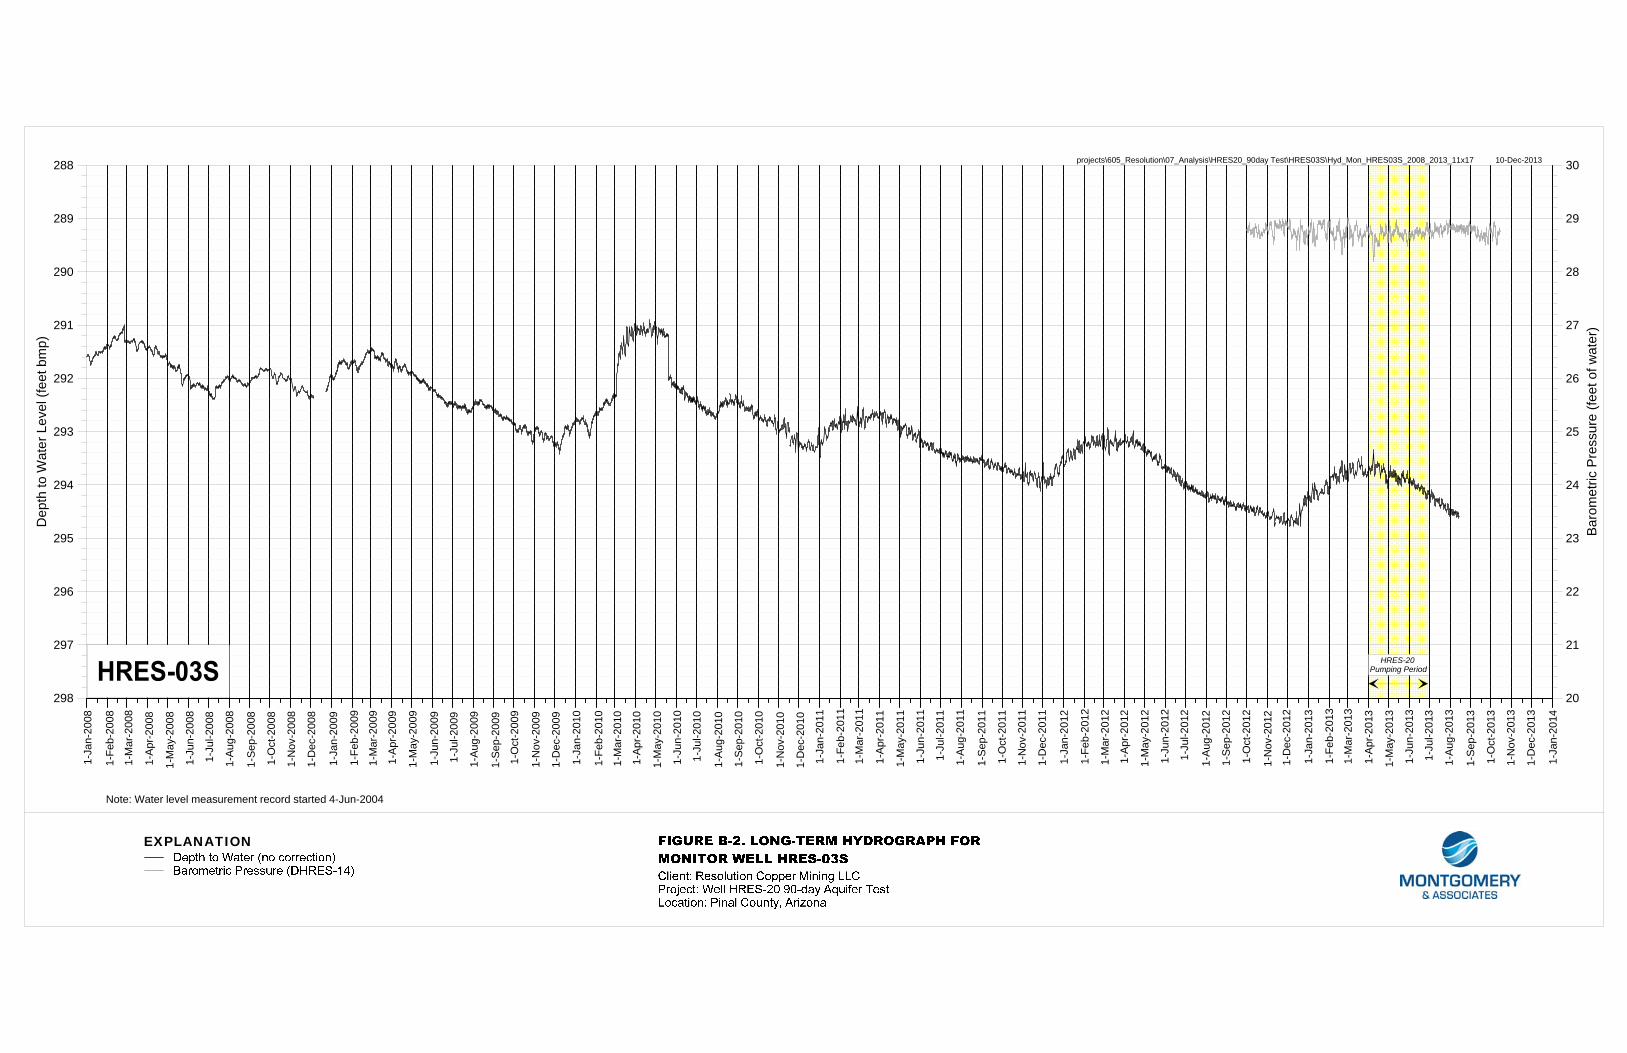
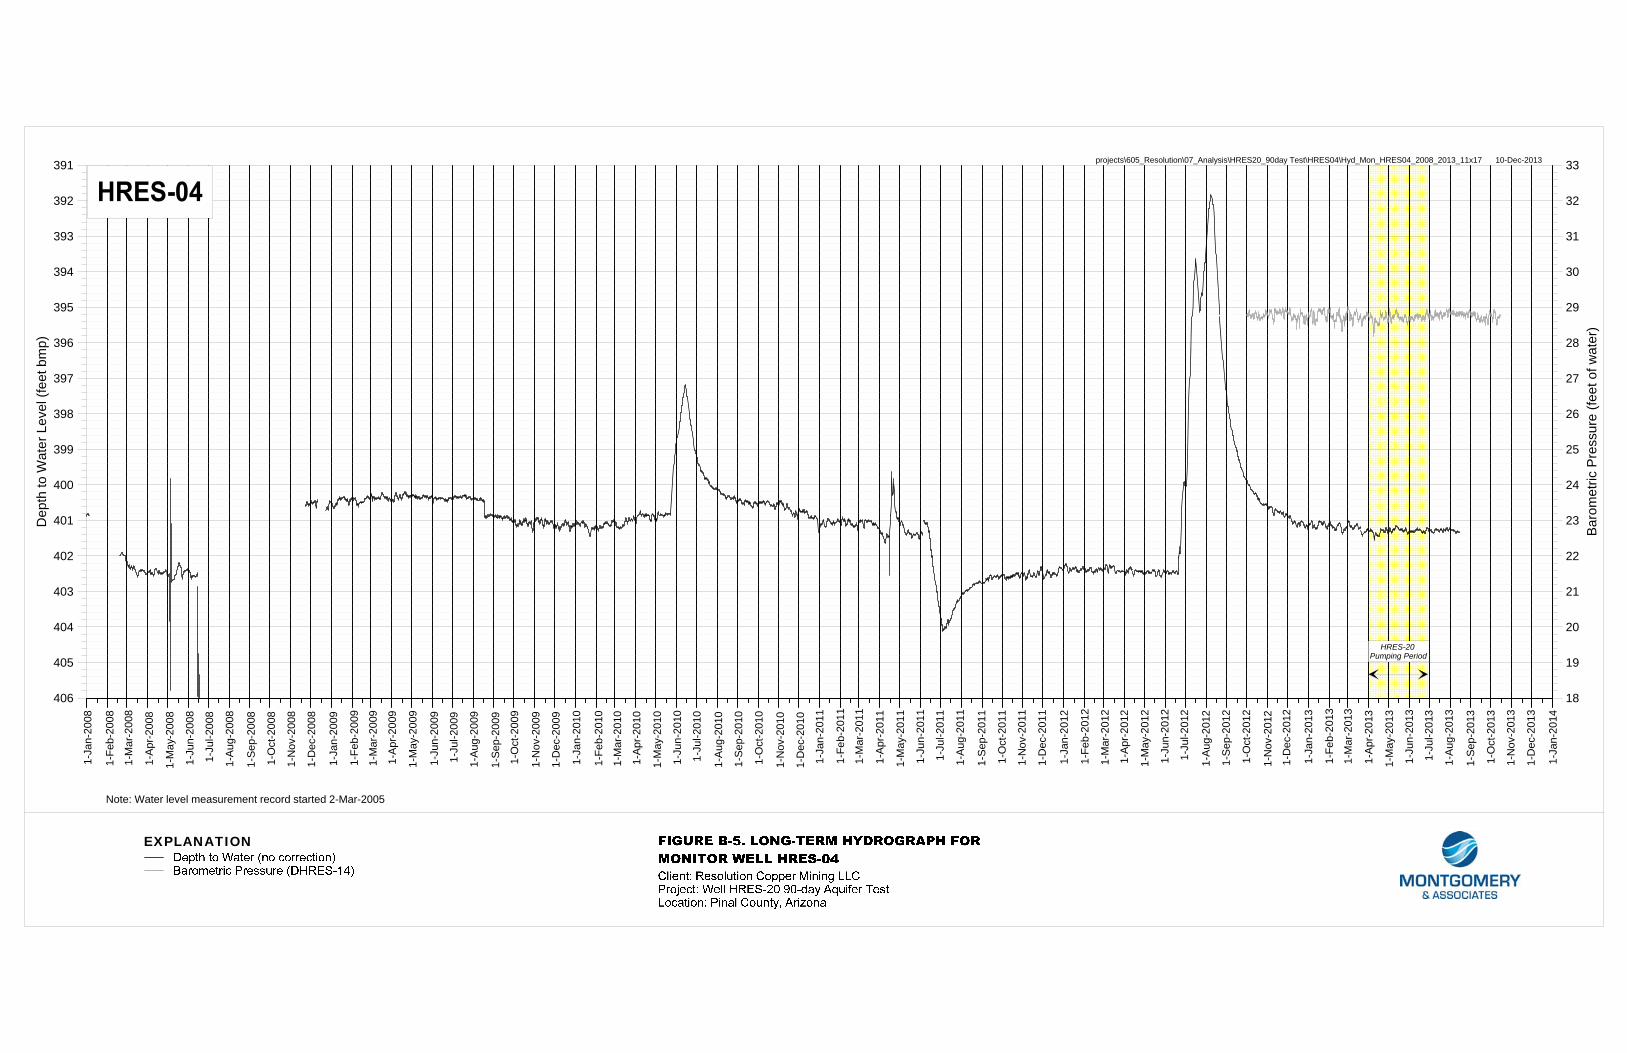
A hydrograph of water levels obtained at the pumped well is shown on Figure 2. The magnitude of drawdown at other wells in response to pumping are summarized in Table 1. Hydrographs of water levels obtained at the pumped well and observation wells during the testing period are provided in Appendix A. Long-term hydrographs for wells are provided in Appendix B.
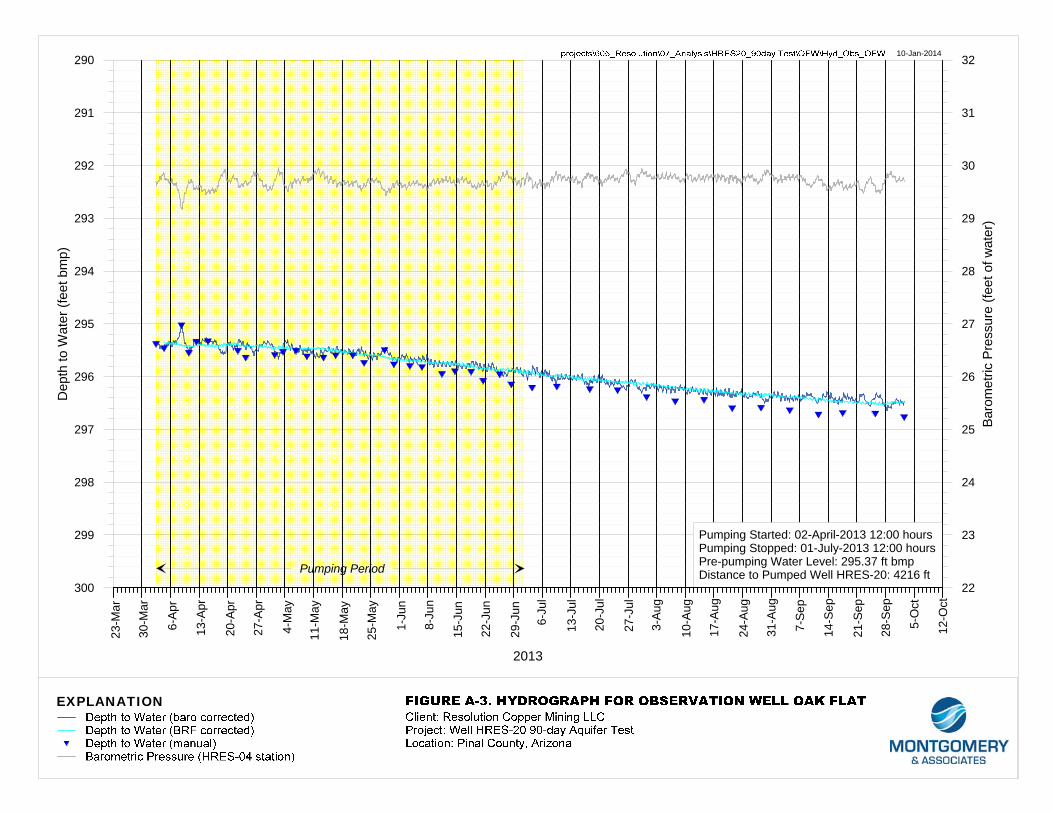
The long-term hydrographs were used to assess possible antecedent water level trends which could mask or distort drawdown response in observation wells. The long-term hydrographs were compiled from RCM’s AcQuire database for months to years prior to the start of the pumping period. Several hydrographs exhibited a well-defined antecedent water level trend prior to pumping. When judged appropriate, these trends were then used to correct water level data in order to analyze the water level data for discernible water level change due to pumping at well HRES-20. For DHRES-14_1071, a linear water level was used to approximate observed pre-test water level decline. This trend was removed to correct data during the drawdown and recovery periods.
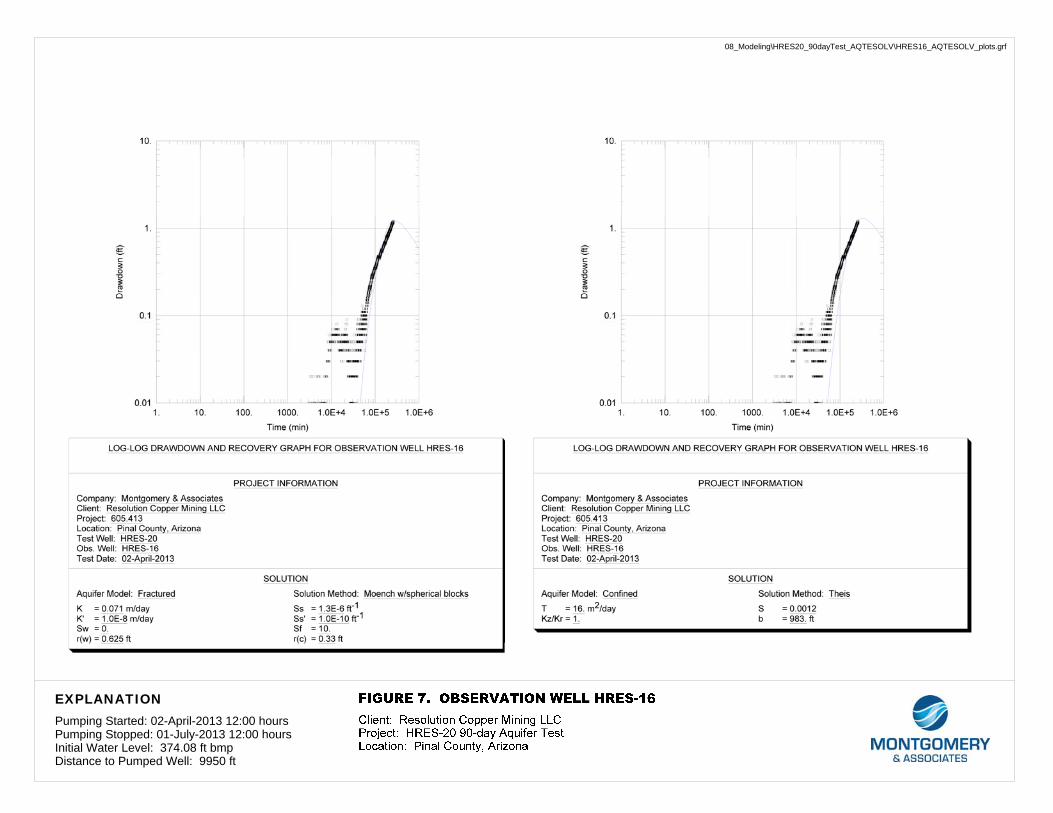
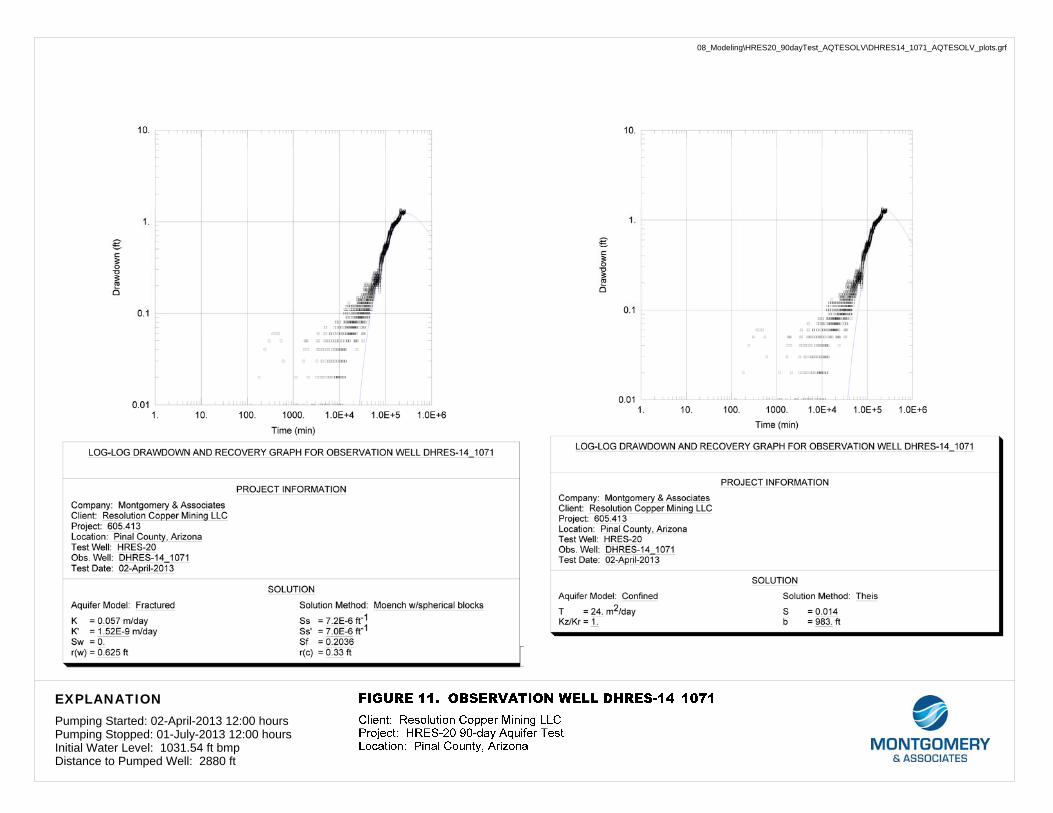
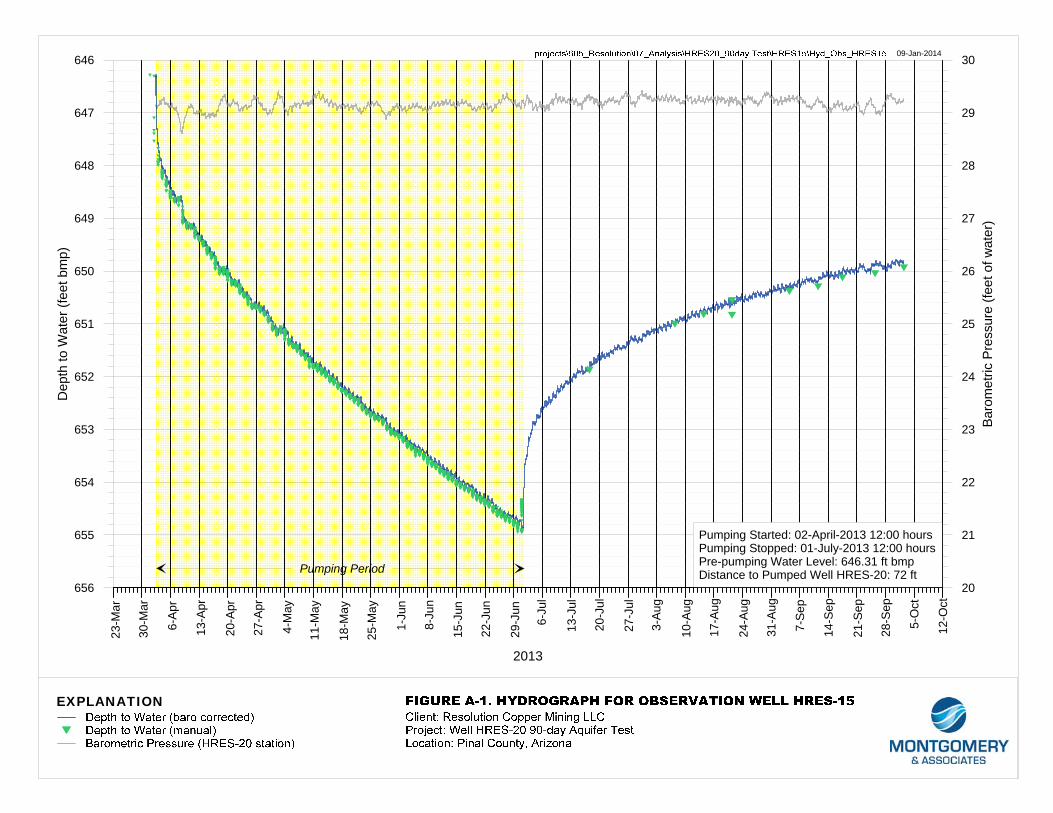
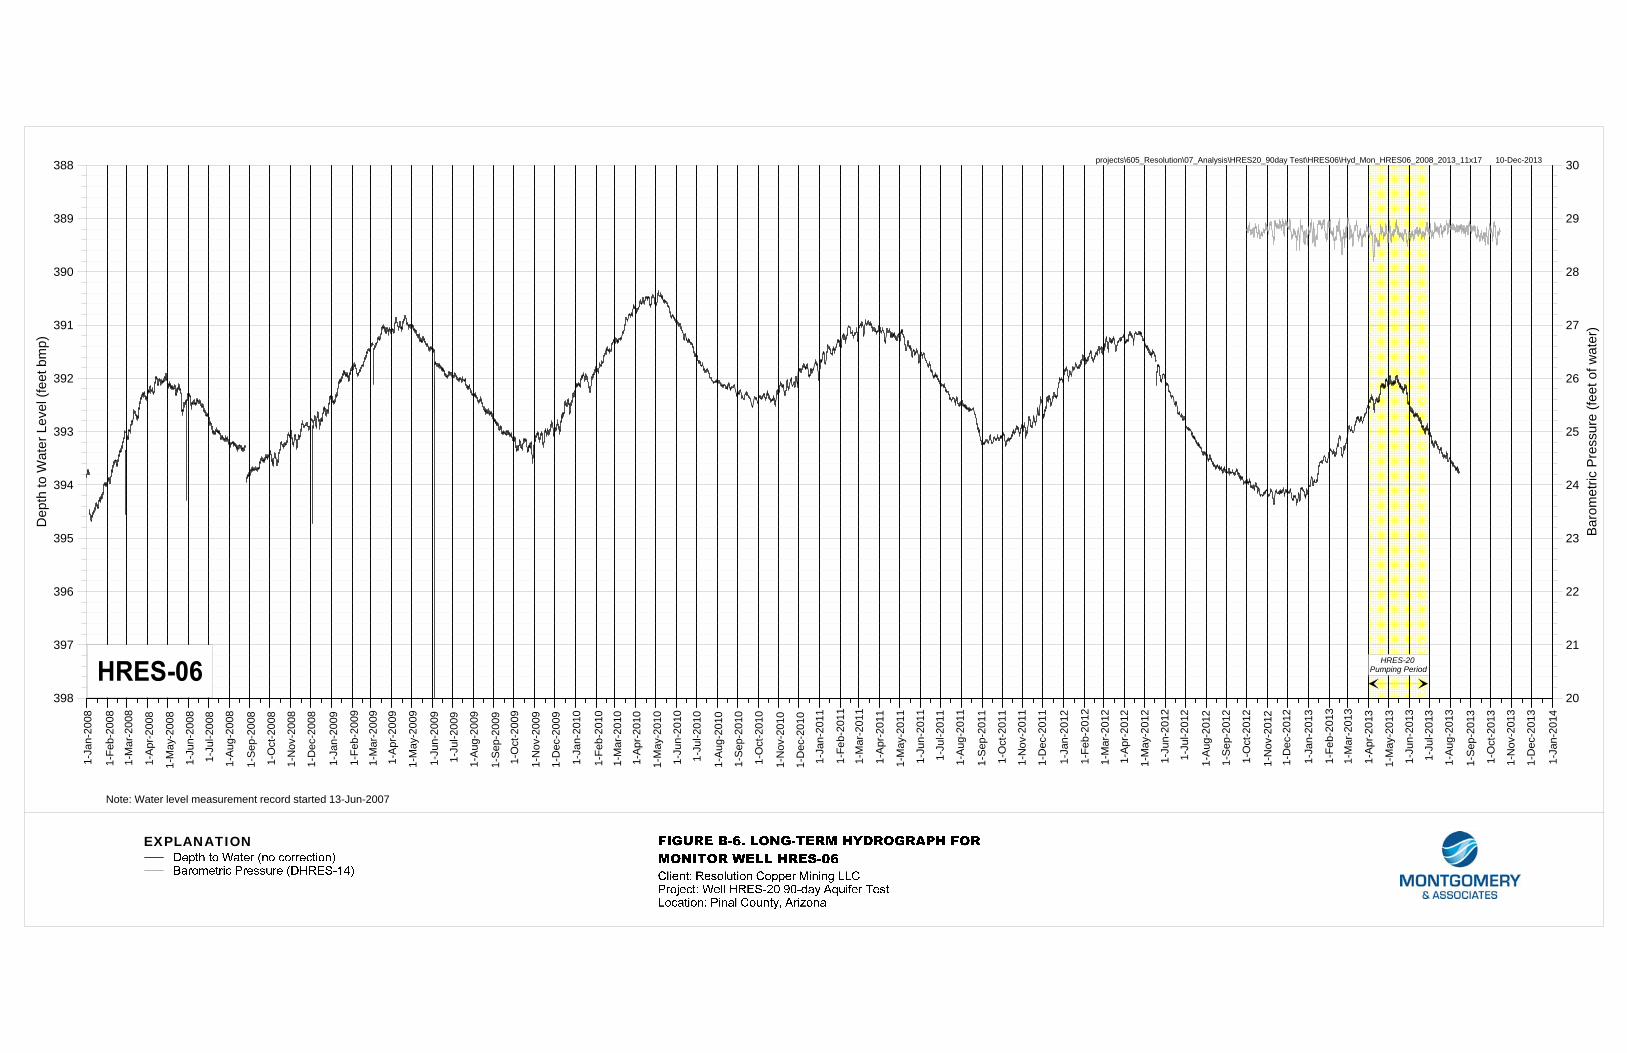
Barometric pressure measurements obtained at various stations is included on the hydrographs. Barometric corrections were computed for a majority of the hydrographs using a Barometric Response Function technique described by Butler and others (2011). Discernible water level response at observation wells due to pumping at well HRES-20 was evident in the following wells: HRES-15, HRES-14, HRES-16, A-06, HRES-07, MJ-11, and grouted piezometer DHRES-14_1071. Drawdown at observation wells at the end of pumping ranged from 0.34 feet at HRES-07 to 8.52 feet at HRES-15 (Table 1; Figure 2).
Analytical Methods and Results
A semi-log drawdown and recovery graph for pumped well HRES-20 is shown on Figure 3, together with transmissivity estimates using the Cooper-Jacob drawdown method (Cooper and Jacob, 1946) and Theis recovery method (Theis, 1935). Shape of drawdown graph suggests delayed yield or dual-porosity type aquifer (Bourdet, 2002).
Page 5
Using the analytical modeling program AQTESOLV (HydroSOLVE, 2008), a variety of diagnostic flow plots were examined to help determine a conceptual model of the flow regime at HRES-20. Diagnostic techniques and observations are tabulated below:
Graphical
Representation
Diagnostic Observation
Indicated Flow Characteristic
Log s vs. log t Derivative plateau Infinite-acting radial flow
Log s vs. log t Early-time unit slope in drawdown plot Wellbore storage
Log s vs. log t Concave upward in derivative plot during mid-time Delayed drainage or dual-porosity
Log s vs. log t1/2 Early-time unit slope Infinite conductive fracture
Log s vs. log t1/2 Late-time unit slope Channel or strip aquifer (aquifer between two parallel no-flow boundaries)
Log s vs. log t1/4 Early-time unit slope Bilinear flow (finite conductive fracture in infinite slab reservoir)
Log s vs. log t1/4 Late-time unit slope Bilinear flow (channel or strip aquifer with leakage from boundaries)
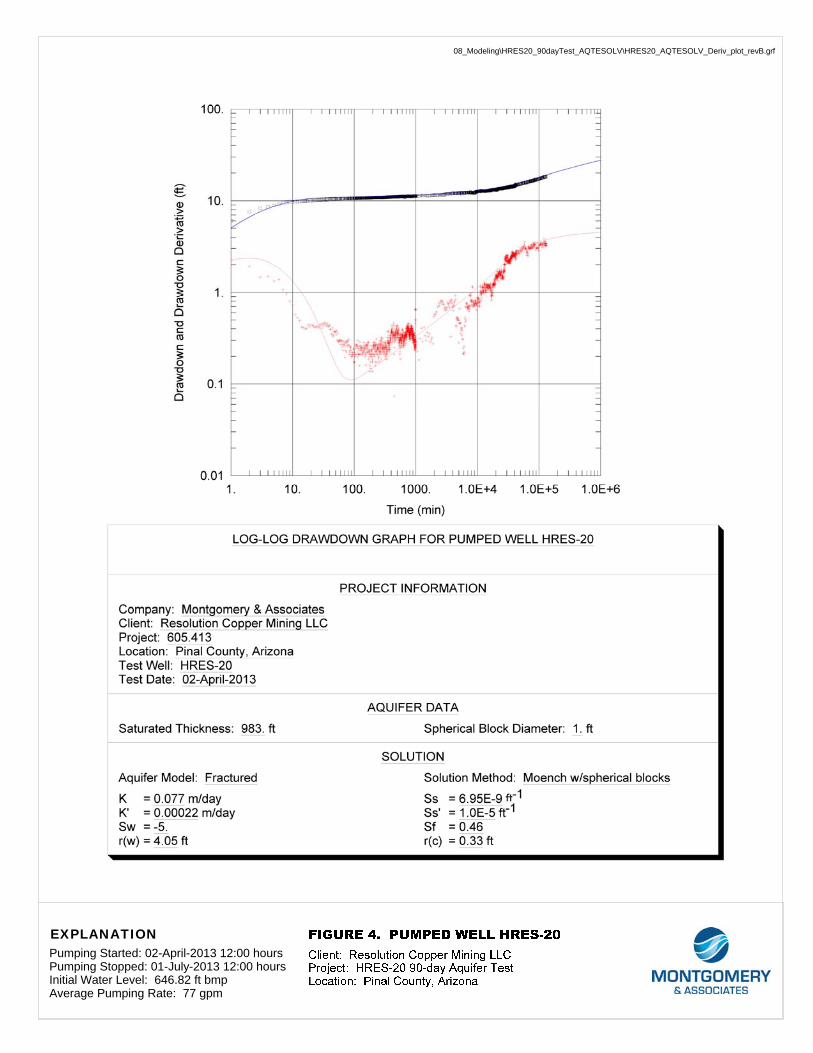
s vs. log t Constant slope at late time Infinite-acting radial flow (Cooper-Jacob) s = drawdown t = time elapsed since start of pumping Figure 4 shows a diagnostic plot of the logarithmic drawdown (s) and the derivative of drawdown (δs/δlogt) as a function of logarithmic time elapsed since the beginning of the test (t) for pumped well HRES-20. The well response is dominated by wellbore storage for the first several minutes of the pumping period. Between approximately 50 and 500 minutes the drawdown trend flattens and there is a valley in the derivative plot. This behavior is consistent with delayed gravity response of an unconfined aquifer or with dual-porosity response of a fractured rock aquifer containing fracture and matrix permeability (Renard and others, 2008). Appropriate analytical techniques include Neuman (1974) and Moench (1997) delayed response methods, and Moench (1984 and 1988) dual-porosity method. All three of these techniques were compared during preliminary analysis.
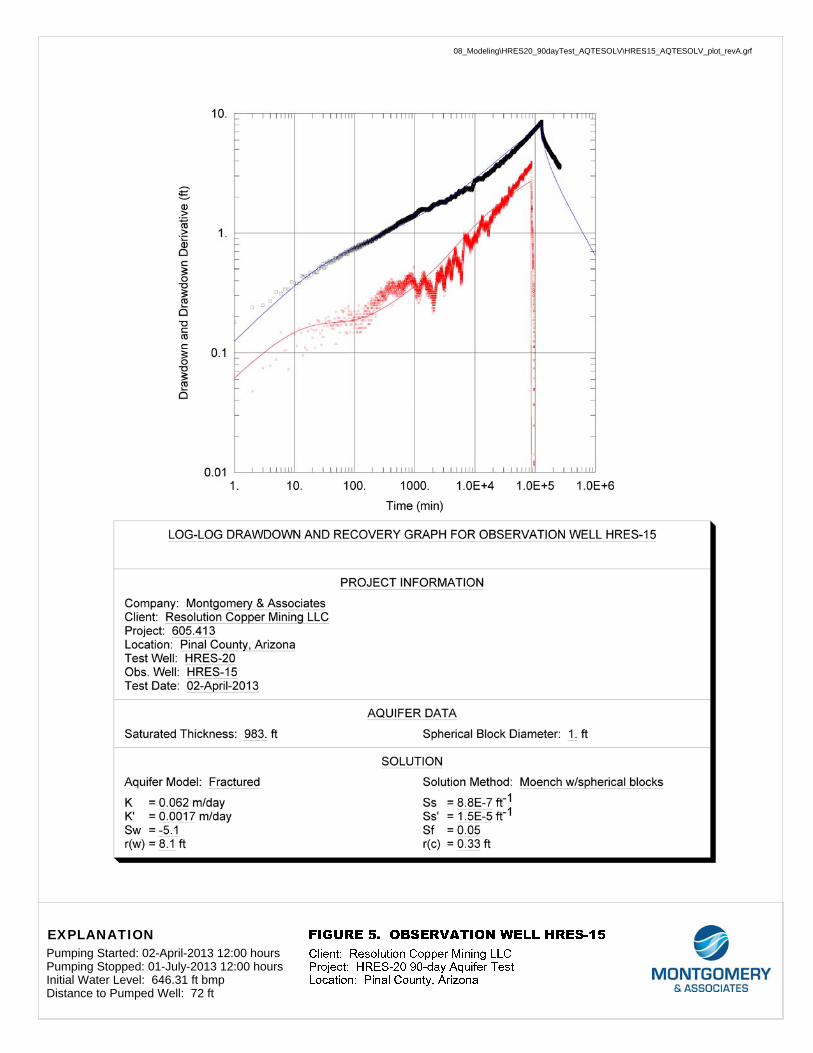
Figure 5 shows a similar diagnostic plot for nearby observation well HRES-15. The derivative plateau at intermediate time indicates infinite-acting radial flow; at late-time the drawdown and derivative curves attain 1:2 slope indicative of linear flow in a channel or bounded aquifer. Accurate analysis of flow plots and drawdown derivatives for the other observation wells at much larger distances from the pumped well requires a much longer duration of pumping, but generally the plots follow infinite acting radial flow characteristics.
The Moench (1984) dual-porosity model gave the best fit to the pumped well and nearby observation well response. The analytical method accounts for unsteady flow to a well with wellbore storage and wellbore skin in a fractured-rock aquifer assuming slab or
Page 6
spherical matrix blocks and fracture skin. It includes partially penetrating wells and anisotropy based on the solution by Dougherty and Babu (1984). The solution also includes delayed response in an observation well based on the work of Moench (1997).
Parameters and units used in the Moench (1984) solution include the following:
• Hydraulic Conductivity of fractures and rock matrix (K and K’) in m/d
• Specific Storage of fractures and rockmatrix (Ss and Ss’) in feet-1
• Aquifer Thickness (b) in feet; set to 983 feet, equivalent to the thickness of the ALT aquifer at well HRES-15
• Thickness of slab blocks or diameter of spherical blocks in feet
• Well radius and casing radius, r(w) and r(c), in feet
• Fitting parameters for wellbore and fracture skin (Sf and Sw); dimensionless
• Fitting parameters for spherical block diameter, in feet; set equivalent to 1 foot
For analysis of HRES-20 aquifer test data, all parameters were held constant for all analyses except for K, K’, Ss, and Ss’. Constant parameters were set as follows:
• For pumped well and all observation wells, well radius r(w) was set identical to drilled borehole radius.
• For pumped well HRES-20, well radius r(w) was allowed to vary larger than drilled diameter. This was done to allow better match of early time drawdown and drawdown derivative data, which are strongly influenced by wellbore storage. The improved match using a larger radius for the pumped well is commonly observed in fractured rock aquifers and may indicate the presence of open fractures of limited volume that are in good hydraulic communication with the pumped well. For all observation wells, casing radius r(c) was set identical to installed casing radius.
• For pumped well and all observation wells, the fitting parameter for wellbore and fracture skin was allowed to vary to improve matches to type curves.
Log-log drawdown and recovery graphs for the pumped well and each analyzed observation well and piezometer are shown on Figures 4 through 11. Hydraulic parameters derived from the 90-day aquifer test at HRES-20 are summarized in Table 2. In addition to showing dual-porosity graphical analysis (Moench, 1984), the graphs and tabulations include semi-log analysis of late time drawdown and recovery for the pumped well (Cooper and Jacob, 1946; Theis, 1935), as well as log-log analysis of drawdown and recovery for distant wells (Theis, 1935).
9 MONTGOMERY & ASSOCIATES

Page 7
Conclusions
Maximum drawdown at the pumped well and observation wells is shown on Figure 1. Drawdown response is strongly N-S asymmetric following the pattern of faulting along Devils Canyon. The lack of observed response at observation wells E-W indicates the presence of hydraulic boundaries or a change in aquifer parameters. A bounded or channel aquifer response is apparent in the diagnostic flow analysis for nearby observation well HRES-15, which is consistent with the conceptual hydrogeologic model of the area (e.g., a fractured rock aquifer between two parallel no-flow or low permeable boundaries).
Using dual-porosity analytical methods, analysis of water level response at HRES-20 and observation points indicates a geometric average hydraulic conductivity of about 0.079 m/day (0.26 ft/d). Using an aquifer thickness equivalent to the penetration at well HRES-15 of 983 feet, transmissivity averages 24 m2/d (258 ft2/d). Using single-porosity, infinite-acting radial flow analytical methods for the distant observation wells, the geometric average of transmissivity is also 24 m2/d (258 ft2/d). These estimates are similar to previous testing in the ALT aquifer in the vicinity of HRES-09 (M&A, 2012).
Specific storage is estimated to range from 4.2E-07 to 1.5E-05 1/ft; using an aquifer thickness equivalent to the penetration at well HRES-15 of 983 feet, storativity ranges from about 4.1E-04 to 1.5E-02 (dimensionless). The smaller of these values was obtained at a distant observation wells and is indicative of the elastic response of the aquifer; the larger value was obtained at a nearby observation wells and is indicative of specific yield of the aquifer and long-term drainable porosity value.
During the late time pumping period at the pumped well, approximately t >60,000 minutes or about 40 days, an infinite-acting radial flow period dominates the time-drawdown data and the computed transmissivity using conventional single-porosity analytical methods is similar to the transmissivity computed using dual-porosity methods (Figures 3 and 4). The transition period prior to this time occurs when groundwater begins to flow from the matrix to the fractures but has not yet reached a state of equilibrium.
At wells north and south from pumped well, and at distances equivalent to or greater than the distance from HRES-14 (i.e., 5,987 feet), aquifer parameters derived analytical methods based on a dual-porosity or single-porosity model are similar. This suggests that water level changes in the ALT aquifer, at these distances and during the time period and rate of pumping at HRES-20, follow an equivalent porous medium response rather than a fractured medium response to reach a state of equilibrium. Furthermore, it is likely in the north-south orientation, an integrated and fairly extensive fracture system associated with Devils Canyon faulting exists in the ALT aquifer.
9 MONTGOMERY & ASSOCIATES

Page 8
References
Bourdet, D., 2002, Well Test Analysis: The Use of Advanced Interpretation Models: Elsevier, New York, 426 p.
Butler, J.J., Jr., W. Jin, G. Mohammed, and E.C. Reboulet, 2011, New insights from well
responses to fluctuations in barometric pressure: Ground Water, 49(4), pp. 525-533.
Cooper, H.H., Jr., and Jacob, C.E., 1946, A generalized graphical method for evaluating
formation constants and summarizing well-field history: in American Geophysical Union Transactions, 27:IV, pp. 526–534.
Dougherty, D.E and D.K. Babu, 1984, Flow to a partially penetrating well in a double-
porosity reservoir: Water Resources Research, vol. 20, no. 8, pp. 1116-1122. HydroSOLVE, Inc., 2008, AQTESOLV for Windows 95/98/NT/2000/XP/Vista:
HydroSOLVE, Inc., Reston, Virginia, version 4.50.004 – Professional. Moench, A.F., 1984, Double-porosity models for a fissured groundwater reservoir with
fracture skin: Water Resources Research, vol. 20, no. 7, pp. 831-846. _____, 1988, The response of partially penetrating wells to pumpage from double-porosity
aquifers: Proceedings of the International Conference on Fluid Flow in Fractured Rocks, Atlanta, GA, May 16-18, 1988.
_____, 1997, Flow to a well of finite diameter in a homogeneous, anisotropic water-table
aquifer: Water Resources Research, vol. 33, no. 6, pp. 1397-1407. Montgomery & Associates, 2012, Results and analysis of 23-day aquifer test at well
HRES-09, Resolution Copper Mining, Pinal County, Arizona: technical memorandum prepared for Resolution Copper Mining, January 26, 2012.
Neuman, S.P., 1974. Effect of partial penetration on flow in unconfined aquifers
considering delayed gravity response, Water Resources Research, vol. 10, no. 2, pp. 303-312.
Renard, P., Glenz, D., and Mejias, M. 2008, Understanding diagnostic plots for well-test
interpretation: Hydrogeology Journal, published online November 20, 2008, doi:10.1007/s10040-008-0392-0.
Theis, C.V., 1935, The relation between the lowering of the piezometric surface and the
rate and duration of discharge of a well using groundwater storage, in American Geophysical Union Transactions, vol.16, pp. 519–524.
605.413/tm_ptHRES20_90day.docx/15Jan2014
9 MONTGOMERY & ASSOCIATES

Tables
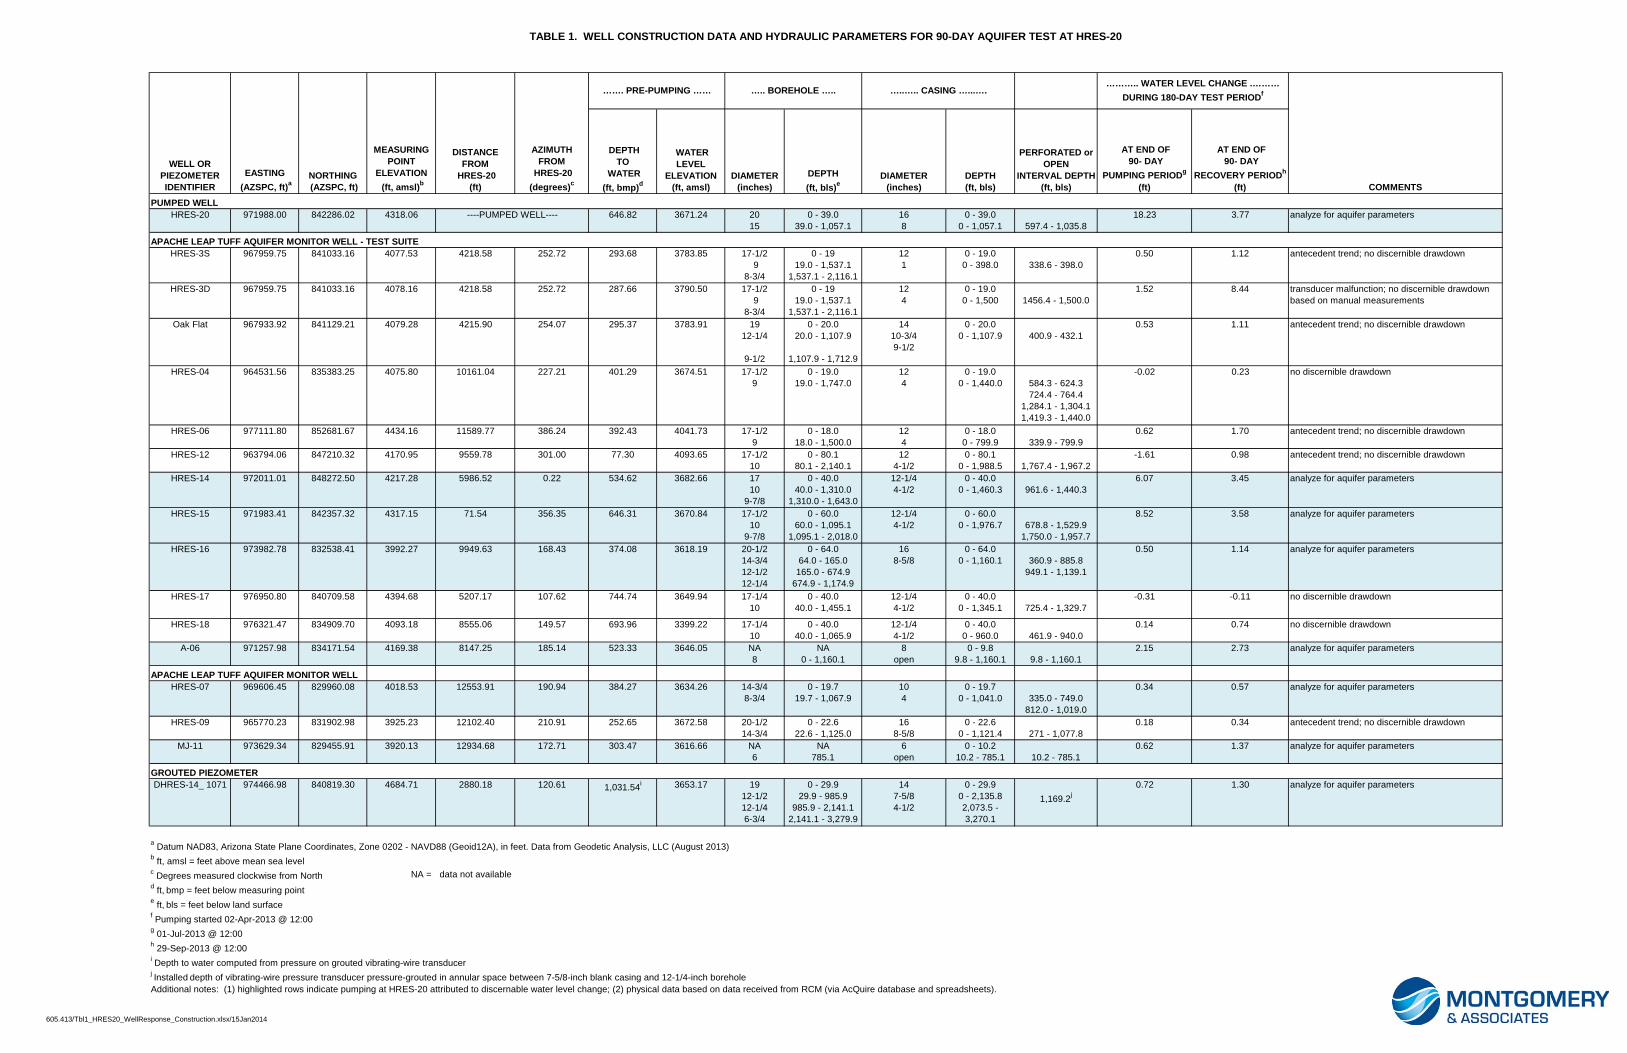
TABLE 1. WELL CONSTRUCTION DATA AND HYDRAULIC PARAMETERS FOR 90-DAY AQUIFER TEST AT HRES-20
DEPTH TO
WATER (ft, bmp)d
WATER LEVEL
ELEVATION (ft, amsl)
DIAMETER(inches)
DEPTH(ft, bls)e
DIAMETER(inches)
DEPTH(ft, bls)
PERFORATED or OPEN
INTERVAL DEPTH(ft, bls)
AT END OF 90- DAY
PUMPING PERIODg
(ft)
AT END OF 90- DAY
RECOVERY PERIODh
(ft)PUMPED WELL
HRES-20 971988.00 842286.02 4318.06 646.82 3671.24 2015
0 - 39.039.0 - 1,057.1
168
0 - 39.00 - 1,057.1 597.4 - 1,035.8
18.23 3.77 analyze for aquifer parameters
APACHE LEAP TUFF AQUIFER MONITOR WELL - TEST SUITEHRES-3S 967959.75 841033.16 4077.53 4218.58 252.72 293.68 3783.85 17-1/2
98-3/4
0 - 1919.0 - 1,537.1
1,537.1 - 2,116.1
121
0 - 19.00 - 398.0 338.6 - 398.0
0.50 1.12 antecedent trend; no discernible drawdown
HRES-3D 967959.75 841033.16 4078.16 4218.58 252.72 287.66 3790.50 17-1/2 9
8-3/4
0 - 1919.0 - 1,537.1
1,537.1 - 2,116.1
124
0 - 19.00 - 1,500 1456.4 - 1,500.0
1.52 8.44 transducer malfunction; no discernible drawdown based on manual measurements
Oak Flat 967933.92 841129.21 4079.28 4215.90 254.07 295.37 3783.91 1912-1/4
9-1/2
0 - 20.020.0 - 1,107.9
1,107.9 - 1,712.9
1410-3/49-1/2
0 - 20.00 - 1,107.9 400.9 - 432.1
0.53 1.11 antecedent trend; no discernible drawdown
HRES-04 964531.56 835383.25 4075.80 10161.04 227.21 401.29 3674.51 17-1/29
0 - 19.019.0 - 1,747.0
124
0 - 19.00 - 1,440.0 584.3 - 624.3
724.4 - 764.41,284.1 - 1,304.11,419.3 - 1,440.0
-0.02 0.23 no discernible drawdown
HRES-06 977111.80 852681.67 4434.16 11589.77 386.24 392.43 4041.73 17-1/29
0 - 18.018.0 - 1,500.0
124
0 - 18.00 - 799.9 339.9 - 799.9
0.62 1.70 antecedent trend; no discernible drawdown
HRES-12 963794.06 847210.32 4170.95 9559.78 301.00 77.30 4093.65 17-1/210
0 - 80.180.1 - 2,140.1
124-1/2
0 - 80.10 - 1,988.5 1,767.4 - 1,967.2
-1.61 0.98 antecedent trend; no discernible drawdown
HRES-14 972011.01 848272.50 4217.28 5986.52 0.22 534.62 3682.66 1710
9-7/8
0 - 40.040.0 - 1,310.0
1,310.0 - 1,643.0
12-1/44-1/2
0 - 40.00 - 1,460.3 961.6 - 1,440.3
6.07 3.45 analyze for aquifer parameters
HRES-15 971983.41 842357.32 4317.15 71.54 356.35 646.31 3670.84 17-1/210
9-7/8
0 - 60.060.0 - 1,095.1
1,095.1 - 2,018.0
12-1/44-1/2
0 - 60.00 - 1,976.7 678.8 - 1,529.9
1,750.0 - 1,957.7
8.52 3.58 analyze for aquifer parameters
HRES-16 973982.78 832538.41 3992.27 9949.63 168.43 374.08 3618.19 20-1/214-3/412-1/212-1/4
0 - 64.064.0 - 165.0
165.0 - 674.9674.9 - 1,174.9
168-5/8
0 - 64.00 - 1,160.1 360.9 - 885.8
949.1 - 1,139.1
0.50 1.14 analyze for aquifer parameters
HRES-17 976950.80 840709.58 4394.68 5207.17 107.62 744.74 3649.94 17-1/410
0 - 40.040.0 - 1,455.1
12-1/44-1/2
0 - 40.00 - 1,345.1 725.4 - 1,329.7
-0.31 -0.11 no discernible drawdown
HRES-18 976321.47 834909.70 4093.18 8555.06 149.57 693.96 3399.22 17-1/410
0 - 40.040.0 - 1,065.9
12-1/44-1/2
0 - 40.00 - 960.0 461.9 - 940.0
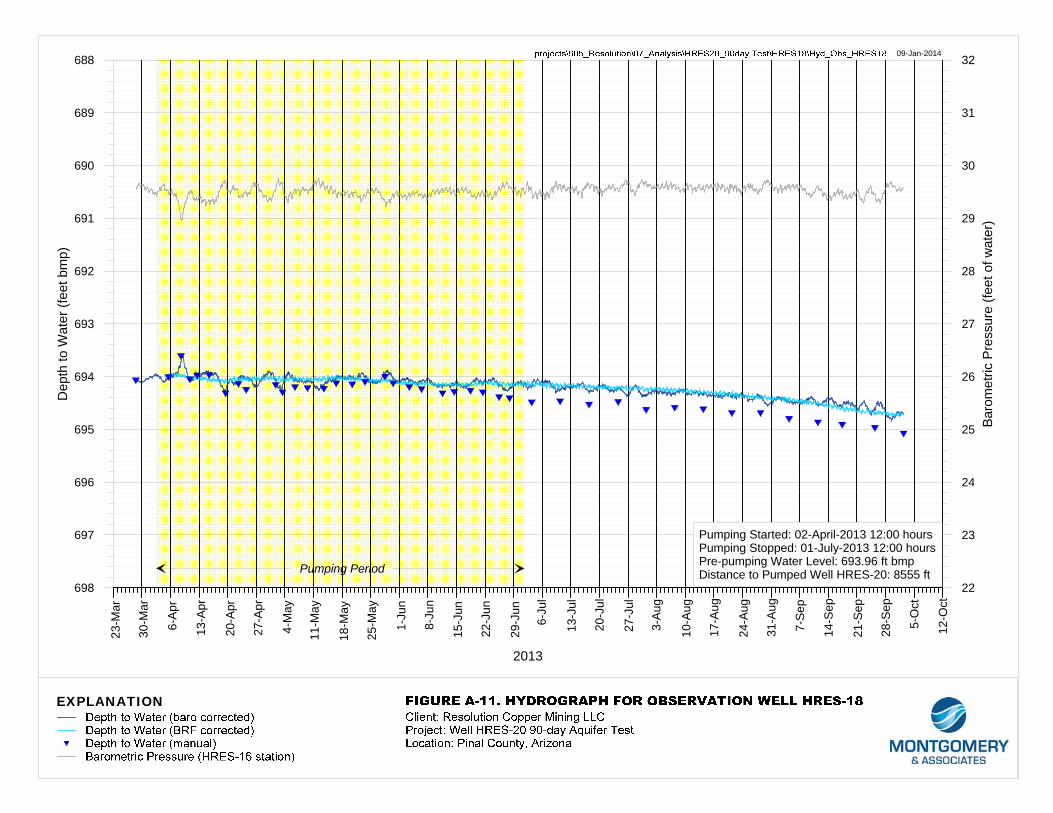
0.14 0.74 no discernible drawdown
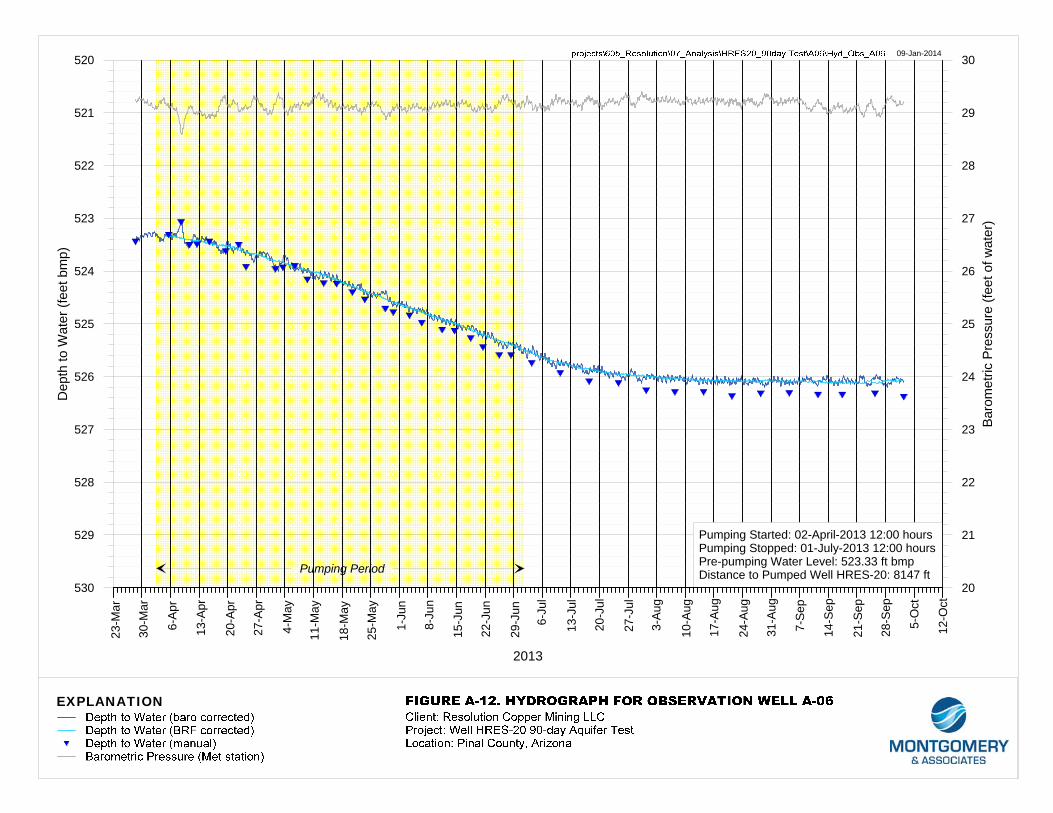
A-06 971257.98 834171.54 4169.38 8147.25 185.14 523.33 3646.05 NA8
NA0 - 1,160.1
8open
0 - 9.89.8 - 1,160.1 9.8 - 1,160.1
2.15 2.73 analyze for aquifer parameters
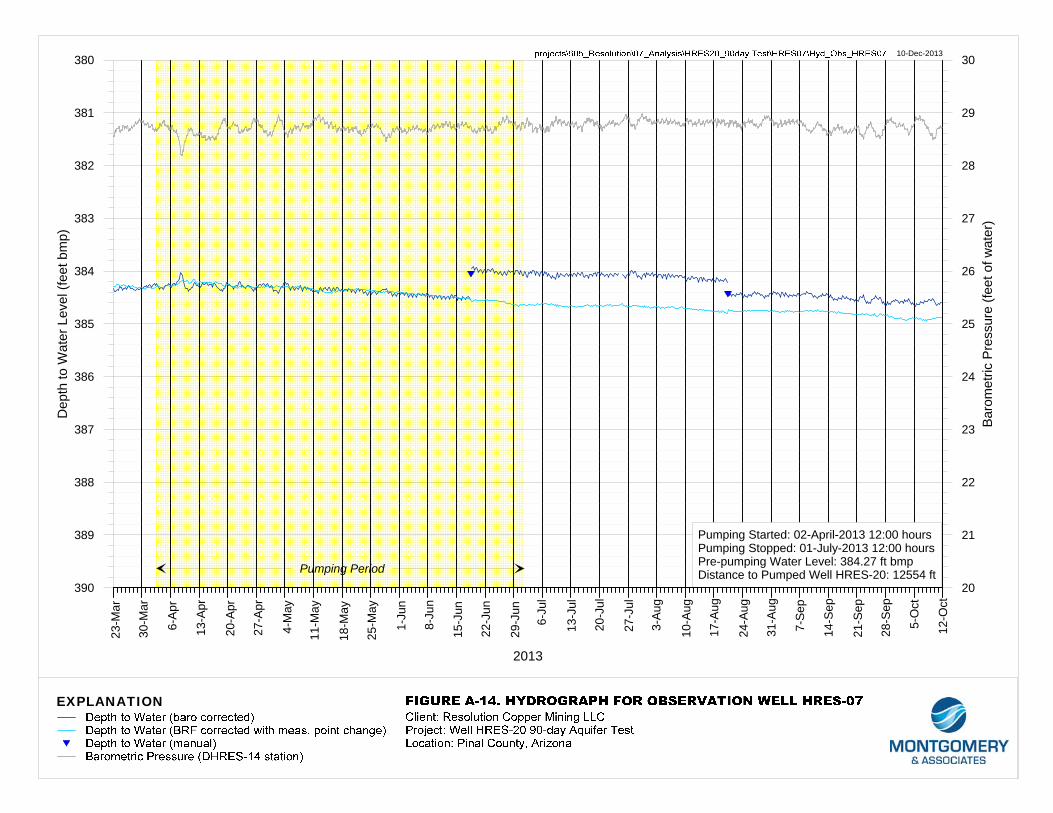
APACHE LEAP TUFF AQUIFER MONITOR WELLHRES-07 969606.45 829960.08 4018.53 12553.91 190.94 384.27 3634.26 14-3/4
8-3/4 0 - 19.7
19.7 - 1,067.9104
0 - 19.70 - 1,041.0 335.0 - 749.0
812.0 - 1,019.0
0.34 0.57 analyze for aquifer parameters
HRES-09 965770.23 831902.98 3925.23 12102.40 210.91 252.65 3672.58 20-1/214-3/4
0 - 22.622.6 - 1,125.0
168-5/8
0 - 22.60 - 1,121.4 271 - 1,077.8
0.18 0.34 antecedent trend; no discernible drawdown
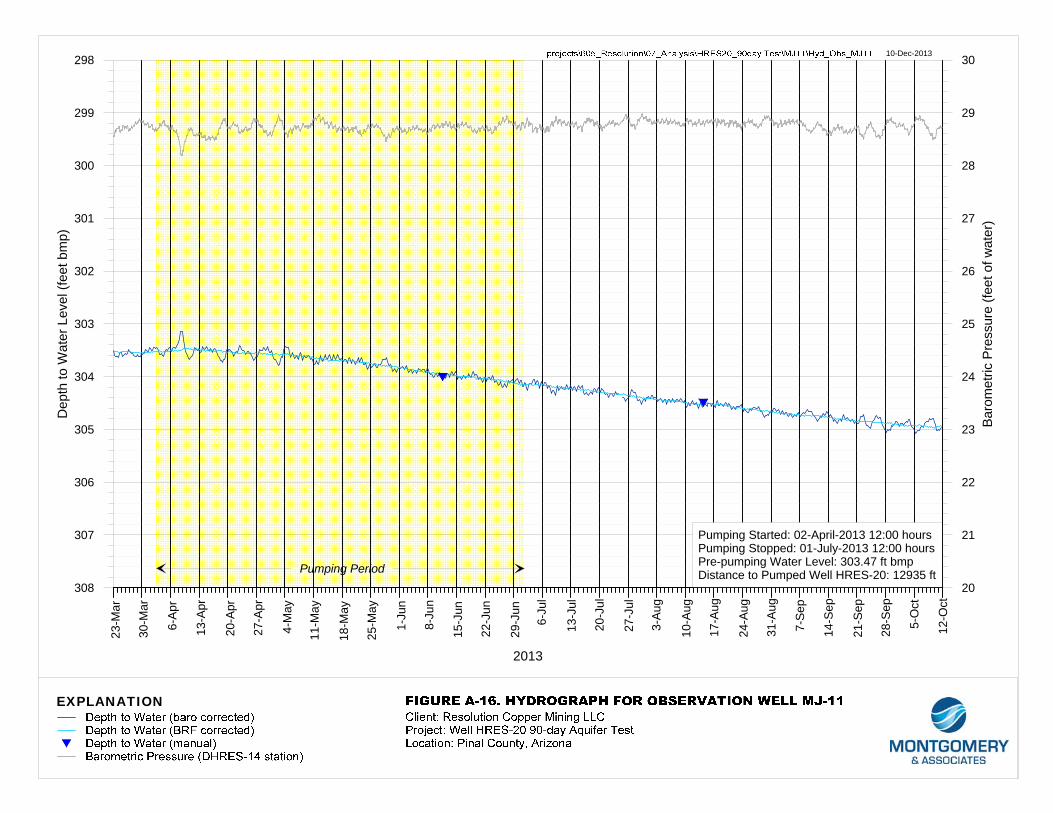
MJ-11 973629.34 829455.91 3920.13 12934.68 172.71 303.47 3616.66 NA6
NA785.1
6open
0 - 10.210.2 - 785.1 10.2 - 785.1
0.62 1.37 analyze for aquifer parameters
GROUTED PIEZOMETERDHRES-14_ 1071 974466.98 840819.30 4684.71 2880.18 120.61 1,031.54i 3653.17 19
12-1/212-1/46-3/4
0 - 29.929.9 - 985.9
985.9 - 2,141.12,141.1 - 3,279.9
147-5/84-1/2
0 - 29.90 - 2,135.82,073.5 - 3,270.1
1,169.2j0.72 1.30 analyze for aquifer parameters
a Datum NAD83, Arizona State Plane Coordinates, Zone 0202 - NAVD88 (Geoid12A), in feet. Data from Geodetic Analysis, LLC (August 2013)b ft, amsl = feet above mean sea levelc Degrees measured clockwise from North NA = data not availabled ft, bmp = feet below measuring pointe ft, bls = feet below land surfacef Pumping started 02-Apr-2013 @ 12:00g 01-Jul-2013 @ 12:00h 29-Sep-2013 @ 12:00i Depth to water computed from pressure on grouted vibrating-wire transducerj Installed depth of vibrating-wire pressure transducer pressure-grouted in annular space between 7-5/8-inch blank casing and 12-1/4-inch boreholeAdditional notes: (1) highlighted rows indicate pumping at HRES-20 attributed to discernable water level change; (2) physical data based on data received from RCM (via AcQuire database and spreadsheets).
----PUMPED WELL----
….. BOREHOLE ….. …..….. CASING …...….……. PRE-PUMPING …………….. WATER LEVEL CHANGE .………
DURING 180-DAY TEST PERIODf
COMMENTS
AZIMUTH FROM
HRES-20(degrees)c
WELL OR PIEZOMETER IDENTIFIER
EASTING (AZSPC, ft)a
NORTHING (AZSPC, ft)
MEASURING POINT
ELEVATION (ft, amsl)b
DISTANCE FROM
HRES-20(ft)
605.413/Tbl1_HRES20_WellResponse_Construction.xlsx/15Jan2014
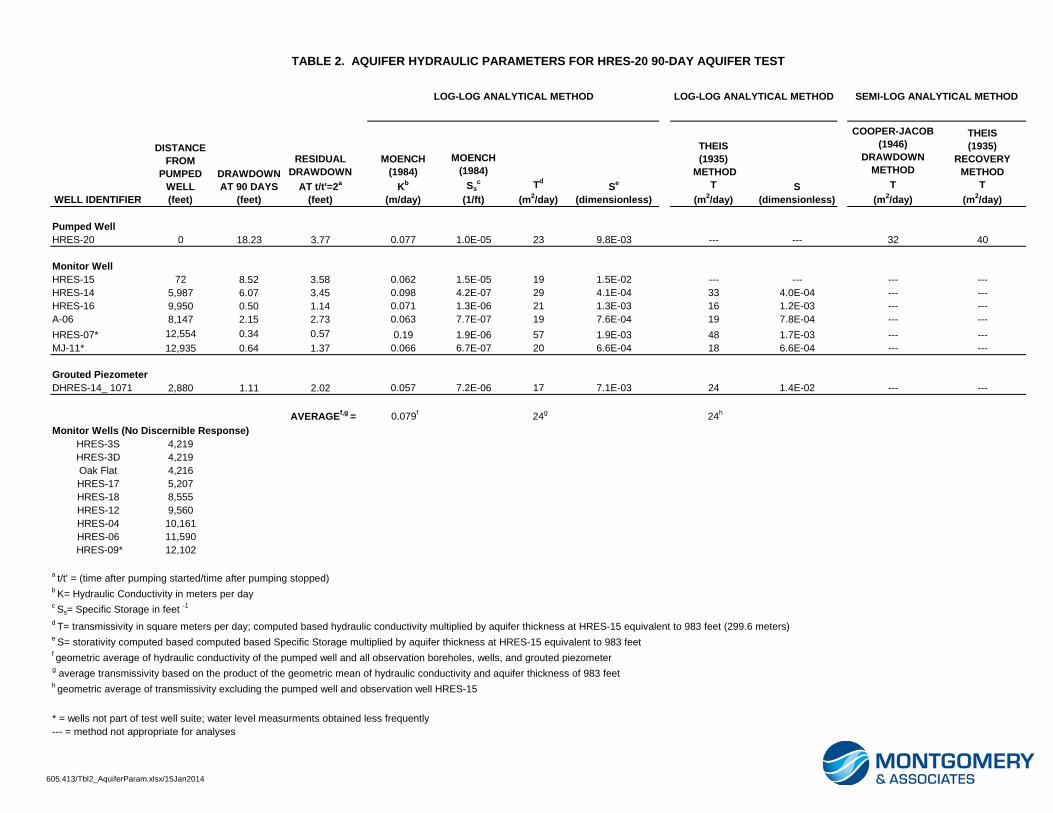
TABLE 2. AQUIFER HYDRAULIC PARAMETERS FOR HRES-20 90-DAY AQUIFER TEST
WELL IDENTIFIER
DISTANCE FROM
PUMPED WELL(feet)
DRAWDOWN AT 90 DAYS
(feet)
RESIDUAL DRAWDOWN
AT t/t'=2a
(feet)
MOENCH (1984)
Kb
(m/day)
MOENCH (1984)
Ssc
(1/ft)Td
(m2/day)Se
(dimensionless)
THEIS(1935)
METHODT
(m2/day)S
(dimensionless)
COOPER-JACOB (1946)
DRAWDOWN METHOD
T(m2/day)
THEIS(1935)
RECOVERY METHOD
T(m2/day)
Pumped WellHRES-20 0 18.23 3.77 0.077 1.0E-05 23 9.8E-03 --- --- 32 40
Monitor WellHRES-15 72 8.52 3.58 0.062 1.5E-05 19 1.5E-02 --- --- --- ---HRES-14 5,987 6.07 3.45 0.098 4.2E-07 29 4.1E-04 33 4.0E-04 --- ---HRES-16 9,950 0.50 1.14 0.071 1.3E-06 21 1.3E-03 16 1.2E-03 --- ---A-06 8,147 2.15 2.73 0.063 7.7E-07 19 7.6E-04 19 7.8E-04 --- ---HRES-07* 12,554 0.34 0.57 0.19 1.9E-06 57 1.9E-03 48 1.7E-03 --- ---MJ-11* 12,935 0.64 1.37 0.066 6.7E-07 20 6.6E-04 18 6.6E-04 --- ---
Grouted PiezometerDHRES-14_ 1071 2,880 1.11 2.02 0.057 7.2E-06 17 7.1E-03 24 1.4E-02 --- ---
AVERAGEf,g = 0.079f 24g 24h
Monitor Wells (No Discernible Response)HRES-3S 4,219HRES-3D 4,219Oak Flat 4,216HRES-17 5,207HRES-18 8,555HRES-12 9,560HRES-04 10,161HRES-06 11,590
HRES-09* 12,102
a t/t' = (time after pumping started/time after pumping stopped)b K= Hydraulic Conductivity in meters per dayc Ss= Specific Storage in feet -1
d T= transmissivity in square meters per day; computed based hydraulic conductivity multiplied by aquifer thickness at HRES-15 equivalent to 983 feet (299.6 meters)e S= storativity computed based computed based Specific Storage multiplied by aquifer thickness at HRES-15 equivalent to 983 feetf geometric average of hydraulic conductivity of the pumped well and all observation boreholes, wells, and grouted piezometerg average transmissivity based on the product of the geometric mean of hydraulic conductivity and aquifer thickness of 983 feeth geometric average of transmissivity excluding the pumped well and observation well HRES-15
* = wells not part of test well suite; water level measurments obtained less frequently--- = method not appropriate for analyses
SEMI-LOG ANALYTICAL METHODLOG-LOG ANALYTICAL METHOD LOG-LOG ANALYTICAL METHOD
605.413/Tbl2_AquiferParam.xlsx/15Jan2014

Illustrations
13
27
32
24
17
36
29
21
16
34
28
35
2220
14
26
33
23
25
15 18
19
31
01
30
010205 04 0306
19
30
18
31
!.
!.
!.
!.
!.
!.!.
!.
!.!.
!.
!.
!.
!.
!.
!.
!.
!.
!.
!.!.
"/
Devils Canyon
Queen
Creek
Pinal County
CanyonHackberry
1,600
Oak Flat
JI Ranch
(- - -)
HRES-12(6.07)
HRES-15
(1.11) (- - -)
(- - -)
(- - -)(- - -)
(- - -)
(2.15)
(0.50)
(0.64)(0.34)
(- - -)(- - -)
(18.23)
4,300
4,200
4,100
4,400
4,500
4,000 4,600
3,800
4,700
3,700
4,800
4,900
3,600
5,000
3,500
5,100
3,400
3,300
5,200
5,300
5,4005,500
5,100
4,500
4,100
4,700
4,700
4,400
5,400
4,200
5,300
4,400
4,500
4,300
4,200
4,000
4,200
5,300
3,5004,1004,3
00
4,500
5,400
5,400
4,700
4,600
4,500
4,700
4,400
4,900
4,000
4,300
4,600
5,000
4,600
4,900
4,400
5,200
4,500
4,200
4,200
4,300
4,800
4,100
4,700
4,100
4,400
5,200
4,300
5,100
4,100
5,000
4,800
4,500
5,300
4,700
4,300
4,300
5,200
4,200
4,600
4,800
5,000
4,200
4,600
4,700
3,700
4,400
4,800
5,200
4,100
4,500
4,300
4,700
5,300
5,300
4,700
4,900
4,200
4,800
5,000
4,800
4,800
4,900
3,900
4,200
5,100
4,400
5,000
4,600
5,000
5,000
4,600
5,100
4,300
4,500
4,700
4,400
3,500
4,300
4,300
5,400
4,700
5,100
4,100
4,700
4,900
4,300
5,100
4,700
4,800
4,000
4,200
4,100
4,600
4,400
4,800
5,200
A-06
HRES-17
(- - -)
HRES-14
(8.52)
HRES-04
HRES-20
HRES-18
HRES-16
HRES-06
DHRES-14HRES-3D
Oak Flat
HRES-3S
MJ-11HRES-13
HRES-09
HRES-07HRES-05
HRES-02
HRES-01
Shaft 9
T. 1 S.
T. 2 S.
R. 12 E.
R. 12 E.
R. 13 E.
R. 13 E.
R. 14 E.
T. 1 S.
T. 2 S.
\GIS-Tuc\Projects\605\605.413\HRES20_pumptest.mxd\13Jan2014 StatePlane83USft.
*
*
*
*
*
*
*
FIGURE 1
2014
0 1,000 2,000 3,000 4,000 5,000 6,000
Feet
LOCATION MAPHRES-20 AQUIFER TEST
EXPLANATION
Deep Groundwater System Monitor Well withApache Leap Tuff Annular Grouted Piezometer
Watershed Boundary
Groundwater Monitoring Sites
Apache Leap Tuff Aquifer Monitor Well -Test Suite!.
!.
Geologic Units
Perennial Reach
Fault (Gant & Wilkins, Peterson, RCM)
Disturbed Surficial Deposits
Quaternary Alluvial Deposits
Quaternary-Tertiary Basin-Fill Deposits
Tertiary Younger Volcanic Rocks
Tertiary Apache Leap Tuff
Tertiary Older Volcanic Rocks
Tertiary Whitetail Conglomerate
Cretaceous-Tertiary IntrusivesPaleozoic Sedimentary RocksYounger Precambrian Sedimentary,Volcanic, and Intrusives RocksWillow Spring Granodiorite
Older Precambrian Pinal Schist
Apache Leap Tuff Aquifer Monitor Well !.
Shaft"/
Maximum Drawdown, in feetNo Discernible Drawdown Measured
(6.07)(- - -)

23-M
ar
30-M
ar
6-A
pr
13-A
pr
20-A
pr
27-A
pr
4-M
ay
11-M
ay
18-M
ay
25-M
ay
1-Ju
n
8-Ju
n
15-J
un
22-J
un
29-J
un
6-Ju
l
13-J
ul
20-J
ul
27-J
ul
3-A
ug
10-A
ug
17-A
ug
24-A
ug
31-A
ug
7-S
ep
14-S
ep
21-S
ep
28-S
ep
5-O
ct
12-O
ct
2013
12
13
14
15
16
17
18
19
20
21
22
23
24
25
26
27
28
29
30
31
32
Baro
met
ric P
ress
ure
(feet
of w
ater
)
666
665
664
663
662
661
660
659
658
657
656
655
654
653
652
651
650
649
648
647
646D
epth
to W
ater
Lev
el (f
eet b
mp)
EXPLANATION
Pumping Period
09-Jan-2014
Pumping Started: 02-April-2013 12:00 hoursPumping Stopped: 01-July-2013 12:00 hoursPre-pumping Water Level: 646.82 ft bmp

Pumping Started: 02-April-2013 12:00 hoursPumping Stopped: 01-July-2013 12:00 hoursInitial Water Level: 646.82 ft bmpAverage Pumping Rate: 77 gpm
08_Modeling\HRES20_90dayTest_AQTESOLV\HRES20_AQTESOLV_DDRCplots.grf
EXPLANATION
Pumping Started: 02-April-2013 12:00 hoursPumping Stopped: 01-July-2013 12:00 hoursInitial Water Level: 646.82 ft bmpAverage Pumping Rate: 77 gpm
08_Modeling\HRES20_90dayTest_AQTESOLV\HRES20_AQTESOLV_Deriv_plot_revB.grf
EXPLANATION
Pumping Started: 02-April-2013 12:00 hoursPumping Stopped: 01-July-2013 12:00 hoursInitial Water Level: 646.31 ft bmpDistance to Pumped Well: 72 ft
08_Modeling\HRES20_90dayTest_AQTESOLV\HRES15_AQTESOLV_plot_revA.grf
EXPLANATION
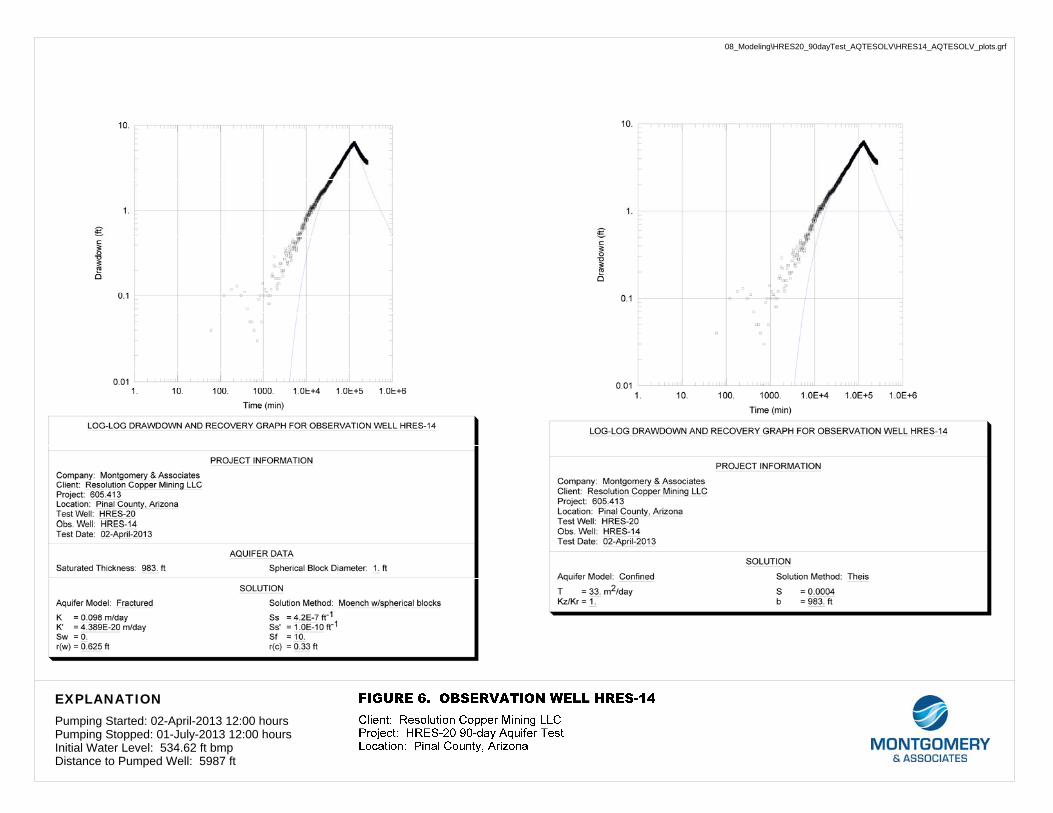
Pumping Started: 02-April-2013 12:00 hoursPumping Stopped: 01-July-2013 12:00 hoursInitial Water Level: 534.62 ft bmpDistance to Pumped Well: 5987 ft
08_Modeling\HRES20_90dayTest_AQTESOLV\HRES14_AQTESOLV_plots.grf
EXPLANATION
Pumping Started: 02-April-2013 12:00 hoursPumping Stopped: 01-July-2013 12:00 hoursInitial Water Level: 374.08 ft bmpDistance to Pumped Well: 9950 ft
08_Modeling\HRES20_90dayTest_AQTESOLV\HRES16_AQTESOLV_plots.grf
EXPLANATION

Pumping Started: 02-April-2013 12:00 hoursPumping Stopped: 01-July-2013 12:00 hoursInitial Water Level: 523.33 ft bmpDistance to Pumped Well: 8147 ft
08_Modeling\HRES20_90dayTest_AQTESOLV\A06_AQTESOLV_plots.grf
EXPLANATION

Pumping Started: 02-April-2013 12:00 hoursPumping Stopped: 01-July-2013 12:00 hoursInitial Water Level: 384.27 ft bmpDistance to Pumped Well: 12554 ft
08_Modeling\HRES20_90dayTest_AQTESOLV\HRES07_AQTESOLV_plots.grf
EXPLANATION
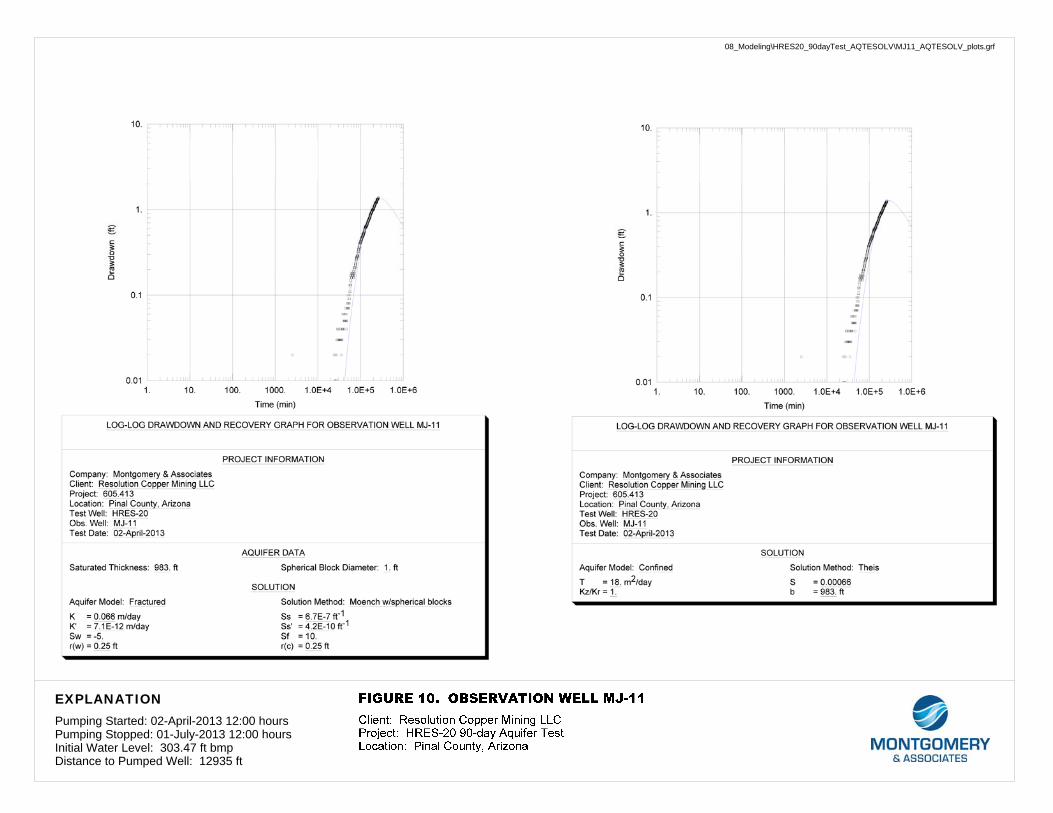
Pumping Started: 02-April-2013 12:00 hoursPumping Stopped: 01-July-2013 12:00 hoursInitial Water Level: 303.47 ft bmpDistance to Pumped Well: 12935 ft
08_Modeling\HRES20_90dayTest_AQTESOLV\MJ11_AQTESOLV_plots.grf
EXPLANATION
Pumping Started: 02-April-2013 12:00 hoursPumping Stopped: 01-July-2013 12:00 hoursInitial Water Level: 1031.54 ft bmpDistance to Pumped Well: 2880 ft
08_Modeling\HRES20_90dayTest_AQTESOLV\DHRES14_1071_AQTESOLV_plots.grf
EXPLANATION

Appendix A
Pumping Test Hydrographs
Well HRES-20 90-day Aquifer Test Resolution Copper Mining, Pinal County, Arizona
23-M
ar
30-M
ar
6-A
pr
13-A
pr
20-A
pr
27-A
pr
4-M
ay
11-M
ay
18-M
ay
25-M
ay
1-Ju
n
8-Ju
n
15-J
un
22-J
un
29-J
un
6-Ju
l
13-J
ul
20-J
ul
27-J
ul
3-A
ug
10-A
ug
17-A
ug
24-A
ug
31-A
ug
7-S
ep
14-S
ep
21-S
ep
28-S
ep
5-O
ct
12-O
ct
2013
20
21
22
23
24
25
26
27
28
29
30
Baro
met
ric P
ress
ure
(feet
of w
ater
)
656
655
654
653
652
651
650
649
648
647
646D
epth
to W
ater
(fee
t bm
p)
EXPLANATION
Pumping Period
09-Jan-2014
Pumping Started: 02-April-2013 12:00 hoursPumping Stopped: 01-July-2013 12:00 hoursPre-pumping Water Level: 646.31 ft bmpDistance to Pumped Well HRES-20: 72 ft

23-M
ar
30-M
ar
6-A
pr
13-A
pr
20-A
pr
27-A
pr
4-M
ay
11-M
ay
18-M
ay
25-M
ay
1-Ju
n
8-Ju
n
15-J
un
22-J
un
29-J
un
6-Ju
l
13-J
ul
20-J
ul
27-J
ul
3-A
ug
10-A
ug
17-A
ug
24-A
ug
31-A
ug
7-S
ep
14-S
ep
21-S
ep
28-S
ep
5-O
ct
12-O
ct
2013
22
23
24
25
26
27
28
29
30
31
32
Baro
met
ric P
ress
ure
(feet
of w
ater
)
298
297
296
295
294
293
292
291
290
289
288D
epth
to W
ater
(fee
t bm
p)
EXPLANATION
Pumping Period
09-Jan-2014
Pumping Started: 02-April-2013 12:00 hoursPumping Stopped: 01-July-2013 12:00 hoursPre-pumping Water Level: 293.68 ft bmpDistance to Pumped Well HRES-20: 4219 ft
23-M
ar
30-M
ar
6-A
pr
13-A
pr
20-A
pr
27-A
pr
4-M
ay
11-M
ay
18-M
ay
25-M
ay
1-Ju
n
8-Ju
n
15-J
un
22-J
un
29-J
un
6-Ju
l
13-J
ul
20-J
ul
27-J
ul
3-A
ug
10-A
ug
17-A
ug
24-A
ug
31-A
ug
7-S
ep
14-S
ep
21-S
ep
28-S
ep
5-O
ct
12-O
ct
2013
22
23
24
25
26
27
28
29
30
31
32
Baro
met
ric P
ress
ure
(feet
of w
ater
)
300
299
298
297
296
295
294
293
292
291
290D
epth
to W
ater
(fee
t bm
p)
EXPLANATION
Pumping Period
10-Jan-2014
Pumping Started: 02-April-2013 12:00 hoursPumping Stopped: 01-July-2013 12:00 hoursPre-pumping Water Level: 295.37 ft bmpDistance to Pumped Well HRES-20: 4216 ft
23-M
ar
30-M
ar
6-A
pr
13-A
pr
20-A
pr
27-A
pr
4-M
ay
11-M
ay
18-M
ay
25-M
ay
1-Ju
n
8-Ju
n
15-J
un
22-J
un
29-J
un
6-Ju
l
13-J
ul
20-J
ul
27-J
ul
3-A
ug
10-A
ug
17-A
ug
24-A
ug
31-A
ug
7-S
ep
14-S
ep
21-S
ep
28-S
ep
5-O
ct
12-O
ct
2013
25
26
27
28
29
30
31
32
33
34
35
Baro
met
ric P
ress
ure
(feet
of w
ater
)
297
296
295
294
293
292
291
290
289
288
287D
epth
to W
ater
(fee
t bm
p)
EXPLANATION
Pumping Period
09-Jan-2014
(?)
(?) Pressure Transducer Malfunction
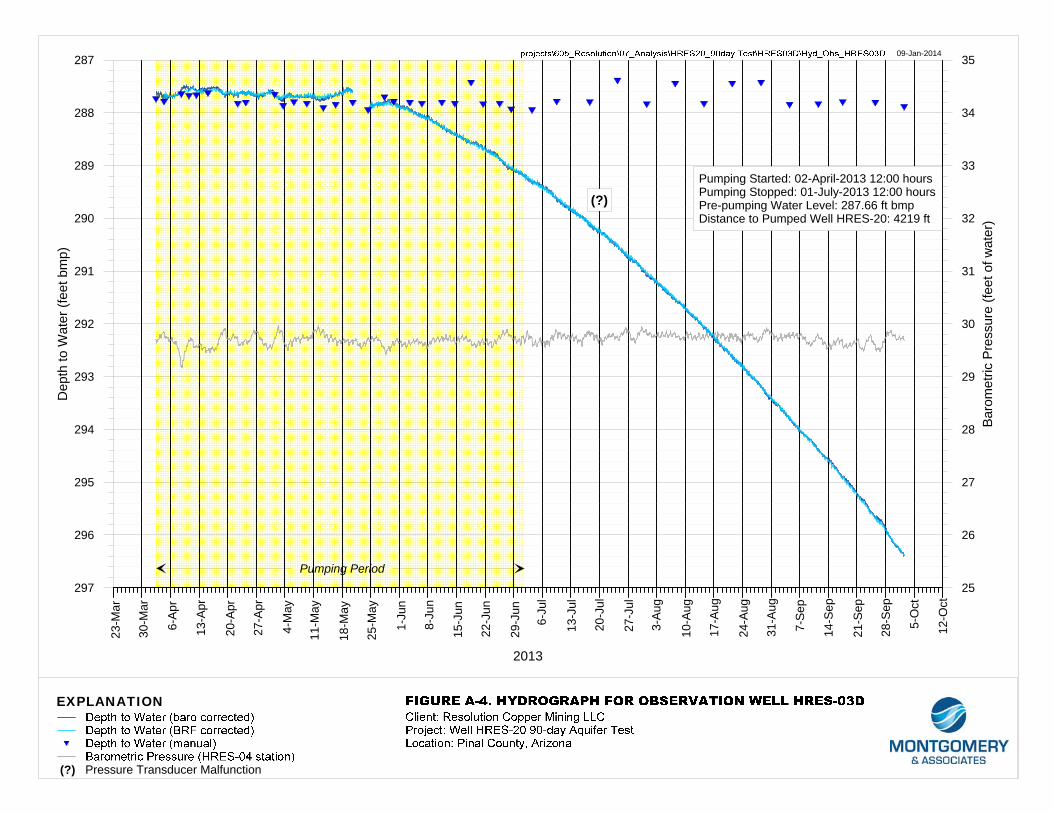
Pumping Started: 02-April-2013 12:00 hoursPumping Stopped: 01-July-2013 12:00 hoursPre-pumping Water Level: 287.66 ft bmpDistance to Pumped Well HRES-20: 4219 ft

23-M
ar
30-M
ar
6-A
pr
13-A
pr
20-A
pr
27-A
pr
4-M
ay
11-M
ay
18-M
ay
25-M
ay
1-Ju
n
8-Ju
n
15-J
un
22-J
un
29-J
un
6-Ju
l
13-J
ul
20-J
ul
27-J
ul
3-A
ug
10-A
ug
17-A
ug
24-A
ug
31-A
ug
7-S
ep
14-S
ep
21-S
ep
28-S
ep
5-O
ct
12-O
ct
2013
22
23
24
25
26
27
28
29
30
31
32
Baro
met
ric P
ress
ure
(feet
of w
ater
)
405
404
403
402
401
400
399
398
397
396
395D
epth
to W
ater
(fee
t bm
p)
EXPLANATION
Pumping Period
09-Jan-2014
Pumping Started: 02-April-2013 12:00 hoursPumping Stopped: 01-July-2013 12:00 hoursPre-pumping Water Level: 401.29 ft bmpDistance to Pumped Well HRES-20: 10161 ft

23-M
ar
30-M
ar
6-A
pr
13-A
pr
20-A
pr
27-A
pr
4-M
ay
11-M
ay
18-M
ay
25-M
ay
1-Ju
n
8-Ju
n
15-J
un
22-J
un
29-J
un
6-Ju
l
13-J
ul
20-J
ul
27-J
ul
3-A
ug
10-A
ug
17-A
ug
24-A
ug
31-A
ug
7-S
ep
14-S
ep
21-S
ep
28-S
ep
5-O
ct
12-O
ct
2013
20
21
22
23
24
25
26
27
28
29
30
Baro
met
ric P
ress
ure
(feet
of w
ater
)
398
397
396
395
394
393
392
391
390
389
388D
epth
to W
ater
(fee
t bm
p)
EXPLANATION
Pumping Period
09-Jan-2014
Pumping Started: 02-April-2013 12:00 hoursPumping Stopped: 01-July-2013 12:00 hoursPre-pumping Water Level: 392.43 ft bmpDistance to Pumped Well HRES-20: 11590 ft
23-M
ar
30-M
ar
6-A
pr
13-A
pr
20-A
pr
27-A
pr
4-M
ay
11-M
ay
18-M
ay
25-M
ay
1-Ju
n
8-Ju
n
15-J
un
22-J
un
29-J
un
6-Ju
l
13-J
ul
20-J
ul
27-J
ul
3-A
ug
10-A
ug
17-A
ug
24-A
ug
31-A
ug
7-S
ep
14-S
ep
21-S
ep
28-S
ep
5-O
ct
12-O
ct
2013
20
21
22
23
24
25
26
27
28
29
30
Baro
met
ric P
ress
ure
(feet
of w
ater
)
82
81
80
79
78
77
76
75
74
73
72D
epth
to W
ater
(fee
t bm
p)
EXPLANATION
Pumping Period
09-Jan-2014
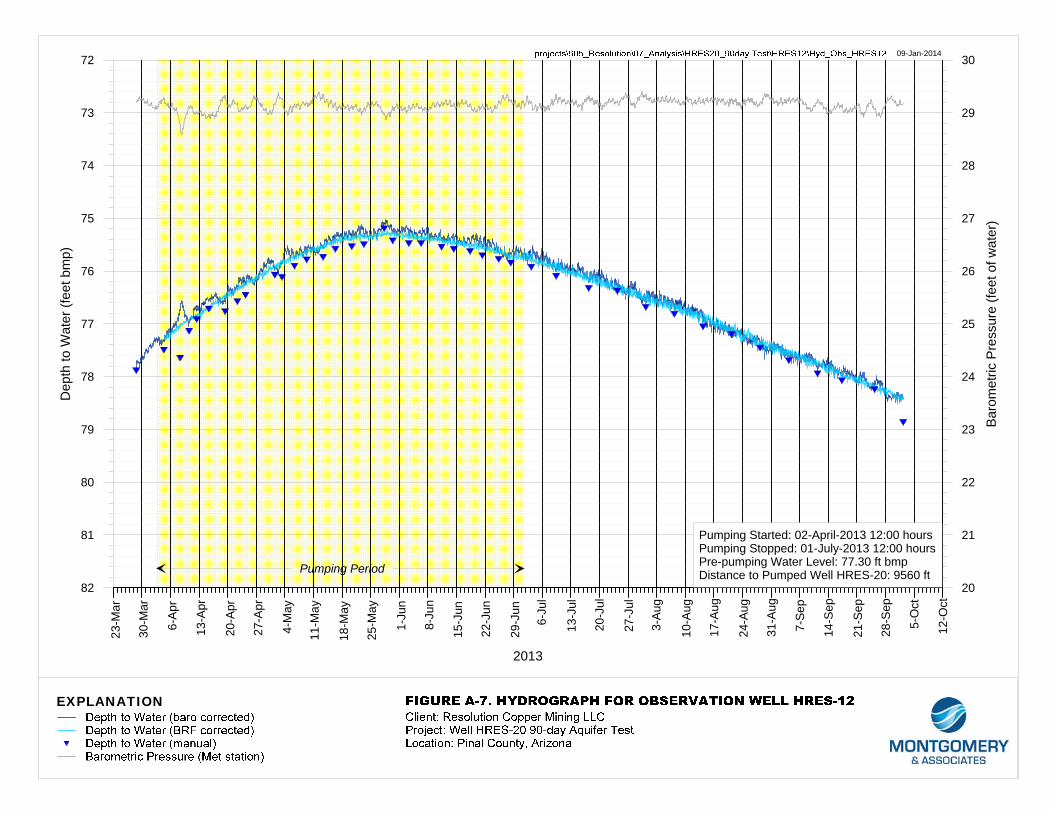
Pumping Started: 02-April-2013 12:00 hoursPumping Stopped: 01-July-2013 12:00 hoursPre-pumping Water Level: 77.30 ft bmpDistance to Pumped Well HRES-20: 9560 ft

23-M
ar
30-M
ar
6-A
pr
13-A
pr
20-A
pr
27-A
pr
4-M
ay
11-M
ay
18-M
ay
25-M
ay
1-Ju
n
8-Ju
n
15-J
un
22-J
un
29-J
un
6-Ju
l
13-J
ul
20-J
ul
27-J
ul
3-A
ug
10-A
ug
17-A
ug
24-A
ug
31-A
ug
7-S
ep
14-S
ep
21-S
ep
28-S
ep
5-O
ct
12-O
ct
2013
20
21
22
23
24
25
26
27
28
29
30
Baro
met
ric P
ress
ure
(feet
of w
ater
)
543
542
541
540
539
538
537
536
535
534
533D
epth
to W
ater
(fee
t bm
p)
EXPLANATION
Pumping Period
09-Jan-2014
Pumping Started: 02-April-2013 12:00 hoursPumping Stopped: 01-July-2013 12:00 hoursPre-pumping Water Level: 534.62 ft bmpDistance to Pumped Well HRES-20: 5987 ft

23-M
ar
30-M
ar
6-A
pr
13-A
pr
20-A
pr
27-A
pr
4-M
ay
11-M
ay
18-M
ay
25-M
ay
1-Ju
n
8-Ju
n
15-J
un
22-J
un
29-J
un
6-Ju
l
13-J
ul
20-J
ul
27-J
ul
3-A
ug
10-A
ug
17-A
ug
24-A
ug
31-A
ug
7-S
ep
14-S
ep
21-S
ep
28-S
ep
5-O
ct
12-O
ct
2013
22
23
24
25
26
27
28
29
30
31
32
Baro
met
ric P
ress
ure
(feet
of w
ater
)
380
379
378
377
376
375
374
373
372
371
370D
epth
to W
ater
(fee
t bm
p)
EXPLANATION
Pumping Period
09-Jan-2014
Pumping Started: 02-April-2013 12:00 hoursPumping Stopped: 01-July-2013 12:00 hoursPre-pumping Water Level: 374.08 ft bmpDistance to Pumped Well HRES-20: 9950 ft

23-M
ar
30-M
ar
6-A
pr
13-A
pr
20-A
pr
27-A
pr
4-M
ay
11-M
ay
18-M
ay
25-M
ay
1-Ju
n
8-Ju
n
15-J
un
22-J
un
29-J
un
6-Ju
l
13-J
ul
20-J
ul
27-J
ul
3-A
ug
10-A
ug
17-A
ug
24-A
ug
31-A
ug
7-S
ep
14-S
ep
21-S
ep
28-S
ep
5-O
ct
12-O
ct
2013
22
23
24
25
26
27
28
29
30
31
32
Baro
met
ric P
ress
ure
(feet
of w
ater
)
750
749
748
747
746
745
744
743
742
741
740D
epth
to W
ater
(fee
t bm
p)
EXPLANATION
Pumping Period
09-Jan-2014
Pumping Started: 02-April-2013 12:00 hoursPumping Stopped: 01-July-2013 12:00 hoursPre-pumping Water Level: 744.74 ft bmpDistance to Pumped Well HRES-20: 5207 ft
23-M
ar
30-M
ar
6-A
pr
13-A
pr
20-A
pr
27-A
pr
4-M
ay
11-M
ay
18-M
ay
25-M
ay
1-Ju
n
8-Ju
n
15-J
un
22-J
un
29-J
un
6-Ju
l
13-J
ul
20-J
ul
27-J
ul
3-A
ug
10-A
ug
17-A
ug
24-A
ug
31-A
ug
7-S
ep
14-S
ep
21-S
ep
28-S
ep
5-O
ct
12-O
ct
2013
22
23
24
25
26
27
28
29
30
31
32
Baro
met
ric P
ress
ure
(feet
of w
ater
)
698
697
696
695
694
693
692
691
690
689
688D
epth
to W
ater
(fee
t bm
p)
EXPLANATION
Pumping Period
09-Jan-2014
Pumping Started: 02-April-2013 12:00 hoursPumping Stopped: 01-July-2013 12:00 hoursPre-pumping Water Level: 693.96 ft bmpDistance to Pumped Well HRES-20: 8555 ft
23-M
ar
30-M
ar
6-A
pr
13-A
pr
20-A
pr
27-A
pr
4-M
ay
11-M
ay
18-M
ay
25-M
ay
1-Ju
n
8-Ju
n
15-J
un
22-J
un
29-J
un
6-Ju
l
13-J
ul
20-J
ul
27-J
ul
3-A
ug
10-A
ug
17-A
ug
24-A
ug
31-A
ug
7-S
ep
14-S
ep
21-S
ep
28-S
ep
5-O
ct
12-O
ct
2013
20
21
22
23
24
25
26
27
28
29
30
Baro
met
ric P
ress
ure
(feet
of w
ater
)
530
529
528
527
526
525
524
523
522
521
520D
epth
to W
ater
(fee
t bm
p)
EXPLANATION
Pumping Period
09-Jan-2014
Pumping Started: 02-April-2013 12:00 hoursPumping Stopped: 01-July-2013 12:00 hoursPre-pumping Water Level: 523.33 ft bmpDistance to Pumped Well HRES-20: 8147 ft

23-M
ar
30-M
ar
6-A
pr
13-A
pr
20-A
pr
27-A
pr
4-M
ay
11-M
ay
18-M
ay
25-M
ay
1-Ju
n
8-Ju
n
15-J
un
22-J
un
29-J
un
6-Ju
l
13-J
ul
20-J
ul
27-J
ul
3-A
ug
10-A
ug
17-A
ug
24-A
ug
31-A
ug
7-S
ep
14-S
ep
21-S
ep
28-S
ep
5-O
ct
12-O
ct
2013
20
21
22
23
24
25
26
27
28
29
30
Baro
met
ric P
ress
ure
(feet
of w
ater
)
1037
1036
1035
1034
1033
1032
1031
1030
1029
1028
1027D
epth
to W
ater
(fee
t bm
p)
EXPLANATION
Pumping Period
10-Dec-2013
Pumping Started: 02-April-2013 12:00 hoursPumping Stopped: 01-July-2013 12:00 hoursPre-pumping Water Level: 1031.5 ft bmpDistance to Pumped Well HRES-20: 2880 ft
23-M
ar
30-M
ar
6-A
pr
13-A
pr
20-A
pr
27-A
pr
4-M
ay
11-M
ay
18-M
ay
25-M
ay
1-Ju
n
8-Ju
n
15-J
un
22-J
un
29-J
un
6-Ju
l
13-J
ul
20-J
ul
27-J
ul
3-A
ug
10-A
ug
17-A
ug
24-A
ug
31-A
ug
7-S
ep
14-S
ep
21-S
ep
28-S
ep
5-O
ct
12-O
ct
2013
20
21
22
23
24
25
26
27
28
29
30
Baro
met
ric P
ress
ure
(feet
of w
ater
)
390
389
388
387
386
385
384
383
382
381
380D
epth
to W
ater
Lev
el (f
eet b
mp)
EXPLANATION
Pumping Period
10-Dec-2013
Pumping Started: 02-April-2013 12:00 hoursPumping Stopped: 01-July-2013 12:00 hoursPre-pumping Water Level: 384.27 ft bmpDistance to Pumped Well HRES-20: 12554 ft

23-M
ar
30-M
ar
6-A
pr
13-A
pr
20-A
pr
27-A
pr
4-M
ay
11-M
ay
18-M
ay
25-M
ay
1-Ju
n
8-Ju
n
15-J
un
22-J
un
29-J
un
6-Ju
l
13-J
ul
20-J
ul
27-J
ul
3-A
ug
10-A
ug
17-A
ug
24-A
ug
31-A
ug
7-S
ep
14-S
ep
21-S
ep
28-S
ep
5-O
ct
12-O
ct
2013
20
21
22
23
24
25
26
27
28
29
30
Baro
met
ric P
ress
ure
(feet
of w
ater
)
260
259
258
257
256
255
254
253
252
251
250D
epth
to W
ater
Lev
el (f
eet b
mp)
EXPLANATION
Pumping Period
10-Dec-2013
Pumping Started: 02-April-2013 12:00 hoursPumping Stopped: 01-July-2013 12:00 hoursPre-pumping Water Level: 252.65 ft bmpDistance to Pumped Well HRES-20: 12102 ft
23-M
ar
30-M
ar
6-A
pr
13-A
pr
20-A
pr
27-A
pr
4-M
ay
11-M
ay
18-M
ay
25-M
ay
1-Ju
n
8-Ju
n
15-J
un
22-J
un
29-J
un
6-Ju
l
13-J
ul
20-J
ul
27-J
ul
3-A
ug
10-A
ug
17-A
ug
24-A
ug
31-A
ug
7-S
ep
14-S
ep
21-S
ep
28-S
ep
5-O
ct
12-O
ct
2013
20
21
22
23
24
25
26
27
28
29
30
Baro
met
ric P
ress
ure
(feet
of w
ater
)
308
307
306
305
304
303
302
301
300
299
298D
epth
to W
ater
Lev
el (f
eet b
mp)
EXPLANATION
Pumping Period
10-Dec-2013
Pumping Started: 02-April-2013 12:00 hoursPumping Stopped: 01-July-2013 12:00 hoursPre-pumping Water Level: 303.47 ft bmpDistance to Pumped Well HRES-20: 12935 ft
Appendix B
Long-term Hydrographs
Well HRES-20 90-day Aquifer Test Resolution Copper Mining, Pinal County, Arizona
1-Ja
n-20
08
1-Fe
b-20
08
1-M
ar-2
008
1-A
pr-2
008
1-M
ay-2
008
1-Ju
n-20
08
1-Ju
l-200
8
1-A
ug-2
008
1-S
ep-2
008
1-O
ct-2
008
1-N
ov-2
008
1-D
ec-2
008
1-Ja
n-20
09
1-Fe
b-20
09
1-M
ar-2
009
1-A
pr-2
009
1-M
ay-2
009
1-Ju
n-20
09
1-Ju
l-200
9
1-A
ug-2
009
1-S
ep-2
009
1-O
ct-2
009
1-N
ov-2
009
1-D
ec-2
009
1-Ja
n-20
10
1-Fe
b-20
10
1-M
ar-2
010
1-A
pr-2
010
1-M
ay-2
010
1-Ju
n-20
10
1-Ju
l-201
0
1-A
ug-2
010
1-S
ep-2
010
1-O
ct-2
010
1-N
ov-2
010
1-D
ec-2
010
1-Ja
n-20
11
1-Fe
b-20
11
1-M
ar-2
011
1-A
pr-2
011
1-M
ay-2
011
1-Ju
n-20
11
1-Ju
l-201
1
1-A
ug-2
011
1-S
ep-2
011
1-O
ct-2
011
1-N
ov-2
011
1-D
ec-2
011
1-Ja
n-20
12
1-Fe
b-20
12
1-M
ar-2
012
1-A
pr-2
012
1-M
ay-2
012
1-Ju
n-20
12
1-Ju
l-201
2
1-A
ug-2
012
1-S
ep-2
012
1-O
ct-2
012
1-N
ov-2
012
1-D
ec-2
012
1-Ja
n-20
13
1-Fe
b-20
13
1-M
ar-2
013
1-A
pr-2
013
1-M
ay-2
013
1-Ju
n-20
13
1-Ju
l-201
3
1-A
ug-2
013
1-S
ep-2
013
1-O
ct-2
013
1-N
ov-2
013
1-D
ec-2
013
1-Ja
n-20
14
15
16
17
18
19
20
21
22
23
24
25
26
27
28
29
30
Bar
omet
ric P
ress
ure
(feet
of w
ater
)
657
656
655
654
653
652
651
650
649
648
647
646
645
644
643
642
Dep
th to
Wat
er L
evel
(fee
t bm
p)
EXPLANATION
10-Dec-2013projects\605_Resolution\07_Analysis\HRES20_90day Test\HRES15\Hyd_Mon_HRES15_2008_2013_11x17
HRES-20Pumping Period
Note: Water level measurement record started 17-Aug-2011
1-Ja
n-20
08
1-Fe
b-20
08
1-M
ar-2
008
1-A
pr-2
008
1-M
ay-2
008
1-Ju
n-20
08
1-Ju
l-200
8
1-A
ug-2
008
1-S
ep-2
008
1-O
ct-2
008
1-N
ov-2
008
1-D
ec-2
008
1-Ja
n-20
09
1-Fe
b-20
09
1-M
ar-2
009
1-A
pr-2
009
1-M
ay-2
009
1-Ju
n-20
09
1-Ju
l-200
9
1-A
ug-2
009
1-S
ep-2
009
1-O
ct-2
009
1-N
ov-2
009
1-D
ec-2
009
1-Ja
n-20
10
1-Fe
b-20
10
1-M
ar-2
010
1-A
pr-2
010
1-M
ay-2
010
1-Ju
n-20
10
1-Ju
l-201
0
1-A
ug-2
010
1-S
ep-2
010
1-O
ct-2
010
1-N
ov-2
010
1-D
ec-2
010
1-Ja
n-20
11
1-Fe
b-20
11
1-M
ar-2
011
1-A
pr-2
011
1-M
ay-2
011
1-Ju
n-20
11
1-Ju
l-201
1
1-A
ug-2
011
1-S
ep-2
011
1-O
ct-2
011
1-N
ov-2
011
1-D
ec-2
011
1-Ja
n-20
12
1-Fe
b-20
12
1-M
ar-2
012
1-A
pr-2
012
1-M
ay-2
012
1-Ju
n-20
12
1-Ju
l-201
2
1-A
ug-2
012
1-S
ep-2
012
1-O
ct-2
012
1-N
ov-2
012
1-D
ec-2
012
1-Ja
n-20
13
1-Fe
b-20
13
1-M
ar-2
013
1-A
pr-2
013
1-M
ay-2
013
1-Ju
n-20
13
1-Ju
l-201
3
1-A
ug-2
013
1-S
ep-2
013
1-O
ct-2
013
1-N
ov-2
013
1-D
ec-2
013
1-Ja
n-20
14
20
21
22
23
24
25
26
27
28
29
30
Bar
omet
ric P
ress
ure
(feet
of w
ater
)
298
297
296
295
294
293
292
291
290
289
288
Dep
th to
Wat
er L
evel
(fee
t bm
p)
EXPLANATION
10-Dec-2013projects\605_Resolution\07_Analysis\HRES20_90day Test\HRES03S\Hyd_Mon_HRES03S_2008_2013_11x17
HRES-20Pumping Period
Note: Water level measurement record started 4-Jun-2004

1-Ja
n-20
08
1-Fe
b-20
08
1-M
ar-2
008
1-A
pr-2
008
1-M
ay-2
008
1-Ju
n-20
08
1-Ju
l-200
8
1-A
ug-2
008
1-S
ep-2
008
1-O
ct-2
008
1-N
ov-2
008
1-D
ec-2
008
1-Ja
n-20
09
1-Fe
b-20
09
1-M
ar-2
009
1-A
pr-2
009
1-M
ay-2
009
1-Ju
n-20
09
1-Ju
l-200
9
1-A
ug-2
009
1-S
ep-2
009
1-O
ct-2
009
1-N
ov-2
009
1-D
ec-2
009
1-Ja
n-20
10
1-Fe
b-20
10
1-M
ar-2
010
1-A
pr-2
010
1-M
ay-2
010
1-Ju
n-20
10
1-Ju
l-201
0
1-A
ug-2
010
1-S
ep-2
010
1-O
ct-2
010
1-N
ov-2
010
1-D
ec-2
010
1-Ja
n-20
11
1-Fe
b-20
11
1-M
ar-2
011
1-A
pr-2
011
1-M
ay-2
011
1-Ju
n-20
11
1-Ju
l-201
1
1-A
ug-2
011
1-S
ep-2
011
1-O
ct-2
011
1-N
ov-2
011
1-D
ec-2
011
1-Ja
n-20
12
1-Fe
b-20
12
1-M
ar-2
012
1-A
pr-2
012
1-M
ay-2
012
1-Ju
n-20
12
1-Ju
l-201
2
1-A
ug-2
012
1-S
ep-2
012
1-O
ct-2
012
1-N
ov-2
012
1-D
ec-2
012
1-Ja
n-20
13
1-Fe
b-20
13
1-M
ar-2
013
1-A
pr-2
013
1-M
ay-2
013
1-Ju
n-20
13
1-Ju
l-201
3
1-A
ug-2
013
1-S
ep-2
013
1-O
ct-2
013
1-N
ov-2
013
1-D
ec-2
013
1-Ja
n-20
14
20
21
22
23
24
25
26
27
28
29
30
Bar
omet
ric P
ress
ure
(feet
of w
ater
)
300
299
298
297
296
295
294
293
292
291
290
Dep
th to
Wat
er L
evel
(fee
t bm
p)
EXPLANATION
10-Dec-2013projects\605_Resolution\07_Analysis\HRES20_90day Test\OFW\Hyd_Mon_OFW_2008_2013_11x17
HRES-20Pumping Period
Note: Water level measurement record started 31-Oct-2003

1-Ja
n-20
08
1-Fe
b-20
08
1-M
ar-2
008
1-A
pr-2
008
1-M
ay-2
008
1-Ju
n-20
08
1-Ju
l-200
8
1-A
ug-2
008
1-S
ep-2
008
1-O
ct-2
008
1-N
ov-2
008
1-D
ec-2
008
1-Ja
n-20
09
1-Fe
b-20
09
1-M
ar-2
009
1-A
pr-2
009
1-M
ay-2
009
1-Ju
n-20
09
1-Ju
l-200
9
1-A
ug-2
009
1-S
ep-2
009
1-O
ct-2
009
1-N
ov-2
009
1-D
ec-2
009
1-Ja
n-20
10
1-Fe
b-20
10
1-M
ar-2
010
1-A
pr-2
010
1-M
ay-2
010
1-Ju
n-20
10
1-Ju
l-201
0
1-A
ug-2
010
1-S
ep-2
010
1-O
ct-2
010
1-N
ov-2
010
1-D
ec-2
010
1-Ja
n-20
11
1-Fe
b-20
11
1-M
ar-2
011
1-A
pr-2
011
1-M
ay-2
011
1-Ju
n-20
11
1-Ju
l-201
1
1-A
ug-2
011
1-S
ep-2
011
1-O
ct-2
011
1-N
ov-2
011
1-D
ec-2
011
1-Ja
n-20
12
1-Fe
b-20
12
1-M
ar-2
012
1-A
pr-2
012
1-M
ay-2
012
1-Ju
n-20
12
1-Ju
l-201
2
1-A
ug-2
012
1-S
ep-2
012
1-O
ct-2
012
1-N
ov-2
012
1-D
ec-2
012
1-Ja
n-20
13
1-Fe
b-20
13
1-M
ar-2
013
1-A
pr-2
013
1-M
ay-2
013
1-Ju
n-20
13
1-Ju
l-201
3
1-A
ug-2
013
1-S
ep-2
013
1-O
ct-2
013
1-N
ov-2
013
1-D
ec-2
013
1-Ja
n-20
14
20
21
22
23
24
25
26
27
28
29
30
Bar
omet
ric P
ress
ure
(feet
of w
ater
)
294
293
292
291
290
289
288
287
286
285
284
Dep
th to
Wat
er L
evel
(fee
t bm
p)
EXPLANATION
10-Dec-2013projects\605_Resolution\07_Analysis\HRES20_90day Test\HRES03D\Hyd_Mon_HRES03D_2008_2013_11x17
HRES-20Pumping Period
Note: Water level measurement record started 4-Jun-2004
(?)
(?) Pressure Transducer Malfunction
1-Ja
n-20
08
1-Fe
b-20
08
1-M
ar-2
008
1-A
pr-2
008
1-M
ay-2
008
1-Ju
n-20
08
1-Ju
l-200
8
1-A
ug-2
008
1-S
ep-2
008
1-O
ct-2
008
1-N
ov-2
008
1-D
ec-2
008
1-Ja
n-20
09
1-Fe
b-20
09
1-M
ar-2
009
1-A
pr-2
009
1-M
ay-2
009
1-Ju
n-20
09
1-Ju
l-200
9
1-A
ug-2
009
1-S
ep-2
009
1-O
ct-2
009
1-N
ov-2
009
1-D
ec-2
009
1-Ja
n-20
10
1-Fe
b-20
10
1-M
ar-2
010
1-A
pr-2
010
1-M
ay-2
010
1-Ju
n-20
10
1-Ju
l-201
0
1-A
ug-2
010
1-S
ep-2
010
1-O
ct-2
010
1-N
ov-2
010
1-D
ec-2
010
1-Ja
n-20
11
1-Fe
b-20
11
1-M
ar-2
011
1-A
pr-2
011
1-M
ay-2
011
1-Ju
n-20
11
1-Ju
l-201
1
1-A
ug-2
011
1-S
ep-2
011
1-O
ct-2
011
1-N
ov-2
011
1-D
ec-2
011
1-Ja
n-20
12
1-Fe
b-20
12
1-M
ar-2
012
1-A
pr-2
012
1-M
ay-2
012
1-Ju
n-20
12
1-Ju
l-201
2
1-A
ug-2
012
1-S
ep-2
012
1-O
ct-2
012
1-N
ov-2
012
1-D
ec-2
012
1-Ja
n-20
13
1-Fe
b-20
13
1-M
ar-2
013
1-A
pr-2
013
1-M
ay-2
013
1-Ju
n-20
13
1-Ju
l-201
3
1-A
ug-2
013
1-S
ep-2
013
1-O
ct-2
013
1-N
ov-2
013
1-D
ec-2
013
1-Ja
n-20
14
18
19
20
21
22
23
24
25
26
27
28
29
30
31
32
33
Bar
omet
ric P
ress
ure
(feet
of w
ater
)
406
405
404
403
402
401
400
399
398
397
396
395
394
393
392
391
Dep
th to
Wat
er L
evel
(fee
t bm
p)
EXPLANATION
10-Dec-2013projects\605_Resolution\07_Analysis\HRES20_90day Test\HRES04\Hyd_Mon_HRES04_2008_2013_11x17
HRES-20Pumping Period
Note: Water level measurement record started 2-Mar-2005
1-Ja
n-20
08
1-Fe
b-20
08
1-M
ar-2
008
1-A
pr-2
008
1-M
ay-2
008
1-Ju
n-20
08
1-Ju
l-200
8
1-A
ug-2
008
1-S
ep-2
008
1-O
ct-2
008
1-N
ov-2
008
1-D
ec-2
008
1-Ja
n-20
09
1-Fe
b-20
09
1-M
ar-2
009
1-A
pr-2
009
1-M
ay-2
009
1-Ju
n-20
09
1-Ju
l-200
9
1-A
ug-2
009
1-S
ep-2
009
1-O
ct-2
009
1-N
ov-2
009
1-D
ec-2
009
1-Ja
n-20
10
1-Fe
b-20
10
1-M
ar-2
010
1-A
pr-2
010
1-M
ay-2
010
1-Ju
n-20
10
1-Ju
l-201
0
1-A
ug-2
010
1-S
ep-2
010
1-O
ct-2
010
1-N
ov-2
010
1-D
ec-2
010
1-Ja
n-20
11
1-Fe
b-20
11
1-M
ar-2
011
1-A
pr-2
011
1-M
ay-2
011
1-Ju
n-20
11
1-Ju
l-201
1
1-A
ug-2
011
1-S
ep-2
011
1-O
ct-2
011
1-N
ov-2
011
1-D
ec-2
011
1-Ja
n-20
12
1-Fe
b-20
12
1-M
ar-2
012
1-A
pr-2
012
1-M
ay-2
012
1-Ju
n-20
12
1-Ju
l-201
2
1-A
ug-2
012
1-S
ep-2
012
1-O
ct-2
012
1-N
ov-2
012
1-D
ec-2
012
1-Ja
n-20
13
1-Fe
b-20
13
1-M
ar-2
013
1-A
pr-2
013
1-M
ay-2
013
1-Ju
n-20
13
1-Ju
l-201
3
1-A
ug-2
013
1-S
ep-2
013
1-O
ct-2
013
1-N
ov-2
013
1-D
ec-2
013
1-Ja
n-20
14
20
21
22
23
24
25
26
27
28
29
30
Bar
omet
ric P
ress
ure
(feet
of w
ater
)
398
397
396
395
394
393
392
391
390
389
388
Dep
th to
Wat
er L
evel
(fee
t bm
p)
EXPLANATION
10-Dec-2013projects\605_Resolution\07_Analysis\HRES20_90day Test\HRES06\Hyd_Mon_HRES06_2008_2013_11x17
HRES-20Pumping Period
Note: Water level measurement record started 13-Jun-2007

1-Ja
n-20
08
1-Fe
b-20
08
1-M
ar-2
008
1-A
pr-2
008
1-M
ay-2
008
1-Ju
n-20
08
1-Ju
l-200
8
1-A
ug-2
008
1-S
ep-2
008
1-O
ct-2
008
1-N
ov-2
008
1-D
ec-2
008
1-Ja
n-20
09
1-Fe
b-20
09
1-M
ar-2
009
1-A
pr-2
009
1-M
ay-2
009
1-Ju
n-20
09
1-Ju
l-200
9
1-A
ug-2
009
1-S
ep-2
009
1-O
ct-2
009
1-N
ov-2
009
1-D
ec-2
009
1-Ja
n-20
10
1-Fe
b-20
10
1-M
ar-2
010
1-A
pr-2
010
1-M
ay-2
010
1-Ju
n-20
10
1-Ju
l-201
0
1-A
ug-2
010
1-S
ep-2
010
1-O
ct-2
010
1-N
ov-2
010
1-D
ec-2
010
1-Ja
n-20
11
1-Fe
b-20
11
1-M
ar-2
011
1-A
pr-2
011
1-M
ay-2
011
1-Ju
n-20
11
1-Ju
l-201
1
1-A
ug-2
011
1-S
ep-2
011
1-O
ct-2
011
1-N
ov-2
011
1-D
ec-2
011
1-Ja
n-20
12
1-Fe
b-20
12
1-M
ar-2
012
1-A
pr-2
012
1-M
ay-2
012
1-Ju
n-20
12
1-Ju
l-201
2
1-A
ug-2
012
1-S
ep-2
012
1-O
ct-2
012
1-N
ov-2
012
1-D
ec-2
012
1-Ja
n-20
13
1-Fe
b-20
13
1-M
ar-2
013
1-A
pr-2
013
1-M
ay-2
013
1-Ju
n-20
13
1-Ju
l-201
3
1-A
ug-2
013
1-S
ep-2
013
1-O
ct-2
013
1-N
ov-2
013
1-D
ec-2
013
1-Ja
n-20
14
27
28
29
30
31
32
33
34
35
36
37
Bar
omet
ric P
ress
ure
(feet
of w
ater
)
85
84
83
82
81
80
79
78
77
76
75
Dep
th to
Wat
er L
evel
(fee
t bm
p)
EXPLANATION
10-Dec-2013projects\605_Resolution\07_Analysis\HRES20_90day Test\HRES12\Hyd_Mon_HRES12_2008_2013_11x17
HRES-20Pumping Period
Note: Water level measurement record started 4-May-2011

1-Ja
n-20
08
1-Fe
b-20
08
1-M
ar-2
008
1-Ap
r-20
08
1-M
ay-2
008
1-Ju
n-20
08
1-Ju
l-200
8
1-A
ug-2
008
1-S
ep-2
008
1-O
ct-2
008
1-N
ov-2
008
1-D
ec-2
008
1-Ja
n-20
09
1-Fe
b-20
09
1-M
ar-2
009
1-Ap
r-20
09
1-M
ay-2
009
1-Ju
n-20
09
1-Ju
l-200
9
1-A
ug-2
009
1-S
ep-2
009
1-O
ct-2
009
1-N
ov-2
009
1-D
ec-2
009
1-Ja
n-20
10
1-Fe
b-20
10
1-M
ar-2
010
1-Ap
r-20
10
1-M
ay-2
010
1-Ju
n-20
10
1-Ju
l-201
0
1-A
ug-2
010
1-S
ep-2
010
1-O
ct-2
010
1-N
ov-2
010
1-D
ec-2
010
1-Ja
n-20
11
1-Fe
b-20
11
1-M
ar-2
011
1-Ap
r-20
11
1-M
ay-2
011
1-Ju
n-20
11
1-Ju
l-201
1
1-A
ug-2
011
1-S
ep-2
011
1-O
ct-2
011
1-N
ov-2
011
1-D
ec-2
011
1-Ja
n-20
12
1-Fe
b-20
12
1-M
ar-2
012
1-Ap
r-20
12
1-M
ay-2
012
1-Ju
n-20
12
1-Ju
l-201
2
1-A
ug-2
012
1-S
ep-2
012
1-O
ct-2
012
1-N
ov-2
012
1-D
ec-2
012
1-Ja
n-20
13
1-Fe
b-20
13
1-M
ar-2
013
1-Ap
r-20
13
1-M
ay-2
013
1-Ju
n-20
13
1-Ju
l-201
3
1-A
ug-2
013
1-S
ep-2
013
1-O
ct-2
013
1-N
ov-2
013
1-D
ec-2
013
1-Ja
n-20
14
20
21
22
23
24
25
26
27
28
29
30
Baro
met
ric P
ress
ure
(feet
of w
ater
)
541
540
539
538
537
536
535
534
533
532
531
Dep
th to
Wat
er L
evel
(fee
t bm
p)
EXPLANATION
10-Dec-2013projects\605_Resolution\07_Analysis\HRES20_90day Test\HRES14\Hyd_Mon_HRES14_2008_2013_11x17
HRES-20Pumping Period
Note: Water level measurement record started 10-May-2011

1-Ja
n-20
08
1-Fe
b-20
08
1-M
ar-2
008
1-Ap
r-20
08
1-M
ay-2
008
1-Ju
n-20
08
1-Ju
l-200
8
1-A
ug-2
008
1-S
ep-2
008
1-O
ct-2
008
1-N
ov-2
008
1-D
ec-2
008
1-Ja
n-20
09
1-Fe
b-20
09
1-M
ar-2
009
1-Ap
r-20
09
1-M
ay-2
009
1-Ju
n-20
09
1-Ju
l-200
9
1-A
ug-2
009
1-S
ep-2
009
1-O
ct-2
009
1-N
ov-2
009
1-D
ec-2
009
1-Ja
n-20
10
1-Fe
b-20
10
1-M
ar-2
010
1-Ap
r-20
10
1-M
ay-2
010
1-Ju
n-20
10
1-Ju
l-201
0
1-A
ug-2
010
1-S
ep-2
010
1-O
ct-2
010
1-N
ov-2
010
1-D
ec-2
010
1-Ja
n-20
11
1-Fe
b-20
11
1-M
ar-2
011
1-Ap
r-20
11
1-M
ay-2
011
1-Ju
n-20
11
1-Ju
l-201
1
1-A
ug-2
011
1-S
ep-2
011
1-O
ct-2
011
1-N
ov-2
011
1-D
ec-2
011
1-Ja
n-20
12
1-Fe
b-20
12
1-M
ar-2
012
1-Ap
r-20
12
1-M
ay-2
012
1-Ju
n-20
12
1-Ju
l-201
2
1-A
ug-2
012
1-S
ep-2
012
1-O
ct-2
012
1-N
ov-2
012
1-D
ec-2
012
1-Ja
n-20
13
1-Fe
b-20
13
1-M
ar-2
013
1-Ap
r-20
13
1-M
ay-2
013
1-Ju
n-20
13
1-Ju
l-201
3
1-A
ug-2
013
1-S
ep-2
013
1-O
ct-2
013
1-N
ov-2
013
1-D
ec-2
013
1-Ja
n-20
14
20
21
22
23
24
25
26
27
28
29
30
Baro
met
ric P
ress
ure
(feet
of w
ater
)
380
379
378
377
376
375
374
373
372
371
370
Dep
th to
Wat
er L
evel
(fee
t bm
p)
EXPLANATION
10-Dec-2013projects\605_Resolution\07_Analysis\HRES20_90day Test\HRES16\Hyd_Mon_HRES16_2008_2013_11x17
HRES-20Pumping Period
Note: Water level measurement record started 17-Aug-2011

1-Ja
n-20
08
1-Fe
b-20
08
1-M
ar-2
008
1-A
pr-2
008
1-M
ay-2
008
1-Ju
n-20
08
1-Ju
l-200
8
1-A
ug-2
008
1-S
ep-2
008
1-O
ct-2
008
1-N
ov-2
008
1-D
ec-2
008
1-Ja
n-20
09
1-Fe
b-20
09
1-M
ar-2
009
1-A
pr-2
009
1-M
ay-2
009
1-Ju
n-20
09
1-Ju
l-200
9
1-A
ug-2
009
1-S
ep-2
009
1-O
ct-2
009
1-N
ov-2
009
1-D
ec-2
009
1-Ja
n-20
10
1-Fe
b-20
10
1-M
ar-2
010
1-A
pr-2
010
1-M
ay-2
010
1-Ju
n-20
10
1-Ju
l-201
0
1-A
ug-2
010
1-S
ep-2
010
1-O
ct-2
010
1-N
ov-2
010
1-D
ec-2
010
1-Ja
n-20
11
1-Fe
b-20
11
1-M
ar-2
011
1-A
pr-2
011
1-M
ay-2
011
1-Ju
n-20
11
1-Ju
l-201
1
1-A
ug-2
011
1-S
ep-2
011
1-O
ct-2
011
1-N
ov-2
011
1-D
ec-2
011
1-Ja
n-20
12
1-Fe
b-20
12
1-M
ar-2
012
1-A
pr-2
012
1-M
ay-2
012
1-Ju
n-20
12
1-Ju
l-201
2
1-A
ug-2
012
1-S
ep-2
012
1-O
ct-2
012
1-N
ov-2
012
1-D
ec-2
012
1-Ja
n-20
13
1-Fe
b-20
13
1-M
ar-2
013
1-A
pr-2
013
1-M
ay-2
013
1-Ju
n-20
13
1-Ju
l-201
3
1-A
ug-2
013
1-S
ep-2
013
1-O
ct-2
013
1-N
ov-2
013
1-D
ec-2
013
1-Ja
n-20
14
20
21
22
23
24
25
26
27
28
29
30
Bar
omet
ric P
ress
ure
(feet
of w
ater
)
750
749
748
747
746
745
744
743
742
741
740
Dep
th to
Wat
er L
evel
(fee
t bm
p)
EXPLANATION
10-Dec-2013projects\605_Resolution\07_Analysis\HRES20_90day Test\HRES17\Hyd_Mon_HRES17_2008_2013_11x17
HRES-20Pumping Period
Note: Water level measurement record started 17-Aug-2011

1-Ja
n-20
08
1-Fe
b-20
08
1-M
ar-2
008
1-Ap
r-20
08
1-M
ay-2
008
1-Ju
n-20
08
1-Ju
l-200
8
1-A
ug-2
008
1-S
ep-2
008
1-O
ct-2
008
1-N
ov-2
008
1-D
ec-2
008
1-Ja
n-20
09
1-Fe
b-20
09
1-M
ar-2
009
1-Ap
r-20
09
1-M
ay-2
009
1-Ju
n-20
09
1-Ju
l-200
9
1-A
ug-2
009
1-S
ep-2
009
1-O
ct-2
009
1-N
ov-2
009
1-D
ec-2
009
1-Ja
n-20
10
1-Fe
b-20
10
1-M
ar-2
010
1-Ap
r-20
10
1-M
ay-2
010
1-Ju
n-20
10
1-Ju
l-201
0
1-A
ug-2
010
1-S
ep-2
010
1-O
ct-2
010
1-N
ov-2
010
1-D
ec-2
010
1-Ja
n-20
11
1-Fe
b-20
11
1-M
ar-2
011
1-Ap
r-20
11
1-M
ay-2
011
1-Ju
n-20
11
1-Ju
l-201
1
1-A
ug-2
011
1-S
ep-2
011
1-O
ct-2
011
1-N
ov-2
011
1-D
ec-2
011
1-Ja
n-20
12
1-Fe
b-20
12
1-M
ar-2
012
1-Ap
r-20
12
1-M
ay-2
012
1-Ju
n-20
12
1-Ju
l-201
2
1-A
ug-2
012
1-S
ep-2
012
1-O
ct-2
012
1-N
ov-2
012
1-D
ec-2
012
1-Ja
n-20
13
1-Fe
b-20
13
1-M
ar-2
013
1-Ap
r-20
13
1-M
ay-2
013
1-Ju
n-20
13
1-Ju
l-201
3
1-A
ug-2
013
1-S
ep-2
013
1-O
ct-2
013
1-N
ov-2
013
1-D
ec-2
013
1-Ja
n-20
14
20
21
22
23
24
25
26
27
28
29
30
Baro
met
ric P
ress
ure
(feet
of w
ater
)
698
697
696
695
694
693
692
691
690
689
688
Dep
th to
Wat
er L
evel
(fee
t bm
p)
EXPLANATION
10-Dec-2013projects\605_Resolution\07_Analysis\HRES20_90day Test\HRES18\Hyd_Mon_HRES18_2008_2013_11x17
HRES-20Pumping Period
Note: Water level measurement record started 3-Aug-2011

1-Ja
n-20
08
1-Fe
b-20
08
1-M
ar-2
008
1-Ap
r-20
08
1-M
ay-2
008
1-Ju
n-20
08
1-Ju
l-200
8
1-A
ug-2
008
1-S
ep-2
008
1-O
ct-2
008
1-N
ov-2
008
1-D
ec-2
008
1-Ja
n-20
09
1-Fe
b-20
09
1-M
ar-2
009
1-Ap
r-20
09
1-M
ay-2
009
1-Ju
n-20
09
1-Ju
l-200
9
1-A
ug-2
009
1-S
ep-2
009
1-O
ct-2
009
1-N
ov-2
009
1-D
ec-2
009
1-Ja
n-20
10
1-Fe
b-20
10
1-M
ar-2
010
1-Ap
r-20
10
1-M
ay-2
010
1-Ju
n-20
10
1-Ju
l-201
0
1-A
ug-2
010
1-S
ep-2
010
1-O
ct-2
010
1-N
ov-2
010
1-D
ec-2
010
1-Ja
n-20
11
1-Fe
b-20
11
1-M
ar-2
011
1-Ap
r-20
11
1-M
ay-2
011
1-Ju
n-20
11
1-Ju
l-201
1
1-A
ug-2
011
1-S
ep-2
011
1-O
ct-2
011
1-N
ov-2
011
1-D
ec-2
011
1-Ja
n-20
12
1-Fe
b-20
12
1-M
ar-2
012
1-Ap
r-20
12
1-M
ay-2
012
1-Ju
n-20
12
1-Ju
l-201
2
1-A
ug-2
012
1-S
ep-2
012
1-O
ct-2
012
1-N
ov-2
012
1-D
ec-2
012
1-Ja
n-20
13
1-Fe
b-20
13
1-M
ar-2
013
1-Ap
r-20
13
1-M
ay-2
013
1-Ju
n-20
13
1-Ju
l-201
3
1-A
ug-2
013
1-S
ep-2
013
1-O
ct-2
013
1-N
ov-2
013
1-D
ec-2
013
1-Ja
n-20
14
20
21
22
23
24
25
26
27
28
29
30
Baro
met
ric P
ress
ure
(feet
of w
ater
)
530
529
528
527
526
525
524
523
522
521
520
Dep
th to
Wat
er L
evel
(fee
t bm
p)
EXPLANATION
10-Dec-2013projects\605_Resolution\07_Analysis\HRES20_90day Test\A-06\Hyd_Mon_A06_2008_2013_11x17
HRES-20Pumping Period
Note: Water level measurement record started 29-Sep-2006
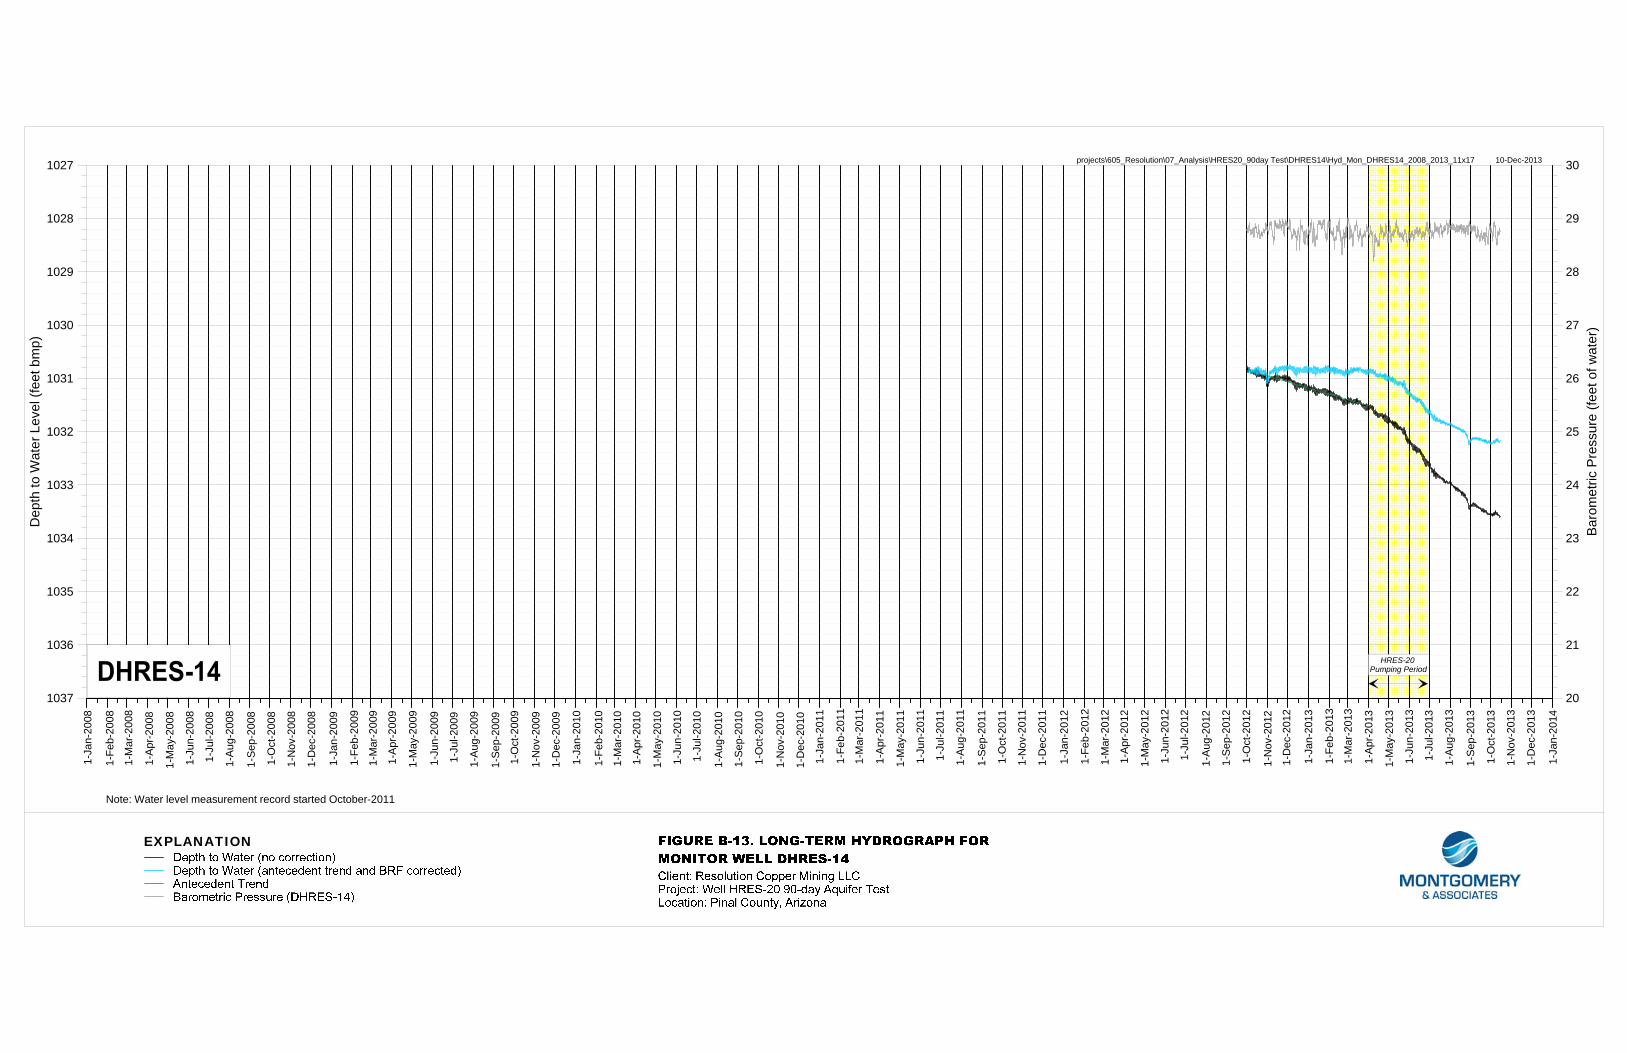
1-Ja
n-20
08
1-Fe
b-20
08
1-M
ar-2
008
1-A
pr-2
008
1-M
ay-2
008
1-Ju
n-20
08
1-Ju
l-200
8
1-A
ug-2
008
1-S
ep-2
008
1-O
ct-2
008
1-N
ov-2
008
1-D
ec-2
008
1-Ja
n-20
09
1-Fe
b-20
09
1-M
ar-2
009
1-A
pr-2
009
1-M
ay-2
009
1-Ju
n-20
09
1-Ju
l-200
9
1-A
ug-2
009
1-S
ep-2
009
1-O
ct-2
009
1-N
ov-2
009
1-D
ec-2
009
1-Ja
n-20
10
1-Fe
b-20
10
1-M
ar-2
010
1-A
pr-2
010
1-M
ay-2
010
1-Ju
n-20
10
1-Ju
l-201
0
1-A
ug-2
010
1-S
ep-2
010
1-O
ct-2
010
1-N
ov-2
010
1-D
ec-2
010
1-Ja
n-20
11
1-Fe
b-20
11
1-M
ar-2
011
1-A
pr-2
011
1-M
ay-2
011
1-Ju
n-20
11
1-Ju
l-201
1
1-A
ug-2
011
1-S
ep-2
011
1-O
ct-2
011
1-N
ov-2
011
1-D
ec-2
011
1-Ja
n-20
12
1-Fe
b-20
12
1-M
ar-2
012
1-A
pr-2
012
1-M
ay-2
012
1-Ju
n-20
12
1-Ju
l-201
2
1-A
ug-2
012
1-S
ep-2
012
1-O
ct-2
012
1-N
ov-2
012
1-D
ec-2
012
1-Ja
n-20
13
1-Fe
b-20
13
1-M
ar-2
013
1-A
pr-2
013
1-M
ay-2
013
1-Ju
n-20
13
1-Ju
l-201
3
1-A
ug-2
013
1-S
ep-2
013
1-O
ct-2
013
1-N
ov-2
013
1-D
ec-2
013
1-Ja
n-20
14
20
21
22
23
24
25
26
27
28
29
30
Bar
omet
ric P
ress
ure
(feet
of w
ater
)
1037
1036
1035
1034
1033
1032
1031
1030
1029
1028
1027
Dep
th to
Wat
er L
evel
(fee
t bm
p)
EXPLANATION
10-Dec-2013projects\605_Resolution\07_Analysis\HRES20_90day Test\DHRES14\Hyd_Mon_DHRES14_2008_2013_11x17
HRES-20Pumping Period
Note: Water level measurement record started October-2011

1-Ja
n-20
08
1-Fe
b-20
08
1-M
ar-2
008
1-Ap
r-20
08
1-M
ay-2
008
1-Ju
n-20
08
1-Ju
l-200
8
1-A
ug-2
008
1-S
ep-2
008
1-O
ct-2
008
1-N
ov-2
008
1-D
ec-2
008
1-Ja
n-20
09
1-Fe
b-20
09
1-M
ar-2
009
1-Ap
r-20
09
1-M
ay-2
009
1-Ju
n-20
09
1-Ju
l-200
9
1-A
ug-2
009
1-S
ep-2
009
1-O
ct-2
009
1-N
ov-2
009
1-D
ec-2
009
1-Ja
n-20
10
1-Fe
b-20
10
1-M
ar-2
010
1-Ap
r-20
10
1-M
ay-2
010
1-Ju
n-20
10
1-Ju
l-201
0
1-A
ug-2
010
1-S
ep-2
010
1-O
ct-2
010
1-N
ov-2
010
1-D
ec-2
010
1-Ja
n-20
11
1-Fe
b-20
11
1-M
ar-2
011
1-Ap
r-20
11
1-M
ay-2
011
1-Ju
n-20
11
1-Ju
l-201
1
1-A
ug-2
011
1-S
ep-2
011
1-O
ct-2
011
1-N
ov-2
011
1-D
ec-2
011
1-Ja
n-20
12
1-Fe
b-20
12
1-M
ar-2
012
1-Ap
r-20
12
1-M
ay-2
012
1-Ju
n-20
12
1-Ju
l-201
2
1-A
ug-2
012
1-S
ep-2
012
1-O
ct-2
012
1-N
ov-2
012
1-D
ec-2
012
1-Ja
n-20
13
1-Fe
b-20
13
1-M
ar-2
013
1-Ap
r-20
13
1-M
ay-2
013
1-Ju
n-20
13
1-Ju
l-201
3
1-A
ug-2
013
1-S
ep-2
013
1-O
ct-2
013
1-N
ov-2
013
1-D
ec-2
013
1-Ja
n-20
14
20
21
22
23
24
25
26
27
28
29
30
Baro
met
ric P
ress
ure
(feet
of w
ater
)
390
389
388
387
386
385
384
383
382
381
380
Dep
th to
Wat
er L
evel
(fee
t bm
p)
EXPLANATION
10-Dec-2013projects\605_Resolution\07_Analysis\HRES20_90day Test\HRES07\Hyd_Mon_HRES07_2008_2013_11x17
HRES-20Pumping Period
Note: Water level measurement record started 14-Apr-2008

1-Ja
n-20
08
1-Fe
b-20
08
1-M
ar-2
008
1-Ap
r-20
08
1-M
ay-2
008
1-Ju
n-20
08
1-Ju
l-200
8
1-A
ug-2
008
1-S
ep-2
008
1-O
ct-2
008
1-N
ov-2
008
1-D
ec-2
008
1-Ja
n-20
09
1-Fe
b-20
09
1-M
ar-2
009
1-Ap
r-20
09
1-M
ay-2
009
1-Ju
n-20
09
1-Ju
l-200
9
1-A
ug-2
009
1-S
ep-2
009
1-O
ct-2
009
1-N
ov-2
009
1-D
ec-2
009
1-Ja
n-20
10
1-Fe
b-20
10
1-M
ar-2
010
1-Ap
r-20
10
1-M
ay-2
010
1-Ju
n-20
10
1-Ju
l-201
0
1-A
ug-2
010
1-S
ep-2
010
1-O
ct-2
010
1-N
ov-2
010
1-D
ec-2
010
1-Ja
n-20
11
1-Fe
b-20
111-
Mar
-201
1
1-Ap
r-20
11
1-M
ay-2
011
1-Ju
n-20
11
1-Ju
l-201
1
1-A
ug-2
011
1-S
ep-2
011
1-O
ct-2
011
1-N
ov-2
011
1-D
ec-2
011
1-Ja
n-20
12
1-Fe
b-20
12
1-M
ar-2
012
1-Ap
r-20
12
1-M
ay-2
012
1-Ju
n-20
12
1-Ju
l-201
2
1-A
ug-2
012
1-S
ep-2
012
1-O
ct-2
012
1-N
ov-2
012
1-D
ec-2
012
1-Ja
n-20
13
1-Fe
b-20
13
1-M
ar-2
013
1-Ap
r-20
13
1-M
ay-2
013
1-Ju
n-20
13
1-Ju
l-201
3
1-A
ug-2
013
1-S
ep-2
013
1-O
ct-2
013
1-N
ov-2
013
1-D
ec-2
013
1-Ja
n-20
14
20
21
22
23
24
25
26
27
28
29
30
Baro
met
ric P
ress
ure
(feet
of w
ater
)
260
259
258
257
256
255
254
253
252
251
250
Dep
th to
Wat
er L
evel
(fee
t bm
p)
EXPLANATION
10-Dec-2013projects\605_Resolution\07_Analysis\HRES20_90day Test\HRES09\Hyd_Mon_HRES09_2008_2013_11x17
HRES-20Pumping Period
Note: Water level measurement record started 23-Apr-2010
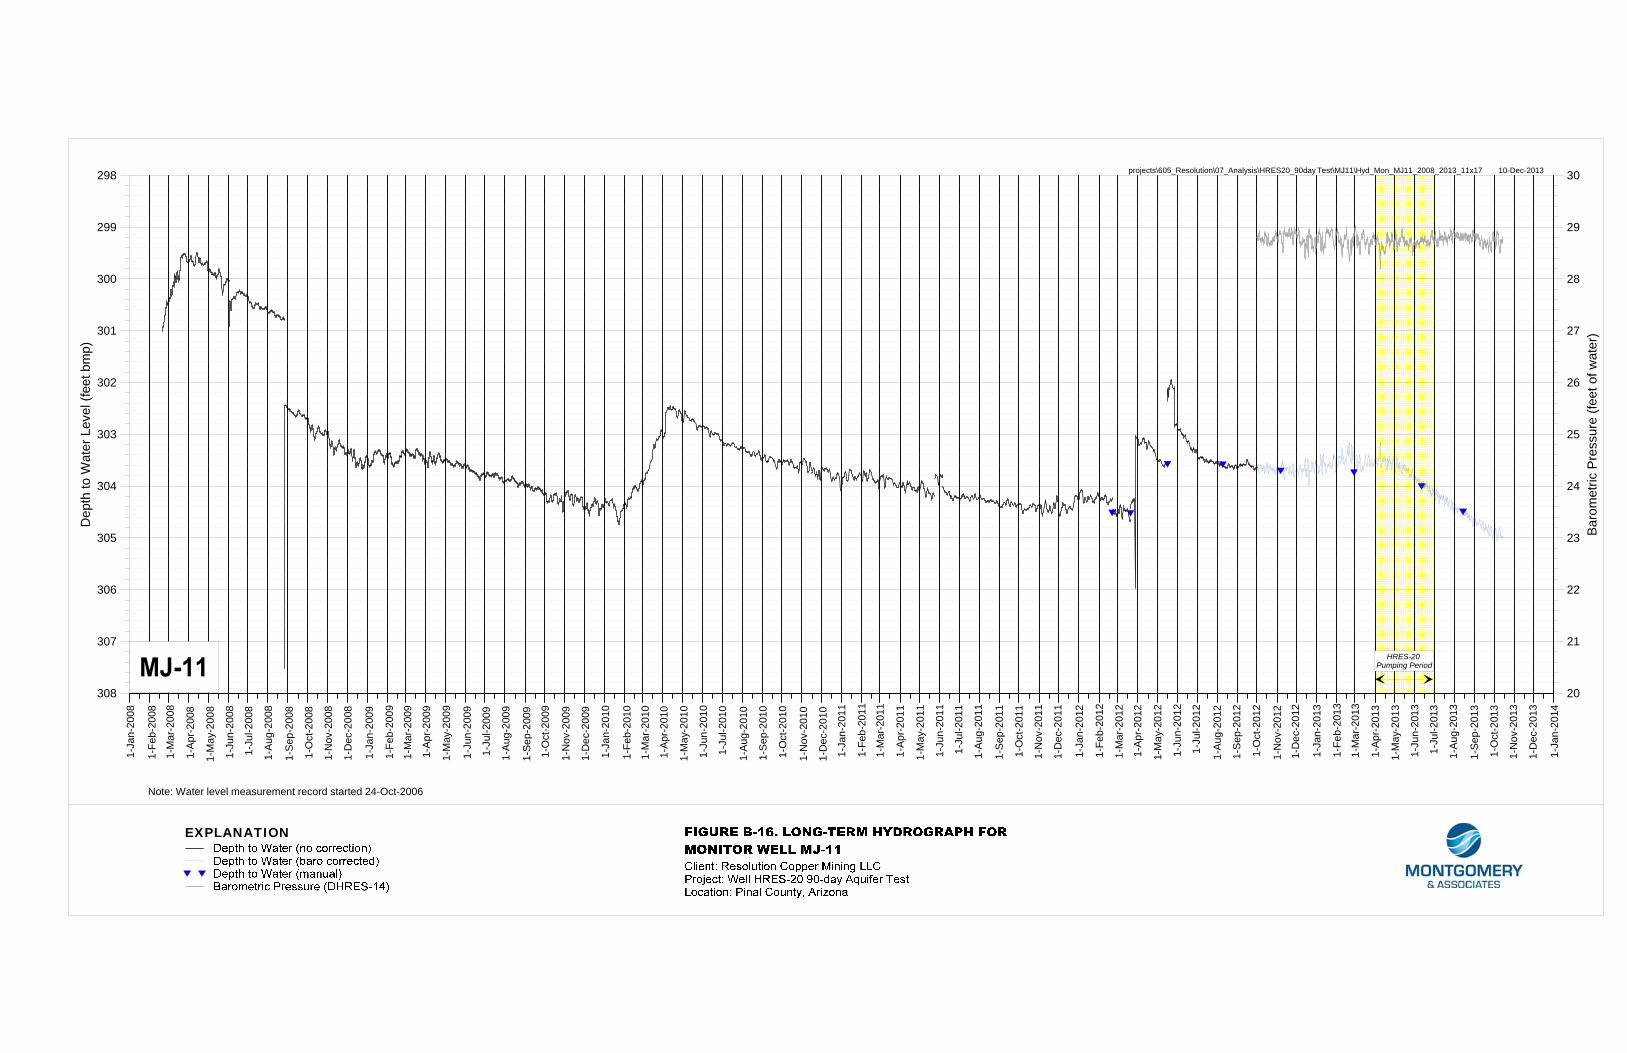
1-Ja
n-20
08
1-Fe
b-20
08
1-M
ar-2
008
1-Ap
r-20
08
1-M
ay-2
008
1-Ju
n-20
08
1-Ju
l-200
8
1-A
ug-2
008
1-S
ep-2
008
1-O
ct-2
008
1-N
ov-2
008
1-D
ec-2
008
1-Ja
n-20
09
1-Fe
b-20
09
1-M
ar-2
009
1-Ap
r-20
09
1-M
ay-2
009
1-Ju
n-20
09
1-Ju
l-200
9
1-A
ug-2
009
1-S
ep-2
009
1-O
ct-2
009
1-N
ov-2
009
1-D
ec-2
009
1-Ja
n-20
10
1-Fe
b-20
10
1-M
ar-2
010
1-Ap
r-20
10
1-M
ay-2
010
1-Ju
n-20
10
1-Ju
l-201
0
1-A
ug-2
010
1-S
ep-2
010
1-O
ct-2
010
1-N
ov-2
010
1-D
ec-2
010
1-Ja
n-20
11
1-Fe
b-20
11
1-M
ar-2
011
1-Ap
r-20
11
1-M
ay-2
011
1-Ju
n-20
11
1-Ju
l-201
1
1-A
ug-2
011
1-S
ep-2
011
1-O
ct-2
011
1-N
ov-2
011
1-D
ec-2
011
1-Ja
n-20
12
1-Fe
b-20
12
1-M
ar-2
012
1-Ap
r-20
12
1-M
ay-2
012
1-Ju
n-20
12
1-Ju
l-201
2
1-A
ug-2
012
1-S
ep-2
012
1-O
ct-2
012
1-N
ov-2
012
1-D
ec-2
012
1-Ja
n-20
13
1-Fe
b-20
13
1-M
ar-2
013
1-Ap
r-20
13
1-M
ay-2
013
1-Ju
n-20
13
1-Ju
l-201
3
1-A
ug-2
013
1-S
ep-2
013
1-O
ct-2
013
1-N
ov-2
013
1-D
ec-2
013
1-Ja
n-20
14
20
21
22
23
24
25
26
27
28
29
30
Baro
met
ric P
ress
ure
(feet
of w
ater
)
308
307
306
305
304
303
302
301
300
299
298
Dep
th to
Wat
er L
evel
(fee
t bm
p)
EXPLANATION
10-Dec-2013projects\605_Resolution\07_Analysis\HRES20_90day Test\MJ11\Hyd_Mon_MJ11_2008_2013_11x17
HRES-20Pumping Period
Note: Water level measurement record started 24-Oct-2006