january2018 ogden metro - files. · pdf filecurrent: $240,900 monthly change: 1.2% quarterly...
TRANSCRIPT

www.zillow.com/research/
MARCH2018 Ogden Metro
National Home Values
Current: $213,146Monthly Change: 0.5%Quarterly Change: 1.8%Annual Change: 8%Negative Equity*: 10.4%
Ogden Home Values
Current: $272,172Monthly Change: 0.9%Quarterly Change: 3%Annual Change: 9.8%Negative Equity*: 9.8%
Home Values Forecast
(next 12 months)
National: 4.2%Ogden Metro: 4.6%
Major Cities - Home Values
OgdenCurrent: $188,099Monthly Change: 1.9%Annual Change: 17.5%
LaytonCurrent: $276,537Monthly Change: 0.4%Annual Change: 9.7%
BountifulCurrent: $310,757Monthly Change: 1%Annual Change: 8.3%
RoyCurrent: $224,937Monthly Change: 1%Annual Change: 12.9%
ClearfieldCurrent: $216,425Monthly Change: 0.8%Annual Change: 12.1%
Esri, HERE, Garmin, © OpenStreetMap contributors, and the GIS user community
City ZHVI Year-over-Year3.7% - 6.9% 7.0% - 9.0% 9.1% - 11.2% 11.3% - 13.7% 13.8% - 18.8%
Home Values (ZHVI)Increasing Values: –%Decreasing Values: –%Fall From Peak: 0%Peak ZHVI Date: 2018-03Peak ZHVI: $272,172
RentZillow Rent Index: $1,447
Monthly Change: 0.3%Annual Change: 5.9%
Rent List Price: $1,400Rent List/Sq. Ft.: $1.1
SalesMedian Sale Price: $–
Monthly Change: –%Annual Change: –%
Sale Price/Sq. Ft.: $–Sale-to-list Price Ratio: –Sold for a Loss/Gain: –%/–%
ListingsMedian List Price: $300,000
Monthly Change: –%Annual Change: –%
List Price/Sq. Ft.: $174Listings with Price Cut: 9.9%Amount of Price Cut: 2.4%
ForeclosuresHomes Foreclosed: –/10, 000
Monthly Change: –Annual Change: –
Foreclosure Resales: –%Monthly Change: –ppAnnual Change: –pp
How do we track home values? Totrack home values, we use the ZillowHome Value Index (ZHVI). The ZHVI isthe mid-point of estimated home valuesfor the area. Half the estimated homevalues are above this number and halfare below.
* Negative equity data is from 2017Q1.
MARCH2018
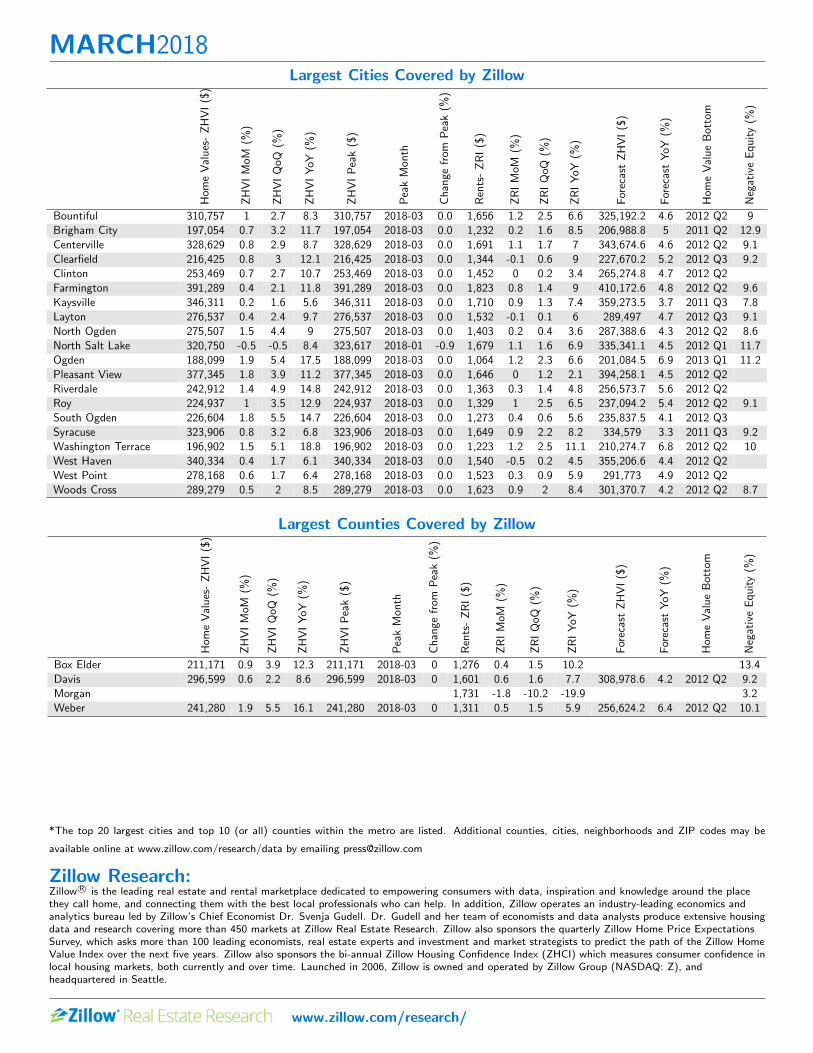
*The top 20 largest cities and top 10 (or all) counties within the metro are listed. Additional counties, cities, neighborhoods and ZIP codes may be
available online at www.zillow.com/research/data by emailing [email protected]
Zillow Research:Zillow R© is the leading real estate and rental marketplace dedicated to empowering consumers with data, inspiration and knowledge around the placethey call home, and connecting them with the best local professionals who can help. In addition, Zillow operates an industry-leading economics andanalytics bureau led by Zillow’s Chief Economist Dr. Svenja Gudell. Dr. Gudell and her team of economists and data analysts produce extensive housingdata and research covering more than 450 markets at Zillow Real Estate Research. Zillow also sponsors the quarterly Zillow Home Price ExpectationsSurvey, which asks more than 100 leading economists, real estate experts and investment and market strategists to predict the path of the Zillow HomeValue Index over the next five years. Zillow also sponsors the bi-annual Zillow Housing Confidence Index (ZHCI) which measures consumer confidence inlocal housing markets, both currently and over time. Launched in 2006, Zillow is owned and operated by Zillow Group (NASDAQ: Z), andheadquartered in Seattle.
www.zillow.com/research/
Largest Cities Covered by Zillow
Hom
eV
alu
es-
ZH
VI
($)
ZH
VI
MoM
(%)
ZH
VI
QoQ
(%)
ZH
VI
YoY
(%)
ZH
VI
Pea
k($
)
Pea
kM
onth
Ch
ange
from
Pea
k(%
)
Ren
ts-
ZR
I($
)
ZR
IM
oM(%
)
ZR
IQ
oQ(%
)
ZR
IY
oY(%
)
For
ecas
tZ
HV
I($
)
For
ecas
tY
oY(%
)
Hom
eV
alu
eB
otto
m
Neg
ativ
eE
qu
ity
(%)
Bountiful 310,757 1 2.7 8.3 310,757 2018-03 0.0 1,656 1.2 2.5 6.6 325,192.2 4.6 2012 Q2 9Brigham City 197,054 0.7 3.2 11.7 197,054 2018-03 0.0 1,232 0.2 1.6 8.5 206,988.8 5 2011 Q2 12.9Centerville 328,629 0.8 2.9 8.7 328,629 2018-03 0.0 1,691 1.1 1.7 7 343,674.6 4.6 2012 Q2 9.1Clearfield 216,425 0.8 3 12.1 216,425 2018-03 0.0 1,344 -0.1 0.6 9 227,670.2 5.2 2012 Q3 9.2Clinton 253,469 0.7 2.7 10.7 253,469 2018-03 0.0 1,452 0 0.2 3.4 265,274.8 4.7 2012 Q2Farmington 391,289 0.4 2.1 11.8 391,289 2018-03 0.0 1,823 0.8 1.4 9 410,172.6 4.8 2012 Q2 9.6Kaysville 346,311 0.2 1.6 5.6 346,311 2018-03 0.0 1,710 0.9 1.3 7.4 359,273.5 3.7 2011 Q3 7.8Layton 276,537 0.4 2.4 9.7 276,537 2018-03 0.0 1,532 -0.1 0.1 6 289,497 4.7 2012 Q3 9.1North Ogden 275,507 1.5 4.4 9 275,507 2018-03 0.0 1,403 0.2 0.4 3.6 287,388.6 4.3 2012 Q2 8.6North Salt Lake 320,750 -0.5 -0.5 8.4 323,617 2018-01 -0.9 1,679 1.1 1.6 6.9 335,341.1 4.5 2012 Q1 11.7Ogden 188,099 1.9 5.4 17.5 188,099 2018-03 0.0 1,064 1.2 2.3 6.6 201,084.5 6.9 2013 Q1 11.2Pleasant View 377,345 1.8 3.9 11.2 377,345 2018-03 0.0 1,646 0 1.2 2.1 394,258.1 4.5 2012 Q2Riverdale 242,912 1.4 4.9 14.8 242,912 2018-03 0.0 1,363 0.3 1.4 4.8 256,573.7 5.6 2012 Q2Roy 224,937 1 3.5 12.9 224,937 2018-03 0.0 1,329 1 2.5 6.5 237,094.2 5.4 2012 Q2 9.1South Ogden 226,604 1.8 5.5 14.7 226,604 2018-03 0.0 1,273 0.4 0.6 5.6 235,837.5 4.1 2012 Q3Syracuse 323,906 0.8 3.2 6.8 323,906 2018-03 0.0 1,649 0.9 2.2 8.2 334,579 3.3 2011 Q3 9.2Washington Terrace 196,902 1.5 5.1 18.8 196,902 2018-03 0.0 1,223 1.2 2.5 11.1 210,274.7 6.8 2012 Q2 10West Haven 340,334 0.4 1.7 6.1 340,334 2018-03 0.0 1,540 -0.5 0.2 4.5 355,206.6 4.4 2012 Q2West Point 278,168 0.6 1.7 6.4 278,168 2018-03 0.0 1,523 0.3 0.9 5.9 291,773 4.9 2012 Q2Woods Cross 289,279 0.5 2 8.5 289,279 2018-03 0.0 1,623 0.9 2 8.4 301,370.7 4.2 2012 Q2 8.7
Largest Counties Covered by Zillow
Hom
eV
alu
es-
ZH
VI
($)
ZH
VI
MoM
(%)
ZH
VI
QoQ
(%)
ZH
VI
YoY
(%)
ZH
VI
Pea
k($
)
Pea
kM
onth
Ch
ange
from
Pea
k(%
)
Ren
ts-
ZR
I($
)
ZR
IM
oM(%
)
ZR
IQ
oQ(%
)
ZR
IY
oY(%
)
For
ecas
tZ
HV
I($
)
For
ecas
tY
oY(%
)
Hom
eV
alu
eB
otto
m
Neg
ativ
eE
qu
ity
(%)
Box Elder 211,171 0.9 3.9 12.3 211,171 2018-03 0 1,276 0.4 1.5 10.2 13.4Davis 296,599 0.6 2.2 8.6 296,599 2018-03 0 1,601 0.6 1.6 7.7 308,978.6 4.2 2012 Q2 9.2Morgan 1,731 -1.8 -10.2 -19.9 3.2Weber 241,280 1.9 5.5 16.1 241,280 2018-03 0 1,311 0.5 1.5 5.9 256,624.2 6.4 2012 Q2 10.1