japan real estate second quarter 2013 - rreef
TRANSCRIPT

Japan Real Estate Second Quarter 2013 April 2013
Research Report

DEUTSCHE ASSET & WEALTH MANAGEMENT Japan Real Estate Second Quarter 2013 | April 2013 1
Table of Contents
Executive Summary ............................................................................. 1
Macro Economy ................................................................................... 2
Capital Market ...................................................................................... 4
Lending .................................................................................... 4
Pricing ...................................................................................... 5
Transactions ............................................................................ 6
Performance ............................................................................ 8
J-REITs .................................................................................... 8
Market Fundamentals ........................................................................ 11
Office ..................................................................................... 11
Retail ..................................................................................... 14
Residential ............................................................................. 15
Industrial ............................................................................... 16
Past Issues ......................................................................................... 18
Important Notes .................................................................................. 19
Global Research Team ...................................................................... 20
Prepared By:
Koichiro (Ko) Obu Head of Research & Strategy Japan and Korea +81 (0) 3 5156 6522 [email protected] Minxuan Hu Property Market Research +81 (0) 3 5156 6525 [email protected] Mark Roberts Head of Research & Strategy +1(212) 454-0974 [email protected]
NOTE : Following the combination of Deutsche Bank’s asset and wealth management capabilities into one new division, these previously separate businesses were unified under one identity – the Deutsche Asset & Wealth Management name and the platinum Deutsche Bank logo.
Accordingly, the global real estate investment business (formerly RREEF Real Estate) has adopted the new Deutsche Asset & Wealth Management brand in place of the RREEF name and the RREEF logo.
The following Global Real Estate Strategic Outlook follows the recently published regional Real Estate Strategic Outlooks for the United States, Europe and Asia Pacific, which were published prior to the re-branding.
DEUTSCHE ASSET & WEALTH MANAGEMENT Japan Real Estate Second Quarter 2013 | April 2013 1
Executive Summary Economy: In the first quarter of 2013, confidence in the Japanese macro economy ex-
perienced one of the most significant surges in recent history. Haruhiko Kuroda, the new
governor of the Bank of Japan, announced in April 2013 an unprecedented policy of
monetary easing that includes inflation targets and purchase commitments. Although the
eventual impact of these plans will take some time to unfold, capital markets have reacted
favourably so far, and the Japanese economy appears poised to grow strongly in the latter
half of the year.
Capital market: Given investors’ solid expectation of inflation in the future, Japanese real
estate has recently gained allure since it is expected to benefit from an inflation economic
environment. The J-REIT index has skyrocketed to its highest point since the global credit
crisis, and the aggregate amount of equity raised by J-REITs in the six months to March
2013 set an all time record. Because capital is now flowing strongly into real estate trans-
actions, further cap rate compression is expected this year.
Property markets: The leasing market for Japanese property has so far been much less
buoyant than capital markets might imply, but there have nevertheless been some positive
changes. The average rents for newly-built offices in Tokyo grew 9.2% in the first two
months of 2013, the largest growth spurt in more than five years. Among Tokyo’s central
five wards, Shibuya emerged as the strongest office submarket with a vacancy rate of
6.0% in February 2013 compared to an 8.6% average for the central five wards. Property
leasing also showed signs of broad stabilisation in the residential and logistics markets in
Japan in early 2013.

DEUTSCHE ASSET & WEALTH MANAGEMENT Japan Real Estate Second Quarter 2013 | April 2013 2
Macro Economy Forecasts for the Japanese macro economy have been revised upward a couple of times
since Prime Minister Shinzo Abe assumed power in December 2012. Financial markets
have broadly welcomed his aggressive economic policies which include monetary easing
and fiscal stimulus aimed at ending deflation and weakening the Japanese yen’s value.
Although the recovery is still nascent, Japan’s real GDP is now expected to grow by 1.4%
in 2013 according to Deutsche Bank economists. More moderate growth should follow in
2014 when a hike in the consumption tax (VAT) rate is planned. The hike will initially move
the tax rate from the current 5% to 8% next year (and eventually to 10% in 2015).
Exhibit 1 — GDP Growth Outlook for Japan
Notes: F = forecast, there is no guarantee forecast growth will materialise. Please refer to Important Notes (see end of report)
Sources: Deutsche Bank, “Japan Economics Weekly”
As of April 2013
The Diffusion Index (DI) of the Tankan Survey conducted by the Bank of Japan (BoJ) also
improved during the past quarter. The DI recovered from the previous trough of a -3 index
value in December 2012 to -1 in March 2013, with a positive outlook of +4 for the next
quarter. The recovery is less evident in the services sector than in manufacturing activities
which tend to benefit most from the weakened value of the yen. The Business Condition
Leading Index calculated by Japan’s Cabinet Office also indicates that recovery has been
underway since December 2012.
Exhibit 2 — Diffusion Index of Business Conditions
Sources: The Bank of Japan, Japan’s Cabinet Office, Deutsche Asset & Wealth Management*As of April 2013
-10%
-8%
-6%
-4%
-2%
0%
2%
4%
1995
1996
1997
1998
1999
2000
2001
2002
2003
2004
2005
2006
2007
2008
2009
2010
2011
2012
2013
F
2014
F
2015
F
2016
F
Q1 Q2 Q3 Q4 annual growth
DB Forecast
consumption tax increase
Great Tohoku Earthquake aftermathglobal financial
crisis
dot.com bubble burst
-50
-25
0
25
50
67
80
93
106
119
1991
1992
1993
1994
1995
1996
1997
1998
1999
2000
2001
2002
2003
2004
2005
2006
2007
2008
2009
2010
2011
2012
2013
Business Condition Leading Index (LHS) Diffusion Index of Tankan Survey (RHS)
Diffusion Index of Business Conditions:('favourable' minus 'unfavourable', % points)
(2005=100)
dot.com bubble burst
global financial crisis
Consumption tax increase
*

DEUTSCHE ASSET & WEALTH MANAGEMENT Japan Real Estate Second Quarter 2013 | April 2013 3
Newly appointed BoJ governor Haruhiko Kuroda announced a change of direction in
monetary policy in April 2013. The BoJ now sets a clear inflation target of 2% within two
years—an unprecedented goal. Deutsche Bank economists forecast more moderate infla-
tion of less than 1% through 2015, although prices will indeed see brief, temporary spikes
of 2.5% in April 2014 and 2.0% in October 2015 due to the planned consumption tax in-
crease. The long term government bond yield is also expected to remain steadily below
1% in these periods.
The BoJ’s new monetary policy of “quantitative and qualitative monetary easing” sets a
number of specific goals, including:
- Doubling the size of the monetary base from JPY 135 trillion to JPY 270 trillion in
two years;
- Doubling the amount of the BoJ’s long-term government debt holdings in two years;
- Extending the average maturity of long-term government debt held by the BoJ from
the current three years to seven years, with monthly gross purchases of long-term
government debt of around JPY 7 trillion.
- Increasing the BoJ’s Exchange Traded Fund (ETF) holdings by JPY 1 trillion a year,
and J-REITs by JPY 30 billion a year.
Exhibit 3 — Forecast of Interest Rate and CPI
Notes: F = forecast, there is no guarantee rates forecasted will materialise. JGB = Japanese Government Bond. CPI = Consumer Price Index. Please refer to Important Notes (see end of report)
Sources: The Bank of Japan, Japan’s Cabinet Office, Deutsche Asset & Wealth Management
As of April 2013
-3
-2
-1
0
1
2
3
2000
2001
2002
2003
2004
2005
2006
2007
2008
2009
2010
2011
2012
2013
F
2014
F
2015
F
2016
F
Call Rate (overnight) 10y JGB CPI(%)
DB Forecast
Consumption Tax hike in April 2014
DEUTSCHE ASSET & WEALTH MANAGEMENT Japan Real Estate Second Quarter 2013 | April 2013 4
Capital Market
Lending
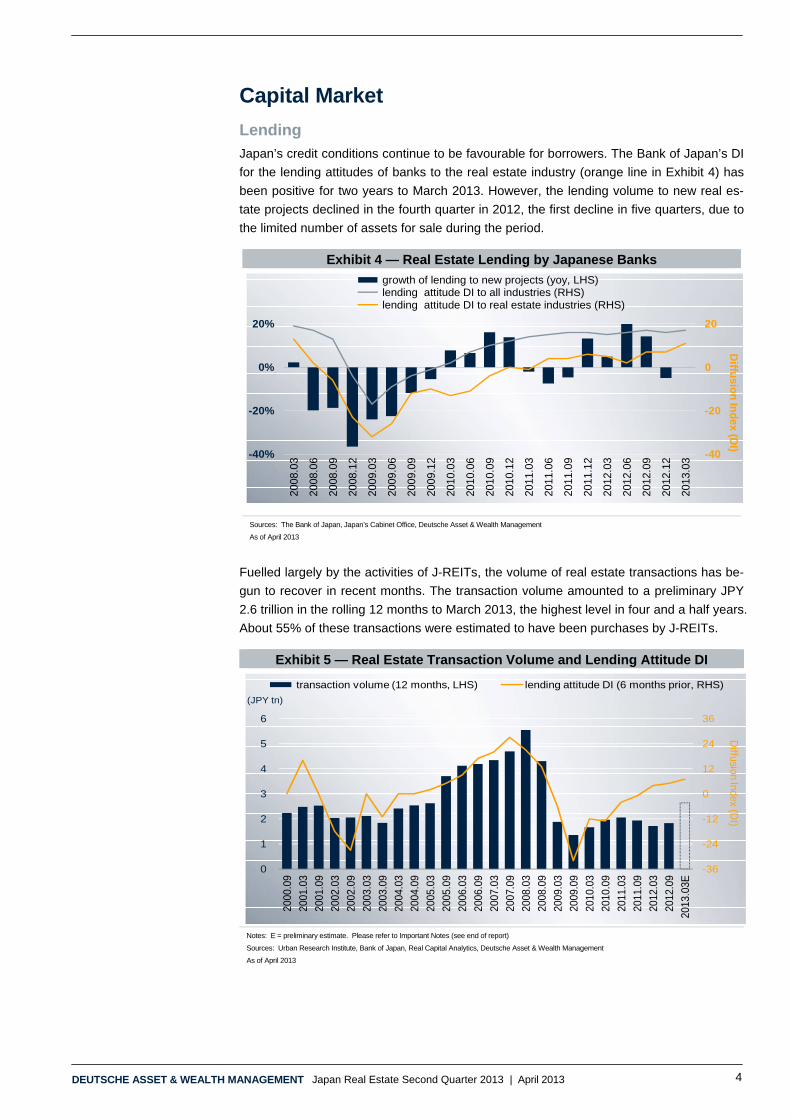
Japan’s credit conditions continue to be favourable for borrowers. The Bank of Japan’s DI
for the lending attitudes of banks to the real estate industry (orange line in Exhibit 4) has
been positive for two years to March 2013. However, the lending volume to new real es-
tate projects declined in the fourth quarter in 2012, the first decline in five quarters, due to
the limited number of assets for sale during the period.
Exhibit 4 — Real Estate Lending by Japanese Banks
Sources: The Bank of Japan, Japan’s Cabinet Office, Deutsche Asset & Wealth Management
As of April 2013
Fuelled largely by the activities of J-REITs, the volume of real estate transactions has be-
gun to recover in recent months. The transaction volume amounted to a preliminary JPY
2.6 trillion in the rolling 12 months to March 2013, the highest level in four and a half years.
About 55% of these transactions were estimated to have been purchases by J-REITs.
Exhibit 5 — Real Estate Transaction Volume and Lending Attitude DI
Notes: E = preliminary estimate. Please refer to Important Notes (see end of report)
Sources: Urban Research Institute, Bank of Japan, Real Capital Analytics, Deutsche Asset & Wealth Management
As of April 2013
-40
-20
0
20
-40%
-20%
0%
20%
2008
.03
2008
.06
2008
.09
2008
.12
2009
.03
2009
.06
2009
.09
2009
.12
2010
.03
2010
.06
2010
.09
2010
.12
2011
.03
2011
.06
2011
.09
2011
.12
2012
.03
2012
.06
2012
.09
2012
.12
2013
.03
growth of lending to new projects (yoy, LHS)lending attitude DI to all industries (RHS)lending attitude DI to real estate industries (RHS)
Diffu
sion
Ind
ex (DI)
-36
-24
-12
0
12
24
36
0
1
2
3
4
5
6
2000
.09
2001
.03
2001
.09
2002
.03
2002
.09
2003
.03
2003
.09
2004
.03
2004
.09
2005
.03
2005
.09
2006
.03
2006
.09
2007
.03
2007
.09
2008
.03
2008
.09
2009
.03
2009
.09
2010
.03
2010
.09
2011
.03
2011
.09
2012
.03
2012
.09
2013
.03E
transaction volume (12 months, LHS) lending attitude DI (6 months prior, RHS)
(JPY tn)
Diffusion Index (D
I)
DEUTSCHE ASSET & WEALTH MANAGEMENT Japan Real Estate Second Quarter 2013 | April 2013 5
Pricing
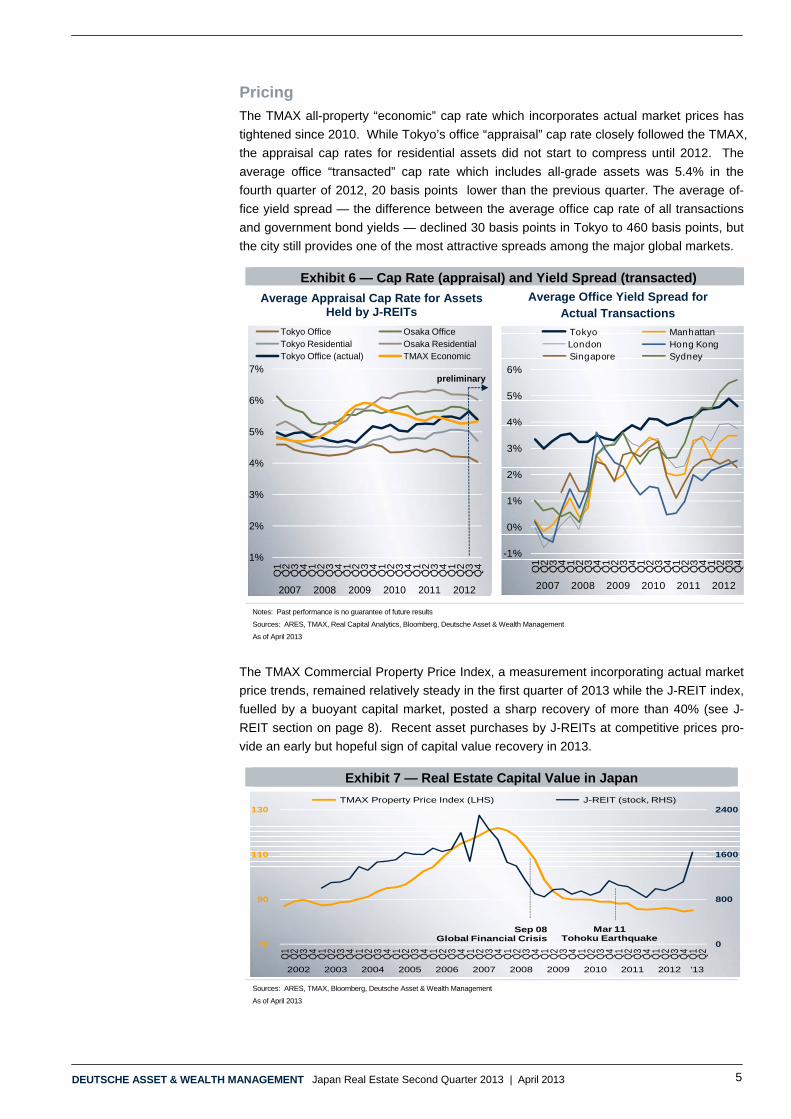
The TMAX all-property “economic” cap rate which incorporates actual market prices has
tightened since 2010. While Tokyo’s office “appraisal” cap rate closely followed the TMAX,
the appraisal cap rates for residential assets did not start to compress until 2012. The
average office “transacted” cap rate which includes all-grade assets was 5.4% in the
fourth quarter of 2012, 20 basis points lower than the previous quarter. The average of-
fice yield spread — the difference between the average office cap rate of all transactions
and government bond yields — declined 30 basis points in Tokyo to 460 basis points, but
the city still provides one of the most attractive spreads among the major global markets.
Exhibit 6 — Cap Rate (appraisal) and Yield Spread (transacted)
Average Appraisal Cap Rate for Assets Held by J-REITs
Average Office Yield Spread for Actual Transactions
Notes: Past performance is no guarantee of future results
Sources: ARES, TMAX, Real Capital Analytics, Bloomberg, Deutsche Asset & Wealth Management
As of April 2013
The TMAX Commercial Property Price Index, a measurement incorporating actual market
price trends, remained relatively steady in the first quarter of 2013 while the J-REIT index,
fuelled by a buoyant capital market, posted a sharp recovery of more than 40% (see J-
REIT section on page 8). Recent asset purchases by J-REITs at competitive prices pro-
vide an early but hopeful sign of capital value recovery in 2013.
Exhibit 7 — Real Estate Capital Value in Japan
Sources: ARES, TMAX, Bloomberg, Deutsche Asset & Wealth Management
As of April 2013
1%
2%
3%
4%
5%
6%
7%
Q1
Q2
Q3
Q4
Q1
Q2
Q3
Q4
Q1
Q2
Q3
Q4
Q1
Q2
Q3
Q4
Q1
Q2
Q3
Q4
Q1
Q2
Q3
Q4
2007 2008 2009 2010 2011 2012
Tokyo Office Osaka OfficeTokyo Residential Osaka ResidentialTokyo Office (actual) TMAX Economic
preliminary
-1%
0%
1%
2%
3%
4%
5%
6%
Q1
Q2
Q3
Q4
Q1
Q2
Q3
Q4
Q1
Q2
Q3
Q4
Q1
Q2
Q3
Q4
Q1
Q2
Q3
Q4
Q1
Q2
Q3
Q4
2007 2008 2009 2010 2011 2012
Tokyo ManhattanLondon Hong KongSingapore Sydney
0
800
1600
2400
70
90
110
130
Q1
Q2
Q3
Q4
Q1
Q2
Q3
Q4
Q1
Q2
Q3
Q4
Q1
Q2
Q3
Q4
Q1
Q2
Q3
Q4
Q1
Q2
Q3
Q4
Q1
Q2
Q3
Q4
Q1
Q2
Q3
Q4
Q1
Q2
Q3
Q4
Q1
Q2
Q3
Q4
Q1
Q2
Q3
Q4
Q1
Q2
2002 2003 2004 2005 2006 2007 2008 2009 2010 2011 2012 '13
TMAX Property Price Index (LHS) J-REIT (stock, RHS)
Sep 08Global Financial Crisis
Mar 11Tohoku Earthquake

DEUTSCHE ASSET & WEALTH MANAGEMENT Japan Real Estate Second Quarter 2013 | April 2013 6
Transactions
The number of major real estate transactions (either completed or announced) increased
since the beginning of 2013, especially in the office sector, and J-REITs dominated the list
of buyers. The prices of some of the deals were very competitive, with cap rates near or
even below 4%. It was symbolic that troubled Japanese electronics giants such as Sony
and Panasonic sold their office buildings in Central Tokyo to J-REITs and other firms in
order to slim down the balance sheets.
Exhibit 8 — Major Transactions in the First Quarter 2013
Notes: Non-office deals, assets outside Tokyo, and acquisitions by foreign managers are highlighted in gray. This table is prepared solely for information purposes and not intended to recommend or endorse any specific company's shares or other products.
Sources: Real Capital Analytics, Nikkei Real Estate Market Report, Deutsche Asset & Wealth Management
As of April 2013
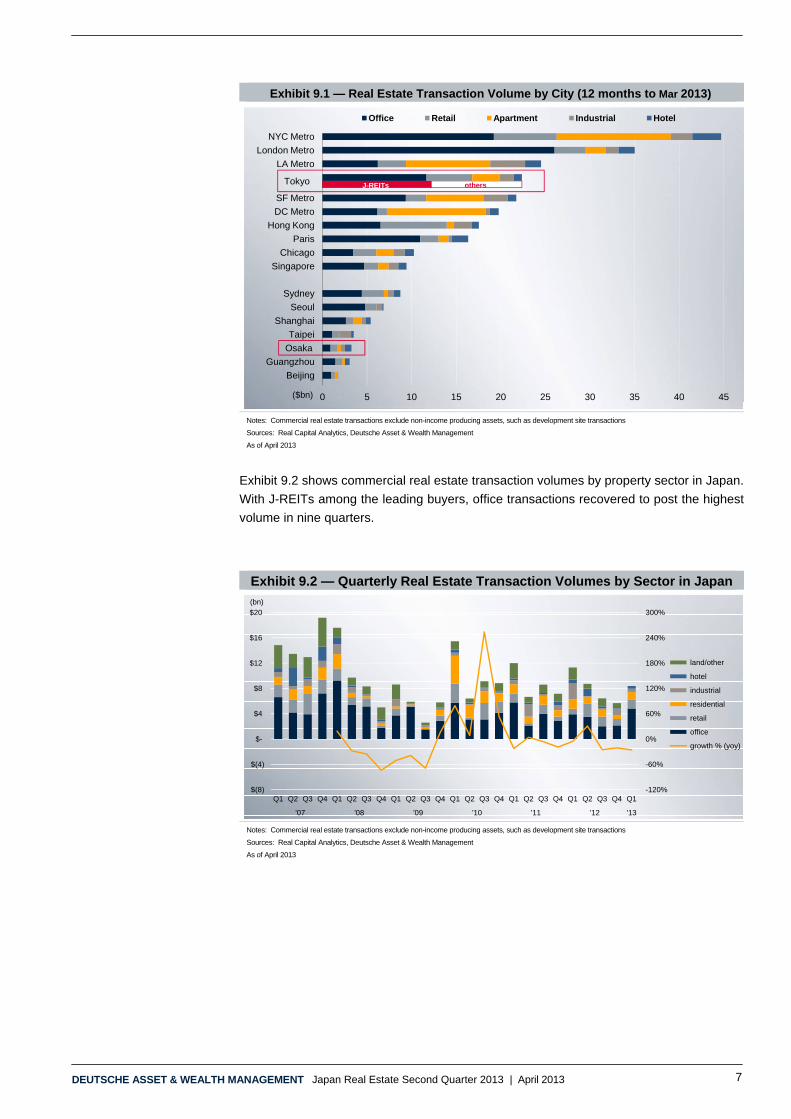
Tokyo’s volume of commercial real estate transactions for the rolling 12-month period
ending in March was US$22.4 billion, almost the same amount as the previous 12-month
run. Tokyo ranked fourth among global cities in transaction volume over the past 12
months and first among cities in the Asia Pacific region. About 55% of these transactions
were by J-REITs in Tokyo, according to our own estimate.
JPY1 billion = US$10 million
Month Type AssetPrice(JPY
billion)
Unit price(JPY m/sqm)
Caprates
Pre-fecture
Acquired byInvestor
origin
Sep-12 office KUDAN PLAZA BUILDING - - - Tokyo Goldman Sachs USNov-12 office Tokyo Panasonic Building 2 - - - Tokyo Mitsubishi Estate Japan
Nov-12 retail Shinsaibashi GATE - - - Osaka MetLife Alico US
Dec-12 office Toyokawa Bldg - - - Tokyo Goldman Sachs USDec-12 office Tokyo Panasonic Building 3 - - - Tokyo Nomura Real Estate JapanDec-12 office Navi Shibuya V - - - Tokyo Goldman Sachs USDec-12 retail NORBESA - - - Hokkaido Oaktree Capital US
Jan-13office /
residentialOnarimon M-SQUARE 14 0.88 - Tokyo Mitsui Soko Japan
Feb-13 retail Ikebukuro Square 20 1.71 6.8% Tokyo Frontier Real Estate (REIT) JapanFeb-13 dev. site Morinaga & Co Tsukaguchi facto 12 0.14 - Hyogo Haseko Corporation Japan
Feb-13 residentialIris Nihonbashi Suitengu etc(3 properties)
18 0.56 5.3%Tokyo,
KanagawaNippon AccommodationsFund (REIT)
Japan
Feb-13 officePart of Atago Green Hills andARK Mori Building
20 1.42 4.7% Tokyo Mori Hills REIT Japan
Feb-13 office Part of GranTokyo South Tower 35 3.21 - Tokyo Mitsui Fudosan JapanFeb-13 hotel Hyatt Regency Kyoto - - - Kyoto ORIX Real Estate JapanFeb-13 M&A Brighton Hotels - - - Chiba, Kyoto Oriental Land Japan
Feb-13 office Sony City Osaki 111 0.90 4.3% TokyoNippon Building Fund (REIT,60%), Domestic Investor (40%)
Japan
Mar-13 retail Fukuoka PARCO 27 1.09 - Fukuoka PARCO Japan
Mar-13 retail / hotelYodobashi-Kichijouji etc(4 properties)
28 0.74 5.2%Tokyo, Chiba
and AichiUnited Urban (REIT) Japan
Mar-13 office Shibuya Garden Front (50%) 12 1.40 4.3% Tokyo Nippon Building Fund (REIT) Japan
Mar-13 officePanasonic Tokyo ShiodomeBldg
51 1.11 4.3% TokyoSumitomo Mitsui Financeand Leasing (90%), NipponBuilding Fund (REIT, 10%)
Japan
Mar-13 residentialApartments in Nagoya city(4 properties)
5 - - AichiJV of Sparinvest PropertyInvestors and Idera Capital
Denmark
Mar-13 retail / landORE Yurakucho etc(4 properties)
33 2.31 4.1%Kanagawa,
Tokyo, OsakaORIX REIT Japan
Mar-13 landGround of Tokyo PanasonicBuilding 1
- - - Tokyo Sumitomo Realty Japan
Mar-13 office / retailPart of Hankyu NishinomiyaGardens, Hankyu Railway HQs
29 0.44 6.0% Hyogo, Osaka Hankyu REIT Japan
Mar-13 retail HEP FIVE 17 1.18 4.5% Osaka Hankyu Realty JapanMar-13 retail NU chayamachi 14 0.91 3.7% Osaka Hankyu Railway Japan
Mar-13 office Shinjuku Sanchome Bldg - - - TokyoJV of AXA Real Estate andSumitomo Mitsui Trust RealEstate Investment
France/Japan
Mar-13 residential Cosmos Kokura Eki Mae 1 0.22 6.5% Fukuoka Saizen REIT SingaporeApr-13 hotel Hilton Tokyo Bay 26 0.40 6.1% Chiba Japan Hotel REIT Japan
Apr-13 residentialLieto court Kinshicho,Lieto court Oshima
14 - - TokyoJV of Sekisui House andSpring Investment
Japan
May-13 residentialApartments in Tokyo(12 properties)
15 0.48 5.4% Tokyo Sekisui House SI (REIT) Japan
DEUTSCHE ASSET & WEALTH MANAGEMENT Japan Real Estate Second Quarter 2013 | April 2013 7
Exhibit 9.1 — Real Estate Transaction Volume by City (12 months to Mar 2013)
Notes: Commercial real estate transactions exclude non-income producing assets, such as development site transactions
Sources: Real Capital Analytics, Deutsche Asset & Wealth Management
As of April 2013
Exhibit 9.2 shows commercial real estate transaction volumes by property sector in Japan.
With J-REITs among the leading buyers, office transactions recovered to post the highest
volume in nine quarters.
Exhibit 9.2 — Quarterly Real Estate Transaction Volumes by Sector in Japan
Notes: Commercial real estate transactions exclude non-income producing assets, such as development site transactions
Sources: Real Capital Analytics, Deutsche Asset & Wealth Management
As of April 2013
0 5 10 15 20 25 30 35 40 45
NYC Metro
London Metro
LA Metro
SF Metro
DC Metro
Hong Kong
Paris
Chicago
Singapore
Sydney
Seoul
Shanghai
Taipei
Guangzhou
Beijing
Office Retail Apartment Industrial Hotel
Tokyo
($bn)
othersJ-REITs
Osaka
-120%
-60%
0%
60%
120%
180%
240%
300%
$(8)
$(4)
$-
$4
$8
$12
$16
$20
Q1 Q2 Q3 Q4 Q1 Q2 Q3 Q4 Q1 Q2 Q3 Q4 Q1 Q2 Q3 Q4 Q1 Q2 Q3 Q4 Q1 Q2 Q3 Q4 Q1
'07 '08 '09 '10 '11 '12 '13
land/other
hotel
industrial
residential
retail
office
growth % (yoy)
(bn)

DEUTSCHE ASSET & WEALTH MANAGEMENT Japan Real Estate Second Quarter 2013 | April 2013 8
Performance
IPD reported that the average annual total return for unlevered direct real estate invest-
ment in Japan held at a preliminary 3.8% in December 2012 (the latest period available).
While this represents the same return level as the previous quarter, we expect a moderate
recovery in the capital value return to materialise during 2013. Among the major property
sectors, office returns lagged in 2012 due to the recent supply surge and the relatively
weak leasing market during the year. Beginning with this edition of Japan Real Estate,
returns in the industrial sector are now included in Exhibit 10 due to the growing interest of
investors in industrial assets as well as the increasing maturity of the sector itself.
Exhibit 10 — Real Estate Total Returns in Japan (unlevered) Total Return by Component Total Return by Sector
Notes: There is a time lag because of raw data being collected through semi-annual reports. Past performance is not indicative of future results
Sources: IPD Japan Monthly Indicator, Deutsche Asset & Wealth Management
As of April 2013
J-REITs
J-REITs have recently emerged as the hottest sector in Japanese capital markets. The J-
REIT index skyrocketed from 1,115 points at the end of December 2012 to 1,643 points at
the end of March 2013, a 47% increase in just three months. This represents a record
high since the global credit crisis, and it reflects a strong belief among investors in the
possibility of inflation. The BoJ’s announced goal is to keep purchasing J-REITs continu-
ously at a pace of JPY 30 billion each year (see page 3). The concern, however, is that
rents have not yet started to recover for average-class assets (see Exhibit 18).
-15%
-10%
-5%
0%
5%
10%
15%
2003
2005
2007
2008
.06
2008
.12
2009
.06
2009
.12
2010
.06
2010
.12
2011
.06
2011
.12
2012
.06
2012
.12
Total Return Income Return
Capital Growth
preliminary
-15%
-10%
-5%
0%
5%
10%
15%
20
03
20
05
20
07
20
08.0
6
20
08.1
2
20
09.0
6
20
09.1
2
20
10.0
6
20
10.1
2
20
11.0
6
20
11.1
2
20
12.0
6
20
12.1
2
Office Retail
Residential Industrial
preliminary
DEUTSCHE ASSET & WEALTH MANAGEMENT Japan Real Estate Second Quarter 2013 | April 2013 9
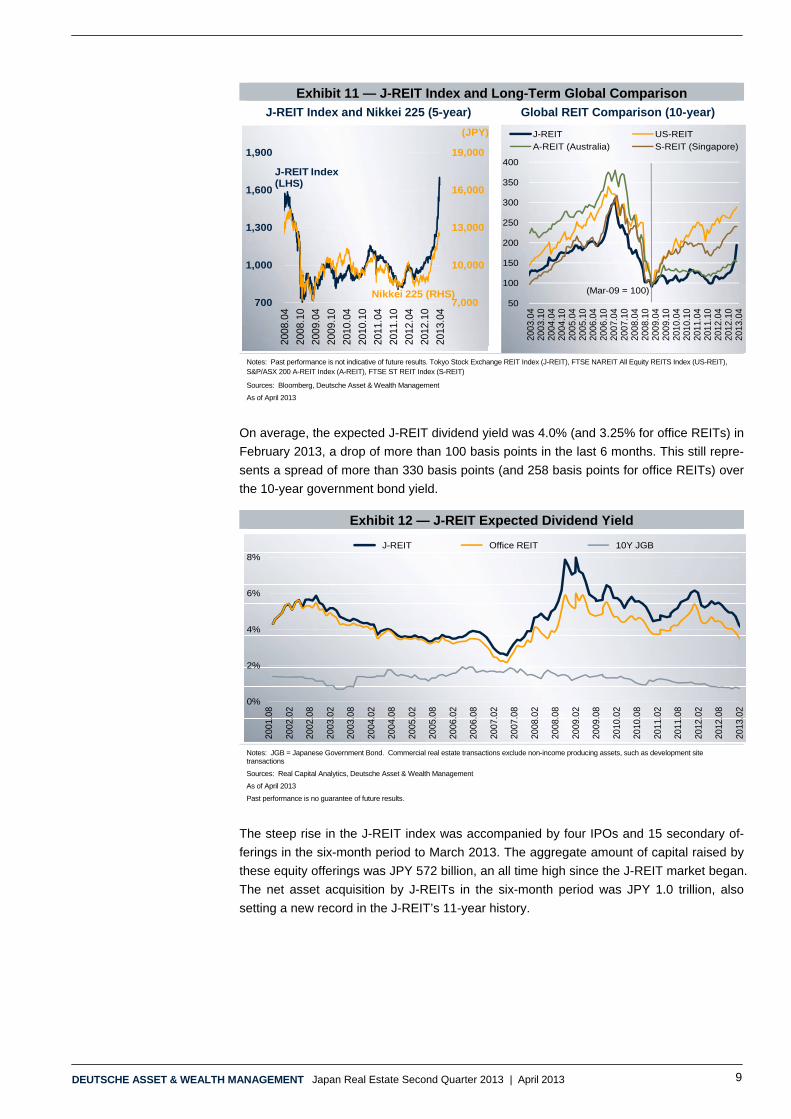
Exhibit 11 — J-REIT Index and Long-Term Global Comparison J-REIT Index and Nikkei 225 (5-year) Global REIT Comparison (10-year)
Notes: Past performance is not indicative of future results. Tokyo Stock Exchange REIT Index (J-REIT), FTSE NAREIT All Equity REITS Index (US-REIT), S&P/ASX 200 A-REIT Index (A-REIT), FTSE ST REIT Index (S-REIT)
Sources: Bloomberg, Deutsche Asset & Wealth Management
As of April 2013
On average, the expected J-REIT dividend yield was 4.0% (and 3.25% for office REITs) in
February 2013, a drop of more than 100 basis points in the last 6 months. This still repre-
sents a spread of more than 330 basis points (and 258 basis points for office REITs) over
the 10-year government bond yield.
Exhibit 12 — J-REIT Expected Dividend Yield
Notes: JGB = Japanese Government Bond. Commercial real estate transactions exclude non-income producing assets, such as development site transactions
Sources: Real Capital Analytics, Deutsche Asset & Wealth Management
As of April 2013
Past performance is no guarantee of future results.
The steep rise in the J-REIT index was accompanied by four IPOs and 15 secondary of-
ferings in the six-month period to March 2013. The aggregate amount of capital raised by
these equity offerings was JPY 572 billion, an all time high since the J-REIT market began.
The net asset acquisition by J-REITs in the six-month period was JPY 1.0 trillion, also
setting a new record in the J-REIT’s 11-year history.
7,000
10,000
13,000
16,000
19,000
700
1,000
1,300
1,600
1,900
2008
.04
2008
.10
2009
.04
2009
.10
2010
.04
2010
.10
2011
.04
2011
.10
2012
.04
2012
.10
2013
.04
J-REIT Index (LHS)
Nikkei 225 (RHS)
(JPY)
50
100
150
200
250
300
350
400
2003
.04
2003
.10
2004
.04
2004
.10
2005
.04
2005
.10
2006
.04
2006
.10
2007
.04
2007
.10
2008
.04
2008
.10
2009
.04
2009
.10
2010
.04
2010
.10
2011
.04
2011
.10
2012
.04
2012
.10
2013
.04
J-REIT US-REIT
A-REIT (Australia) S-REIT (Singapore)
(Mar-09 = 100)
0%
2%
4%
6%
8%
2001
.08
2002
.02
2002
.08
2003
.02
2003
.08
2004
.02
2004
.08
2005
.02
2005
.08
2006
.02
2006
.08
2007
.02
2007
.08
2008
.02
2008
.08
2009
.02
2009
.08
2010
.02
2010
.08
2011
.02
2011
.08
2012
.02
2012
.08
2013
.02
J-REIT Office REIT 10Y JGB

DEUTSCHE ASSET & WEALTH MANAGEMENT Japan Real Estate Second Quarter 2013 | April 2013 10
Exhibit 13 — Capital Raising and Transactions by REITs in Japan
Notes: Commercial real estate transactions exclude non-income producing assets, such as development site transactions
Sources: Real Capital Analytics, Deutsche Asset & Wealth Management
As of April 2013
The preliminary volume of commercial real estate transactions in Japan in the six months
to March 2013 was JPY 1.8 trillion, the highest six-month total in 5 years and more than
double the increase from the previous six months. It is estimated that about 60% of trans-
actions were acquired by J-REITs in the period.
Exhibit 14 — Real Estate Transactions in Japan and J-REIT Share
Notes: E = preliminary estimate. Commercial real estate transactions exclude non-income producing assets, such as development site transactions
Sources: Real Capital Analytics, Deutsche Asset & Wealth Management
As of April 2013
Major Public Offerings (JPY bn)Name of REIT Month Amount
Nippon Building Fund Jan-13 68
Advance Residence Jan-13 22
Nippon Accommodations Fund Feb-13 22
Frontier REIT Feb-13 17
United Urban Feb-13 23
ORIX REIT Mar-13 19
Initial Public Offerings
Daiwa House REIT Nov-12 52
GLP REIT Dec-12 102
Comforia Residential Feb-13 10
Nippon Prologis REIT Feb-13 97
Planned: Aeon, Hulic, Shinsei Bank, Hoshino resort
0.0
0.5
1.0
2001.0
92002.0
32002.0
92003.0
32003.0
92004.0
32004.0
92005.0
32005.0
92006.0
32006.0
92007.0
32007.0
92008.0
32008.0
92009.0
32009.0
92010.0
32010.0
92011.0
32011.0
92012.0
32012.0
92013.0
3
Bond3rd Party AllotmentPublic Of feringIPO
JPY tn
net acquisition by J-REITs
-15%
5%
25%
45%
65%
-1
0
1
2
3
200
0.0
9
200
1.0
3
200
1.0
9
200
2.0
3
200
2.0
9
200
3.0
3
200
3.0
9
200
4.0
3
200
4.0
9
200
5.0
3
200
5.0
9
200
6.0
3
200
6.0
9
200
7.0
3
200
7.0
9
200
8.0
3
200
8.0
9
200
9.0
3
200
9.0
9
201
0.0
3
201
0.0
9
201
1.0
3
201
1.0
9
201
2.0
3
201
2.0
9
201
3.0
3E
acquisition by othersacquisition by J-REITs disposition by J-REITs
(JPY tn)
J-REIT share (%) of all transactions (RHS)

DEUTSCHE ASSET & WEALTH MANAGEMENT Japan Real Estate Second Quarter 2013 | April 2013 11
Market Fundamentals
Office
The amount of new office supply in Tokyo peaked in 2012, and the office vacancy rate in
the central five wards has since begun to recover. The average office vacancy rate was
8.6% in February 2013, an improvement from the recent cyclical peak of 9.4% in June
2012. The vacancy rate for newly developed buildings also declined to 24.0% in February
2013, down from 39.2% in May 2012. Among the central five wards, Shibuya had the
tightest submarket with a vacancy rate of 6.0% in February 2013.
Exhibit 15 — Office Vacancy Rate in Central Tokyo (5 wards)
Notes: GFA = gross floor area. sqm = square metres
Sources: Miki Shoji, Deutsche Asset & Wealth Management
As of April 2013
Between December 2012 and February 2013, the vacancy rate in Tokyo declined across
all categories of floor plate sizes. For larger assets with a floor plate size of more than 200
tsubos (660 square metres), the vacancy rate dropped from 6.6% to 5.8% in the period
while it declined only marginally from 11.5% to 11.4% for the smallest category of assets,
i.e., floor plates of 50-100 tsubos (165-330 square metres).
0 %
10 %
20 %
30 %
40 %
0 %
5 %
10 %
15 %
20 %
2002
2003
2004
2005
2006
2007
2008
2009
2010
2011
2012
Feb-
13
all buildings (LHS) new buildings (RHS)
newly d
eveloped
build
ings
Vac
ancy
rat
e fo
r al
l bui
ldin
gs
Building Date FloorsGFA
(sqm)
Mar-12 10 East 39,025May-12 21 South 190,000
JP Tower May-12 38 213,323Ark Hills Sengokuyama Mori Tower Aug-12 47 143,720
Sep-12 31 North 110,000Sep-12 35 South 132,500
WATERRAS TOWER Feb-13 41 129,223New Kabuki-za Theater Building Feb-13 29 94,097Kyobashi 3-1 Project Mar-13 24 117,025Ochanomizu Sola City Mar-13 23 102,179
ARK Hills south tower Jun-13 20 55,061
Nakano Central Park
Otemachi Financial City
Major Office Supply in Tokyo

DEUTSCHE ASSET & WEALTH MANAGEMENT Japan Real Estate Second Quarter 2013 | April 2013 12
Exhibit 16 — Office Vacancy Rate in Central Tokyo by Building Floor Plate
Notes: sqm = square metres
Sources: Sanko Estate, Deutsche Asset & Wealth Management
As of April 2013
Office rental growth rates correlate inversely to the vacancy rate. Historically in Tokyo,
office rents start to increase when the vacancy rate falls below 5%. The vacancy rate for
buildings with floor plates of 200 tsubos (660 square meters) or more was 5.8% in Tokyo
in February 2013, and a level that is just above the pivotal 5% threshold.
Exhibit 17 — Vacancy Rate and Rent Growth in Tokyo (floor plate > 660 sqm)
*The tsubo is a traditional measure of floor area in Japan. It is equivalent to 3.3 square metres (35.6 square feet)
Sources: Miki Shoji, Sanko Estate, Deutsche Asset & Wealth Management
As of April 2013
Just as the decline began for Tokyo’s office vacancy rate, signs arose of a possible re-
covery in office rents, especially rents for high quality buildings. The average rent for
newly-built offices in Tokyo grew 9.2% in the two months to February 2013, the fastest
pace of growth in more than five years. The all-class average rent softened slightly during
the same period, but only by -0.2%. Given the above-average vacancy rate, we still ex-
pect the marginal declining trend to persist for all-class average rents at least until sum-
mer 2013, but it is becoming increasingly likely that rents will stabilise by the end of the
year.
0%
4%
8%
12%
1996
.08
1997
.02
1997
.08
1998
.02
1998
.08
1999
.02
1999
.08
2000
.02
2000
.08
2001
.02
2001
.08
2002
.02
2002
.08
2003
.02
2003
.08
2004
.02
2004
.08
2005
.02
2005
.08
2006
.02
2006
.08
2007
.02
2007
.08
2008
.02
2008
.08
2009
.02
2009
.08
2010
.02
2010
.08
2011
.02
2011
.08
2012
.02
2012
.08
2013
.02
floor plate : 165 sqm - 330sqm floor plate : 330 sqm - 660 sqmfloor plate > 660 sqm average
1%
3%
5%
7%
9%
11%-12%
-8%
-4%
0%
4%
8%
199
5.02
199
6.02
199
7.02
199
8.02
199
9.02
200
0.02
200
1.02
200
2.02
200
3.02
200
4.02
200
5.02
200
6.02
200
7.02
200
8.02
200
9.02
201
0.02
201
1.02
201
2.02
201
3.02
Actual Rent Growth (QoQ, 3Q rolling avg.) Vacancy Rate (RHS)
DEUTSCHE ASSET & WEALTH MANAGEMENT Japan Real Estate Second Quarter 2013 | April 2013 13
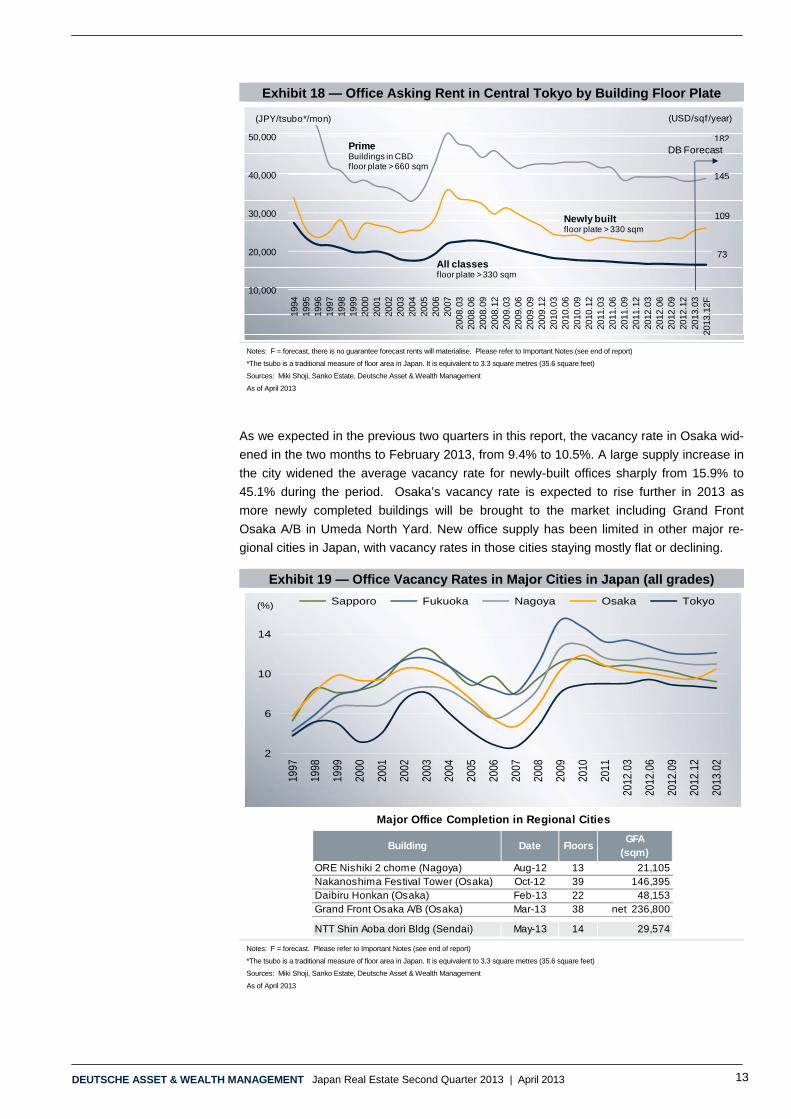
Exhibit 18 — Office Asking Rent in Central Tokyo by Building Floor Plate
Notes: F = forecast, there is no guarantee forecast rents will materialise. Please refer to Important Notes (see end of report)
*The tsubo is a traditional measure of floor area in Japan. It is equivalent to 3.3 square metres (35.6 square feet)
Sources: Miki Shoji, Sanko Estate, Deutsche Asset & Wealth Management
As of April 2013
As we expected in the previous two quarters in this report, the vacancy rate in Osaka wid-
ened in the two months to February 2013, from 9.4% to 10.5%. A large supply increase in
the city widened the average vacancy rate for newly-built offices sharply from 15.9% to
45.1% during the period. Osaka’s vacancy rate is expected to rise further in 2013 as
more newly completed buildings will be brought to the market including Grand Front
Osaka A/B in Umeda North Yard. New office supply has been limited in other major re-
gional cities in Japan, with vacancy rates in those cities staying mostly flat or declining.
Exhibit 19 — Office Vacancy Rates in Major Cities in Japan (all grades)
Notes: F = forecast. Please refer to Important Notes (see end of report)
*The tsubo is a traditional measure of floor area in Japan. It is equivalent to 3.3 square metres (35.6 square feet)
Sources: Miki Shoji, Sanko Estate, Deutsche Asset & Wealth Management
As of April 2013
10,000
20,000
30,000
40,000
50,000
1994
1995
1996
1997
1998
1999
2000
2001
2002
2003
2004
2005
2006
2007
2008
.03
2008
.06
2008
.09
2008
.12
2009
.03
2009
.06
2009
.09
2009
.12
2010
.03
2010
.06
2010
.09
2010
.12
2011
.03
2011
.06
2011
.09
2011
.12
2012
.03
2012
.06
2012
.09
2012
.12
2013
.03
2013
.12F
(JPY/tsubo*/mon) (USD/sqf/year)
109
182
145
73
Prime Buildings in CBDfloor plate > 660 sqm
All classesfloor plate > 330 sqm
Newly builtfloor plate > 330 sqm
DB Forecast
2
6
10
14
1997
1998
1999
2000
2001
2002
2003
2004
2005
2006
2007
2008
2009
2010
2011
2012
.03
2012
.06
2012
.09
2012
.12
2013
.02
Sapporo Fukuoka Nagoya Osaka Tokyo(%)
Building Date FloorsGFA
(sqm)
ORE Nishiki 2 chome (Nagoya) Aug-12 13 21,105Nakanoshima Festival Tower (Osaka) Oct-12 39 146,395Daibiru Honkan (Osaka) Feb-13 22 48,153Grand Front Osaka A/B (Osaka) Mar-13 38 net 236,800
NTT Shin Aoba dori Bldg (Sendai) May-13 14 29,574
Major Office Completion in Regional Cities
DEUTSCHE ASSET & WEALTH MANAGEMENT Japan Real Estate Second Quarter 2013 | April 2013 14
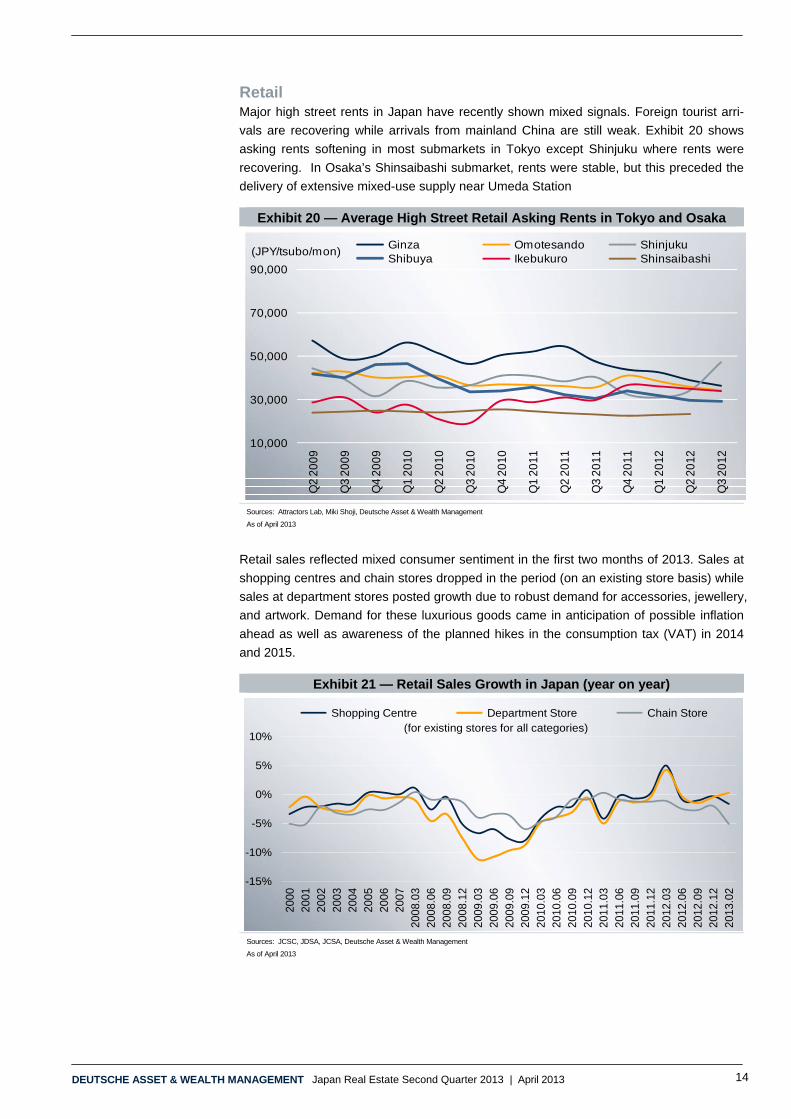
Retail Major high street rents in Japan have recently shown mixed signals. Foreign tourist arri-
vals are recovering while arrivals from mainland China are still weak. Exhibit 20 shows
asking rents softening in most submarkets in Tokyo except Shinjuku where rents were
recovering. In Osaka’s Shinsaibashi submarket, rents were stable, but this preceded the
delivery of extensive mixed-use supply near Umeda Station
Exhibit 20 — Average High Street Retail Asking Rents in Tokyo and Osaka
Sources: Attractors Lab, Miki Shoji, Deutsche Asset & Wealth Management
As of April 2013
Retail sales reflected mixed consumer sentiment in the first two months of 2013. Sales at
shopping centres and chain stores dropped in the period (on an existing store basis) while
sales at department stores posted growth due to robust demand for accessories, jewellery,
and artwork. Demand for these luxurious goods came in anticipation of possible inflation
ahead as well as awareness of the planned hikes in the consumption tax (VAT) in 2014
and 2015.
Exhibit 21 — Retail Sales Growth in Japan (year on year)
Sources: JCSC, JDSA, JCSA, Deutsche Asset & Wealth Management
As of April 2013
10,000
30,000
50,000
70,000
90,000
Q2
2009
Q3
2009
Q4
2009
Q1
2010
Q2
2010
Q3
2010
Q4
2010
Q1
2011
Q2
2011
Q3
2011
Q4
2011
Q1
2012
Q2
2012
Q3
2012
Ginza Omotesando ShinjukuShibuya Ikebukuro Shinsaibashi
(JPY/tsubo/mon)
-15%
-10%
-5%
0%
5%
10%
2000
2001
2002
2003
2004
2005
2006
2007
2008
.03
2008
.06
2008
.09
2008
.12
2009
.03
2009
.06
2009
.09
2009
.12
2010
.03
2010
.06
2010
.09
2010
.12
2011
.03
2011
.06
2011
.09
2011
.12
2012
.03
2012
.06
2012
.09
2012
.12
2013
.02
Shopping Centre Department Store Chain Store(for existing stores for all categories)

DEUTSCHE ASSET & WEALTH MANAGEMENT Japan Real Estate Second Quarter 2013 | April 2013 15
Residential
The average sales price per unit for newly-built for-sale condos in Greater Tokyo in the
first two months in 2013 declined 3.4% to JPY 44.3 million from the previous period. Sea-
sonal price softening is typical in the first two months of the year (although Exhibit 22 be-
low does not show prices broken out for either January or February of previous years).
The contract rate1 (orange line in Exhibit 22) also softened to 74.2% in the period, still
above the pivotal 70% threshold which is associated with healthy market conditions. We
expect the average sales price to rise again in the latter half of 2013 due to the current
buoyant economic sentiment and also because of our expectation that the housing tax
credit will be expanded in April 2014.2
Exhibit 22 — New Condo Unit Price and Contract Rate in Greater Tokyo
Sources: REEI, Deutsche Asset & Wealth Management
As of April 2013
Limited development of new residential rental units in Tokyo in the last two years kept the
vacancy rate on a recovering trend. It improved to 9.99% in January 2013 in the 23-ward
area (orange line in Exhibit 22), putting it below 10% for the first time in more than three
years. Asking rents showed corresponding year-on-year growth of 1.4% in the central five-
ward area in February 2013 (dark blue bar), marking 12 months of consecutive growth.
Rents were flat in the broader 23-ward area of Tokyo (gray bar) in the same period.
Exhibit 23 — Residential Rent and Vacancy in Tokyo
Notes: The tsubo is a traditional measure of floor area in Japan. It is equivalent to 3.3 square metres (35.6 square feet)
Sources: TAS Corporation with data sourced from At Home Co. Ltd. (23-ward vacancy), Leasing Management Consulting (5-ward asking rent), IPD-RECRUIT Residential Index (23-ward rent index)
As of April 2013
1 The contract rate is the ratio of units contracted (sold) to the number of units delivered for sale. 2 Please refer to the research topic of the previous edition of this report, Japan Real Estate Quarterly First Quarter 2013.
50
60
70
80
35
40
45
50
1995
1996
1997
1998
1999
2000
2001
2002
2003
2004
2005
2006
2007
.03
2007
.06
2007
.09
2007
.12
2008
.03
2008
.06
2008
.09
2008
.12
2009
.03
2009
.06
2009
.09
2009
.12
2010
.03
2010
.06
2010
.09
2010
.12
2011
.03
2011
.06
2011
.09
2011
.12
2012
.03
2012
.06
2012
.09
2012
.12
2013
.02
Avg. unit price (LHS) Contract rate (RHS)
(JPY mn/unit) (%)
7
8
9
10
11
13,100
13,500
13,900
14,300
14,700
2005
.03
2005
.12
2006
.09
2007
.06
2008
.03
2008
.12
2009
.09
2010
.02
2010
.05
2010
.08
2010
.11
2011
.02
2011
.05
2011
.08
2011
.11
2012
.02
2012
.05
2012
.08
2012
.11
2013
.02
23 ward Rent Index5 ward Asking Rent
(JPY/tsubo) (%)(Index)
103
106
109
100
97
23 ward Vacancy (RHS)

DEUTSCHE ASSET & WEALTH MANAGEMENT Japan Real Estate Second Quarter 2013 | April 2013 16
The high-end residential market correlates closely with the office leasing market. This
high-end segment of the market is strongly affected by business conditions of the corpo-
rate sector, especially financial services. The vacancy rate of high-end apartments in To-
kyo rose from 7.9% in the third quarter to 8.6% in the fourth quarter of 2012, while aver-
age rents rose 1.6% from the previous quarter. It was the second consecutive quarter of
rising rents. The rental market for the high-end residential units appears to have stabilised,
but a robust recovery may take some time. Demand draws significantly from financial ser-
vices workers, and this segment of the labour market has not yet begun to recover.
Exhibit 24 — High-end Residential Rent and Vacancy Rate in Tokyo
Sources: Ken Real Estate Investment Advisors Ltd., Miki Shoji, Deutsche Asset & Wealth Management
As of April 2013
Industrial
Due to a combination of limited supply and healthy demand for quality spaces, the leasing
market for multi-tenant logistics assets remained very tight in the fourth quarter of 2012,
with 2.2% vacancy in Greater Tokyo and 1.5% in Greater Osaka, respectively, according
to Ichigo Real Estate Service. With a number of new completions scheduled in 2013,
however, the vacancy rate is expected to increase moderately in the medium term in both
cities.
Rents declined 0.5% in Tokyo and 0.6% in Osaka respectively in the fourth quarter of
2012 while the demand outlook remains positive for the rest of 2013, with rents expected
to hold broadly steady in the period.
0
3
6
9
12
15
7,000
10,000
13,000
16,000
19,000
22,000
25,000 19
99
2000
2001
2002
2003
2004
2005
2006
2007
2008
.03
2008
.06
2008
.09
2008
.12
2009
.03
2009
.06
2009
.09
2009
.12
2010
.03
2010
.06
2010
.09
2010
.12
2011
.03
2011
.06
2011
.09
2011
.12
2012
.03
2012
.06
2012
.09
2012
.12
2013
.03
office rent high end residential rent
office vacancy high end residential vacancy(Yen/tsubo/month) (%)
QuarterlyAnnually

DEUTSCHE ASSET & WEALTH MANAGEMENT Japan Real Estate Second Quarter 2013 | April 2013 17
Exhibit 25 — Logistic Leasing Market in Greater Tokyo and Greater Osaka Vacancy Rate of Multi-tenant Logistics Logistics Rent
Notes: F = forecast, there is no guarantee forecast returns will materialise. Past performance is not indicative of future results. Tokyo Stock Exchange REIT Index (J-REIT), FTSE NAREIT All Equity REITS Index (US-REIT), S&P/ASX 200 A-REIT Index (A-REIT), FTSE ST REIT Index (S-REIT)
Sources: Bloomberg, Deutsche Asset & Wealth Management
As of April 2013
0%
5%
10%
15%
20%
20
08
.06
20
08
.12
20
09
.06
20
09
.12
20
10
.06
20
10
.12
20
11
.06
20
11
.12
20
12
.06
20
12
.12
20
13
.12F
Greater Tokyo Greater Osaka
forecast by Ichigo
1,000
2,000
3,000
4,000
5,000
2008
.06
2008
.12
2009
.06
2009
.12
2010
.06
2010
.12
2011
.06
2011
.12
2012
.06
2012
.12
2013
.12F
Greater Tokyo
Greater Osaka (JPY/tsubo/month)
forecast by Ichigo
DEUTSCHE ASSET & WEALTH MANAGEMENT Japan Real Estate Second Quarter 2013 | April 2013 18
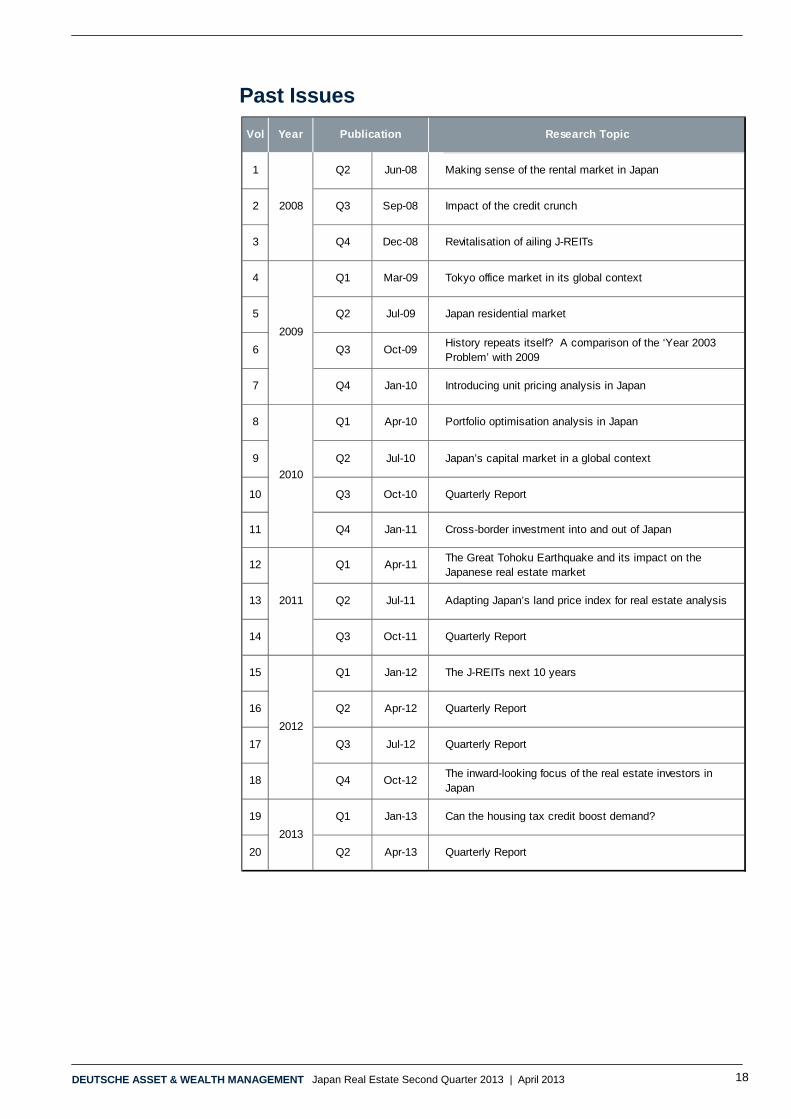
Past Issues
Vol Year
1 Q2 Jun-08 Making sense of the rental market in Japan
2 Q3 Sep-08 Impact of the credit crunch
3 Q4 Dec-08 Revitalisation of ailing J-REITs
4 Q1 Mar-09 Tokyo office market in its global context
5 Q2 Jul-09 Japan residential market
6 Q3 Oct-09History repeats itself? A comparison of the ‘Year 2003 Problem’ with 2009
7 Q4 Jan-10 Introducing unit pricing analysis in Japan
8 Q1 Apr-10 Portfolio optimisation analysis in Japan
9 Q2 Jul-10 Japan’s capital market in a global context
10 Q3 Oct-10 Quarterly Report
11 Q4 Jan-11 Cross-border investment into and out of Japan
12 Q1 Apr-11The Great Tohoku Earthquake and its impact on the Japanese real estate market
13 Q2 Jul-11 Adapting Japan’s land price index for real estate analysis
14 Q3 Oct-11 Quarterly Report
15 Q1 Jan-12 The J-REITs next 10 years
16 Q2 Apr-12 Quarterly Report
17 Q3 Jul-12 Quarterly Report
18 Q4 Oct-12The inward-looking focus of the real estate investors in Japan
19 Q1 Jan-13 Can the housing tax credit boost demand?
20 Q2 Apr-13 Quarterly Report
2011
2012
2013
Publication Research Topic
2008
2009
2010
DEUTSCHE ASSET & WEALTH MANAGEMENT Japan Real Estate Second Quarter 2013 | April 2013 19
Important Notes © 2013. All rights reserved. This has been issued and approved by Deutsche Asset & Wealth Manage-ment represents the asset management and wealth management activities conducted by Deutsche Bank AG or any of its subsidiaries. Deutsche Asset & Wealth Management’s real estate investment business is part of the Alternatives and Real Assets platform. In the US, Deutsche Asset & Wealth Management re-lates to the asset management activities of RREEF America L.L.C.; in Germany: RREEF Investment GmbH, RREEF Management GmbH, and RREEF Spezial Invest GmbH; in Australia: Deutsche Asset Management (Australia) Limited (ABN 63 116 232 154) Australian financial services license holder; in Ja-pan: Deutsche Securities Inc.*; in Hong Kong: Deutsche Bank Aktiengesellschaft, Hong Kong Branch (for direct real estate business), and Deutsche Asset Management Hong Kong (for real estate securities busi-ness), in Singapore, Deutsche Asset Management (Asia) Limited (Company Reg. No. 198701485N) and in the United Kingdom, Deutsche Alternative Asset Management (UK) Limited, Deutsche Alternative Asset Management (Global) Limited, and Deutsche Asset Management (UK) Limited; in Italy: RREEF Fondim-mobiliari SGR S.p.A; and in Denmark, Finland, Norway and Sweden: Deutsche Alternative Asset Manage-ment (UK) Ltd and Deutsche Alternative Asset Management (Global) Ltd; in addition to other regional enti-ties in the Deutsche Bank Group (*) For DSI, financial advisory (not investment advisory) and distribution services only.
Key Deutsche Asset & Wealth Management research personnel are voting members of various investment committees. Members of the investment committees vote with respect to underlying investments and/or transactions and certain other matters subjected to a vote of such investment committee. Additionally, research personnel receive, and may in the future receive incentive compensation based on the perform-ance of a certain investment accounts and investment vehicles managed by Deutsche Asset & Wealth Management and its affiliates.
This material was prepared without regard to the specific objectives, financial situation or needs of any particular person who may receive it. It is intended for informational purposes only. It does not constitute investment advice, a recommendation, an offer, solicitation, the basis for any contract to purchase or sell any security or other instrument, or for Deutsche Bank AG or its affiliates to enter into or arrange any type of transaction as a consequence of any information contained herein. Neither Deutsche Bank AG nor any of its affiliates gives any warranty as to the accuracy, reliability or completeness of information which is contained in this document. Except insofar as liability under any statute cannot be excluded, no member of the Deutsche Bank Group, the Issuer or any officer, employee or associate of them accepts any liability (whether arising in contract, in tort or negligence or otherwise) for any error or omission in this document or for any resulting loss or damage whether direct, indirect, consequential or otherwise suffered by the recipi-ent of this document or any other person.
The views expressed in this document constitute Deutsche Bank AG or its affiliates’ judgment at the time of issue and are subject to change. This document is only for professional investors. This document was prepared without regard to the specific objectives, financial situation or needs of any particular person who may receive it. No further distribution is allowed without prior written consent of the Issuer.
An investment in real estate involves a high degree of risk, including possible loss of principal amount in-vested, and is suitable only for sophisticated investors who can bear such losses. The value of shares/ units and their derived income may fall or rise. Any forecasts provided herein are based upon Deutsche Asset & Wealth Management’s opinion of the market at this date and are subject to change dependent on the market. Past performance or any prediction, projection or forecast on the economy or markets is not indicative of future performance.
The forecasts provided are based upon our opinion of the market as at this date and are subject to change, dependent on future changes in the market. Any prediction, projection or forecast on the economy, stock market, bond market or the economic trends of the markets is not necessarily indicative of the future or likely performance.
I-031300-1.0
www.rreef.com
I-031300-1.1
Global Research Team Global
Mark Roberts Head of Research & Strategy [email protected]
Americas
Ross Adams Industrial Specialist [email protected] Bill Hersler Office Specialist [email protected] Ana Leon Property Market Research [email protected] Andrew J. Nelson Retail & Sustainability Specialist [email protected] Jaimala Patel Quantitative Strategy [email protected]
Alexander Makarovski Performance & Risk Analysis [email protected] Alex Symes Economic & Quantitative Analysis [email protected] Brooks Wells Apartment Specialist [email protected] Jay Wengang Performance & Risk Analysis [email protected]
Europe
Simon Durkin Head of Research & Strategy, Europe [email protected] Jaroslaw Morawski Property Market Research [email protected]
Maren Vaeth Property Market Research [email protected] Simon Wallace Property Market Research [email protected]
Asia Pacific
Leslie Chua Head of Research & Strategy, Asia Pacific ex-Japan & Korea [email protected] Koichiro Obu Head of Research & Strategy, Japan & Korea [email protected]
Minxuan Hu Property Market Research [email protected] Natasha Lee Property Market Research [email protected]
Office Locations:
Chicago 875 North Michigan Avenue 41st Floor Chicago IL 60611-1901 United States Tel: +1 312 266 9300 Frankfurt Mainzer Landstraße 178-190 60327 Frankfurt am Main Germany Tel: +49 69 71909 0 London One Appold Street London EC2A 2UU United Kingdom Tel: +44 20 754 58000 New York 345 Park Avenue 24th Floor New York NY 10154-0102 United States Tel: +1 212 454 6260 San Francisco 101 California Street 26th Floor San Francisco CA 94111 United States Tel: +1 415 781 3300 Singapore One Raffles Quay South Tower Singapore 048583 Tel: +65 6538 7011 Tokyo Floor 17 Sanno Park Tower 2-11-1 Nagata-cho Chiyoda-Ku Tokyo Japan Tel: +81 3 5156 6000