jeff pesta, lutcf – proactive advisor magazine – volume 5 issue 11
TRANSCRIPT

March 19, 2015 | Volume 5 | Issue 11
Active investment management’s weekly magazine
Dollar strength hasuncertain implications
Is it time to retire yourstrategy?
Converting positive feedback into new business
The Anchored MomentumIndicator in security analysis
Jeff Pesta
Lesson learned
Risk management comes first

Streamline the Tax Management Conversation
Tax season is here and we’re here to help.
Our turnkey tax management marketing solution
includes educational materials, a group presentation,
and custom invitations for appointments and seminars
– all designed to help you get more clients and
prospects through your doors.
Order your custom investor education resources here.
We invest in investor resources so you don’t have to.
99-00475-68 2014/11/15
For Financial Professional Use Only.
Security Benefit, its affiliates and subsidiaries, and their respective employees and/or representatives do not provide tax, accounting or legal advice. Any statements contained herein concerning taxes are not intended as and should not be construed as tax advice, nor should they be used for the purpose of avoiding federal, state or local taxes and/or tax penalties. Please seek independent tax, accounting or legal advice.
Services offered through Security Distributors, Inc. (SDI), a subsidiary of Security Benefit Corporation (Security Benefit).
One Security Benefit Place | Topeka, Kansas 66636-0001 | 800.888.2461 | SecurityBenefit.com

Advisor perspectives on active investment management
- A custodian that makes your life as an RIA simpler.
Real numbers tell the real storyI will typically say to a client, let’s look at your returns over three years, over five years, over ten years, and even from inception. What’s the average return on what you have been doing and what has the volatility been? And then I review the historical performance of some of our active managers and I say, okay, look at what happened here in 2008. And look at what happened to your fund in 2008. And those are real numbers, apples to apples, not hypotheticals. So, if that were to happen again, how would you want your portfolio managed? 99.9% of the time the answer is the actively managed approach.
LOUD & CLEARMichael Pennica • Colorado Springs, CO Pennica Financial Group • J.W. Cole Advisors Inc.
3March 19, 2015 | proactiveadvisormagazine.com
LOUD & CLEAR

Is it time to retire your strategy, manager, fund, or ETF?
By Dave Moenning
proactiveadvisormagazine.com | March 19, 20154

here is so much to keep track of these days. There is the crash in oil prices. Terror attacks in Europe. Political drama in Greece. Unexpected decline in interest rates. Inflation expectations.
The QE program in Europe. The Fed’s next move. China’s new stock market. The global economy. And, of course, the latest earnings season and expectations for the next one.
I want to take a moment to step back from the news flow and the blinking screens to talk about investing strategy. More specifi-cally, I’d like to talk about the idea of investor expectations.
Many investors (and their advisors) recently assessed how their portfolios performed in 2014 and tried to decide if any adjustments were needed for the new calendar year. But here’s the problem. The vast majority of investors and a great many investment professionals go about this task the wrong way.
What’s your number?Ask yourself, how do you review the
performance of your investments? Is there a certain number you are looking for each year? If so, have you done your homework and do you know if that number is achievable on a long-term basis? Have you studied up on the historical returns of stocks, bonds, gold, real estate, etc.?
Or do you compare your returns to the popular indexes such as the S&P 500, the Dow Jones Industrial Average, or the Russell 2000? And if you do, should you be? For example, if you have a diversified portfolio, is it really ap-propriate to compare your holdings in stocks, bonds, commodities, emerging markets, etc. to a single index?
So, if you have a diversified portfolio, do you create a blended benchmark for the portfolio that represents the target allocations within your actual holdings? If not, you may want to consider doing so.
Let’s talk stock market returnsThe point is that there is more to analyzing
a portfolio’s return than simply looking at the S&P 500. For folks investing specifically in the stock market, comparing results to the S&P 500 is a good place to start. However, it is most definitely not the end-all, be-all number.
For example, if you hold mutual funds, do you know the specific goal/strategy of the fund? Do you know where the fund fits within the “style box” universe? And perhaps, more im-portantly, do you know how the benchmark for that specific style box performed last year? To be fair in your assessment of performance, you really ought to know the style and the objective of the fund/ETF/strategy you are using and then compare accordingly.
Last year was a good example of this point. The S&P 500 wound up with a gain of 11.39% (and over 13% in total return). As such, most investors believe it was a strong year for the overall stock market. However, this was defi-nitely not the case. While the S&P 500 put up a double-digit return, the “generals” of the market—represented by the DJIA—gained just 7.52%. And then the small caps, where so many growth-oriented investors are focused, returned 3.69% (4.9% total return). So, as you can see, not all stocks were created equal in 2014.
And this dichotomy got worse the further away from a passive S&P strategy one strayed.
A difficult environment for someBy now you’ve probably seen the headlines that
2014 was not a good year for active managers. For example, hedge funds had one of their weakest years on record. The HFR Equity Hedge Index saw a return of 2.26% last year. And the HFR Global Hedge Fund Index was down 0.6% in 2014.
continue on pg. 11
T
2014 return performance for various asset classes and sectors
S&P 500 Total Return USD (SPY) 13.7%
Russell 2000 Total Return (IWM) 4.9%
High Yield Bonds (BofA HY Index) 2.5%
Fixed Income (Barclays U.S. Agg. Bond Index) 6.0%
S&P Utilities Index (UTIL) 29.0%
S&P Energy Index (ENRS) -7.8%
Emerging Market Index (MSCI EM) -1.8%
International Developed Index (MSCI EAFE) -4.5%
HFR Global Hedge Fund Index -0.6%
Cash (U.S. 3-mo T-Bill) 0.0%
Source: BlackRock, Yahoo! Finance, novelinvestor.com
March 19, 2015 | proactiveadvisormagazine.com 5

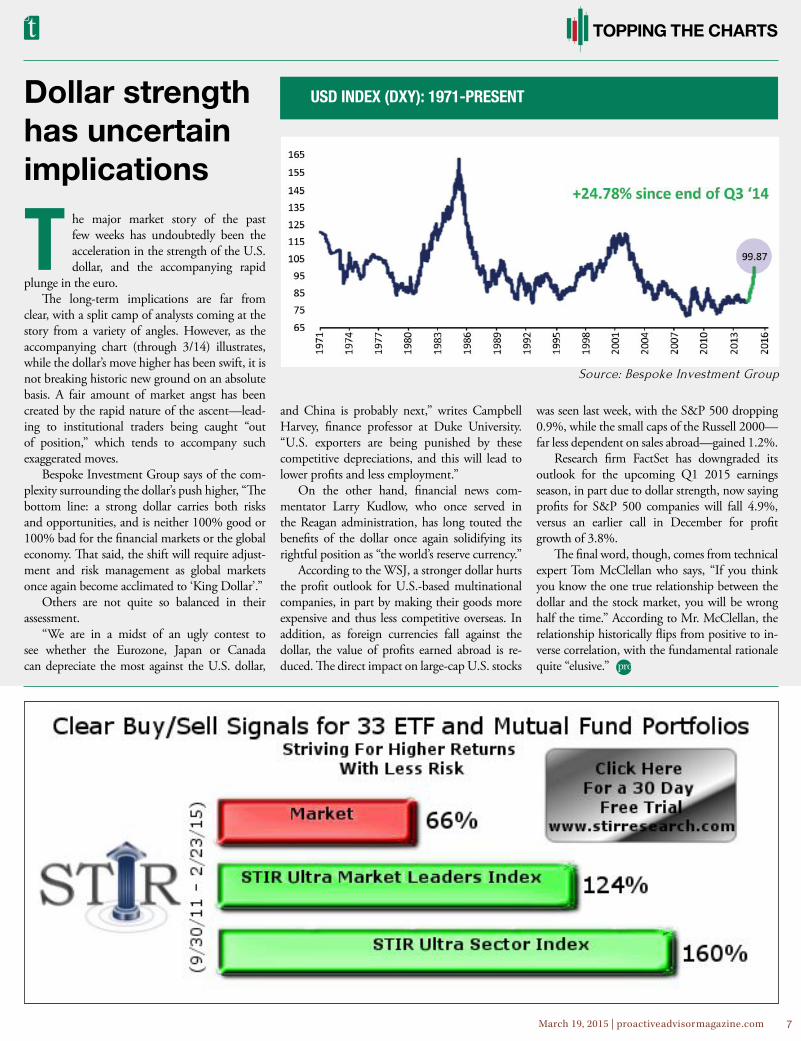
Dollar strengthhas uncertainimplications
he major market story of the past few weeks has undoubtedly been the acceleration in the strength of the U.S. dollar, and the accompanying rapid
plunge in the euro. The long-term implications are far from
clear, with a split camp of analysts coming at the story from a variety of angles. However, as the accompanying chart (through 3/14) illustrates, while the dollar’s move higher has been swift, it is not breaking historic new ground on an absolute basis. A fair amount of market angst has been created by the rapid nature of the ascent—lead-ing to institutional traders being caught “out of position,” which tends to accompany such exaggerated moves.
Bespoke Investment Group says of the com-plexity surrounding the dollar’s push higher, “The bottom line: a strong dollar carries both risks and opportunities, and is neither 100% good or 100% bad for the financial markets or the global economy. That said, the shift will require adjust-ment and risk management as global markets once again become acclimated to ‘King Dollar’.”
Others are not quite so balanced in their assessment.
“We are in a midst of an ugly contest to see whether the Eurozone, Japan or Canada can depreciate the most against the U.S. dollar,
TSource: Bespoke Investment Group
and China is probably next,” writes Campbell Harvey, finance professor at Duke University. “U.S. exporters are being punished by these competitive depreciations, and this will lead to lower profits and less employment.”
On the other hand, financial news com-mentator Larry Kudlow, who once served in the Reagan administration, has long touted the benefits of the dollar once again solidifying its rightful position as “the world’s reserve currency.”
According to the WSJ, a stronger dollar hurts the profit outlook for U.S.-based multinational companies, in part by making their goods more expensive and thus less competitive overseas. In addition, as foreign currencies fall against the dollar, the value of profits earned abroad is re-duced. The direct impact on large-cap U.S. stocks
was seen last week, with the S&P 500 dropping 0.9%, while the small caps of the Russell 2000—far less dependent on sales abroad—gained 1.2%.
Research firm FactSet has downgraded its outlook for the upcoming Q1 2015 earnings season, in part due to dollar strength, now saying profits for S&P 500 companies will fall 4.9%, versus an earlier call in December for profit growth of 3.8%.
The final word, though, comes from technical expert Tom McClellan who says, “If you think you know the one true relationship between the dollar and the stock market, you will be wrong half the time.” According to Mr. McClellan, the relationship historically flips from positive to in-verse correlation, with the fundamental rationale quite “elusive.”
USD INDEX (DXY): 1971-PRESENT
7March 19, 2015 | proactiveadvisormagazine.com
TOPPING THE CHARTS
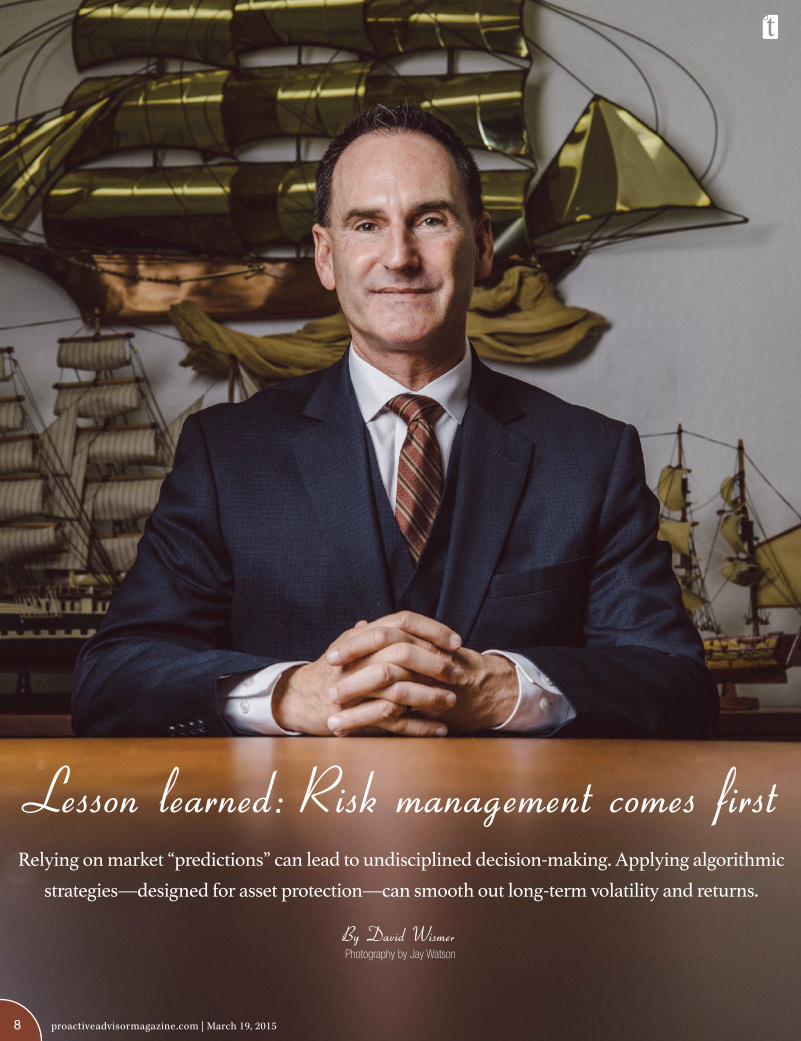
Lesson learned: Risk management comes firstRelying on market “predictions” can lead to undisciplined decision-making. Applying algorithmic
strategies—designed for asset protection—can smooth out long-term volatility and returns.
By David WismerPhotography by Jay Watson
8 proactiveadvisormagazine.com | March 19, 2015

Jeff Pesta entered the financial services industry 22 years ago with one goal: Helping people better under-stand and navigate the world of personal finance. With a vision to build his firm based on trust and respect, Mr. Pesta firmly believes he has far exceeded that objec-tive. Mr. Pesta took over the tax practice his parents first established in the 1970s and has expanded the firm to offer a wide range of financial and investment services through LPL Financial. Mr. Pesta earned a bachelor’s degree from San Jose State University with an emphasis in finance and eco-nomics. He holds Series 7 and 66 registrations and is a licensed agent for several insurance companies. Mr. Pesta has extensive experience advising individuals, families, and corporations and feels his specialty is breaking down complex issues with a concise approach to address financial concerns and opportunities.
“Putting my clients ahead of everything else has been the foundation for my business,” Mr. Pesta says. “It has enabled me and my firm to enjoy many years of suc-cess in this community.”
Mr. Pesta and his wife Lisa reside in Gilroy, California. They have twin boys, aged 18, a son, 22, and a daugh-ter, 23, all of whom are “hard at work” with college or graduate studies in California.
Jeff Pesta, LUTCF San Jose, CA
Broker-dealer: LPL Financial
Licenses: 7, 66, L&H
Estimated AUM: $33M
Recognitions: Life Underwriter Training Council Fellow
Proactive Advisor Magazine: Jeff, what initially prompted your interest in active investment management?
Jeff Pesta: In the late 1990s and early 2000s I became very frustrated after hearing from economists, mutual fund managers, and as-sorted other investment professionals who were offering expert opinion and advice at seminars and conferences. They were sincere and well-in-tentioned, but their messages were often off the mark in terms of what was really happening with the economy or the markets.
In my opinion, more often than not, what they were positioning as ways to help clients make investment decisions turned out to be the exact opposite of what ultimately was the right direc-tion. My frustration was hearing what seemed to be a great story, explanation, or rationale and then going back to try to manage investments based on that—and not having success, left feeling very foolish in front of my clients.
In the market declines surrounding 9/11 and the dot-com bust, supposedly non-correlated assets appeared to be correlated. Everything basically went down hard, though some asset classes or sectors were far worse than others. I did my best to help manage clients’ investments through that difficult period, but it was very unwieldy and inefficient making multiple moves across asset classes and alternatives for my clients.
I decided fairly quickly there had to be a better way to manage investments than to count on market “predictions” or to think a standard diversified, asset-allocation approach would afford the portfolio protection that is needed.
Where did that lead your investment thinking?
I put a lot of time into doing my own research on investment theory, technical analysis, and portfolio allocations. In effect, I became an “active manager” to the best of my ability on behalf of my clients.
I became very knowledgeable and fairly adept at money management, but it goes back to efficiency and my own time manage-ment. Managing investments across diverse client needs, risk profiles, and objectives is a full-time responsibility best put in the hands of the real experts. I have become a strong advocate of third-party active investment management.
I conduct my own due diligence of managers, in addition to that performed by LPL Financial, and look for those managers who I think are best-in-class. Based on everything I
know about sound investing in today’s markets, these managers have the ability to put together the portfolio allocations and trading implemen-tation with the software, algorithms, staff, and models to manage money the way I think it should be managed across my client base. Yes, there are fees involved, but I think you get what you pay for and it is well worth it.
How do you go about selecting third-party managers?
The overall criteria are pretty simple in concept, but the investigation is not. I need answers to two basic questions: 1) is their meth-odology well-developed and their strategies in sync with the objectives I want for my clients, and 2) can they implement the way they say they will. As part of this, I tend to drive the process in terms of researching and interview-ing potential managers. I also want to speak to their staff—the people actually developing the portfolio models and trading strategies. It is a very rigorous process.
What is the benefit to your clients?
Most of my clients are planning for re-tirement or already retired. The number-one benefit is the risk management element of active management—how does the manager’s approach perform during down markets? My clients cannot afford, literally and emotionally, to sustain 30, 40, or 50% drawdowns to their portfolios. In my opinion they also are not well-served by a buy-and-hold approach that essentially went nowhere.
I explain to clients that active manage-ment performs best when there is a clearly
continue on pg. 10
“There is a better way to manage investments than counting on market predictions or a standard asset- allocation approach.”
9March 19, 2015 | proactiveadvisormagazine.com
Jeff Pesta is a Registered Representative with and Securities and Advisory services offered through LPL Financial, a registered investment advisor. Member FINRA & SIPC. Investing involves risk, including potential loss of principal. No strategy ensures success or protects against a loss. Pesta & Pesta Tax Preparation is a separate unaffiliated entity from LPL Financial.
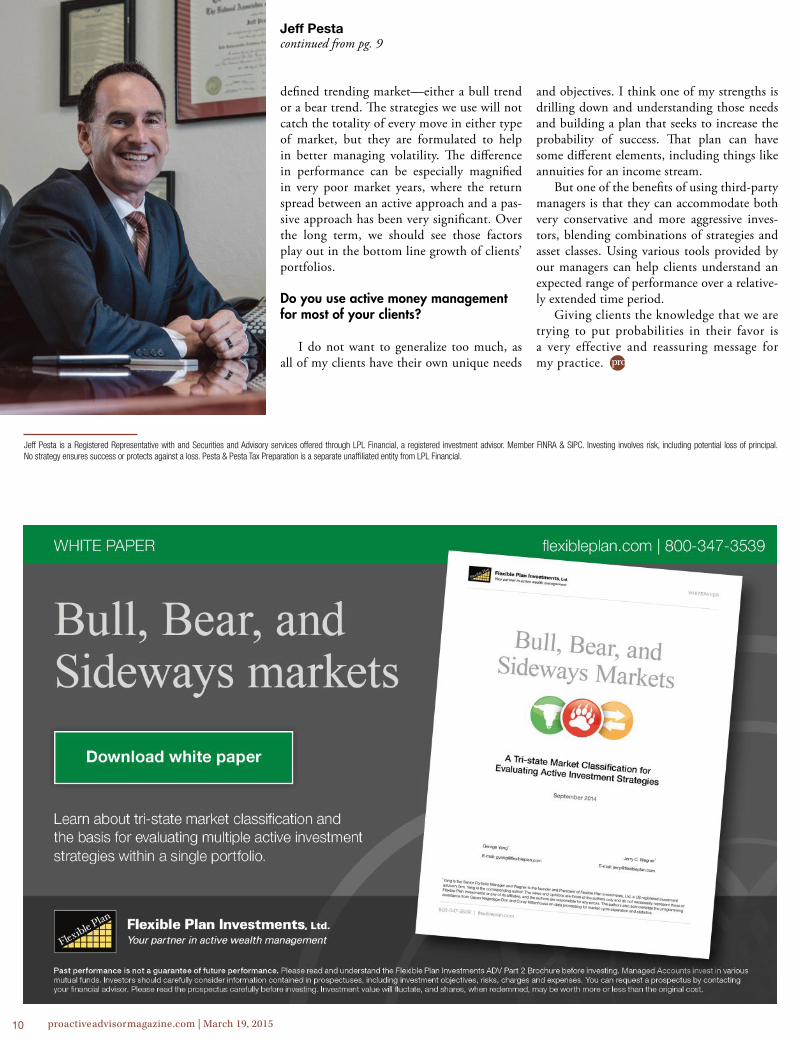
defined trending market—either a bull trend or a bear trend. The strategies we use will not catch the totality of every move in either type of market, but they are formulated to help in better managing volatility. The difference in performance can be especially magnified in very poor market years, where the return spread between an active approach and a pas-sive approach has been very significant. Over the long term, we should see those factors play out in the bottom line growth of clients’ portfolios.
Do you use active money management for most of your clients?
I do not want to generalize too much, as all of my clients have their own unique needs
and objectives. I think one of my strengths is drilling down and understanding those needs and building a plan that seeks to increase the probability of success. That plan can have some different elements, including things like annuities for an income stream.
But one of the benefits of using third-party managers is that they can accommodate both very conservative and more aggressive inves-tors, blending combinations of strategies and asset classes. Using various tools provided by our managers can help clients understand an expected range of performance over a relative-ly extended time period.
Giving clients the knowledge that we are trying to put probabilities in their favor is a very effective and reassuring message for my practice.
continued from pg. 9Jeff Pesta
10 proactiveadvisormagazine.com | March 19, 2015
✦ A dynamic repository of actual performance data from model accounts trading in real-time
✦ Focused on actively managed strategies using tactical and quantitative models
✦ Ranking and analytical tools facilitate research and the due diligence process
Limited time offer — Call today or visit www.thetaresearch.com/proactive for more information.
Because nothing beats verified, actual performance
www.thetaresearch.com • [email protected]
HAVING TROUBLE TRACKING AND RANKING THE TACTICAL INVESTMENT MANAGERS ON YOUR RADAR SCREEN?
Let Theta Research do the work — Get a free 7-day subscription to the Theta Database.
In addition, some very big names in the active space got spanked last year. One firm, which manages in excess of $5 billion, saw their flagship strategy fall more than 20.5% during the 2014 calendar year.
Next, according to a report from Bank of America Merrill Lynch, a measurement of the alpha (the risk-adjusted return above the overall stock market’s return) in the market hit the lowest level in more than 30 years last year.
The point here is that the S&P 500’s return didn’t really tell the story of how the year went for those active managers attempting to manage risk and create some alpha.
What’s an investor to do?So, what do you do if your portfolio underperformed the S&P
500? Fire the manager? Quit the strategy? Move into a different fund/ETF? Write a nasty note telling the manager how disappointed you are?
The next point might be tough to take for some. You see, there is no such thing as a silver bullet in this business. Sorry, but there is not a “Holy Grail” fund/manager/ETF/strategy that wins year in and year out, without ever letting you down.
And yet, this is what a lot of investors think they should be receiving from their funds/advisors.
continued from pg. 5
continue on pg. 13
Time to retire?
This too shall passBehavioral finance reminds us that ignoring daily volatility roiling the markets is wise—avoiding the overreaction that Nobel laureate Daniel Kahneman warns against.
The global stock-bond disconnectWhat are the implications stemming from the great disconnect of global equity highs and record low real interest rates?
Black Swans posing the biggest market threatsEconomists at Société Générale attempt to identify a few scenarios that could blindside markets around the world.
L NKS WEEK
March 19, 2015 | proactiveadvisormagazine.com 11
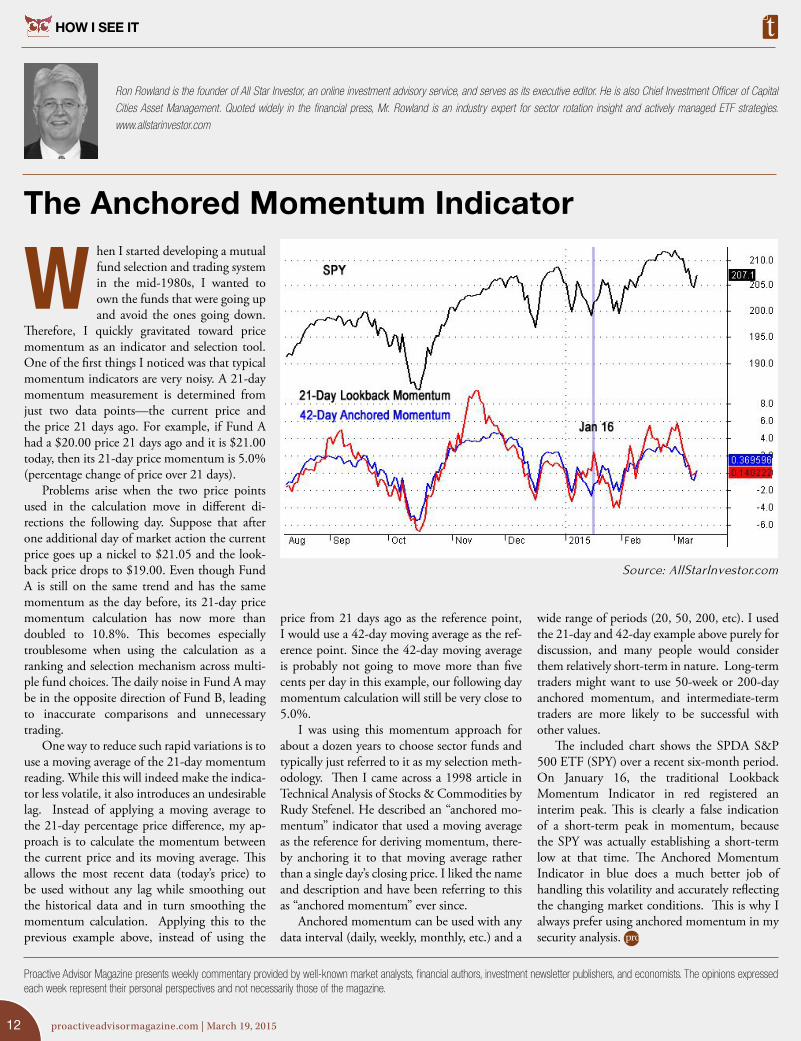
The Anchored Momentum Indicator
Ron Rowland is the founder of All Star Investor, an online investment advisory service, and serves as its executive editor. He is also Chief Investment Officer of Capital Cities Asset Management. Quoted widely in the financial press, Mr. Rowland is an industry expert for sector rotation insight and actively managed ETF strategies. www.allstarinvestor.com
hen I started developing a mutual fund selection and trading system in the mid-1980s, I wanted to own the funds that were going up and avoid the ones going down.
Therefore, I quickly gravitated toward price momentum as an indicator and selection tool. One of the first things I noticed was that typical momentum indicators are very noisy. A 21-day momentum measurement is determined from just two data points—the current price and the price 21 days ago. For example, if Fund A had a $20.00 price 21 days ago and it is $21.00 today, then its 21-day price momentum is 5.0% (percentage change of price over 21 days).
Problems arise when the two price points used in the calculation move in different di-rections the following day. Suppose that after one additional day of market action the current price goes up a nickel to $21.05 and the look-back price drops to $19.00. Even though Fund A is still on the same trend and has the same momentum as the day before, its 21-day price momentum calculation has now more than doubled to 10.8%. This becomes especially troublesome when using the calculation as a ranking and selection mechanism across multi-ple fund choices. The daily noise in Fund A may be in the opposite direction of Fund B, leading to inaccurate comparisons and unnecessary trading.
One way to reduce such rapid variations is to use a moving average of the 21-day momentum reading. While this will indeed make the indica-tor less volatile, it also introduces an undesirable lag. Instead of applying a moving average to the 21-day percentage price difference, my ap-proach is to calculate the momentum between the current price and its moving average. This allows the most recent data (today’s price) to be used without any lag while smoothing out the historical data and in turn smoothing the momentum calculation. Applying this to the previous example above, instead of using the
W
price from 21 days ago as the reference point, I would use a 42-day moving average as the ref-erence point. Since the 42-day moving average is probably not going to move more than five cents per day in this example, our following day momentum calculation will still be very close to 5.0%.
I was using this momentum approach for about a dozen years to choose sector funds and typically just referred to it as my selection meth-odology. Then I came across a 1998 article in Technical Analysis of Stocks & Commodities by Rudy Stefenel. He described an “anchored mo-mentum” indicator that used a moving average as the reference for deriving momentum, there-by anchoring it to that moving average rather than a single day’s closing price. I liked the name and description and have been referring to this as “anchored momentum” ever since.
Anchored momentum can be used with any data interval (daily, weekly, monthly, etc.) and a
wide range of periods (20, 50, 200, etc). I used the 21-day and 42-day example above purely for discussion, and many people would consider them relatively short-term in nature. Long-term traders might want to use 50-week or 200-day anchored momentum, and intermediate-term traders are more likely to be successful with other values.
The included chart shows the SPDA S&P 500 ETF (SPY) over a recent six-month period. On January 16, the traditional Lookback Momentum Indicator in red registered an interim peak. This is clearly a false indication of a short-term peak in momentum, because the SPY was actually establishing a short-term low at that time. The Anchored Momentum Indicator in blue does a much better job of handling this volatility and accurately reflecting the changing market conditions. This is why I always prefer using anchored momentum in my security analysis.
Proactive Advisor Magazine presents weekly commentary provided by well-known market analysts, financial authors, investment newsletter publishers, and economists. The opinions expressed each week represent their personal perspectives and not necessarily those of the magazine.
Source: AllStarInvestor.com
proactiveadvisormagazine.com | March 19, 201512
HOW I SEE IT

There can be no assurance that any investment product will achieve its investment objective(s). There are risks associated with investing, including the entire loss of principal invested. Investing involves market risk. The investment return and principal value of any investment product will fluctuate with changes in market conditions. Guggenheim Investments represents the investment management businesses of Gug-genheim Partners, LLC. Securities offered through Guggenheim Funds Distributors, LLC. Guggenheim Funds Distributors, LLC is affiliated with Guggenheim Partners, LLC. x0515 #12526
Uncover the True Cost of Trading Mutual Funds and ETFs
The reflexive perception that ETFs cost less, simply based on their low expense ratios, and are more cost-effective than mutual funds, is not entirely true. In addition to an expense ratio, there are additional considerations that should be considered when making an informed choice between ETFs and funds— including spreads and commissions. This informative white paper from Rydex Funds provides an in-depth look at the cost of ownership of no-transaction-fee (NTF) mutual funds and ETFs—with a focus on active investing strategies.
Request your free copy.Call 630.505.3749 or visit guggenheiminvestments.com/rydex
Chicago | New York City | Santa Monica
Rydex Funds
A Comparison of ETFs and Mutual Funds—The True Cost of Investing
continued from pg. 11
There is a price for admission …Here’s the really big point: If you are imple-
menting a strategy that attempts to do much of anything other than buy-and-hold the S&P 500 (for example, trying to avoid the nastiness that occurs in bear market environments AND outperform the S&P over time) you need to understand that there will be times when you have to pay the price of admission for such aspirations.
There will be times when things just don’t go your way. There will be times when you are frustrated or disappointed. If you want to have your cake and eat it too in this game, you need to understand that there will be bumps in the road. And this is what I deem the real secret to long-term investing success—understanding the game and having the proper expectations. The bottom line is that ALL investment ap-proaches/strategies/styles underperform from time to time—even those of Warren Buffett,
the man perceived as the greatest investor of his generation.
With that said, does it still make sense to compare everything to the S&P 500 or to that number in your head? Wouldn’t it make more sense to actually compare apples to apples—to compare what you are trying to accomplish to an appropriate benchmark?
So, before you send that scathing email to your financial advisor for underperforming the S&P 500 last year, you may want to do some
homework. Be sure to first identify what your overall objective was. And then determine how other strategies similar to yours performed.
If your portfolio lost 20% when most others in the class produced returns within a couple percent of breakeven, then by all means, fire that manager or quit that strategy.
However, if you were planning to fire the manager/fund/ETF/strategy because it failed to outperform the S&P 500 last year—while the return was within the norm of returns for the style utilized—you may want to give that decision a second thought.
Time to retire?
Dave Moenning is the founder of StateoftheMarkets.com. In addition to providing free and subscription-based portfolios on “State,” Dave is a full-time money manager and the president and Chief Investment Strategist of the Chicago-based RIA firm, Heritage Capital Management.
What do you
do if your portfolio
underperformed
the S&P 500?
Editor’s note: This article was first published at StateoftheMarkets.com, January 13, 2015.
13March 19, 2015 | proactiveadvisormagazine.com
Advertising proactiveadvisormagazine.com/advertising
Reprintsproactiveadvisormagazine.com/reprints
Copyright 2015© Dynamic Performance Publishing, Inc. All rights reserved. Reproduction of printed form, whole or in part, without permission is prohibited.
EditorDavid Wismer
Associate EditorElizabeth Whitley
Contributing WritersDave MoenningRon RowlandDavid Wismer
Graphic DesignerTravis Bramble
Contributing PhotographerJay Watson
March 19, 2015Volume 5 | Issue 11
Proactive Advisor Magazine is dedicated to promoting and educating on active investment management. Distribution reaches a wide audience of financial professionals who advise clients on investments and portfolio management. Each issue features an experienced investment advisor who offers insights on active money management, client service, and investment approaches. Additionally, Proactive Advisor Magazine offers an up-close look at a topic with current relevance to the field of active management.
The opinions and forecasts expressed herein are those of the author and may not actually come to pass. Any opinions and viewpoints regarding the future of the markets should not be construed as recommendations of any specific security nor specific investment advice. The analysis and information in this edition and on our website is for informational purposes only. No part of the material presented in this edition or on our websites is intended as an investment recommendation or investment advice. Neither the information nor any opinion expressed nor any portfolio constitutes a solicitation to purchase or sell securities or any investment program.
Converting positive feedback into new business
Steve MoleskyEllicott, MD
Kalos Capital Inc.Stephen M. Molesky & Associates
Securities offered through Kalos Capital Inc. and Investment Advisory Services offered through Kalos Management Inc., both at 11525 Park Woods Circle, Alpharetta, Georgia 30005, (678) 356-1100. Stephen M. Molesky & Associates is not an affiliate or subsidiary of Kalos Capital Inc. or Kalos Management Inc.
In the end, converting positive feed-back from existing clients into a stream of new clients is really the most effective way to market a practice. There is really no better time to ask for a referral than when a client is expressing satisfaction with your services. One of my priorities for this year is to make good use of those opportunities during client review sessions.
o cultivate new clients, we do a number of educational seminars to the public. We are not trying to sell anything, per se, but
rather getting the word out on important issues in planning for retirement. My staff uses a direct mail company and identifies an area with the right demographic makeup: Individuals or couples between the ages of 55 and 70 and with a net worth substantial enough where they may consider financial planning and investment services.
I make the presentations informative and provocative, identifying challenges most people face in reaching the type of lifestyle they would like in retirement. We usually have a number of people seek to have individual meetings after the seminar, as they have seen, hopefully, that we are planners first, not salespeople.
For our existing clients, we hold con-tinuing education seminars. We actively seek out the topics they want to learn more about and structure presentations accord-ingly. They are invited to bring friends, relatives, and co-workers, and that works well in terms of new prospect introduc-tions. We have covered a wide range of topics, from estate planning to changes in the tax code, to quantitative active invest-ment management. Sometimes we bring in an outside expert speaker to address a specific investment topic, which is always very popular.
T
14
TIPS & TOOLS
