jf .. 1fp: ' · a new blood pump and oxygenator system ... is a logical solution to this...
TRANSCRIPT

A NEW BLOOD PUMP AND OXYGENATOR SYSTEM
FOR SUPPORT OF INFANTS WITH
NEONATAL RESPIRATORY DISTRESS
PRELIMINARY IN VITRO AND IN VIVO EVALUATION
by
Andre A •. Muelenaer, Jr.
Thesis subinitted to the'Graduate Faculty of the
Virginia Polytechnic .Institute and State University
in partial fulfillment of the requirements for.the degree of
APPROVED:
MASTER.OF·SCIE'NCE
in
Zoology
~ Jf .. 1fP: ' coQChaimn
H.R. Steeves, III, Co-Chairman
T.L. Bibb
April, 1979_ Blacksburg, VA

DEDICATION
This thesis is dedicated to John Clark Osborne, D.V.M.,
who died before its completion. Dr. Osborne was responsible for
all surgery in this research. He served on my committee and
added much to the richness of my education. He was an excellent
teacher, a scholar, and friend. His contributions to the quality
of the l ives of those who knew him are missed.
ii

ACKNOWLEDGEMENTS
This research was supported by the Western Electric Fund. I
wish to thank all of the persons responsible for the success of this
project. Dr. Leon J. Arp is thanked for his assistance throughout
the project. Dr. J.B. Jones is thanked for his efforts to fund
my education during this project. Dr. Harrison R. Steeves was of
great help in planning my course work. Dr. R.F. Kelly of Food
Sciences and Technology, Dr. C.W. Heald of Dairy Science, and
Dr. K.E. Webb of Animal Science are thanked for contributions of
materials used in the experiments. Without the help of my under-
graduate research students;
and :, not. much would have been accomplished.
is thanked for the in vitro data coi1ection.
is thanked for her assistance in the surgical procedures. A special
thanks is extended to my friend, , who shared the task of
building the oxygenator and donated his time in helping with the
in vivo trials. of Becton-Dickinson Co. is thanked for
providing tubing adapters at a time of critical need. Dr. T.L. Bibb
is thanked for joining my committee after the death of Dr. John Clark
Osborne.
iii

TABLE OF CONTENTS
DEDICATION . . .
ACKNOWLEDGEMENTS
LIST OF FIGURES
LIST OF TABLES .
1. INTRODUCTION
A. FETAL AND NEONATAL CIRCULATION .
B. NEONATAL RESPIRATORY DISTRESS
C. BLOOD OXYGENATORS
D. BLOOD PUMPS
E. PUMPS AND OXYGENATORS
F. COMPARISON OF OXYGENATOR: DAMAGE
G. COMPARISON OF PUMP OAMAGE
H. SYSTEM TESTED
REVIEW OF PREVIOUS STUDIES
2. PRELIMINARY IN VITRO STUDY .
A. OBJECTIVES . . .
B. MATERIALS AND METHODS
C. DISCUSSION AND CONCLUSIONS OF IN VITRO STUDY .
3. IN VIVO STUDY: SHORT TERM ANIMAL WORK
A. PRE-TRIAL CONSIDERATIONS
B. MATERIALS AND METHODS
C. INDIVlDUAL TRIALS AND DATA
iv
. .
PAGE
ii
iii
vi
vii
1
1
4
6
7
9
10
10
11
11
13
13
13
19
25
25
27
39

D. DISCUSSION OF IN VIVO TESTING
E. CONCLUSIONS: PRELIMINARY IN VIVO WORK .
4 . RECOMMENDATIONS
5. LITERATURE CITED •.
6. APPENDICES . . . .
A. CYANEMETHEGLOBIN METHOD FOR PLASMA HEMOGLOBIN
DETERMINATION
B. TESTS AND MACHINES USED
C. BLOOD TYPING • . . . . .
D. INJECTION PROCEDURE AND SHAVING J
E. ACTIVATED PARTIAL THROMBOPLASTIN TIME TEST •
F. MATERIALS REQUIRED FOR ONE TRIAL •
7. VITA
ABSTRACT
v
PAGE 41
47
50
52
54
55
56
57
59
61
62
65

FIGURE
1
2
3
4
5
Fetal Circulation • •
Neonatal Circulation
Blood Pumps . •
In Vitro Study
LIST OF FIGURES
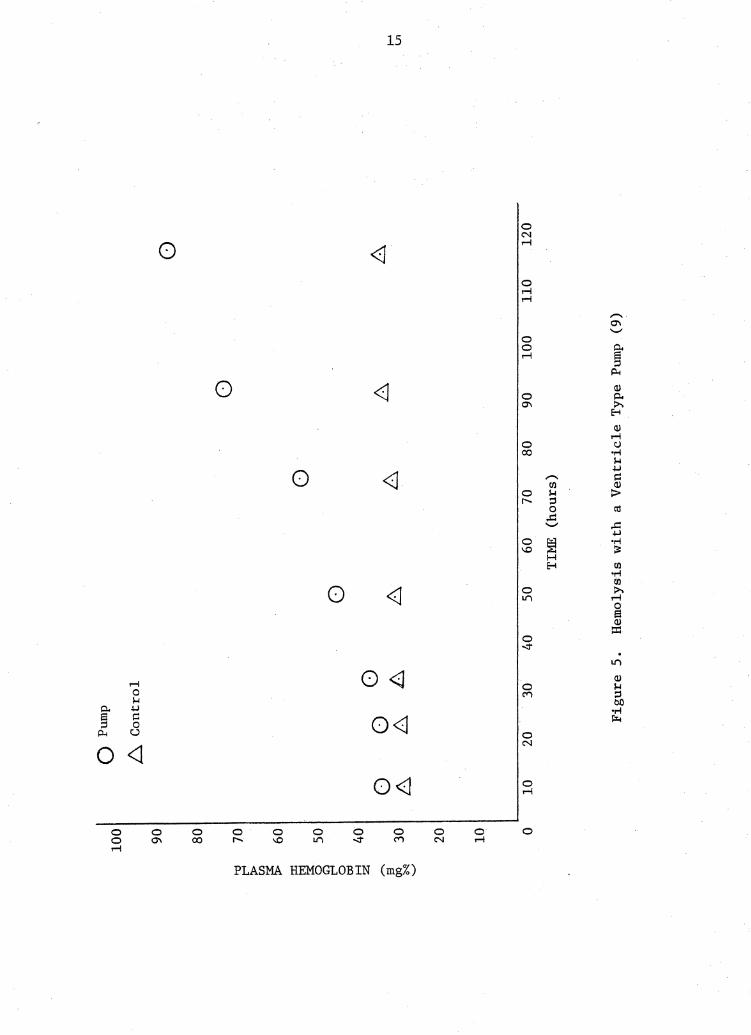
Hemolysis with a Ventricle Type Pump
6 Hemolysis with a Ventricle Type Pump and a Membrane
Oxygenator
7 Oxygen Transfer vs. Blood Flow Rate at Various
Oxygen Pressures I . . . . . . . . . . . . . 8 Oxygen Transfer vs. Blood Flow Rate at Various
Oxygen Pressures II . . . . . 9 Oxygen Transfer vs. Blood Flow Rate at 15 p.s.i.g.
10 Carbon Dioxide Transfer vs. Blood Flow Rate I . . 11 Carbon Dioxide Transfer vs. Blood Flow Rate II
12 Entire In Vivo System in Operation
13 Simple Diagram of In Vivo Circuit . 14 Cannula . . . . . . . 15 Diagramatic Representation of Extracorporeal
Circuit with Transducer Locations . 16 PC02 vs. Time . . . . . . . . . . . . . 17 pH vs. Time . . . . . .
vi
. . .
. . .
PAGE
2
3
8
14
15
16
20
21
22
23
24
26
29
33
34
48
49

LIST OF TABLES
TABLE PAGE
I OXYGENATION AND HEMOLYSIS IN SEVERAL
II
III
IV
v
VI
DIFFERENT OXYGENATORS
TRIAL ff l DATA
TRIAL 112 DATA
TRIAL 113 DATA .
TRIAL 1/4 DATA .
TRIAL /f5 DATA
vii
12
42
43
44
45
46

1. INTRODUCTION
A. FETAL AND NEONATAL CIRCULATION
A basic understanding of the fetal and neonatal circulation
is·imperative in treating respiratory deficiency in the neonate.
Miscalculation in the treatment of respiratory deficiency can lead
to regression from.neonatal to the fetal circulatory pattern.
Before birth the circulation to the lungs is almost completely
bypassed by the fetal. shunting mechanism (1). . This foramen ovale
and the ductus arteriosus are the pathways in this shunting (see
Figure 1). Prior to birth the Paco2 is about 40 torr and the Pa02
is about 20-30 torr ... The high Paco2 causes a low pH in the blood.
The 1owpH and oxygen tension cause the vasculature of the lungs to
constrict, thus causing an increase in resistance to blood flow.
The collapsed lungs prior to birth produce mechanical pressure on
the pulmonary vasculature;. also causing increased resistance to
blood flow. The back pressure caused by the in(!reased resistance
causes higher pressure in the right side of the heart. than the left.
This pressure is relieved ·by the fora.men .ovale which connects the
right atrium with· the left atrium. The foramen ovale acts as a . .
check valve whi.ch only pehnits blood flow from the right atrium to
the left. atrium:. The ductus arteriosus also acts to shunt blood
away from the lungs. The ductus arteriosus remains patent as long as
the Pa02 remains low (30-40 torr). Only about 15-20% of the total
blood.volume reaches the lungs when the shunts are open. This is
1

2
RA - right atrium
t t LA - left atrium
RAf FO - f oramen ovale
RV - right ventricle
t LV - left ventricle
RVt LV
t DA - ductus arteriosus
PA - pulmonary artery ~DA t PL - placenta p
f t A BV - body vasculature UV ,....
~ 0 PV pulmonary vein r t UA -- umbilical arteries a
UV umbi_lical vein
t PV
Figure 1. Fetal Circulation (arrows indicate direction
of blood flow)

3
i i RA FO LA
RA- right atrium
LA - left atrium RV LV
t FO - for amen ovale
+ t (closed)
A RV - right ventricle
i A LV left ventricle -· 0
r PA pulmonary artery -t a BV - body vasculature
PV - pulmdnary vein
DA - ductus arteriosus (constricted)
---ii)>._ PV
Figure 2. Neonatal Circulation (arrows indicate· direction
of blood flow)

4
just enough to support lung tissue metabolism.
At birth the placenta is eliminated from the circulation (see
Figure 2). As the neonate breathes, the Pa0 2 rises to about 100 torr
and the Paco2 falls to about 35 torr. The lowering of the Paco2
results in a higher pH which causes the lung vasculature to dilate.
The increased Pa0 2 causes the oxygen sensitive ductus arteriosus to
constrict. The reduced resistence to flow of blood in the lungs
caused by inflation with the first breaths and dilation of the
pulmonary vessels lowers the pressure in the right heart below that
of the left heart creating a pressure gradient which holds the
foramen ovale closed. The majority of the output of the right
ventricle now functionally passes through the lungs.
Any change in the body which causes the Pa02 to drop and/or
the Paco2 to rise is dangerous. The fetal circulation may be
reinstated without the benefit of the placenta as a site for gas
exchange. With only 15-20% of the total blood volume reaching the
lungs, 100% oxygen ventilation may not be able to raise the Pao2
enough to constrict the ductus arteriosus, and the carbon dioxide
removal may not be sufficient to rais'e the pH.
B. NEONATAL RESPIRATORY DISTRESS
Respiratory distress in newborn infants accounts for 30-40% of
all newborn deaths each year (2). Of the 60,000 babies born each
year with respiratory distress, 25,000 of them die (3). There are
many causes of respiratory distress in neonates. Hyaline membrane
5
disease, known as respiratory distress syndrome, alone kills
12,000 babies annually (4). Other causes of respiratory distress
are: Narcosis, prenata.l anoxia, perinatal anoxia, intracranial
hemorrhage, primary atelectasis, aspiration of amnionic fluid,
meconium aspiration, diaphragmatic hernia, lung cycsts, pneumothorax,
aspiration of food or mucous, pneumonia, lobar emphysema, pulmonary
hemorrhage, chilling at birth, tracheal esophageal fistula, and
chest wall deformities (5).
Clini.cal signs of respiratory distress are: Tachypnea,. grunting
on exhalation, retracting sternum, flaring of external nares,
cyanosis on room air, and apneic episodes in severely affected
neonates.
The cyanosis associated with respiratory distress is indicative
of a low Pa02" It is of critical importance that this condition
be prevented if possible. Ventilatory suppor.t with 100% oxygen is
the first step in prevention of immediate regression to the fetal --
circulation. There is little danger of retrolental fibropiasia
if blood PaO,., is monitored and control;led (2,6). The use of a ~
good ventilator and suitable nursery procedure can raise the survival
rate from respiratory distress to 86% (6).
The remaining 14% who do.· not survive the respiratory therapy
are the primary concern of blood oxygenation research. As stated
previously, application of 100% oxygen to the lungs aft.er the fetal
circulation~ has been reinstated will not reverse .the process because
of the very small quantity of blood flowing through the lungs. Use

6
of an extracorporeal blood oxygenator to substitute for the placenta
is a logical solution to this problem. A substitute for the placenta
needs a means to provide blood flow. It must also cause minimal
damage to the blood ..
G. BLOOD OXYGENATORS
Three ba.sictypes of blood oxygenators in clinical use are the
bubble,, disc, and solid membrane. Each type has variations. . Some
blood oxygenators, known as hybrids, incorporate two principles of
blood oxygenation. Each type of blood oxygenator has its advantages
and disadvantages.
The bubble oxygenator consists of a chamber containing blood
through which oxygen gas is bubbled for oxygenation and carbon
dioxide removal. A typical example of a bubble oxygenator in clinical
use is the Sarns Mini prime @ oxygena tor . *
The disc type oxygenator exposes a thin film of blood to an
oxygen rich atmosphere. Rotating plates or screens are partially
submerged in blood. The rotating action carries blood into an oxygen
rich atmosphere where it is oxygenated. The Esmond polycarbonate
disc oxygenator is representative of this type oxygenator.**
The solid membrane type oxygenator relies upon the properties of
oxygen and carbon dioxide which allow them to diffuse across a semi-
permeable membrane such as silicon or polypropylene. There is no
blood--gas interface as in the bubble and disc type oxygenators. The
General Electric-Pierce disposal lung is an example of a solid membrane

7
oxygenator.***
The Harvey Hybrid Disposable Oxygenator combines two blood
oxygenation principles. It acts as both a bubble and a filming
oxygenator (as is the disc oxygenator).****
* Miniprime ILF, Travenol Laboratories, Inc., Morton Grove, Ill.
** Fawn Plastics Company, Timokium, Md.
*** Medical Development Operation, General Electric Company,
Schenectady, N.Y.
**** William Harvey Corporation, Santa Ana, Ca.
D. BLOOD PUMPS
Three basic types of pumps are used for moving blood through
an extracorporeal blood oxygenation system. These are the pulsatile,
roller, and centrifuga~ type pumps.
The roller pump functions by the action of rollers on the ends
of rotating arms which pinch a section of tubing as they move, thus
pushing the blood ahead as they move (see Figure 3.a). The roller
pump is in wide·clinical use.
The pulsatile pump acts like the ventricles of the heart. It
requires check valves to achieve unidirectional flow. A length of
pliable tubing or bladder passes through an airtight chamber (see
Figure 3.b). By applying alternating positive and negative pressure
to the chamber the tube or bladder can be squeezed for systole and
expanded for diastole. There are many variations of this principle
possible today. The pulsatile pump causes much less damage to the

Pneumatic Drive
8
t i In Out
(a) Roller Pump
Roller
Check valve
Blood
Partially displaced diaphram
(...1-J;._,,hl-.++~~~~~- Air
Check valve
i In
(b) Pulsitile Pump (type used in this project)
Figure 3. Blood Pumps

. L. ..
blood than the roller pump ( 7') •
E. PUMPS AND OXYGENATORS •
Various combinations of pumps and oxygenators are in the use
today. In some, such as the Longmore Pump-oxygenator, the pumping
and. oxygenation are achieved in a single unit (8).

10
F. COMPARISON OF OXYGENATOR DAMAGE
Various types of oxygenators have been compared (Table 1.) (9).
Hemolysis, indicated by the amount of hemoglobin released into the
plasma by lysing of red blood cells, is related to the type of
oxygenator used. The least harmful of the blood oxygenators is the
solid membrane type, followed by the disc, and then the bubble type
oxygenator.
G •. COMPARISON OF PUMP DAMAGE
The rate of hemolysis is much lower · with the pulsatile pump
than the rotary roller pump (10). The hemolysis index (mg of heme-
globin produced in plasma for every 100 ml pumped) is used to compare
damage caused by blood pumps and is calculated as follows:
[Plasma Hemoglobin (mg % above control value) l [Volume of
system (ml) + 100] = absolute hemoglobin in mg
[Pump Rate (ml/min)][Total Pumping Time (min)] =Total Volume Pumped
[Absolute Hemoglobin] + [Total Volume Pumped] = mg hemoglobin per ml
pumped
[mg hemoglobin per ml pumped] [lOO] = mg hemoglobin per 100 ml pumped ., 100
The hemolytic index of the pulsatile pump used was 0.028 mg hemoglobin
per 100 ml pumped after 120 hours of pumping a 500 ml volume at
150 ml per min. The hemolytic indices for roller pumps are from 0.04

11
to 0.23 mg hemoglobin per 100 ml pumped after just a few hours of
pumping a 500 ml volume at 4000 ml per min (10).
H. SYSTEM TESTED
The system tested combined the best of the two elements required
for a successful extracorporeal oxygenator. A solid membrane blood
oxygenator and a pulsatile pump were used. The blood oxygenator is
one in which blood flows around silicon capillary tubes through which
oxygen flows. The pump is of pulsatile design and has a pneumatic
drive system.
I. REVIEW OF PREVIOUS STUDIES
This thesis is a direct continuation of the work done by Randall
Lester. There is a thorough review of related literature and an
extensive bibliography in Mr. Lester's thesis (9). Reproduction of
these would be redundant.

WORKER AND
DATE
Pierce (1969)
Clark (1950)
Zingg (1969)
Katsuhara (1964)
Lande (1968)
Dantowitz (1970)
Cresenzi (1960)
Rush (1969)
Kolo bow (1970)
Dutton (1971)
12
TABLE I. OXYGENATION AND HEMOLYSIS IN SEVERAL DIFFERENT OXYGENATORS (9)
TYPE OF BLOOD OXYGEN: HEMOLYSIS OXYGENATOR FLOW TRANSFERRED OR (mg%)
(ml/min) SATURATION %
DISC ----- ----- 115 after 6 hours MEMBRANE 35 ccOzlmin/m 2 50 after 6 hours -----
BUBBLE ----- 95% 300-500 after 1 hour
MEMBRANE ----- -·---- 58 after 1 hour TUBES
MEMBRANE 300-4.00 90% 200-300 STACKS after 5 hours
(in vivo)
MEMBRANE 500 40 ccO 2/min/m; -----STACKS 1500 75 cc0 2/min/m -----
MEMBRANE 230 32 ccO/m.in/m 2 -----LINED 2 CHANNELS 920 92 ccOzlmin/m -----
MEMBRANE 45 4.0 ccOzlmin/m 2 139 after STACKS 111 hours
MEMBRANE 65 cc0 2/m.in/m 2 35 after -----TUBES 3/4 hour
MEMBRANE 40 cc0 2/min/m 2 ----- -----SPIRAL COIL
MEMBRANE 60 cc0 2/min/m 2 40 after -----TUBES 24 hours

2. PRELIMINARY IN VITRO STUDY
A. OBJECTIVES
The preliminary in vitro study involved the testing of the
ability of the oxygenator to oxygenate the blood and to remove
carbon dioxide. Hemolysis by the oxygenator was tested during a
five day trial. The pump hemolysis was previously determined (9).
Based on the results of these tests, the decision to continue with
preliminary in vivo work was made.
B. MATERIALS AND METHODS
HEMOLYSIS
For the five day hemolysis trial, great care was taken to
insure minimal blood damage during collection and handling. Bovine
blood for this procedure was obtained by venipuncture of the jugular
vein. The blood was collected in standard plastic blood banking
bags which contained 67.5 ml of acid citrate dextrose anticoagulant
(2.2 gm sodium citrate, 0.73 gm citric acid monohydride, 2.45 gm
dextrose per 100 ml of distilled water) per 450 ml of blood. The
circuit for the hemolysis test is shown (Figure 4.a). It was primed
by allowing the blood to flow from the bags by gravity. The entire
· "t th 1 d · th f · t at s0 c. circui was en p ace in e re rigera or A control bag
containing 450 ml of blood was also placed in the refrigerator.
Plasma hemoglobin was determined over the five day period. These
data are presented (Figures 5 and 6).
13

Oxygen In
Oxygen In
Deoxygenate Blood
PUMP
14
OXYGENATOR
t
. RESERVE BAG
Flow Meter
(a) · Hemolysis Study
Oxygen ·Flow Meter
Oxygen, Carbon Dioxide·, Water Vapor Out
OUT: To waste container
PuMP Flow
OXYGENATOR
'· Sampling Port
·Oxygen Flow Meter
(b) Oxygenat.ion and. Carbpn Dioxide Removal Study
Figure 4. In Vitro Study
o2; co2 ,
H20 Out
1001
Q
Pum
p
b C
ontr
ol
901
0 aol
0
70
lij ~ en ~
60
::r::
I 0
~ 0 50
~
I 0
0 b:l
H
40
0 z ,-.
...
0 0
A
A
8.
s 30
A
8
A
I-"
(]Q
8 V
l CN
! '-
'
20
10 0
10
20
. 30
40
50
60
70
80
90
10
0 11
0 12
0
TIM
E (h
ours
)
Fig
ure
5.
Hem
olys
is w
ith
a V
entr
icle
Typ
e Pu
mp
(9)

1001
Fl
ow R
ate
= 20
0 m
l/m
in
0 T
empe
ratu
re =
5 C
90
1 O
xyge
nato
r H
emog
lobi
n= 1
0.7
Con
trol
Hem
oglo
bin
= 9.
9
801
0 6
PUM
P CO
NTRO
L
"'d
70
~ en ~
601
oo
::i:
: ~ 50
0
0 ~
0 0
0 td
H
40
z
0 ,-.
..
0 a
30
I-'
OQ
°' ~
00
..__
, 0
20 A
8
8
8 8
A
8 6
AA
10 0
10
20
30
40
50
60
70
80
90
100
110
120
TIM
E (h
ours
)
Fig
ure
6.
Hem
olys
is w
ith
a V
entr
icle
Typ
e Pu
mp
and
Mem
bran
e O
xyge
nato
r

17
OXYGEN AND CARBON DIOXIDE TRANSFER
For these studies fresh bovine blood was collected with acid
citrate dextrose as the anticoagulant. 67.5 ml of acid citrate
dextroxe was used per 450 ml of blood. As large quantities of blood
were used in this study, the bovine blood was collected in an 11. 32
liter plastic jug which hcid been thoroughly rinsed with normal saline
and contained the acid citrate dextrose at the time of collection.
The blood was collected from a severed jugular vein of a sacrificed
cow. The blood was deoxygenated by bubbling nitrogen through it.
As shown in Figure 4.b, the deoxygenated blood was pumped through
the oxygenator and collected in a waste container. Samples of blood
could be taken at eight different sample ports in the system. Six
of these sampling ports were located on the oxygenator and the other
two were located at the input and output lines of the oxygenator.
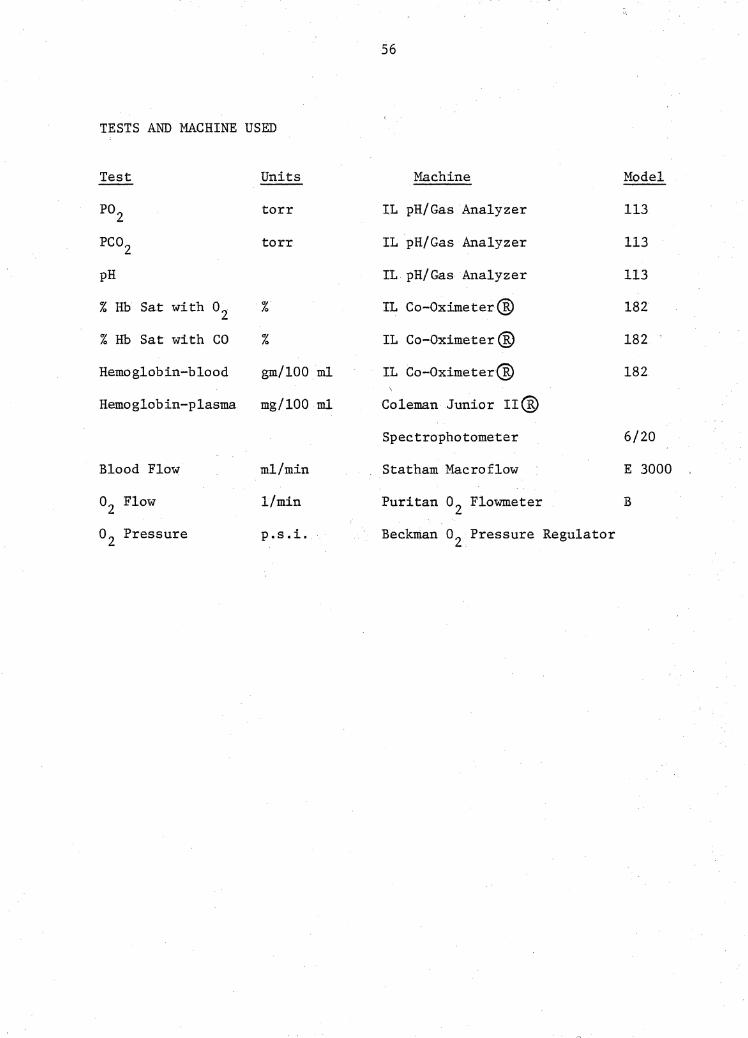
A variety of tests were performed to determine oxygen and carbon
dioxide transfer rates. Test data is presented in Figures 7, 8, 9,
10, and 11. ,Po2, PC02, pH, hemoglobin saturated with oxygen, hemo-
globin saturated with carbon monoxide, hemoglobin, oxygen flow rate,
oxygen pressure, and blood flow rate were also ascertained.
OXYGEN TRANSFER RATE
The oxygen transfer rate is dependent upon several factors:
1) Oxygen binding capacity of hemoglobin.
2) Surface area of the membrane.
3) Rate of hemoglobin passing through the oxygenator.
4) Starting percentage of hemoglobin saturated with oxygen.

18
5) Final percentage of hemoglobin saturated with oxygen.
The hemoglobin value for each test was determined by each of two
methods. The IL Co-Oximeter and the Coleman Spectrophotometer were
used. The oxygen binding capacity of bovine hemoglobin is 1.36 cc 2 The surface area of the membrane was 0.18 m . The starting
and final percentage of hemoglobin saturated with oxygen were deter-
mined using the IL Co-Oximeter. A sample calculation to determine
the oxygen transfer is as follows:
[Hb(gm/100 blood] [Flow Rate(ml/miii)] = [gmHb through oxygenator/min]
[Percentage of Hb Sat with o2 ,Final]-[Percentage of Hb Sat with o2 ,In]=
Net change in Hb saturated with oxygen
[gm of Hb through oxygenator/min][Net change in Hb sat with o2 J=gm
of hemoglobin oxygenated per minute
[gm of Hb oxygenated/min] [1. 36 cc o2 I gm Hb] = cc of o2 across membrane
per minute
If the membrane is 0.18 2 m ' then the amount of oxygen transferred per
minute per square meter is equal to: cc o2 across membrane per
minute divided by the surface area of the membrane.
CARBON DIOXIDE TRANSFER RATE
The carbon dioxide transfer across the membrane is determined by
measuring input and output Pco 2 and converting Pco 2 to carbon dioxide

19
content by the following equation:
Carbon Dioxide Content= 0.0416ll(PC02 )0 ' 6156 liters/liter
This difference in carbon dioxide content is multiplied by the blood
flow rate to find carbon dioxide transfer across the membrane. 2 Dividing cc COz by 0.18 m gives the cc C0 2 transferred per minute
per square meter.
C. DISCUSSION AND CONSLUSIONS OF IN VITRO STUDY
The data obtained in this in vitro study provided enough evidence
to warrant· an in vivo evaluation of the system. The hemolysis rate
was extremely low (see Figure 5). Oxygenation of the blood seemed to
have a membrane stabilizing effect on the red blood cells. Oxygenation
actually decreased hemolysis as can be seen by comparing Figures 5 and
6.
Oxygen transfer in the new system was excellent. As can be seen
in Figure 9, up to 189 cc of oxygen per square meter of membrane can be
transf.erred at the blood flow rate of 250 ml/min. This is twice the
oxygen transfer of the Dantowitz membrane oxygenator (see Table 1).
The carbon dioxide transfer was good enough to suggest that in
vivo evaluation should be attempted. Prior to the in vivo evaluation
of the blood pump and oxygenator system, several alterations to
enhance carbon dioxide transfer were made to the outer casing of the
oxygenator. These alterations could have no effect on the rate of
hemolysis.

240 I
2201
o
5 p
.s.i
.
0 L
:\10
p.s
.i.
2001
td
1801
Q
15
p.s
.i.
0 t'-
i 0 0 C
l 16
01
8 0
~ ~ 14
0
~ 12
01
8 H
tr
j
,......,
1001
D
s I-
' -i3 80
I-'•
~
601
D
.........
N 0
40'
D
20 0
10
20
30
40
50
60
70
80
90
100
110
120
130
140
150
160
OXYG
EN T
RANS
FER
(cc
o 2/m
in/m
2 )
Fig
ure
7.
Oxy
gen
Tra
nsfe
r vs
. B
lood
Flo
w R
ate
at
Var
ious
Oxy
gen
Pre
ssur
es I

240
I
0 \I
2.
5 p
.s.i
. 22
0 I
D
s p
.s.i
. 20
0 I
0 6
. 10
p. s
. i.
180
I 0
0 15
p. s
. i.
t>:I
160 I
8 6
~
0 0 14
0 C
l lz
j 12
0 I
8 ~ ~
100 I
oA
~ trJ
80
D
,.-.. ~
N
.........
60
f-1.
s
'\-7
I-'·
::I
'-'
40
20 I
0 10
20
30
40
50
60
70
80
90
10
0 11
0 12
0 13
0 14
0 15
0 16
0 17
0
OXYG
EN T
RANS
FER
(cc
o 2/m
in/m
2 )
Fig
ure
8.
Oxy
gen
Tra
nsfe
r vs
. B
lood
Flo
w R
ate
at
Var
ious
Oxy
gen
Pre
ssur
es I
I

b:l t'"'
0 0 t:I
lzj
t'"' ~ ~ H
trj
,,-._
a f-
' -.....
.. a I-'· ::i·
'-"
280
260.
0
I
240
220
200 I
0 18
0
160 I
0 14
0 I
0 12
0
loo I
0 80
60
40
20 0
10 2
0 30
40
50 6
0 70
_80
90 1
00 1
10 1
20 1
30 1
40 1
50 1
60 1
70 1
80 1
90 2
00
OXYG
EN T
RANS
FER
(cc
0 2/m
in/m
2 )
Fig
ure
9.
Oxy
gen
Tra
nsfe
r vs
. B
lood
Flo
w R
ate
at 1
5 p
.s.i
.g.
N
N

240
220
200
180
160
td
t"'
0 0 14
0 t::I
~
~ 12
0
~ 10
0 t:i::
I ,-
..
El I-'
80
-81 I-'•
~
'-'
60
40
20 0
0 0
0 0 0
10
20
30
40
50
60
70
80
90
100
CARB
ON D
IOXI
DE T
RANS
FER
(cc
C02/
min
/m2 )
Fig
ure
10.
Car
bon
Dio
xide
Tra
nsfe
r vs
. B
lood
Flo
w R
ate
I
N w

240
0
220
0
200
0 18
0 0
tx:I
160
t-<
0 0 t:I
0 tz
j 14
0 t-<
~ ~ 12
0 0
tr:I
,-.,.
100
s N
.p
-0
I-' - p. 8
0 ::l
'-
" 0
60
40
0 20
0 10
20
30
40
50
60
70
80
90
10
0
CARB
ON D
IOX
IDE
TRAN
SFER
(cc
co 2
/min
/m2 )
Fig
ure
11.
Car
bon
Dio
xide
Tra
nsfe
r vs
. B
lood
Flo
w R
ate
II
3. IN VIVO STUDY: SHORT TERM ANIMAL WORK
A. PRE-TRIAL CONSIDERATIONS
The transition from in vitro to in vivo work brought it many
factors to be considered. As can be seen in Figure 12, the in vivo
system was very complicated.
The first consideration was the choice of animal to be used in
the experiments. Rabbits were chosen for a variety of reasons. Size
of the rabbit is close to that of the newborn infant. Rabbits are
easy to care for. Because the blood pump and oxygenator system
required priming with blood compatible with the animal in the
experiment, an animal which could be easily typed for blood com-
patibility was needed. 97% of all rabbits have the same blood
group (11), and rabbits are inexpensive relative to other laboratory
animals of the size range required.
Similar studies with oxygenators on rabbits have been conducted
(11). Cannulas were placed in the carotid arteries and jugular veins.
After an anatomical study of the veins and arteries of the rabbit,
we decided that the use of the carotids and jugulars were the best
routes for connecting the new system to the rabbit.
The anticoagulant used in the in vitro study was acid citrate
dextrose. It was not possible to use acid citrate dextrose for the
in vivo work. Rapid infusion of this anticoagulant can greatly
decrease blood calcium resulting in tetany and convulsions (12).
Heparin was chosen as the anticoagulant. Heparin therapy is easy
25

26
Figure 12. Entire In Vivo System During Surgery

27
to monitor (13), and over heparinization can be controlled by the
administration of a heparin neutralizer, protamine sulfate (14).
To evaluate the blood pump and oxygenator we needed a way to
stop respiration in the lungs. After trying several methods during
our first attempts at hooking the rabbits up to the circuit we found
that the best way was to administer carbon dioxide and nitrogen to
the lungs via a face mask secured to the rabbit. The PC02 of the
exhaled gasses of the rabbit at rest was determined to be 27 torr.
By mixing nitrogen and carbon dioxide we were able to match this
exhaled PC0 2, thus there was no net loss of carbon dioxide across the
lung. All exchange of gases took place across the membrane of the
oxygenator.
The anesthetic used was sodium pentobarbitol given intravenously
(15). This anesthetic was chosen because it presented us with no
complications and it was easy to administer.
B. MATERIALS AND METHODS
Each animal trial on the pump and oxygenator system involved
basically four steps:
1) Presurgical
2) Surgical
3) Hook-up of the system
4) Data collection and maintenance
(See Appendix for a list of materials needed for one trial)
28
The main objective of surgery was to place cannulas in each of
two carotid arteries and one jugular vein. The cannulas were
connected to the system containing the blood pump and oxygenator.
Blood flowing out the carotid arteries was pumped through the
oxygenator, oxygenated, and returned to the rabbit via the jugular
vein cannula. A simple diagram showing the experimental set-up is
shown (Figure 13).

BLOOD PUMP
t
29
OXYGENATOR
Figure 13. Simple Diagram of In Vivo Circuit

, .. .J ..
30
PRESURGICAL PROCEDURE
PROCUREMENT AND BLOOD TYPING
Rabbits weighing 2 to 4 kilograms were obtained and kept in
separate cages. The test performed on each rabbit was the
determination of ABO group and Rh factor. Each of the thirty .... one
rabbits used had blood type B with a negative Rh. factor. (See
Appendix for blood typing procedure.)
PRIMING THE SYSTEM
To prime the system several rabbits were sacrificed and blood was
collected. The rabbits were shaved.and surgical anesthesia was applied
by administration of 20 mg of sodium pentobarbitol per kilogram body
weight. (See Appendix for. shaving and injection procedure) 225 units
of heparin were given to the rabbits with the surgical anesthesia. To
prevent clotting the blood was collected in flasks which contained
three cc of heparin-normal saline (75 units/cc). Additional anesthesia
was administered if required. The throat region was rinsed with sterile
normal saline to minimize hair collected in the blood. A suprasternal
midline incision.through all tissue planes to the trachea was made.
The carotid arteries were identified and severed with the rabbit in
the inverted position over the collection funnel. Each animal pro-
vided 50-75 cc of blood.
Prior to priming the circuit; the blood pump and oxygenator system
was filled with sterile normal saline and heparin (40 units/cc) for

31
twenty-four hours.
The blood pump and blood oxygenator system was filled with the
donor blood which had been filtered through a fine nylon mesh filter
to remove any clots 'or hair. The total priming volume was approximate-
ly 175 cc. To prime the system, the same configuration as shown in
Figure 4.a for the in vitro tests was used. Blood pumped through the
system forced the heparin-saline solution out ahead of it. The buffer
bag was then filled and the system was closed (see Figure 4.b).
SURGERY
The rabbit to be used in the system was shaved and anesthesized as
previously described with the exception that no heparin was given with
the sodium pentobarbitol. It was then secured to the operating table
on its back. A skin incision directly over the trachea was made
starting at the upper third of the throat and extending caudally for
about five centimeters. The fascia was cut and the carotid arteries
and jugular vein were exposed using blunt dissection. Each of the
three vessels was cannulated following this procedure: Two loose
ligatures were passed under the vessel. The ligature at the cephalic
end of the vessel was tied. The ligature at the caudal end of the
vessel was gently raised to expose the vessel for cannulation. A
Teflon @ cannula was then placed in the vessel via a small incision
cut at a slight angle to form a "V" in the vessel wall. The cannula
most commonly used was 0.071" O.D. and 0.047" I.D. After the cannula
was inside the vessel in the caudal direction, the caudal ligature was

32
tied around and it was secured by tying the cephalad ligature around
it also. Each cannula was filled with a mixture of heparinized
normal saline (500 units/cc) and normal saline. The amount of heparin
was dependent upon how much heparin was required to initially begin
anticoagulant therapy in the rabbit. This was determined to be 220
units of heparin per kilogram body weight. This number was divided
equally among the three cannulas placed. A series of connectors
(see Figure 14) ~adapted the extracorporeal ends of the cannulas to a
standard luer-lock stopcock. The end of the cannula placed could be
cleared by injecting normal saline through the three way stopcock.
HOOK-UP
The next step was to attach the vessel cannulas to the rest
of the system. To minimize blood loss the silicone tubing between
the adapters was clamped, the stopcock removed, and the luer fitting
was attached to the corresponding fitting in the circuit. After each
of the three cannulas was attached to the circuit, the clamps were
removed and pumping commenced.
TESTS AND MAINTENANCE
The total system had many inputs and outputs (see Figure 15).
When possible, in line data was collected. A detailed account of the
course of the blood in the system is as follows: The blood flowed
through the arterial cannulas (A) from the rabbit. It passed into the
buffer bag (D) which was in the system to prevent back pressure from
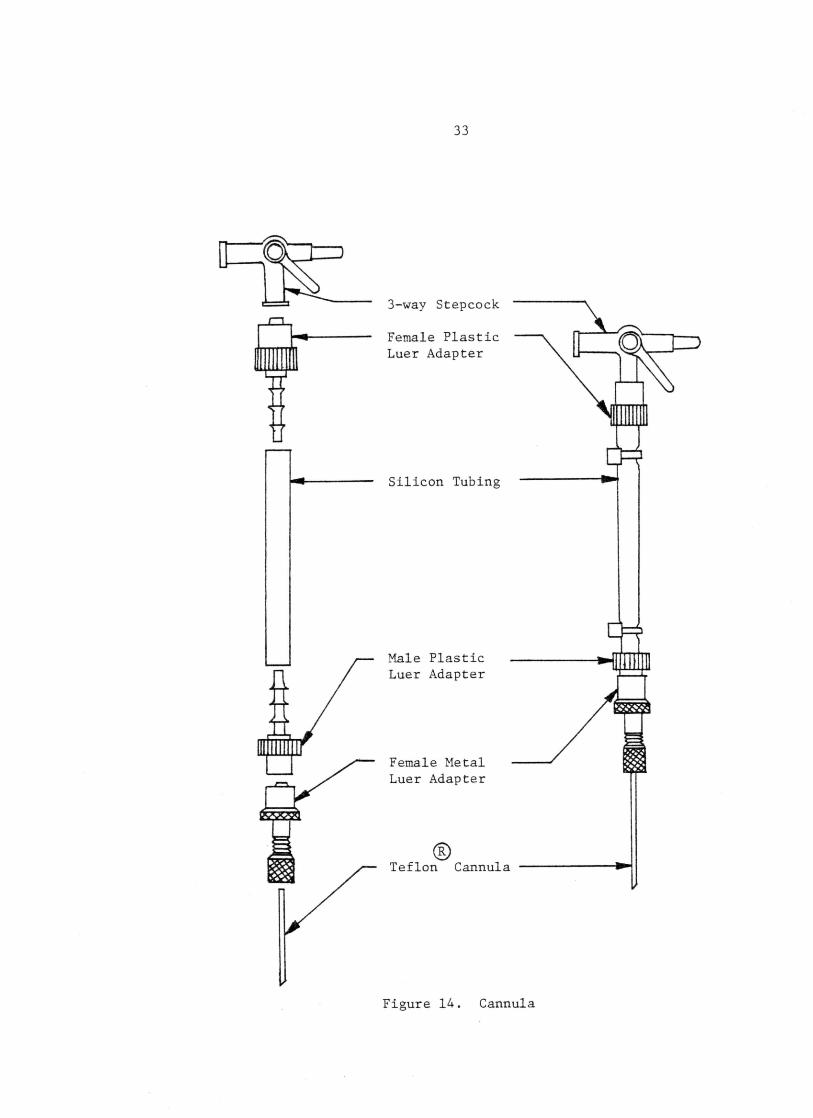
33
3-way Stepcock
Female Plastic Luer Adapter
Silicon Tubing
Male Plastic Luer Adapter
Female Metal Luer Adapter
® Teflon Cannula
Figure 14. Cannula

34
G
t L
---F F
J
E
D
Rabbit
A - arterial cannulas I - oxygen flow meter B - face mask J - automatic syringe drive c - temperature probe K - blood flow meter D - reservoir bag L - bubble trap E - blood pump M - venous cannula F - oxygen saturation transducers N - rectal thermometer G - oxygenator 0 - ECG leads H - oxygen pressure and heater ~ - Three-way stopcock
Figure 15. Diagramatic Representation of Extracorporeal
Circuit with Transducer Locations

35
the pump and to respond to changes in intracorporeal volume changes of
the rabbit. The blood flowed into the pump (E) via a check valve
and was pumped out of the pump via a check valve. It passed into the
oxygenator (G) where it lost carbon dioxide and was oxygenated. As·.
the blood passed through the oxygenator it was heated to maintain
normal body temperature. As the oxygen rich blood passed out. of the
oxygenator, heparin and dextrose were added via the automatic syringe
drive (J). .The blood passed through a bubble trap (L) to remove any
air bubbles. The oxygenated blood then flowed back into the venous
cannula (M) and back into the rabbitto supply the body tissues with
oxygen.
Regulation and monitoring of homeostasis a:fter the rabbit was
attached to the system were accomplished in many ways. When possible,
in line measurements were made and continuously recorded on a Sanborn
8 channel chart recorder. Blood flow rate (ml/min), electrocardiogram,
blood temperature, percentage of hemoglobin saturated 'With oxygen in
and out of the rabbit, and arterial and venous pressure could be
recorded in this way. Each of these parameters on the recorder was
monitored and adjustments were made to maintain homeostasis.
BLOOD GAS AND pH
At regular intervals 2.5 cc samples of blood were drawn fr9m I
the arterial and venous sides of the oxygenator. These samples were
tested for P02 , ·pco2 , pH, and. percentage of hemoglobin saturated with
oxygen. The P02 , Pco2, and pH were ascertained by using the

36
Instrumentation Laboratory Ultra-Micro pH and Blood Gas Analyzing
System Model 113-Sl. The percentage of hemoglobin saturated with
oxygen was determined with the Instrumentation Laboratory Co-Oximeter
@Model 182 (hemoglobin was also determined from this sample). In
line percentages of hemoglobin saturated with oxygen were also deter-
mined by the use of an experimental oximeter (16). Changes in any
of these four parameters could be regulated within certain limits.
P02 could be controlled by changing the oxygen flow rate or
oxygen pressure. Percentage of hemoglobin saturated with oxygen could
be controlled in the same manner.
PC02 was mainly affected by blood flow rate through the oxygenator.
Flow over 225 ml/min were desirable to maintain normal PC02 . Increased
oxygen flow through the oxygenator also aided in removal of carbon
dioxide from the blood.
The pH dropped as the PC02 wen up as would be expected. Control
of the PC02 was the main way of controlling pH. Administration of
sodium bicarbonate buffer solution had some effect on stabilizing the
pH.
Each of these four parameters is related to the other three and
constant awareness of this was important.
BLOOD COAGULATION
It is imperative that blood clotting does not take place in the
oxygenator system and the patient. For this reason an anticoagulant,
heparin, was used. The activated partial thromboplastin time test

37
is sensitive to heparin therapy (13). An activated partial
thromboplastin time two to three times normal (12-20 seconds) was
optimal in preventing clots, but at the same time preventing
hemorrhaging internally. Heparin is metabolized by the liver at a
rate of around 50% per hour. In order to maintain a constant level
of heparin in the blood, an automatic syringe drive was used. Along
with the heparin, fluids, electrolytes, and glucose were administered
to maintain metabolic and electrolyte balance. The heparin dosage to
continuously infuse was determined as follows:
Body Weight (kg) X 0.44 cc heparin/kg/hr =~cc heparin/hr
cc heparin/hr + glucose normal saline = 20 cc of soution in
syringe.
Sample Calculation for a 2 kg rabbit:
2 kg X 0.44cc heparin/kg/hr = 0.88cc heparin/hr
0.88cc heparin/hr+ glucose normal saline= 20cc solution in
syringe.
75 units/cc of heparin-normal saline was used. The syringe drive was
turned on one hour after an initial dosage of heparin was given the
rabbit via the cannulation technique. The activated partial thrombo-
plastin time test (see Appendix) was periodically performed to insure
that the desired clotting time of two to three times normal was main-
tained. Heparin could be neutralized with protamine sulfate.

··.-.I. . . .l .... L
38
ELECTROCARDlOGRAM
The standard lead II configuration was used for the electrocardio-
gram. Subcutaneous needle.electrodes were used. The electrocardiogram
was monitored on the ECG-EEG Fetal Monitoring System- Medical Develop-
ment Corporation, .model 73-l,-l ~ and recorded on .the Sanborn eight
channel recorder. The shift c.reated in the baseline .of the ECG was
enough to detect respiratory rate. Respiratory rate was calculated
from the trace on the chart recorder.
TEMPERATURE
In line temperature measurements were made by use of a thermister.
These values were recorded on the Sanborn chart recorder. Body
temperature was mcinito.red by use of a rectal thermometer.
Normal body temperature was maintained in several ways. The
radiant heat created by the surgical light was. directed toward the
entire system. The oxygen was heated before being passed·into the
oxygenator. A heating pad was placed under the rabbit and warm towels
were placed over the rabbit. A plastic cover was placed over the
towels to conserve heat.
BLOOD PRESSURE
The pressure of the blood e.ntel;"ing and ];eaving the rabbit was
monitored during the first few trials. This was done by using Statham
strain gage transducers and the General Electric Patient Monitor.
These values were recorded on the Sanborn recorder.
39
ANESTHESIA
During the entire duration of the trials, surgical anesthesia
was maintained. Sodium pentobarbitol (64.8mg/cc) was injected into
the extracorporeal circuit at the first sign that the rabbit was
awakening. Usually 0.25 cc of sodium pentobarbitol was administered
at one hour intervals.
C. INDIVIDUAL TRIALS
TRIAL /Fl
The main objective of this trial was to practice placement of
the cannulas and to accustom the team to the entire operation. In
this experiment a plastic bag was placed over the head to prevent
ventilation. A misjudgement in the placement of the syringe drive was
disastrous. The heparin glucose-normal saline solution was sucked into
the system because the syringe drive was connected on the negative
pressure side of the pump. One and a half hours worth of heparin
solution was infused in a matter of minutes. The rabbit died minutes
later of massive hemorrhage. Valuable PC02 and pH data and knowledge
about the dynamics of the system were gathered and are shown in Table
2.
TRIAL #2
Although little data was collected in this trial, the presurgical
and surgical portions of this experiment were much shorter in time.

40
Several refinements, such as the placement of the syringe drive on
the positive pressure side of the pump were tested. The cannula
assembly shown Figure 15, was first used in this experiment. Again,
as in Trial Ill, a plastic bag was placed over the rabbit's head to
prevent ventilation. Data from this trial is presented in Table 3.
TRIAL 113
In this trial it became quite evident that there were several
things which could be done to improve chances of the rabbit surviving
for a longer period of time. It was in this experiment that the flow
rate of 225 ml/min was determined to be the optimal flow rate for
total support of respiration by use of the oxygenator. In this
experiment it was found that administration of heparin to the donor
rabbits supplied us with more blood per rabbit. The use of the face
mask supplying carbon dioxide and nitrogen was initiated in this
experiment. The cause of death in this experiment was the loss of
flow from the carotid cannulas. The blood in the buffer bag was
pumped into the animal thereby increasing its blood volume to perhaps
one and one half times normal. This resulted in massive hemorrhage.
Data from this trial is presented in Table 4.
TRIAL 114
In this experiment similar results were obtained as in trial /13.
Problems with flow from the carotid arteries again developed. As long
as the blood flow remained close to 225 ml/min the PC02 and pH were

41
controlled. The control of coagulation time was attempted with the
use of protamine sulfate. Data from this trial is presented in Table
5.
TRIAL f!5
This last experiment had the greatest potential for success.
There was better control of the body temperature and the coagulation
time was within desirable limits. Upon autopsy the rabbit was found
to be pregnant and it had an infection of one of the uterine horns.
There was no indication of hemorrhage. Stress placed on an already
infected, pregnant animal was believed to be the cause of death.
Data from this trial is presented in Table 6.
D. DISCUSSION OF IN VIVO TESTING:
OXYGENATION
As can be seen from the data in each of the five tables, there
is no problem in oxygenating the blood with this system. Blood
entering the oxygenator with a P0 2 of 15 torr, exited the oxygenator
with a P02 of 475 torr. Considering that blood normally enters the
lung with a P02 of 40 torr and exits the lung with a Po2 of 104 torr,
it is quite clear that the problem of oxygenation does not exist in
this system. In all of the trials the percentage of hemoglobin
saturated with oxygen went to 100% with just one pass through the
oxygenator.

Time Rabbit
(min)
15 OUT IN
30 OUT IN
45 OUT IN
60 OUT IN
75 OUT IN
90 OUT IN
42
Table II. Trial fFl Data
pH
(mm Hg) (mm Hg)
15 40 7.34 475 28 7.5
27 52 7.15 475 37.5 7.27
28 55 7.1 625 40.5 7.17
28 55 7.04 625 40.5 7.115
27 60 6.98 525 37.4 7 .11
35 69 6.87 575 44.0 6.96
02 Sat (%)
23 100
23 100
23 100
58 100
43.1 100
37.2 100
Hb
(gm/100 ml)
7.4 7.4
7.4 7.4
7.4 7.4
7.4 7.4
6.2 6.2
6.0 6.0

43
Table III. Trial #2 Data
Time Rabbit P02 PC02 pH 02 Hb Coag Blood Sat Time Flow
(min) (mm Hg) (mm Hg) (%) (gm/100 (sec) (ml/min) ml)
20 OUT 7.185 . 10.0 IN 7.3 10.0
40 OUT 7.11 10.0 IN 7.17 10.0
60 OUT 7.07 10.0 IN 7.13 10.0 90

44
Table IV. Trial 113 Data
Time Rabbit P02 PC02 pH 02 Hb Coag Sat Time
(min) (mm Hg) (mm Hg) (%) (gm/100 (sec) ml)
0 OUT 44 6.8 100 11.3 113.7 IN
15 OUT 44 6.8 64 10.0 IN 44 6.8 100 10.0
25 OUT 52.5 49.9 9.9 IN 100 9.9
40 OUT 50 7.3 60 113.8 IN 100
80 OUT 60 6.8 26 10.6 IN 48 6.8 100 10.6

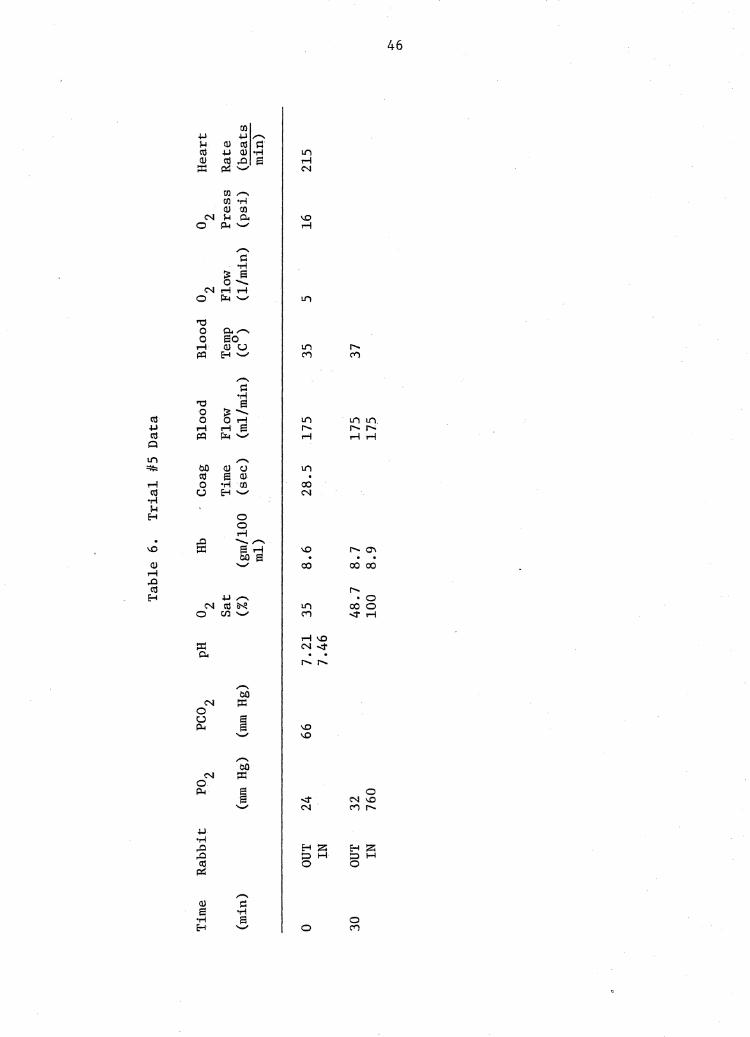
Tab
le 6
. T
rial
/IS
Dat
a
Tim
e R
abbi
t Po
2 PC
0 2
pH
02
Rb
Coa
g B
lood
B
lood
02
02
H
eart
Sa
t Ti
me
Flow
Te
mp
Flow
P
ress
R
ate
(min
) (m
m H
g)
(mm
Hg)
(%
) (g
m/1
00
(sec
) (m
l/m
in)
(Co)
(l
/min
) (p
si)
(bea
ts
ml)
m
in)
0 OU
T 24
66
7.
21
35
8.6
28.5
17
5 35
5
16
215
IN
7.46
30
OUT
32
48.7
8.
7 17
5 37
IN
76
0 10
0 8.
9 17
5 .i:
:- "'
47
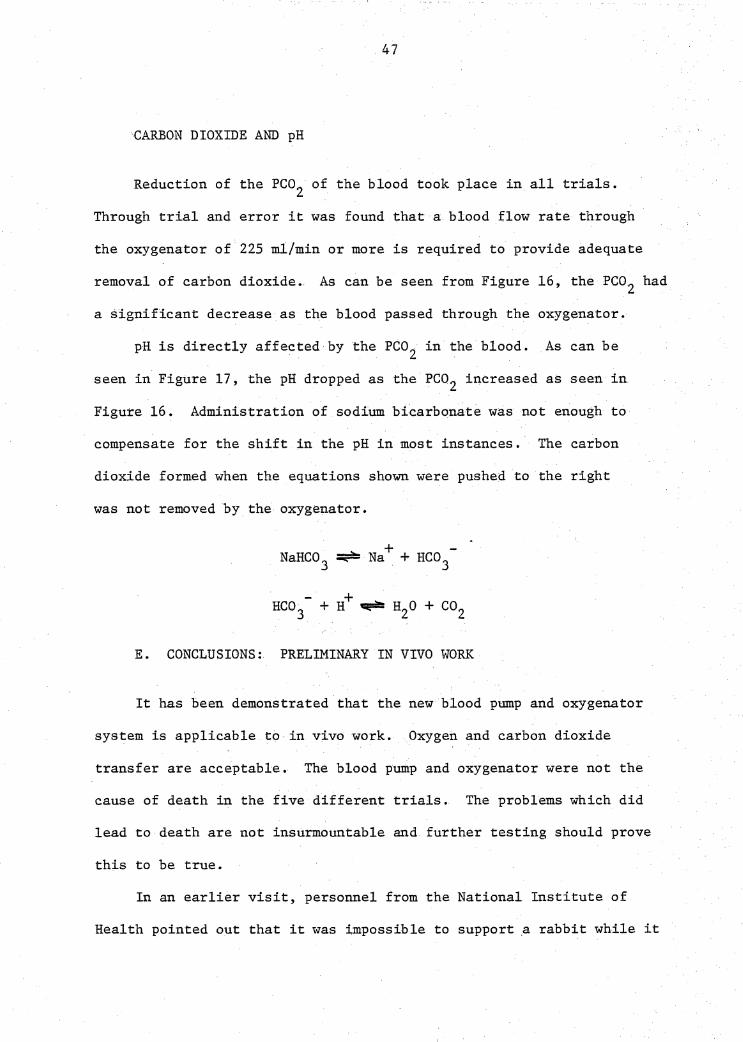
CARBON DIOXIDE AND pH
Reduction of the Pco2 of the blood took place in all trials.
Through trial and error it was found that a blood flow rate through
the oxygenator of 225 m1/min or more is required to provide adequate
removal of carbon dioxide. As can be seen from Figure 16~ the PC02 had
a significant decreaseas the blood passed through the oxygenator.
pH is directly affected by the Pco2 in the blood. As can be
seen in Figure 17, the pH dropped as the PC02 increased as seen in
Figure 16. Administration of sodium bicarbonate was not enough to
compensate for the shift in the pH in most instances. The carbon
dioxide formed when the equations shown were pushed to the right
was not removed by the oxygenator.
NaHC03 - + -Na + HC03
E. CONCLUSIONS~ PRELIMINARY IN VIVO WORK
It has been demonstrated that the new blood pump and oxygenator
system is applicable to in vivo work. Oxygen and carbon dioxide
transfer are acceptable. The blood pump and oxygenator were not the
cause of death in the five different trials. The problems which did
lead to death are not insurmountable and further testing should prove
this to be true.
In an earlier visit, personnel from the National Institute of
Health pointed out that it was impossible to support .a rabbit while it

48
70 6 In Rabbit 0 0 Out Rabbit
"'O 60 0 (') 0 0 0 0 N - 50 § 6 ::t: 0 6 8 OQ .._, 40 6 6
30 A
20
10
0 10 20 30 40 50 60 70 80 90 TIME (minutes)
Figure 16.· Pco2 vs. Time

49
Figure 17 • pH vs. Time

was breathing an atmosphere of carbon dioxide and nitrogen. In
these in vivo experiments their assertions were not verified. The
system quite easily compensated for any oxygen lost across the lung.
One must be remindec:l that the system used in these experiments was
designed for infants weighing up to 2 kilograms. All of the rabbits
used in the experiments weighed more than 3 kilograms.
Most important in drawing conclusions from the in vivo work is
the concept of total support (as we did in these experiments) vs.
partial support as would be found in a clinical situation where a
ventilator would be used in conjunction with this blood pump and
oxygenator. If one can support a 3 kilogram rabbit that is breathing
carbon dioxide and nitrogen surely there can be no doubt that the
sytem can easily supply the required partial support for an infant
with neonatal respiratory distress.
The data obtained in the preliminary in vivo evaluation of the
blood pump and oxygenator system fully justifies further evalu.ation.
4. RECOMMENDATIONS
The data obtained from the in vitro and in vivo evaluations
suggest that long term support of a neonate is feasible with this
system. More long term animal work should be the next step in the
evaluation of the new system.
One of the main problems faced in this research was the lack of
trained medical laboratory technicians. Much more data could have
been obtained with trained personnel. Any further testing of the
50

___ J
51
scope that was performed in the preliminary testing should not be
attempted without adequate laboratory support personnel.
Use of this system without systemic heparinization may be possible.
Coating of the extracorporeal circuit with heparin may be possible and
should be pursued.
Although gross anatomical autopsy was performed, microscopic
tissue studies at autopsy should be performed. It is suspected that
little change will be shown to occur in the body.
The membrane stabilizing ability of oxygen is an interesting
phenomenon and should be investigated thoroughly.
The nature of this system makes it easily adaptable to computer
control. The technology available today makes this a relatively
easy task.
This system should be scaled up for use in children and adults.
It has the potential for reducing the risks involved in open heart
surgery.
With the use of different membrane material this configuration
could be used as a dialysis unit as well as an oxygenator.
This system could be used for perfusion of organs awaiting trans-
plant.
This research has the potential to arrive at the technology to
produce an artificial implantable lung. Well funded and expedient
thrusts foreward are highly recoilllll.ended in the continued evaluation of
this system.

5. LITERATURE CITED
1. Dawes, Geoffrey S., 11Changes in Circulation at Birth", Anesthesiology, 26 ·' pp. 522-530, 1965.
2. Arp, Leon J. , Dillion, R. E. , Humphries, T. "A New Approach to Ventilatory Support Respiratory Distress Syndrome, Part I: Respirator." Anesthesia and Analgesia Vol. 48, No. 3, pp. 506-513, 1969.
J., Pierce, D. E., of Infants With
The Arp Infant - Current Researches,
3. Gluck, Louis, ''Newborn Special Care." Pediatric Therapy, Ed. H. C. Shirkey, C. V. Mosby Co., p. 341, 1972.
4. Avery, M. E., Fletcher, B. D., The Lung and Its Disorders in the Newborn Infant, W. B. Saunders Co., p. 194,., 1974.
5. Nelson, W. E., Textbook of Pediatrics, W. B. Saunders Co., p. 379, 1969.
6. Arp, Leon J., Dillon, R. E., Humphries, T. J., Pierce, D. E., "A New Approach to Ventilatory Support of Infants With Respiratory Distress Syndrome, Part II: The Clinical Application of the.Arp Infant Respirator." Anesthesia and Analgesia - Current Researches, Vol. 48, No. 4, pp. 517-528, 1969.
7. Kuserow, B. K., Machanic, B., Collines, F. M., Clapp, J. F., "Changes Observed in Blood Corpuscles After Prolonged Perfusion With Two Types of Blood Pumps," Trans. Soc. Art. Inter. Organs, 11, pp. 122-126, 1966.
8. Longmore, Donald, Machines in Medicine, Doubleday and Co., p. 104, 1970.
9. Lester, Randall Vaugn, "Analysis of a Membrane Type Blood Oxygenator and a Ventricle Type Blood Pump," Thesis, Virginia Polytechnic Institute and State University, August, 1973.
10. Bentley, D. J., Biouna, J. G., Pasupathy, C., Sawyer, P. N., Stanczewski, B., "Development and Evaluation of a New Pulsatile Ventricle Pum.p for Use in Cardiopulmonary Bypass", Biomaterials, Medical Devices, and Artifical Organs, Marcel Dekker, Inc., p. 151, 1973.
11. Chamberlain, Geoffrey, "An Artificial Placenta," American Journal of Obstetrics and Gynecology, pp. 100, 5, 615-626, 1968.
52

53
12. Guyton, Aurthur C., Textbook of Medical Physiology, W. B. Saunders, Co., p. 110, 1976.
13. Degnan, T. J., Karasik, S., Lenahan, J., "Laboratory Control of Heparin Therapy with the Activated Partial Thromboplastin Time Test," Current Theraputic Research, pp. 11, 6, 390-396, 1969.
14. Zucker, S., Cathey, M· H., "Control of Heparin Therapy," J. Lab. and Clin. Med., Feb., pp. 320-326, 1969.
15. Lumb, W. V., Small Animal Anesthesia, Lea and Febiger, p. 285, 1963.
16. Pitts, Robert A., ''The investigation of a non-invasive oximeter and the further development of an extracorporeal oximeter. Thesis, Virginia Polytechnic Institute and State University, 1976.

6. APPENDICES
54

55
CYANEMETHEGLOBIN METHOD FOR PLASMA HEMOGLOBIN DETERMINATION
Using the Coleman Spectrbphotometer follow directions for free
plasma hemoglobin. Two milliliters of plasma is used per five
milliliters of Drabkins reagent to detect the small amount of hemo-
globin present. The blood specimen is spun at 4000 rpm for 20 minutes.
Percent transmittence is re.ad at 540 millimicrons and milligrams of
hemoglobin per 100 millilieters (mg%) are determined from a calibration
curve.
TESTS AND MACHINE USED
Test
P02
PC02
pH
Units
torr
torr
% Hb Sat with o2 %
% Hb Sat with CO %
Hemoglobin-blood gm/100 ml
Hemoglobin-plasma mg/100 ml
Blood Flow
o2 Flow
o2 Pressure
ml/min
l/min
p.s.i.
56
Machine
IL pH/Gas Analyzer
IL pH/Gas Analyzer
IL pH/Gas Analyzer
IL Co-Oximeter@
IL Co-Oximeter@
IL Co-Oximeter@
Coleman Junior II® Spectrophotometer
Statham Macroflow
Puritan o2 Flowmeter
Beckman o2 Pressure Regulator
Model
113
113
113
182
182
182
6/20
E 3000
B

51
BLOOD TYPING
A. ABO typing
1. Divide a clean glass slide in the center using a marking pencil
and label:
A B
2. Place one drop of Anti-A setum. on one side and one drop of
Anti-B serum on the other.
3. Add to each side a volume of fresh blood obtained by veni-
puncture of a marginal ear vein equal to approximately ~-~
the volume of the antiserum used, or an amount sufficient to
produce a final cell concentration of 10-15%. Using separate
clean applicator sticks, mix each side over an area about one
inch in diameter.
4. Tilt or rotate the slide and examine macroscopically for
agglutination over a period.not to exceed TWO minutes.
5. Interpretation:
Anti-A
+
+
Reaction With
Anti-B
+
+
+ = agglutination; - = no agglutination
Blood Group
0
A
B
AB
58
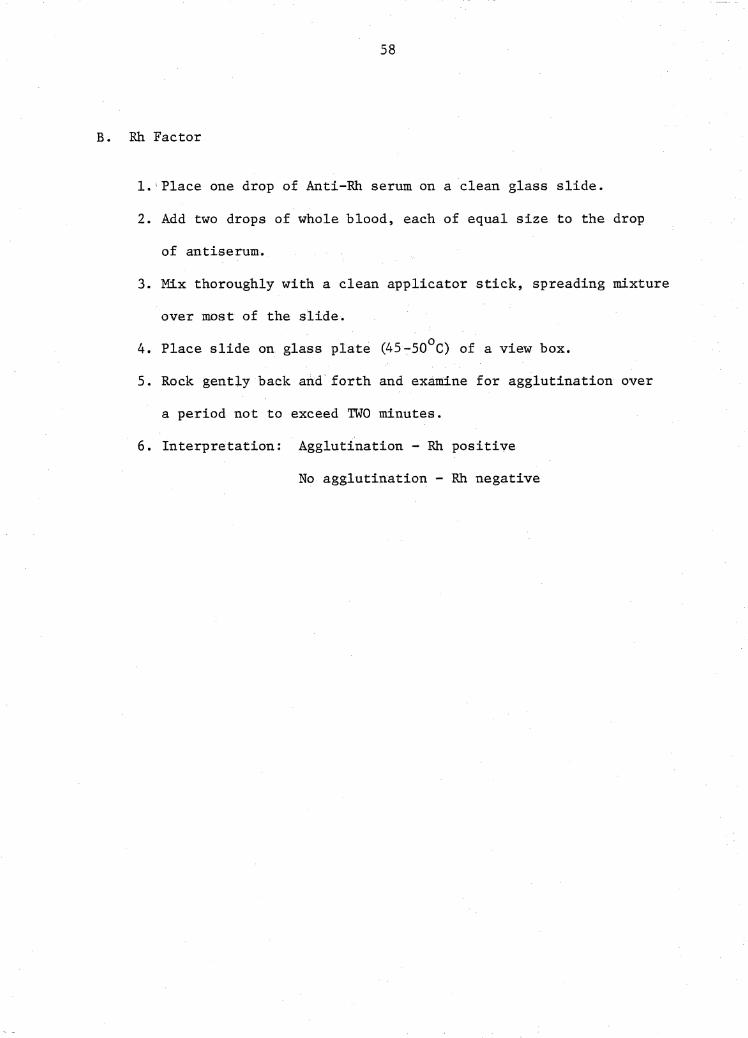
B. Rh Factor
l. 1 Place one drop of Anti-Rh serum on a clean glass slide.
2. Add two drops of whole blood, each of equal size to the drop
of antiserum.
3. Mix thoroughly with a clean applicator stick, spreading mixture
over most of the slide. 0 4. Place slide on glass plate (45-50 C) of a view box.
5. Rock gently back and forth and examine for agglutination over
a period not to exceed TWO minutes.
6. Interpretation: Agglutination ~ Rh positive
No agglutination - Rh negative

59
INJECTION AND PROCEDURE AND SHAVING
The injection procedure for withdrawing blood samples and
administering drugs is shown:
1) Place rabbit in restraint box.
2) Using a sharp scalpel blade, shave the ear along the edge.
This accomplishes three things: It exposes a clear view
of the vein to be injected, it makes a more sterile field,
and irritation of the shaving causes a local vasodilatation.
3) Liberally wipe the ear with 95% ethanol.
4) Grasp the ear, between the thumb and second finger, at its
·distal end. Insert a 25 gauge needle, bevel up, at a slight
angle, into the lumen of the vein. Slowly withdraw the
syringe plunger to see if blood enters the syring. If it
does, proceed with injection. Always make the first injection
distal in case another injection must be made. The next
injection should be made more proximal.
5) Before withdrawing the needle, place a dry cotton ball over
the site of injection and apply light pressure. Withdraw
the needle and maintain the pressure on the site for a few
minutes.
6) Remove animal from restraint box.
The abdomen and neck region of each. rabbit was shaved.. In order
to prevent discomfort to the animal 0.5 cc of sodium pentobarbitol
(64 .8 mg/cc) was injected in the marginal ear vein to sedate the

60
animal. The rabbit was then secured on its back for shaving. Animal
clippers of good quality are a requirement for shaving the rabbits.

61
ACTIVATED PARTIAL THROMBOPLASTIN TIME TEST
Materials: Crushed ice, Activated Platelet Factor Reagent, 0.02 M
CaC12 stop watch, plastic pipettes, cuvettes, plasma
pipette, acid citrate dextrose.
Procedure: 1) Draw sample: 0.9 cc blood/0.1 cc acid citrate dextrose
2) Centrifuge at 2500 rpm for 20 minutes
3) Take freshly centrifuged plasma and store in crushed
ice until required.
4) Reconstitute activated platelet factor reagent according
to directions and maintain at room temperature.
5) Prepare a 0.02 M solution of calcium chloride; transfer 0 .
required amount with the analyzer; warm to 37 c·in the
incubation block.
6) Pipette 0.1 ml of the activated platelet factor reagent
into a 70 X 7 mm cuvette and place in the incubation
block for two minutes.
7) Pipette 0.1 ml of the patient's plasma to the tube of
step 6. Note time of mixing.
8) After 5 minutes of incubation of the plasma/platelet
mixture place the cuvette in the reading block.
Pipette 0.1 ml of calcium chloride using the automatic
start feature of the analyzer.
9) Clot formation will stop the timer. Read and record.

62
MATERIALS REQUIRED FOR ONE TRIAL
1. Blood Typing
clean glass slides - 3 per rabbit
anti Rh serum
anti A serum
anti B serum
wooden applicator sticks
25 gauge needles
1 cc tuberculin syringes
cotton balls
95% ethanol
scalpel blades
2. Shaving
animal clippers
restraint box
scalpel
sodium pentobarbitol (64.8 mg/cc.)
25 gauge needles
tuberculin syringes
3. Sacrifice
sodium pentobarbitol (64.8 mg/cc)
25 gauge needles
tuberculin syringes
cotton balls

scalpel blades
scissors - skin
63
heparin (1000 units/cc and 75 units/cc)
sterile normal saline
500 ml flask - 1/ rabbit
large plastic funnel
4. Priming
large flask - 1000 ml
nylon mesh filter material
sylastic tubing
5. Surgery
sodium pentobarbitol (64.8 mg/cc)
25 gauge needles
tuberculin syringes
cotton balls
scalpel - assorted blades
small curved clamps
medium straight clamps
surgical scissors
00 cotton-nylon ligatures
4X4 sponges
sterile normal saline - 2000 ml
cannulas - assorted sizes
tubing adapter assembly (see Figure 16)
surgical gloves

64
6. Data collection and maintenance
glucose-saline (commercially prepared D5W-normal saline or
100 gm dextrose and 8.5 gm of sodium chloride added to distilled
water to make one liter of solution)
sodium bicarbonate 7. 5% (3. 75 gm bicarbonate of soda in 50 ml of
distilled water)
acid citrate dextrose (sodium citrate 2.2 gm, citric, acit 0.73 gm,
dextrose 2.45 gm and distilled water to make 100 ml)
10 cc syringes - 20
50 cc syringes - 10
2.5 cc syringes - 50
heparin (500 cc of 75 units/cc)
protamine sulfate - 10 cc
sodium pentobarbitol (64.8 mg/cc)
subcutaneous ECG electrodes - 6
centrifuge tubes - 50
activated platelet factor reagent - 6

The vita has been removed from the scanned document

A NEW BLOOD PUMP AND OXYGENATOR SYSTEM
FOR SUPPORT OF INFANTS WITH
NEONATAL RESPIRATORY DISTRESS:
PRELIMINARY IN VITRO AND IN VIVO EVALUATION
by
Andre A. Muelenaer, Jr.
(ABSTRACT)
A clinical need exists for a blood oxygenator and pumping system
for the support of neonates with respiratory deficiencies. Such
systems now available for support of adults are not suitable for
neonatal patients. In vitro evaluation of a new blood oxygenator
and blood pumping system was performed. The data obtained suggested
that this sytem may be applicable to neonates. In vivo studies
with rabbits to further analyze the new system were done. Preliminary
data from these studies indicate that the new blood oxygenator and
blood pump system may be applicable to supporting neonates with
respiratory deficiencies. Suggestions for future development of
this system are presented.