jinyun tang and qianlai zhuang 2015-10-13. difference between september and may 2004, xiong et al....
TRANSCRIPT

Jinyun Tang and Qianlai Zhuang
23/4/19

Difference between September and May 2004, Xiong et al. (2008)
23/4/19

(upper) 850 Mean Omega field:2004 May to Sep.
(right) Mean wind field: 2004 May to Sep.
850hpa
300hpa
23/4/19

Is the hotspot (260-359 hPa) over Himalaya region mostly due to long range transport or local transport (rice paddy emissions)?
If dominated by local transport, which source is more important: China/India rice paddy?
What are the relative contributions of the long range transport and local transport to the hotspot over Himalaya region?
23/4/19

23/4/19
NE Africa
India
HimalayaChina
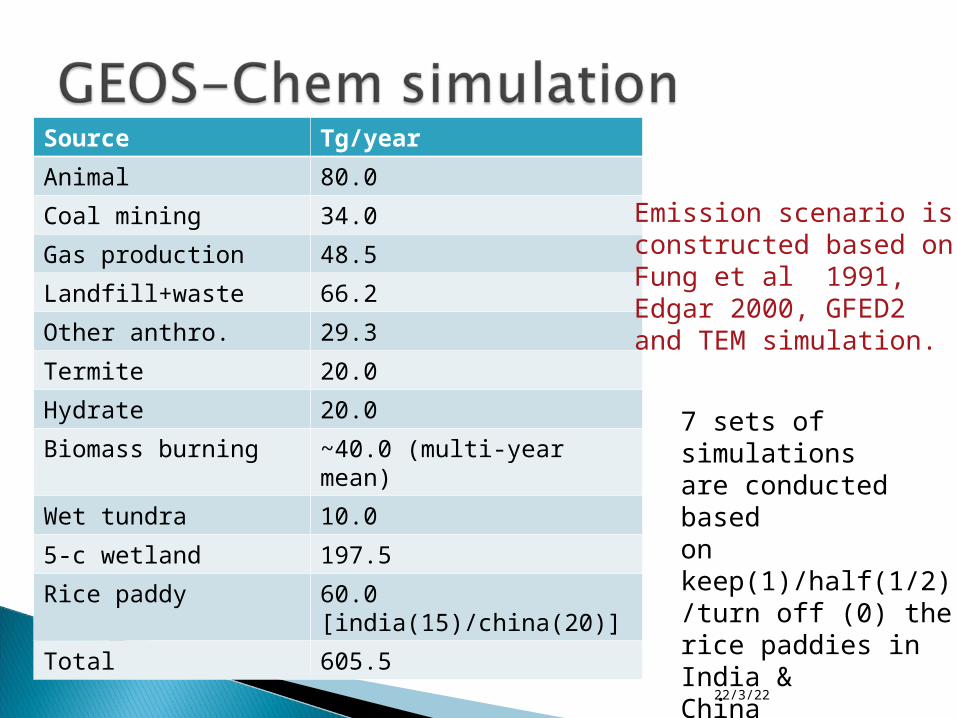
Source Tg/year
Animal 80.0
Coal mining 34.0
Gas production 48.5
Landfill+waste 66.2
Other anthro. 29.3
Termite 20.0
Hydrate 20.0
Biomass burning ~40.0 (multi-year mean)
Wet tundra 10.0
5-c wetland 197.5
Rice paddy 60.0 [india(15)/china(20)]
Total 605.5
23/4/19
Emission scenario is constructed based on Fung et al 1991, Edgar 2000, GFED2 and TEM simulation.
7 sets of simulations are conducted based on keep(1)/half(1/2)/turn off (0) the rice paddies in India & China

The OH field is tested by MCF (CH3CCl3) transport with a total lifetime 5.51 years, subject to a stratospheric loss 46.0 years and ocean uptake 77.0 years. The overall lifetime of CH4 is 8.1~8.2 years.
To compare with AIRS retrieval, model simulation is convolved using the equation
y=Ax+(I-A) xa
y is the convolved data, x is GEOS-Chem output, xa is the first guess profile and A is averaging kernel.
23/4/19

23/4/19

23/4/19

23/4/19

23/4/19

23/4/19
260-359hpa

F(x,y)=F(x0,y0)+a Δx + b Δy + c Δx Δy
x China, y India, F(x,y) the hotspot strength defined by Sep. CH4 minus May CH4 on 160hPa~206hPa
23/4/19
(x0,y0) a b c
(0,0) 0.57 1.05 -0.56
(1/2,1/2) 0.14 0.46 -0.33
(1,1) 0.03 0.25 -0.23

A significant part (almost half) of the hotspot is due to long range transport.
The India rice paddy emission contributes more to the hotspot, because of the strong convection and the upper level westerlies.
23/4/19

An inverse modeling will be undertaken to optimize the various sources subject to the constraint provided by GLOBALVIEW-CH4, 2008 observations.
A new quantification of CH4 emissions from the natural ecosystems will be conducted with a newly developed version of process-based model TEM.
Better answers to the research questions would be provided based on the optimized simulation
23/4/19

Thanks the GEOS-Chem group for developing GEOS-Chem and providing funding support for this travel. The work is part of Jinyun Tang’s thesis work supported by NASA Earth System Science Fellowship and Purdue Climate Change Research Center fellowship. Dr. Xiaozhen Xiong at NOAA/NESDIS/Center for Satellite Applications and Research provided guidance in analyzing the AIRS retrieval product. Dr. Clarissa Spivakovsky provided the OH field for GEOS-Chem simulations.
23/4/19