johnson space center’s role in a sustainable future · carbon into the atmosphere each year now...
TRANSCRIPT

February 2004
NASA/TM—2004–212069
Johnson Space Center’s Role in a Sustainable Future
Michael K. Ewert Lyndon B. Johnson Space Center Houston, Texas

THE NASA STI PROGRAM OFFICE … IN PROFILE
Since its founding, NASA has been dedicated to the advancement of aeronautics and space science. The NASA Scientific and Technical Information (STI) Program Office plays a key part in helping NASA maintain this important role. The NASA STI Program Office is operated by Langley Research Center, the lead center for NASA’s scientific and technical information. The NASA STI Program Office provides access to the NASA STI Database, the largest collection of aeronautical and space science in the world. The Program Office is also NASA’s institutional mechanism for disseminating the results of its research and development activities. These results are published by NASA in the NASA STI Report Series, which includes the following report types: • TECHNICAL PUBLICATION. Reports
containing completed research or major significant phases of research. Also presents the results of NASA programs (including extensive data or theoretical analysis). Includes compilations of significant scientific and technical data and information deemed to be of continuing reference value. This is the NASA equivalent of peer-reviewed, formal, professional papers, but has less stringent limitations on manuscript length and extent of graphic presentations.
• TECHNICAL MEMORANDUM.
Scientific and technical findings that are preliminary or of specialized interest. For example, quick release reports, working papers, and bibliographies that contain minimal annotation. Does not contain extensive analysis.
• CONTRACTOR REPORT. Scientific and technical findings by NASA-sponsored contractors and grantees.
• CONFERENCE PUBLICATION. Collected papers from scientific and technical conferences, symposia, seminars, or other meetings sponsored or cosponsored by NASA.
• SPECIAL PUBLICATION. Scientific,
technical, or historical information from NASA programs, projects, and missions, often concerned with subjects having substantial public interest.
• TECHNICAL TRANSLATION. English-
language translations of foreign scientific and technical material pertinent to NASA’s mission.
Specialized services that complement the STI Program Office’s diverse offerings include creating custom thesauri, building customized databases, organizing and publishing research results, and even providing videos. For more information about the NASA STI Program Office, see the following: Access the NASA STI Program Home Page at http://www.sti.nasa.gov. E-mail your question via the Internet to [email protected]. Fax your question to the NASA STI Help Desk at (301) 621-0134. Telephone the NASA STI Help Desk at (301) 621-0390. Write to: NASA Access Help Desk NASA Center for AeroSpace Information 7121 Standard Drive Hanover, MD 21076-1320

February 2004
NASA/TM—2004–212069
Johnson Space Center’s Role in a Sustainable Future
Michael K. Ewert Lyndon B. Johnson Space Center Houston, Texas National Aeronautics and Space Administration Johnson Space Center Houston, Texas 77058-3696

Acknowledgments
There are many, many people that the author would like to thank for providing encouragement, advice and information during the course of this work. In the JSC Center Operations Directorate, these include Dennis Klekar, Henry Wyndon, Ron Bailey, Ron Williams, Mike Scott, Sheila Powell, David Allen, Rienhart Bruckner, Charlie Moore, Doug Connover, Ramon Ramirez, Sam Tanksley, Harry Hart, Bill Cowart, Perri Fox, Pat Kolkmeier, Steve Campbell, Jay Hoover, Mellisa McKinnely, Linda Spuler, Bill Parkan, Bob Kehoe, Gary Wessels, Sharon Milburn, Susan Bradshaw, Gere Cole, La Toya Smith, Michael Mudd, Terri Bradshaw, Dr. Mark Stapleton, Elizabeth Morgan, Penny Webster, David Macurdy and Julie Pate. Other JSC personnel who were very helpful are Dr. Don Stillwell, Alyssa Mueler, Mark Craig, Dave Hanson, Jack James, James Whittington, Ken Lassman, Kerri McCurdy, Karla Bradley, Dr. John Graf, Karen Pickering, Laura Shaw, Richard Morton, Dr. Luis Rodriguez and Dr. John Keller. Outside of JSC, individuals who contributed valuable advice are David Bergeron, Kevin Palmer, Dr. Ann Hooker-Clarke, Rich Wickman, Dr. Chris Pawlowski, Ed Pierce, Vickie Dautrich and Jeff Dominick. Special appreciation goes to the following individuals for their contributions. For serving as “Sustainability Team” advisors on this project for over a year, many thanks go to Dr. Chin Lin, David Hickens, Sandy Parker, Jo Kines, Kirk Hummel, Pandora Vickery, Dr. Don Henninger, Art Vasquez, Dr. Tom Sullivan, Terri Gilbert, Dave Forrest, Hazel Mann and Linda Singleton. For writing sections of this report, the author is especially thankful to Art Vasquez and Kirk Hummel. For excellent and enthusiastic editing services, the author is extremely appreciative of Luanne Jorewicz. Finally, for daily inspiration and constant supportiveness, the author is indebted to his wonderful wife Patty.
Mention of any product, technology or company in this report does not indicate endorsement by NASA.
Available from:
NASA Center for AeroSpace Information National Technical Information Service 7121 Standard Drive 5285 Port Royal Road Hanover, MD 21076-1320 Springfield, VA 22161
This report is also available in electronic form at http://ston.jsc.nasa.gov/collections/NTRS

iii
Contents 1 Introduction.......................................................................................................................1
1.1 Key Environmental Issues ...........................................................................................1 1.1.1 Population ...........................................................................................................1 1.1.2 Air Pollution........................................................................................................3 1.1.3 Water Supply .......................................................................................................4 1.1.4 Food Supply ........................................................................................................5 1.1.5 Deforestation & Decline of Biodiversity ..............................................................6 1.1.6 Waste Generation.................................................................................................7 1.1.7 Ozone Depletion..................................................................................................7 1.1.8 Climate Change (or “Global Warming”) ..............................................................8 1.1.9 Energy...............................................................................................................12
1.2 Sustainability.............................................................................................................13 1.2.1 What is Sustainability? ......................................................................................13 1.2.2 Recent Studies ...................................................................................................14 1.2.3 Economic Considerations...................................................................................16
1.3 The Future.................................................................................................................16 2 Ongoing Environmental Sustainability Efforts..............................................................17
2.1 International United Nations .................................................................................17 2.2 Federal Government ..................................................................................................17
2.2.1 Environmental Protection Agency......................................................................18 2.2.2 Department of Energy........................................................................................21 2.2.3 Presidential Executive Orders and Legislation ...................................................23 2.2.4 NASA................................................................................................................24 2.2.5 Other .................................................................................................................28
2.3 Non-Federal Efforts...................................................................................................29 2.3.1 National Council for Science and the Environment ............................................29 2.3.2 Texas State Offices ............................................................................................29 2.3.3 Sustainability Research, Education and Practice.................................................30
2.4 Success Stories ..........................................................................................................32 3 Measuring Progress.........................................................................................................32
3.1 Existing Metrics and Indicators .................................................................................32 3.1.1 International “Environmental Sustainability Index” ...........................................32 3.1.2 U.S. Interagency Working Group on Sustainable Development Indicators .........32 3.1.3 NASA Environmental Tracking System.............................................................33 3.1.4 Air Pollution Emission Factors ..........................................................................33 3.1.5 Other Sources ....................................................................................................34
3.2 Proposed Indicators for JSC.......................................................................................34 3.3 Historical Performance at JSC ...................................................................................36
4 Technological Developments...........................................................................................39 4.1 Air.............................................................................................................................39
4.1.1 Air Monitoring...................................................................................................40 4.1.2 Air Treatment Technologies...............................................................................40 4.1.3 Adhesives ..........................................................................................................40 4.1.4 Painting .............................................................................................................40

iv
4.2 Agriculture and Food.................................................................................................40 4.3 Energy.......................................................................................................................42
4.3.1 Energy Conservation..........................................................................................42 4.3.2 Energy Efficiency ..............................................................................................43 4.3.3 Combined Heat and Power Cogeneration ......................................................44 4.3.4 Gas Turbines......................................................................................................44 4.3.5 Fossil Fuels and Carbon Sequestration...............................................................44 4.3.6 Nuclear Fission and Fusion................................................................................45 4.3.7 Wind..................................................................................................................45 4.3.8 Solar Photovoltaic..............................................................................................45 4.3.9 Solar Thermal ....................................................................................................47 4.3.10 Landfill Gas.......................................................................................................50 4.3.11 Bio-Fuels ...........................................................................................................50 4.3.12 Energy Storage ..................................................................................................51 4.3.13 Backup Power Options ......................................................................................56
4.4 Fuel Cells ..................................................................................................................57 4.4.1 Types of Fuel Cells ............................................................................................57 4.4.2 Fuel Cell Research.............................................................................................60 4.4.3 Fuel Cell Issues..................................................................................................61 4.4.4 Commercial Availability of Fuel Cells ...............................................................62
4.5 Sustainable Habitats ..................................................................................................62 4.5.1 “Green” Products and Sources ...........................................................................63 4.5.2 Low Heat Gain Roofs ........................................................................................64 4.5.3 Windows ...........................................................................................................64 4.5.4 Lighting .............................................................................................................65 4.5.5 Landscaping.......................................................................................................65
4.6 Thermal Control ........................................................................................................66 4.6.1 Air-Conditioning Systems..................................................................................66 4.6.2 Refrigeration......................................................................................................69 4.6.3 Thermal Energy Storage ....................................................................................70
4.7 Transportation ...........................................................................................................71 4.7.1 Alternative Fuel Vehicles...................................................................................72 4.7.2 Aerial and Space Vehicles .................................................................................74
4.8 Waste ........................................................................................................................75 4.8.1 Hazardous Waste ...............................................................................................75 4.8.2 Waste Reduction/Recycling ...............................................................................75 4.8.3 Waste Processing Technologies .........................................................................76
4.9 Water ........................................................................................................................77 4.9.1 Water Purification Technologies ........................................................................77 4.9.2 Clean Water Efforts ...........................................................................................78
5 Systems Analysis .............................................................................................................78 5.1 Study Approach.........................................................................................................78 5.2 Analysis Details.........................................................................................................80
5.2.1 Costs and Factors...............................................................................................80 5.2.2 Current Technologies Assessed..........................................................................81 5.2.3 Future Technologies Assessed ...........................................................................87

v
5.3 Analysis Results ........................................................................................................88 5.3.1 JSC Mass Balance..............................................................................................88 5.3.2 Potential Savings Due to Various Technologies .................................................89 5.3.3 Analysis Summary.............................................................................................89
6 Recommendations ...........................................................................................................90 6.1 Technology Investments............................................................................................90
6.1.1 Energy Efficient Habitability .............................................................................93 6.1.2 Renewable Energy and Regenerative Fuel Cells.................................................93 6.1.3 Electric Vehicles................................................................................................94 6.1.4 Waste and Water Reuse .....................................................................................94
6.2 JSC Projects ..............................................................................................................94 6.2.1 Solar Recharge Station.......................................................................................95 6.2.2 Self-contained Solar Refrigerator.......................................................................95 6.2.3 Fuel Cell UPS....................................................................................................95 6.2.4 Building-Integrated Fuel Cells ...........................................................................95 6.2.5 Fuel Cell Cart ....................................................................................................96 6.2.6 Mission Control Backup Power..........................................................................96 6.2.7 Energy Conservation and Efficiency Efforts ......................................................97 6.2.8 Air Conditioning Additives................................................................................98 6.2.9 Heat Driven Air-conditioning ............................................................................98 6.2.10 High-efficiency Chillers.....................................................................................98 6.2.11 Solar Water Heaters...........................................................................................99 6.2.12 Sustainable Buildings and Test Facilities ...........................................................99 6.2.13 Alternative Fuel Vehicles...................................................................................99 6.2.14 Long-Range Planning Studies ............................................................................99
6.3 Management............................................................................................................100 6.3.1 Become an Exemplary Federal Facility............................................................100 6.3.2 Increase Employee Awareness .........................................................................100 6.3.3 Procurement Practices......................................................................................101 6.3.4 Partnerships .....................................................................................................101 6.3.5 Sustainable Technology Projects in Existing Programs ....................................101 6.3.6 Education Outreach..........................................................................................101 6.3.7 Public Relations and Community Outreach......................................................102 6.3.8 Technology Transfer ........................................................................................102 6.3.9 Sustainability Team .........................................................................................103
6.4 Further Study...........................................................................................................103 6.4.1 Sustainability indicators...................................................................................103 6.4.2 Systems analysis ..............................................................................................103 6.4.3 Cost and Benefit Analysis ................................................................................104
7 References......................................................................................................................104 Appendix of JSC-Specific Information (not publicly available)

vi
Nomenclature
A amps CFC chlorofluorocarbon CO carbon monoxide CO2 carbon dioxide DOE Department of Energy EIA Energy Information Administration EPA Environmental Protection Agency EPCOT Experimental Prototype Community Of Tomorrow FY fiscal year GSF gross square feet kWh kilowatt hours LED light-emitting diode Mcf thousands of cubic feet MEMS microelectromechanical systems MWh megawatt hours NASA National Aeronautics and Space Administration NO2 nitrogen dioxide NOx nitrogen oxides PAFC phosphoric acid fuel cell Pb lead PEMFC proton exchange membrane fuel cell PM particulate matter ppm parts per million PROA polarized refrigerant oil additive R&D research and development SO2 sulfur dioxide TCEQ Texas Commission on Environmental Quality TxDOT Texas Department of Transportation UN United Nations UPS uninterruptible power supply UV ultraviolet V volts VOC volatile organic compounds W watts

vii
Executive Summary
The Apollo Program gave humankind a unique glimpse of our planet Earth from a celestial vantage point. People began to call it a “blue marble” and to think globally about efforts to protect it. The world’s population is over 6 billion and is increasing by almost 100 million per year. At the turn of the 21st century, human activity has affected every part of the planet and every ecosystem. For example, phosphates and nitrates in lakes and slow rivers can lead to excess algal growth, killing fish and other animals and leaving unpleasant odors. Municipal wastewater cleaning and phosphate-free detergents have helped solve this problem in some parts of the world. Global emission of 1.8 trillion kilograms of carbon into the atmosphere each year now threatens to change the Earth’s climate, potentially causing sea-level rise and increased severe weather.
Key environmental issues are affecting our lives more and more every day. Air, water, and food resources are threatened in various ways and we produce increasing amounts of waste. Spaceship Earth must address similar challenges to life support systems on extended-duration spacecraft, but on a much different scale. However, issues such as declining biodiversity, ozone depletion, and climate change show us that the Earth’s natural reserves are not infinite either. Our choice of energy sources is expected to be one of the most important decisions that global society will make over the next half century.
While the concept is not new, there is a renewed realization in the past few years among governments, corporations, and individuals that our business practices and our lifestyles must be sustainable in order to last. Simply put, sustainability is development that meets the needs of present generations without compromising the ability of future generations to meet their own needs.
Environmental Sustainability Efforts NASA scientists and many others are contributing to the growing knowledge of our Earth and its ecosystems. Satellites measure sea level rise, and changes in vegetation and air pollutants that travel between countries and continents.
The U.S. federal government seeks to be a leader in environmental sustainability efforts through various Executive Orders and policies that save energy, reduce waste, and encourage less reliance on oil as an energy source. NASA, as an agency that is by nature focused on the future, has much to contribute to these efforts.
The NASA mission is “To understand and protect our home planet, to explore the universe and search for life, to inspire the next generation of explorers …as only NASA can.” Pollution prevention, affirmative procurement and sustainable design are all programs that are under way at NASA. But more can be done. By sharing ideas and learning from other organizations as well as from the talented workforce we are a part of, JSC can improve its sustainability performance and spread the benefits to our community.
Measuring Progress
As an awareness and management tool, some organizations have begun to measure their progress toward environmental sustainability with some type of index or metric. Some data are already available for NASA Centers due to reporting requirements related to Executive Orders. With this data and knowledge of the key environmental issues that may one day affect NASA’s mission, a set of Sustainability Indicators was developed for JSC. Fifteen indicators were selected and grouped into the categories of air pollution, waste/resource use, and energy. Using these metrics, JSC’s historical performance was studied.

viii
Technological Developments NASA is a technological organization, and technology, when appropriately applied, is one way to improve environmental sustainability. Thus, various technologies that can be used to improve environmental sustainability at JSC and elsewhere were studied. Discussion of these technologies and current trends in research is presented by technical discipline and whenever applicable, related to synergistic research under way at NASA.
Environmentally beneficial technologies related to air, agriculture/food, energy, fuel cells, sustainable habitats, thermal control, transportation, waste and water were researched and summarized. Many technologies and practices that save energy or reduce pollution in some other way can be implemented at JSC. For example, combined heat- and power-generation systems can be used to supply electricity and heat energy to JSC facilities simultaneously with less waste. Also, higher-efficiency, non-ozone-depleting refrigerators and freezers could replace some in use at the cafeterias and science buildings.
Just as past NASA research and utilization of fuel cells and solar panels has promoted commercialization of these environmentally important technologies, future research and development can benefit both NASA’s space and terrestrial missions. Perfecting a high-efficiency solar dynamic power system, flywheels for energy storage or a photovoltaic powered regenerative fuel cell system could spur increased use of renewable energy, for example. Regenerative life support system development may help us find more efficient food systems or better ways to supply the world with clean water.
Systems Analysis Systems analysis considers the interactions of complex systems such as water management on board the Space Shuttle. Fuel cells, which provide electrical power to the vehicle, combine stored hydrogen and oxygen to form water. That water is consumed by the crew and becomes urine or could be exhausted to space in a device known as a flash evaporator to reject excess vehicle heat (caused by the vehicle’s electrical power). Choices exist about whether to recover the water from the urine and whether to “waste” water by evaporating it to space. Systems analysis helps answer these questions by considering the mission goals and duration.
On Earth, complex interactions occur between air, oceans, land, plants, animals, and, in recent history, human activities. These are sometimes referred to as the web of life, and NASA scientists are helping to better understand these system interactions. Systems analysis can also be used to help decide how best to guard against adverse effects of human activities at our facilities. This report explores the possible environmental savings of various technological developments by calculating the effect on each of the sustainability indicators devised for JSC. In many cases, these effects are interrelated. For example, a technology such as composting to drastically reduce solid waste volume requires electrical power to effectively accomplish the process in a realistic period. Assuming this power comes from fossil fuel sources, this in turn results in air emissions of nitrogen oxides, sulfur dioxide, and carbon dioxide.
By studying the system-level effects together with the goals of preserving our planet and sustaining our mission capabilities at the Center, JSC management can make wise decisions for the future. High-impact areas identified by the analysis were energy efficiency, increased use of renewable energy sources, and waste reduction.
Recommendations This report recommends that JSC increase its efforts to use environmentally sustainable technologies and practices in order to become an example for other organizations and a leader in the community. Besides demonstrating a commitment to the future and to the NASA mission of understanding and protecting our home planet, this actionor these actions described in this reportwill ultimately help JSC preserve its

ix
capability to carry out our mission well into the future by increasing efficiency of operations and reducing waste and pollution.
Specific recommendations are divided into 3 areas:
• Technology Investments – Research and development areas that are recommended for increased emphasis due to their potential impact on our sustainable future in addition to their importance to NASA’s space exploration mission.
• Center Projects – Pilot projects, practices, and applications of technologies that are recommended for JSC facilities.
• Management – A collection of ideas for implementing the first two recommendations as well as community outreach activities that would be synergistic with them.
Examples of technology investments include construction of a prototype fuel cell-powered cart for JSC grounds keeping in addition to planetary exploration and development of high-efficiency chillers that could be used in JSC buildings or spacecraft. A highly reliable backup power system could be created at the Center that uses on-site gas turbines, fuel cells, and renewable energy sources rather than diesel engines. Other examples of commercially available technologies that can be applied all around the Center to reduce energy consumption and environmental impact are high albedo roofs and light-emitting-diode (LED) lights. Increasing use of wind and solar energy for water heating and electricity generation can reduce reliance on fossil fuels, which produce air pollution and greenhouse gases.
By increasing employee awareness of sustainability issues through training and management support (similar to JSC’s safety initiatives), the impact will be seen both at JSC and in the surrounding community. Existing resources, partnerships and programs can be used to accomplish many of these goals.
While environmental sustainability activities are already under way at JSC, there is much more that can be done. A working group between various directorates at the Center can help coordinate these efforts and draw on the talents of various organizations to work toward a common goal. Certain areas, such as transportation and nanotechnology were only explored briefly in this report, leaving room for additional research and analysis. By drawing on our strengths and “can do” attitude, JSC’s role in a sustainable future can be one of innovation and leadership!

x

1
1 Introduction 1.1 Key Environmental Issues
The Apollo Program gave humankind a unique glimpse of our planet Earth from a celestial vantage point (Figure 1-1). People began to call it a “blue marble” in contrast to our ancestors’ perception of its infinite capacity. We also began to think globally about efforts to protect it.
At the turn of the 21st century, human activity has affected every part of the planet and every ecosystem. According to a United Nations (UN) report, The State of World Population 2001, “Our choices and interventions have transformed the natural world, posing both great possibilities and extreme dangers for the quality and sustainability of our civilizations, and for the intricate balances of nature.”1
This same UN report, lists water, food, climate change, and deforestation as the major environmental challenges of our time.1
1.1.1 Population
Since the inception of NASA in 1958, the Earth’s population has doubled to 6.1 billion, with growth mostly in poorer countries. “Consumption expenditures have more than doubled since 1970, with increases mostly in richer countries. During this time, we have created wealth on an unimaginable scale, yet half the world still exists on less than $2 a day. We have learned how to extract resources for our use, but not how to deal with the resulting waste: emissions of carbon dioxide (CO2), for example, grew 12 times between 1900 and 2000. In the process we are changing the world's climate.”1
World population is increasing by almost 100 million per year, with 95% of this coming from developing countries. However, each additional “U.S. citizen statistically adds more stress to the natural environment than 20” people in these countries.2
While population growth is a complex and political issue, it seems safe to say the Earth’s population will continue to increase for at least the next 50 years, barring some calamity. Of course, the magnitude of the increase will have a significant effect on resources and sustainability. Figure 1-2 provides various population projections of the UN. 1-2: UN Population Predictions1
1-1: Apollo 15 View of Planet Earth
2
1.1.1.1 Urbanization
Urbanization, the trend of migration from rural areas to cities, usually in search of better jobs and a better life, has been taking place throughout history. However, urbanization is occurring at an ever more rapid pace, taxing the ability of cities’ infrastructures to absorb these new urban citizens. Now, half of the world’s people live in cities. Urbanization is occurring fastest in the developing world, where it is more of a challenge to keep up with.
Cities, like spacecraft, require concentration of materials, and consequently usually have a waste stream flowing back out. In 2001, the city of New York filled up its nearby landfill and is now forced to truck its daily 11 million kg (12,000 tons) of garbage to sites up to 480 km (300 mi) away.3 Increased recycling and reduced packaging are two sustainability principles that can help reduce this waste stream in spacecraft and in cities; however, the motivation is stronger for spacecraft, since these practices also reduce the all-important launch mass of the vehicle.
Some cities are becoming denser on purpose, clustering around light rail, to combat urban sprawl. One of the problems this combats is the time wasted in traffic jams. This time is estimated to have increasedper person, per year, on average for larger U.S. citiesfrom 11 hours in 1982 to 36 hours in 1999. Houston fared worse with 50 hours/person/year. With traditional, gasoline-powered cars, this also means increased fuel consumption (288 liters or 76 gallons/person/year) and air emissions.4
Some feel that water scarcity might reverse urbanization, but another possibility would be increased water recycling. The Internet could also lead to decreased urbanization but that trend has not been observed yet. Our future in space and on Earth will hold many thingstechnologies and techniques that help more people live closer together will surely be among them.
1.1.1.2 Heat Islands
Urban heat islands are created when natural vegetation is replaced by heat-absorbing surfaces such as building roofs and walls, parking lots, and streets. While not on par with global warming as an environmental issue, these heat islands increase the demand for air-conditioning, accelerate the formation of smog, and can even change the weather, so many cities have taken a keen interest in the issue.
According to the Earth Policy Institute, the U.S. area devoted to roads and parking lots is almost as much as we devote to wheat farms.5 Through the implementation of measures designed to mitigate the urban heat island, communities can decrease their demand for energy and effectively "cool" the metropolitan landscape. In addition to the economic benefits, using less energy leads to reductions in emissions of CO2
and ozone (smog) precursors such as nitrogen oxides (NOx) and volatile organic compounds (VOCs). Recognizing the beneficial effect that urban heat island mitigation can have on the local and global environment, the Environmental Protection Agency (EPA) launched the Urban Heat Island Mitigation Initiative in 1997 to encourage ozone non-attainment areas to pursue urban heat island mitigation measures.6 7 Barriers that have been identified which prevent the widespread adoption of urban heat island mitigation measures include a general lack of information, no product differentiation for surfaces, limited product availability (e.g. roofs) and various institutional and political issues, which often stem from the first barrierlack of information. To address the institutional and information barriers, the EPA teamed up with the Department of Energy (DOE), NASA, and Lawrence Berkeley National Laboratory to demonstrate the potential benefits of urban heat island mitigation by undertaking the following activities:
• Conduct detailed analyses to quantify the potential air quality benefits from strategically planted vegetation and reflective surfaces.
• Identify the most effective means to implement measures aimed at reducing the urban heat island effect.

3
• Develop "lessons learned" that will serve as guidelines for other cities interested in initiating similar types of programs and policies.
• Conduct outreach and educational activities to encourage other cities to implement measures intended to reverse the urban heat island effect.
Trees give benefits of both reducing the heat island effect and absorbing air pollution. For example, each year a single tree with a trunk circumference of 76 cm (30 in.) “removes 90 kg (200 lb) of CO2, 0.49 kg (1.1 lb) of ozone, and 0.9 kg (2 lb) each of sulfur dioxide (SO2), nitrogen dioxide (NO2) and particulates, with the greatest activity in the summer.”8
1.1.2 Air Pollution
Besides being an eye sore, air pollution can have many other negative effects on society, such as health problems9 and acid rain, which can lead to problems in our water and food supplies. Under the Clean Air Act, EPA establishes air quality standards to protect public health. EPA also sets limits to protect public welfare, including protection against decreased visibility and damage to animals, crops, vegetation, and
buildings. EPA has set national air quality standards for six principal air pollutants (also referred to as criteria pollutants): NO2, ozone, SO2, particulate matter (PM), carbon monoxide (CO), and lead (Pb). Four of these pollutants (CO, Pb, NO2, and SO2) result primarily from direct emissions from a variety of sources. PM results from direct emissions, but is also commonly formed when emissions of NOx, sulfur oxides, ammonia, organic compounds, and other gases react in the atmosphere. Ozone is not directly emitted but is formed when NOx and VOCs react in the
presence of sunlight. As an example of the magnitude, over 100 million tons of CO are emitted each year in the U.S., but the EPA reports good progress over the last 2 decades in reducing these pollutants.10
The emissions of on-road motor vehicles (cars & trucks) which pollute the air through combustion and fuel evaporation are the single largest source of air pollution in the U.S. Electricity production is the leading cause of industrial air pollution in the U.S. Smog, soot, acid rain, CO2, mercury, and particulate matter all result from fossil fuel power plants, especially those burning coal. Figure 1-3 shows the major sources of air pollution in the U.S. in the year 2000 by combining the mass of CO, Pb, NOx, VOC, PM, and SO2 emissions.
Scientists have estimated that the number of deaths in the U.S. associated with air pollution range from 50,000 to 100,000 per year.11 For each of these deaths, there are many more hospital admissions and doctor visits for asthma and other respiratory conditions. An EPA study found that, for every dollar we have spent on pollution controls since 1970, we have gained $45 in health and environmental benefits.11 Dollars spent on pollution avoidance may go even further.
The effects of air pollution are most acute in urban areas. The Houston/Galveston region has been plagued by air pollution for several decades. In 1970, the Clean Air Act required compliance with federal
US Air Pollution by Source
Electric utilities
On-road vehicles
Non-road transportation
Industrial (-electricutilities)Commercial/residentialfuel combustionMisc. (Agriculture,wildfires, dust)
1-3: Major Sources of Air Pollution in the U.S. (http://www.epa.gov/ttn/chief/trends/index.html)

4
ozone standards by 1977; however, in 2003, the current State Implementation Plan is still struggling to meet federal standards by 2007.12
In some of the largest cities of the developing world, the problem of air pollution is even worse. Increasing use of gasoline-powered cars as well as industrial and electric power plants emissions are to blame. We explore various energy- and transportation-related technologies that can help lead to a more sustainable future below.
1.1.3 Water Supply
According to Safe Water Systems, “In 2000, 1.1 billion people did not have access to safe drinking water... By 2025, 2 billion people are expected to be without.” Their Web site goes on to say, “The global impact of contaminated drinking water is staggering. Eighty percent of illnesses in developing countries are blamed on waterborne diseases, resulting in an estimated 2.5 billion illnesses and 5 million deaths each year. According to the World Health Organization: ‘At any given time perhaps one-half of all people in the developing world are suffering from one or more of the six main diseases associated with water supply and sanitation (diarrhea, ascaris, dracunculiasis, hookworm, schistosomiasis, trachoma).’ ”13
1-4: Clean Water Is Becoming More Scarce in More Areas14
The world knows how to produce clean water, so the problem is not exactly technical. There is plenty of water on Earth, but it is the distribution of potable water that is projected to be a major issue of the 21st century (Figure 1-4). Fresh water accounts for only 2.5% of the Earth’s water, and most of that is trapped in polar ice. We have the means to use salt water, but typically at a much greater cost. Nevertheless, new technologies and other innovations may be applied to this critical issue.
Since they are growing faster, poorer countries will be most affected by water shortage. “The problem with high arsenic levels in ground water is an example of a dilemma faced by developing countries,” according to the Mennonite Central Committee relief agency.15 A September 2001 article tells why it is difficult to solve a technically solvable problem and concludes that “The challenge is to figure out how to modify this (first world) technology so that it is useful and cost-effective in Bangladesh.”

5
Economics obviously plays a role. “Industry can often pay 50 to 100 times as much for water as farmers do.”16 This, of course, relates to agriculture and food supply, which are discussed below.
In Texas, surface water is consumed mainly by 3 large users:17
• Irrigation – 44.8%
• Municipal – 31.8%
• Industry – 22.5%
Often, technological solutions will be more expensive than natural ones. New York City recently learned the value of natural systems when faced with the residential and industrial development of the Catskill forest, where it gets its water. The city opted to restore its watershed for $2 billion so that it could get water from natural sources rather than spending $11 billion on new water purification plants.18
Nevertheless, innovative water recycling and reuse technologies are of great interest, and NASA may have some experience to contribute to the community. Besides research in purifying wastewater for reuse in spacecraft, Johnson Space Center (JSC) has experience with the system
shown in Figure 1-5 that recycles water and eliminates hazardous waste in photo processing. The challenge for the world will be to identify low-cost technologies that can be applied on a very large scale to produce potable water.
1.1.4 Food Supply
Food is essential to human life. Many of us take it for granted, but engineers planning a trip to Mars and subsistence farmers in developing countries both realize the effort required to ensure an adequate sustainable supply. Indeed, as the book Eco-Economy states, “Expanding food production to feed the world’s growing numbers will be far more difficult during this half-century than it was over the last.” 19
1.1.4.1 Crop Land
“An estimated 36% of the world’s cropland is suffering a decline in inherent productivity from soil erosion.”20 Pesticides, herbicides, and runoff also contaminate water supplies and make the problem worse.
1.1.4.2 Range Land
“One-tenth of the Earth’s land surface is cropland, but an area twice this size is rangeland…” “Worldwide, almost half of all grasslands are lightly to moderately degraded and 5% are severely degraded.”21 Loss of prairies and other habitats also leads to loss of biodiversity.
1-5: “Zero-discharge” Photo Waste Processing System

6
1.1.4.3 Fisheries
Shrinking catches of fish are leading to increasing prices. One solution may be producing fish in combination with local agriculture. For example, high-yield integrated systems can be established where “fish feed on algae that live on organic residues from farms.”2
1.1.5 Deforestation & Decline of Biodiversity
We can see changes in land from space. NASA’s Earth Science Enterprise measures these changes to help understand the role human activity plays in them. Satellites produce thousands of images such as the one shown in Figure 1-6, which shows deforestation in the Tierras Bajas project. In the figure, the area east of Santa Cruz was originally dry tropical forest. As part of the project, people have been resettled from the Altiplano to cultivate soybeans. Each agricultural "pin wheel" pattern is centered on a small community. The communities are then spaced evenly across the landscape at 5-km intervals. Roadways can be seen connecting each town center. Species are being lost at a rapid rate due to loss of habitat and other land changes.
1-6: Digital Photograph of Deforestation Associated With the Tierras Bajas Project in Eastern Bolivia Taken by Astronauts From the International Space Station on April 16, 2001
According to Eco-Economy, “The productive capacity of the Earth’s forests is declining as they shrink by more than 9 million hectares (22.24 million acres) per year. Lumbering, land clearing for crop production or ranching, and firewood gathering are responsible. Healthy rainforests do not burn, but fragmented tropical rainforests can be weakened to where they are easily ignited by lightening.” 20
Another process called Eutrophication results when phosphates and nitrates in lakes and slow rivers lead to excess algal growth, killing fish and other animals and leaving unpleasant odors. This problem was overcome in industrialized countries by municipal wastewater cleaning and phosphate-free detergents, but now threatens Eastern Europe. We must consider what will become of all the chemicals we make and use. For example, nitrates in the air are also leading to excessive depositions on land in Central Europe, decreasing biodiversity.2

7
The Earth’s ecosystems provide services to us that have not traditionally been accounted for in our economic systems.22 A 1997 article in the magazine Nature valued the Earth’s ecosystem at $33 trillion worth of services per year compare to $43 trillion worth of goods and services provided by the global economy.23
1.1.6 Waste Generation
The story of New York City’s 11 million kg of garbage per day told above illustrates some of the practical problems of resource use that leads to waste generation. The same problem exists aboard the International Space Station, where the logistics of trash storage and disposal require careful planning, just like the stowage of new supplies. Waste that is hazardous to human health and/or the environment forms an important subset of this issue.
Each American generates 2 kg (4.5 lb) of solid waste per day24, the most garbage per capita in the world.25 In the United States, 28% is recovered and recycled or composted, 15% is burned at combustion facilities, and the remaining 57% is disposed of in landfills.14 The flow of materials disrupting the Earth’s surface is significant, according to the book Factor Four, which says that, “soil and water acidification may be due more to Earth movement than acid rain.” 26 This book shows the exponential growth in the use of many metals and points out that many tons of ore are mined for each ton of metal. A 1994 publication by Schmidt-Bleek calculates how many tons of materials are moved and processed to make different things.27 For example, they say that each “car involves 15 tons of solid waste, not counting the water that is used and polluted.” The 3 billion tons of coal burned each year carry “a rucksack of tailings and water weighing easily 15 thousand million tonnesnot to mention the 10 thousand million tonnes of CO2 that are released in the burning process.” 2
Texas has ranked first in the nation in total hazardous waste generated, due to the state's large size and industrial base. The EPA has a specific definition for hazardous waste.28
1.1.7 Ozone Depletion
The ozone layer is a concentration of ozone molecules in the stratosphere containing about 90% of the planet's ozone. Stratospheric ozone is a naturally occurring gas that filters the Sun's ultraviolet (UV) radiation, shielding the Earth's surface. Overexposure to UV rays can lead to skin cancer, cataracts, and weakened immune systems. Increased UV can also lead to reduced crop yield and disruptions in the marine food chain as well as other harmful effects.29
Ozone depletion, or the “hole in the ozone layer,” is caused by the release of chlorofluorocarbons (CFCs) and other ozone-depleting substances, which were used widely as refrigerants, insulating foams, and solvents. When CFCs reach the stratosphere, the UV radiation from the Sun causes them to break apart and release chlorine atoms that react with ozone, starting chemical cycles of ozone destruction. One chlorine atom can break apart more than 100,000 ozone molecules. Other chemicals that damage the ozone layer include methyl bromide (used as a pesticide), halons (used in fire extinguishers), and methyl chloroform (used as a solvent in industrial processes). As methyl bromide and halons are broken apart, they release bromine atoms, which are 40 times more destructive to ozone molecules than chlorine atoms. 30
The decrease of stratospheric ozone was first reported in 1974 and the decrease was quickly linked to the increasing presence of CFCs.31 The first comprehensive worldwide measurements started in 1978 with the Nimbus-7 satellite and NASA scientists at the Goddard Institute for Space Studies and elsewhere have been involved with the issue ever since.

8
The Montreal Protocol is an international agreement signed in the fall of 1987 to address the ozone issue.32 It has gone through a series of revisions as new information from science and industry has become available. The latest one, held in Copenhagen in November 1992, set the most stringent CFC phase-out schedule for CFCs for the world to date and was signed by over 100 nations representing 95% of the world's current CFC consumption. This protocol set a schedule for the phase-out of CFCs and related halocarbons by the year 2030. An additional impact of the protocol was to mandate the sharing of technology between countries in order to speed the replacement and recycling of CFCs.33
Detecting a problem with the Earth’s stratospheric ozone layer and subsequent global action to reverse the harmful trends could be counted as a story of failure or success. The problem was caused by widespread use of human-made chemicals such as CFC refrigerants without enough consideration or knowledge of environmental consequences. On the other hand, human technology helped identify the issue in 1985 and educate world leaders, who took action to restrict production of the problem chemicals.34 Then, once a decision was made to do something about it, technologists came up with alternative refrigerants in a short period. Although the ozone hole has not yet begun to repair itself, scientists predict that conditions may begin to improve in the next five years and that the hole could close within 50 years. NASA has played an important role in this important environmental issue of our day and will continue to monitor progress in this area (see Figure 1-7). 35
1.1.8 Climate Change (or “Global Warming”)
According to the National Academy of Sciences, the Earth's surface temperature has risen by about 0.56°C (1°F) in the past century, with accelerated warming during the past two decades (Figure 1-8). There is new and stronger evidence that most of the warming over the last 50 years is attributable to human activities. Human activities have altered the chemical composition of the atmosphere through the buildup of greenhouse gasesprimarily CO2, methane, and nitrous oxide. The heat-trapping property of these gases is undisputed, although uncertainties exist about exactly how Earth’s climate responds to them. The EPA has much more on greenhouse gases.36
“In the 20th century, human population quadrupled—from 1.6 billion to 6.1 billion, and CO2 emissions, which trap heat in the atmosphere, grew twelvefold—from 534 million metric tons in 1900 to 6.59 billion metric tons in 1997.1
1-8: Historic Global Temperature Change14
1-7: NASA Satellite Image of the Antarctic Hole in the Ozone Layer

9
In 1995, the 20% of the world's population living in countries with the highest per capita fossil-fuel CO2 emissions contributed 63% of the total global emissions. The 20% in the lowest-emission countries contributed just 2% of the total. The United States, with only 4.6% of the world's population, produces one fourth of global greenhouse gas emissions.” 37 Figure 1-9 shows different possibilities for global CO2 emissions (expressed as elemental carbon) for different assumptions about technology and population. The U.S. Energy Information Administration projects that U.S. carbon emissions will continue to increase from 1.56 billion to 2.24 billion metric tons between 2001 and 2025.38
In terms of concentration, atmospheric CO2
has increased from ~275 to ~370 parts per million (ppm). Unchecked, it will pass 550 ppm this century. Climate models and paleoclimate data indicate that 550 ppm, if sustained, could eventually produce global warming comparable in magnitude but opposite in sign to the global cooling of the last Ice Age.39
The Intergovernmental Panel on Climate Change estimates that the Earth's atmosphere will warm by as much as 5.8°C over the coming century, a rate unmatched over the past 10,000 years. The panel's "best estimate" scenario projects a sea-level rise of about half a meter by 2100.30
Dr. James Hansen of the Goddard Institute has studied climate change for many years. At the World Space Congress in Houston, Texas, in October 2002, he gave a talk in which he
discussed many of the complicated factors that are involved in global warming. He pointed out that natural changes in climate (long-term compared to “weather,” which indicates short-term changes in atmospheric conditions) have occurred in the past, such as ice ages, but that the human-induced effects are happening hundreds of times faster. He believes there is a 2 W/m2 forcing function due to greenhouse gases. Volcanic eruptions can cause a cooling function twice that large, but this is short-lived. He also described other important effects such as small temperature increases in the ocean and melting ice sheets, which might surprise us with relatively rapid rises in sea level compared to the several meters rise per hundred years at the end of an ice age. He believes that the best alternative to climate change is to hold CO2 constant and to reduce soot and methane. He believes this is feasible, stating that economic and fossil fuel growth have been decoupled since the 1970s and that it is in the best interest of China and India to limit fossil fuel use due to severe air pollution problems.40
According to an article in Science magazine,41 the United Nations Framework Convention on Climate Change aims to stabilize greenhouse gas concentrations at levels that avoid "dangerous anthropogenic interference with the climate system." Atmospheric CO2 stabilization targets as low as 450 ppm could be needed to forestall coral reef bleaching, thermohaline circulation (ocean currents) shutdown, and sea level rise from disintegration of the West Antarctic Ice Sheet. The article mentions a study that developed emission scenarios to stabilize atmospheric CO2 at 350, 450, 550, 650, or 750 ppm.
1-9: Scenarios for Carbon Emissions per Year Into the Atmosphere1
Billions of Metric Tons of Carbon Under Different Assumptions
10
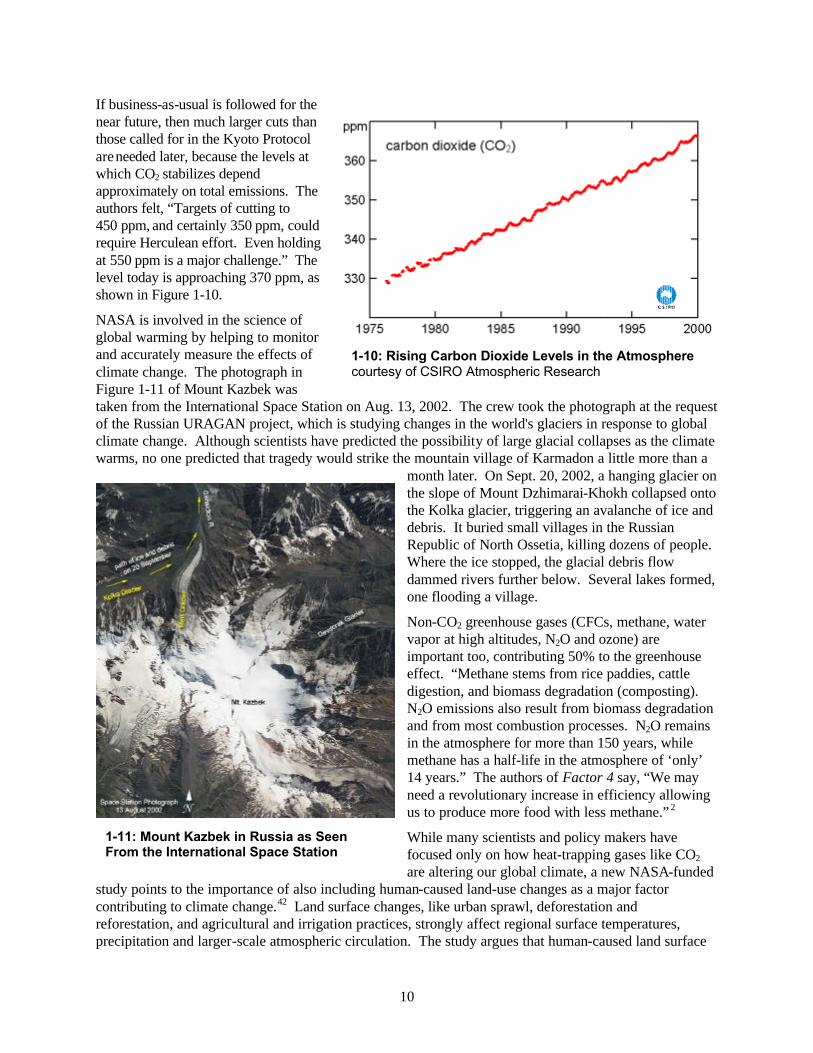
If business-as-usual is followed for the near future, then much larger cuts than those called for in the Kyoto Protocol are needed later, because the levels at which CO2 stabilizes depend
approximately on total emissions. The authors felt, “Targets of cutting to 450 ppm, and certainly 350 ppm, could require Herculean effort. Even holding
at 550 ppm is a major challenge.” The level today is approaching 370 ppm, as shown in Figure 1-10.
NASA is involved in the science of global warming by helping to monitor and accurately measure the effects of climate change. The photograph in Figure 1-11 of Mount Kazbek was taken from the International Space Station on Aug. 13, 2002. The crew took the photograph at the request of the Russian URAGAN project, which is studying changes in the world's glaciers in response to global climate change. Although scientists have predicted the possibility of large glacial collapses as the climate warms, no one predicted that tragedy would strike the mountain village of Karmadon a little more than a
month later. On Sept. 20, 2002, a hanging glacier on the slope of Mount Dzhimarai-Khokh collapsed onto the Kolka glacier, triggering an avalanche of ice and debris. It buried small villages in the Russian Republic of North Ossetia, killing dozens of people. Where the ice stopped, the glacial debris flow dammed rivers further below. Several lakes formed, one flooding a village.
Non-CO2 greenhouse gases (CFCs, methane, water vapor at high altitudes, N2O and ozone) are important too, contributing 50% to the greenhouse effect. “Methane stems from rice paddies, cattle digestion, and biomass degradation (composting). N2O emissions also result from biomass degradation and from most combustion processes. N2O remains in the atmosphere for more than 150 years, while methane has a half-life in the atmosphere of ‘only’ 14 years.” The authors of Factor 4 say, “We may need a revolutionary increase in efficiency allowing us to produce more food with less methane.” 2
While many scientists and policy makers have focused only on how heat-trapping gases like CO2 are altering our global climate, a new NASA-funded
study points to the importance of also including human-caused land-use changes as a major factor contributing to climate change.42 Land surface changes, like urban sprawl, deforestation and reforestation, and agricultural and irrigation practices, strongly affect regional surface temperatures, precipitation and larger-scale atmospheric circulation. The study argues that human-caused land surface
1-10: Rising Carbon Dioxide Levels in the Atmosphere courtesy of CSIRO Atmospheric Research
1-11: Mount Kazbek in Russia as Seen From the International Space Station

11
changes in places like North America, Europe, and southeast Asia redistribute heat regionally and globally within the atmosphere and may actually have a greater impact on climate than that due to anthropogenic greenhouse gases combined. "Our work suggests that the impacts of human-caused landcover changes on climate are at least as important, and quite possibly more important than those of carbon dioxide," said Roger Pielke, Sr., an atmospheric scientist at Colorado State University, Fort Collins, Colorado, and lead author of the study. "Through landcover changes over the last 300 years, we may have already altered the climate more than would occur associated with the radiative effect of a doubling of carbon dioxide." If CO2 emissions continue at current rates, atmospheric CO2 concentrations are expected to double by 2050. Land surface changes will also continue to occur. Types of land surface strongly influence how the Sun's energy is distributed back to the atmosphere. For example, if a rainforest is removed and replaced with crops, there is less transpiration, or evaporation of water from leaves. Less transpiration leads to warmer temperatures in that area. On the other hand, if farmland is irrigated, more water is transpired and also evaporated from moist soils, which cools and moistens the atmosphere, and can affect precipitation and cloudiness. Similarly, forests may influence the climate in more complicated ways than previously thought. For example, in regions with heavy snowfall, reforestation would cause the land to reflect less sunlight, and more heat would be absorbed, resulting in a net warming effect despite the removal of CO2 from the atmosphere through photosynthesis during the growing season. Further, reforestation could increase transpiration in an area, putting more water vapor in the air, and water vapor in the troposphere is the biggest contributor to greenhouse gas warming.
Many factors and complications are involved in the science of climate change, so there are great scientific debates as well as political ones. According to the American Petroleum Institute, greenhouse gases have been part of Earth's atmosphere since the planet formed.43 They point out that most of the 0.5°C rise in atmospheric temperatures occurred before 1945, which was before the post-World War II growth of CO2 emissions from human activities. They point out that “the science is incomplete and the experts do not agree on the key issues that will help us decide how to respond if our planet is warming.” However, more and more energy companies have begun to acknowledge the connection between human activities and climate change and BP even set a goal to reduce its own greenhouse gas emissions by 10% between 1990 and 2010.44
Biologists have also noticed the effects of global warming. An analysis presented in Nature magazine of 99 species in North America and Europe showed that the range of territory of wildlife such as birds, butterflies, and alpine herbs has shifted northward an average of 6.1 km per decade, or to higher altitudes by an average of 6.1 meters per decade, which the authors attributed to global warming.45
NASA’s Ice, Cloud and Land Elevation Satellite, shown in Figure 1-12,46 is the benchmark NASA mission for measuring ice-sheet mass balance. The mission, which launched in January 2003, will use a laser instrument to provide multiyear elevation data needed to determine ice-sheet mass balance. The spacecraft also will provide surface and vegetation data around the globe, in addition to specific coverage over the Greenland and Antarctic ice sheets. Among the questions the team wants to answer, are whether the Greenland and Antarctic ice sheets are growing or shrinking and how fast the sea level is rising?
1-12: NASA’s Ice, Cloud, and Land Elevation Satellite

12
1.1.9 Energy
Though not directly an environmental issue like air pollution or ozone depletion, energy deserves special mention because of the profound effect on our biosphere that society’s production and use of energy has. Human ability to harness energy sources to power innovative machines has led to great advances in productivity and standards of living. However, since the industrial revolution, people have noticed the effects of energy use on air pollution, natural waters, and more recently, the Earth’s climate. Not all energy sources are created equal and it is clear that our current energy use practices are not sustainable.
The production and use of energy causes more environmental damage than any other human activity, according to the Council on Environmental Quality. Emissions associated with fossil fuel combustion are linked to a variety of deadly lung diseases, including asthma, emphysema, and cancer. As a nation, we spend billions of dollars each year trying to control this pollution.47 Additionally, the United States pays more than $50 billion for imported oil each year.48
The energy flowchart in Figure 1-13 from Lawrence Livermore National Lab shows the relative size of primary energy sources and end uses in the United States. All fuels are compared on a common energy unit basis.49 Besides the message that the U.S. uses a huge amount of energy each year (98,500,000,000,000 BTUs [British thermal units] in 2000), the chart illustrates that only about 1/3 of the primary energy becomes useful energy. Therefore, a significant opportunity exists for technological (and other) improvements in energy use efficiency.
In a speech delivered to the Houston Forum, August 1, 2002, BP’s chief executive Lord Browne said, “the world has developed some 45% of the oil so far found and judged capable of commercial development and less than 30% of the natural gas.” This oil industry leader, who was the first in the industry to address climate change, still says that for “at least the next 30 to 50 years, energy means oil and natural gas.”50 On the other hand, world coal use has dropped 7% since peaking in 1996.51
"Recommendations for Achieving Sustainable Communities"the report of the 2nd National Conference on Science, Policy, and the Environmentcontains the recommendations of more than 550 scientists and decision makers.52 It says that “Energy production and use is presently one of the major contributors to humanity’s unsustainable course.” “Approximately 5 million children annually die from respiratory diseases frequently associated with exposure to indoor and outdoor air pollution, by airborne particulates, sulfur dioxide, and ozone. More than 3 million children annually die from waterborne diseases caused by ingesting contaminated water.” The report recommends, among other actions:
• “Increase research and development in renewable, low-emission and non-carbon fuel sources, including hydrogen.
• Maximize efforts to transfer sustainable energy technologies from the industrialized world to developing countries in a manner that is locally appropriate.
• Educate the public on the importance of more energy efficient lifestyles and less harmful, renewable energy sources.”
The federal government employees committee at the conference recommended, “Research should be undertaken to create mass balance models with an economic component.” The report also addresses the important role of remote sensing and satellites.
In its Annual Energy Outlook 2003 report, DOE's Energy Information Administration (EIA) projects that U.S. dependence on oil imports will grow over the next 22 years to between 65% and 70%. The report also indicates that residential energy consumption is expected to increase 26% by 2025. EIA projects that renewable energy use will grow at an average rate of 2.2% per year through 2025, "primarily due to state mandates for renewable electricity generation."53

13
1-13: Primary Energy Sources and End Uses in the United States
1.2 Sustainability
1.2.1 What Is Sustainability?
The concept of sustainability has been around for a long time, but the average person would probably struggle to come up with a definition. A commonly cited definition is:
Sustainability - Development that meets the needs of present generations without compromising the ability of future generations to meet their own needs.54
The U.S. Interagency Working Group on Sustainable Development Indicators divides sustainability into economic, social, and environmental.55 An additional category could be political. Thus, sustainability principles cut across several academic disciplines. These four areas are surely interrelated, but it is convenient to categorize them in this way. Environmental sustainability is the primary subject of this report. In particular, the role that technology can play in improving environmental sustainability is the focus.
In the short term, pollution and other human actions that damage our ecosystems are the most significant threats to sustainability. In the longer term, limited resources will surely become a problem as well. There is increasing interest and therefore an increase in published and Internet resources dealing with sustainability principles. Some of the major works that were consulted in preparing this document are described below.

14
Many recent and developing technologies from aerospace and other federal government research and development (R&D) efforts hold great promise for improving environmental sustainability. However, a word of warning against always picking the high-tech solution comes from the case study of Curitiba, Brazil, a city internationally recognized for its progress in sustainability. This city of over a million avoided an expensive subway system and a complex mechanical trash separation system, saving money and natural resources. One of their innovative programs that demonstrated appropriate technology selection in low-income areas was to pay people for garbage collection with bus tokens and food. Appropriate technology fits the circumstances of the people who use it.
1.2.2 Recent Studies
Factor Four: Doubling Wealth, Halving Resource Use,2 gives dozens of examples of individual efforts and corporate projects that have reduced energy and/or material resource use by a factor of four while maintaining the same productivity. The higher initial cost that was sometimes required was almost always recouped in less than 10 years and often within 2, thereafter creating a profit. I use these examples to promote the point that we can have more while using less if we simply take action to improve efficiency.
Some of the “factor 4” suggestions are:
• Super-refrigerators that use defrost sensors, vacuum insulation, and more efficient compressors
• Replacing incandescent lights with more efficient ones, such as fluorescent
• Laptop computers that consume many times less power than desktop computers
• Passive cooling systems
• “Hypercars” that are many times more efficient than today’s, yet use current technology
• “Superwindows” that drastically reduce heat gain and loss
Some other innovative sustainability strategies that were mentioned included Bremen-Hollerland, Germany trying a car-free zone and “parking cash out,” a program where employees are paid a certain amount of money for parking and then charged the same amount to park at work, thus giving them the incentive to carpool or bike to work and allowing the company to build fewer parking places. Another idea was to make laundromats, which are more resource-efficient than individual washing machines, more socially attractive by putting them in more inviting locations in an apartment complex. The “rent a chemical” concept allows a company to buy a service rather than a chemical and thus keeps the offering company responsible for the full life cycle of that chemical, leading to increased recycling.
Several policy and economic hindrances to improved efficiency are discussed. A call is issued to “level the playing field.” For example, they say, “Prices telling the truth should be uncompromisingly applied to the entire transport sector.” “According to a study by the World Resources Institute, the U.S. transport sector enjoys direct and indirect subsidies worth some $300 thousand million per year.”56
The authors do not favor many technical “supply side” solutions such as nuclear fission or fusion, sinking CO2 deep into the ocean, massive afforestation or space solar power. Instead they argue that “Efficiency can safely be called a no-regrets strategy” because it buys time. They also say their “goal is to make environmental policy a fundamentally profitable undertaking” so that emphasis on costly pollution control can decrease.
Gross national product, they say, is not a good measure of a country’s welfare so other measures should be used. For example, an automobile crash will cause gross national product to increase due to all the economic activity that ensues. One alternative measure is the index of sustainable economic welfare, which values non-material and informal sector wealth.57

15
The authors of Factor Four close with a sense of urgency, pointing out that there may be ecological “time bombs,” such as 50 years of acid rain in Big Moose Lake, New York, finally leading to a dive in pH that killed the lake around 1960. While some may argue that developing countries must be allowed to go through the resource-intensive growth patterns of developed countries to get to the same levels of prosperity, these authors counter that the Earth’s carrying capacity is not that great and thus their (and our) only hope is this revolution in resource efficiency.
The “Factor Ten Club” is a group of prominent environmentalists that goes further and says, “Sustainable levels of materials flows will not be reached unless and until the material intensity of the OECD1 countries is reduced by a factor of ten.”
In another recent book on sustainability, Eco-Economy: Building an Economy for the Earth, the author and founder of the Worldwatch Institute, Lester Brown, makes a case for a revolution in our thinking as big as Copernicus’ notion that the Earth revolved around the Sun.3 He outlines a dire (declining) state of the planet in contrast to the sevenfold expansion of the global economy since 1950. Major rivers no longer reach the oceans, rainforests are burning, and “50% of the world’s rangeland is overgrazed and deteriorating into desert.” Several examples are given of the staggering economic costs that have resulted when humans have over-stressed their ecosystems. He reports that, “over the last 35 years, the ice covering the Arctic Sea has thinned by 42%” and points out that “the cost of dealing with rising sea level from a modest temperature rise could easily overwhelm the economies of many countries.”
Brown says that economists and ecologists see the world differently, but that they are coming closer together and that “working together (they) can design and build an eco-economy, one that can sustain progress.” He lists some positive signs as:
• The knowledge we now have that North Dakota, Kansas, and Texas have enough useable wind energy to satisfy national electric needs.
• Denmark has banned the construction of coal-fired power plants and non-refillable beverage containers.
• Shell Hydrogen and Daimler Chrysler are working with Iceland to make it the world’s first hydrogen-powered economy.
• Major corporations are committed to comprehensive recycling, to closing the loop in the materials economy.
In the eco-economy, recycling industries largely replace extraction industries and “taxes designed to incorporate into their prices the environmental costs of producing goods or providing services enable the market to send the right signal.” 58 Subsidies can be used to promote such things as clean energy sources.59 Eco-labeling and tradable permits are also effective tools in the eco-economy.
In Cool Companies, Joseph Romm describes how many businesses are using energy efficiency and “decarbonization” or “cool power” sources to make a profit. The author points out that “pollutant emissions have a market value (about $100/ton for sulfur, and in some places, more than $1000/ton for NOx).” 60
The Natural Step for Business describes how four successful companies have learned to integrate sustainable development into their business strategies. Using these examples, the authors show how companies can use The Natural Step framework to succeed financially and with a “higher purpose.” 61
1 OECD is the Organization for Economic Cooperation and Development
16
1.2.3 Economic Considerations
Rather than attempt to delve into the economic considerations that are interrelated to sustainable development, and thereby risk doubling the length of this report, I will simply acknowledge its importance and direct the reader elsewhere for more information.3,62 Several of the sources mentioned above consider both positive and negative market forces affecting sustainability. The focus of this report is technical; nevertheless, important social and economic factors cannot be ignored. Therefore, a few salient points are mentioned here, but a full discussion is beyond the scope and intent of this document.
Economics provides the balance of cost vs. benefit. Productivity is the key to our standard of living. Sometimes those with fewer natural resources actually develop faster since, as the saying goes, necessity is the mother of invention.63 It is always difficult to predict the future. Nonrenewable energy sources have often gotten cheaper, for example, due to innovation, so you can’t always extrapolate price trends. It is also hard to predict how much a particular society will value their natural environment as part of their quality of life. Market economics do not account for this, nor even for the tangible cost of pollution that is “socialized” when others pay a price for its effects. Various groups have tried to quantify the benefits of ecosystems.64 Consideration of “externalities” is one way that society can correct market failure. One of the most effective ways to do this has been to determine the “most efficient level of pollution,” cap it, and set up a trading system.60
Various countries and states are considering several other mechanisms to introduce externalities into the market. Government regulation has been the historical approach to environmental protection, but this may be changing. “Taxes designed to incorporate in their prices the environmental costs of producing goods or providing services enable the market to send the right signal. They discourage such activities as coal burning, the use of throwaway beverage containers, or cyanide gold mining. Subsidies can be used to encourage such activities as planting trees, using water more efficiently, or harnessing wind energy. Environmental taxes and subsidies also can be used to represent the interests of future generations in situations where traditional economics simply discounts the future.” 58 Eco-Economy cites wind energy as an “excellent example of how a modest subsidy can launch a new industry.” He also says tradable permits for pollution work well.59 Ecolabeling, such as “green electricity,” to let people know how their products were obtained can also be used to let consumers make a difference with their purchases.
A November 2002 study by the Perryman Group projected costs to the State of Texas if the State Implementation Plan to improve air quality was not funded ($188 million/yr). The costs in terms of health care, lost productivity, restricted economic growth, and lost federal highway funds (as a penalty for non-attainment) were estimated between $24 billion and $36 billion over 10 years.65
Alternatives to gross domestic product as a measure of economic success have been developed. One such measure is the index of sustainable economic welfare. To get a more complete picture of what constitutes economic progress, the index of sustainable economic welfare subtracts from the gross domestic product corrections for harmful bases or consequences of economic activity and adds to the corrections for significant activities such as unpaid domestic labor. The organization Friends of the Earth tells more about this method.66
Here is one final thought on the economics of sustainability. Many are hopeful that our transition to an environmentally sustainable future can be skillfully crafted to yield financial rewards in addition to quality of life rewards. One example of that optimism is the creation of the Chicago Climate Exchange67, a voluntary cap-and-trade program for reducing and trading greenhouse gas emissions.
1.3 The Future In 2002 Japan completed the Earth Simulator, a super computer that can perform detailed simulations projecting the behavior of our ecosystems way into the future.68 NASA continues to study the Earth from the vantage point of space, leading to better understanding of our home planet every day. Increased
17
knowledge and awareness should help us achieve environmental sustainability more quickly and efficiently in the future.
The United States has already seen positive actions and trends since the first Earth Day in 1970.69 Action taken by citizens and government leaders at that time led to creation of the EPA and cornerstone U.S. environmental legislation. Since 1990, the number of Americans breathing unhealthy levels of ozone dropped by 43 million. Oil spills in the nation's waters declined from 22 million gallons per year in the mid-1970s to 2 million gallons in 1992. Drinking-water safety standards help prevent an estimated 200,000 to 470,000 cases of gastrointestinal illness per year. Consequently, the United States ranks about 50 out of 150 countries in the world based on the Environmental Sustainability Index.70 As in the beginning, maintaining and improving this status requires action.
There are many positive signs. For example, “more than one-third of the raw material fiber U.S. papermakers use comes from recycled paper. More paper is now recovered in America than is landfilled. The paper recovered for recycling in the last 10 years would fill more than 3.5 square miles of landfill space packed 50 feet high.” 71
Sustainability studies agree that our future energy supply must be hydrogen-based rather than carbon-based and that energy is a key issue. Besides energy, cities and spacecraft both require a concentration of materialssupplies flow in and waste flows outat least that is the way it is today. In the future, however, we will learn to “close the loop” more and more and recycle our waste into new resources.
2 Ongoing Environmental Sustainability Efforts 2.1 International United Nations The definition of sustainability given in section 1.2.1 is from the 1987 Bruntland report, resulting from the UN-sponsored World Commission on Environment and Development. Five years later, at the UN-sponsored 1992 Earth Summit in Rio de Janeiro, global leaders and representatives developed a thorough and broad-ranging program of action, commonly referred to as Agenda 21. This plan demanded new ways of investing in the future to reach global sustainable development while minimizing impact on global natural resources.72 Most recently, the World Summit on Sustainable Development, held in Johannesburg in September 2002, reviewed progress in implementing Agenda 21.73 “Global Challenge, Global Opportunity: Trends in Sustainable Development” was an important document prepared for the summit.
The UN sustainable development page has additional information on UN sustainability initiatives.74 The UN Environment Program also has a great deal of valuable information, including a section on energy.75 Several departments of the U.S. government are participating in international efforts such as “Global Village for Energy Development,” “Energy Efficiency for Sustainable Development,” and “Healthy Homes and Communities for Children.” 76 NASA could also contribute to these efforts with its expertise.
2.2 Federal Government The Federal Network for Sustainability77 promotes cost-effective, energy- and resource-efficient operations across all branches of government. NASA is one of 12 member agencies whose sustainability programs are described through links on their Web site. Through individual initiatives and joint ventures, the group strives to better our understanding of the interrelationship between energy use, economics, and environmental impact. By leadership and example, they intend to educate and guide others in reducing federal expenditures, while simultaneously advancing the principles of sustainability throughout the public and the private sectors.
18
2.2.1 Environmental Protection Agency
EPA's mission is to protect human health and to safeguard the natural environmentair, water, and land—upon which life depends. The agency maintains extensive Web-based resources, which aid this mission.78 EPA was formed in July 1970, when the White House and Congress worked together to establish the agency in response to the growing public demand for cleaner water, air, and land. EPA was assigned the task of repairing the damage already done to the natural environment and to establish new criteria to guide Americans in making a cleaner environment a reality.
While most EPA functions are related to sustainability, several facilities and programs are directly related to the use of technology to improve sustainability. These are described below.
2.2.1.1 Research & Technology Efforts
EPA research facilities and programs include:
• Clean Air Technology Center79
• Office of Research and Development80 (513) 569-7562
• Center for Environmental Industry and Technology81 This center offers a program that matches anyone seeking new environmental technologies with over 900 providers of innovative environmental technologies, pollution prevention techniques, and environmental management systems.
Other EPA laboratories and offices are listed at http://www.epa.gov/epahrist/located.htm.
EPA's Environmental Technology Verification (ETV) Program develops testing protocols and verifies the performance of innovative technologies to problems that threaten human health or the environment. The EPA has tested and verified dozens of technologies since 1995 (see next page). Descriptions of these plus additional technologies under evaluation are listed on their Web site.82
2.2.1.2 Energy Star
One very successful initiative of the EPA is the Energy Star program.83 This program rewards manufacturers with the Energy Star label when they demonstrate significant energy savings over other products currently on the market. Listed products include appliances, lighting, electronics, other office equipment, heating and cooling equipment, and building materials. These products may be sought out when making personal or government purchases. In many cases, affirmative procurement regulations require the purchase of Energy Star products for federal acquisitions.
2.2.1.3 Labs 21
EPA and DOE jointly operate a program called Labs 21,84 a voluntary program dedicated to improving the environmental performance of U.S. laboratories. Labs 21 is designed to improve laboratory energy and water efficiency, encourage the use of renewable energy sources, and promote environmental stewardship through the exchange of information between public and private laboratory operators. For example, fume hoods draw large amounts of conditioned air and energy dollars out of a facility. Labs 21 participants learn about new equipment that can safely reduce this waste.

19
ETV Advanced Monitoring Systems Center
Advanced Monitoring Systems - Air
Ambient Fine Particulate Monitors
Mercury Continuous Emission Monitors
NO/NOx Portable Analyzers
Optical Open-Path Monitors Advanced Monitoring Systems - Water
Portable Water Analyzers/Test Kits
Turbidimeters Site Characterization and Monitoring Technologies Pilot
Decision Support Software
Gas Chromatographs (Field Portable)
Gas Chromatographs/Mass Spectrometers (Field Portable)
Ground Water Sampling Devices
Immunoassay Test Kits/Immunosensors
Infrared Monitors (Field Portable)
Ion Mobility Spectrometers
Ion Selective Electrodes
Laser Induced Fluorescence Sensors
Sediment Sampling Technologies
Soil/Soil Gas Sampling Technologies
X-Ray Fluorescence Analyzers (Field Portable) ETV Air Pollution Control Technology Center
Add-on NOx Control Devices
Baghouse Filtration Products
Emulsified Fuels
Paint Overspray Arrestors ETV EvTEC Pilot
Erosion Control Technologies
Wastewater Treatment Technology

20
ETV Drinking Water Systems Center
Backwashable Depth Filtration - Filtration for Microbiological Removal
Cartridge/Bag Filter Elements
Coagulation and Filtration Technologies for Arsenic Removal
Enhanced Coagulation - Filtration for Microbiological Removal
Microfiltration - Filtration for Microbiological Removal
Nanofiltration - Filtration for Removal of Disinfection By-Product Precursors
On-Site Halogen Generation - Microbiological Inactivation
Ozone/Advanced Oxidation - Microbiological Inactivation and SOC Removal
Pentalodide Resin for Microbiological Inactivation
Reverse Osmosis Technologies for Arsenic Removal
Ultrafiltration - Filtration for Microbiological Removal
Ultrafiltration With Enhanced Coagulation - Filtration for Microbiological Removal
Ultraviolet Radiation - Microbiological Inactivation and Disinfection ETV P2, Recycling, and Waste Treatment Center
P2 Innovative Coatings and Coating Equipment Pilot
High-Volume Low-Pressure Spray Guns
Laser Targeted Paint Application P2 Metal Finishing Technologies Pilot
Aqueous Cleaner Maintenance Solution
Chromate Conversion Coating Solution Maintenance
Water Use Reduction/Recycling P2, Recycling and Waste Treatment Systems Pilot
Aerosol Can Recycling Systems
Aqueous Circuit Board Cleaners
Computerized Ion Exchange Regeneration Processes
Rechargeable Alkaline Batteries
Vegetable Oil Transformer Fluids ETV Indoor Air Products Pilot
Commercial Furniture
Ventilation Air Filters

21
ETV Greenhouse Gas Technology Center
Air/Fuel Ratio Controllers
Diesel Fuel Use Technologies
Fuel Cells
Microturbines and Microturbine Combined Heat and Power Systems
Monitoring Systems
Natural Gas Compressor Leak Mitigation
Pressure Relief Valves
2.2.2 Department of Energy
2.2.2.1 Overview of Sustainability Programs
Some of the helpful DOE programs dealing with sustainability are:
Center of Excellence for Sustainable Development – Community Energy - Sustainable development is a strategy by which communities seek economic development approaches that also benefit the local environment and quality of life. This Web site provides valuable resources on a variety of sustainable development issues, including community energy, codes and ordinances, public involvement, and a wide variety of locally based resources.
Clean Cities - The Clean Cities Program, sponsored by DOE, supports public-private partnerships that deploy alternative fuel vehicles and build supporting infrastructure. This site provides information on starting a local alternative fuel vehicles program, participating communities, and available funding and assistance resources.
BestPractices - BestPractices, sponsored by DOE, works with industry to identify industrial plant-wide opportunities for energy savings and process efficiency. Here, you’ll find resources on compressed air, motors, process heating, and steam systems, plus helpful tools and publications, success stories, training opportunities, and other resources.
Consumer Guide for Renewable Energy for Your Home or Business - Learn about renewable energy systems and determine if one may be right for you. Here you’ll find information connecting to the electric grid, sizing energy system, different technologies, and available incentives.
The Database of State Incentives for Renewable Energy - The Database of State Incentives for Renewable Energy is a comprehensive source of information on state, local, and utility incentives that promote renewable energy.
2.2.2.2 Office of Energy Efficiency and Renewable Energy
DOE’s Office of Energy Efficiency and Renewable Energy85 is attempting to revolutionize how we approach energy efficiency and renewable energy technologies, while pursuing the recommendations of the President's National Energy Policy. To meet this challenge, they intend to leapfrog the status quo and pursue dramatic environmental benefits. To accomplish this, the office has 11 programs:
• Biomass Program
• Building Technologies Program
• Distributed Energy & Electricity Reliability Program

22
• Federal Energy Management Program
• FreedomCAR & Vehicle Technologies Program
• Geothermal Technologies Program
• Hydrogen, Fuel Cells & Infrastructure Technologies Program
• Industrial Technologies Program
• Solar Energy Technology Program
• Wind & Hydropower Technologies Program
• Weatherization & Intergovernmental Program
Among other activities, Sandia National Laboratory86 and the National Renewable Energy Laboratory (NREL)87 help develop environmental and international markets for renewable energy. Together with EPA, the International Co-Control Benefits Analysis Program supports and promotes the analysis of public health and environmental benefits of integrated strategies for greenhouse gas mitigation and local environmental improvement in developing countries.88 NREL also has a map portfolio for the wind resource that includes parts of Argentina, Chile, China, Indonesia, Mexico, and the Philippines. Advanced solar resource maps are being generated for India, the Middle East, Mexico, and the Caribbean. By combining recent advances in satellite technology with satellite imagery from NASA/Langley, NREL will soon be able to produce worldwide solar resource maps with much greater local detail. NREL has also put sustainability into practice at their facilities.89
2.2.2.3 Federal Energy Management Program (FEMP)
FEMP is one of the 11 programs in the Office of Energy Efficiency and Renewable Energy that is focused on federal facilities. The Energy Policy Act of 1992, recent Executive Orders, and Presidential Directives all require federal agencies to reduce their energy use by 35% by 2010 in comparison to 1985 levels. The President's National Energy Policy calls for America to modernize conservation efforts, increase energy supplies, “accelerate the protection and improvement of the environment, and increase our nation's energy security.”90 The President also directs heads of executive departments and agencies to "take appropriate actions to conserve energy use at their facilities to the maximum extent consistent with the effective discharge of public responsibilities." 91 The government is making considerable progress in this effort. Despite energy bills that total approximately $4 billion annually for federal buildings and other facilities, the government's building-related energy costs have actually dropped more than 20% per square foot since 1985, thanks in large part to the work of FEMP.” 92
Generally, each dollar invested in energy efficiency results in a savings of $4 over a project's life. Potential energy-efficiency projects are an untapped economic resource and federal facilities comprise vast resource fields for job-creating economic activity in the construction, engineering, manufacturing, and financing industries.” 79
FEMP offers several services to NASA and other federal agencies. The SAVEnergy Audit Program helps identify cost-effective energy- and water-efficiency measures, screens for renewable energy opportunities, and makes operations and maintenance recommendations.93
Federal Industrial Facilities Assessments target energy savings in steam, compressed air, and pumping systems at industrial facilities.94
Once a year, agencies can also submit proposals for technical assistance from DOE lab personnel for energy-related projects.95

23
Another resource FEMP offers is advice on buying energy-efficient products. This can be found on their Web site at www.eren.doe.gov/femp/procurement.
2.2.3 Presidential Executive Orders and Legislation
Several Executive Orders promote environmental sustainability principles. These are listed in Table 2.1 along with a brief description of each. In addition, the National Energy Policy Act (May 17, 2001) directs the development of a long-term energy strategy, advancement of environmentally friendly technologies and integration of environmental and economic policies.
Table 2.1: Executive Orders Dealing With Sustainability
Number Short Title Description
13101 Waste Prevention (1998)
Established a Steering Committee on Greening the Government through Waste Prevention and Recycling. Each executive agency shall incorporate waste prevention and recycling in the agency's daily operations and acquire and use environmentally preferable products whenever feasible. Each agency shall establish either a goal for solid waste prevention and affirmative procurement.
13123 Energy Efficiency (1999)
Set goals for greenhouse gases reduction, energy efficiency improvement, industrial and laboratory facilities, renewable energy, petroleum reduction, total energy use at the source and water conservation. Reduce greenhouse gas emissions by 30% by 2010 compared to 1990. Reduce BTU/GSF (gross square feet) by 30% by 2005 and 35% by 2010 relative to 1985. Reduce lab energy consumption by 20% (2005) and 25% (2010) relative to 1990. Install 2,000 solar energy systems at federal facilities by the end of 2000, and 20,000 by 2010.
13134 Biobased Products and Bioenergy (1999)
Established a council on bio-based products and bio-energy.
13148 Environmental Leadership (2000)
Environmental management required for all agencies. Reduce toxic chemical disposal by 10% annually, or by 40% overall by December 31, 2006 (50% for selected chemicals). Phase out the procurement of Class I ozone-depleting substances for all non-excepted uses by December 31, 2010. Promote environmentally and economically beneficial landscaping. Each agency is encouraged to establish a local outreach process related to Greening the Government.
13149 Fleet and Transportation Efficiency (2000)
Reduce vehicle fleet's annual petroleum consumption by at least 20% by the end of fiscal year (FY) 2005, compared with FY99 petroleum consumption levels (including government owned contractor vehicles).
13150 Federal Workforce Transportation (2000)
Incentives for federal employees to use mass transit.
13211 Energy Supply, Distri-bution or Use (2001)
Requires agencies to submit a statement of energy effects when undertaking certain agency actions.
13212 Expedite Energy-Related Projects (2001)
Established a task force chaired by the Council on Environmental Quality and housed at the DOE to expedite projects that will increase the production, transmission, or conservation of energy.
13221 Standby Power Devices (2001)
Purchased products may use no more than 1 watt in their standby power mode.
May 3, 2001 Presidential Directive
Requires federal agencies to take immediate steps to conserve energy and reduce peak load and calls on federal agencies to set an example of energy conservation for the rest of the country.

24
More information is available at http://www.eren.doe.gov/femp/resources/presidential_direct.html. Various laws also affect sustainability efforts. One of these is the Biomass Research and Development Act of 2000, which seeks to promote greater use of bio-based fuels and chemicals for “improved strategic security and balance of payments, healthier rural economies and improved environmental quality” among other benefits.96
2.2.4 NASA
NASA recently adopted the mission statement:
To understand and protect our home planet
To explore the Universe and search for life
To inspire the next generation of explorers
NASA has already taken steps to improve the long-term sustainability of its operations but many more opportunities exist. For years, NASA centers have worked to meet the Executive Orders and laws mentioned above. Recently, sustainability training began at headquarters and is planned for construction personnel at the field centers. On May 8, 2003, EPA recognized NASA as the first federal agency to directly use landfill gas to produce energy at one of its facilitiesthe Goddard Space Flight Center, located in Greenbelt, Maryland.97 Other efforts related to environmental sustainability at different levels within NASA are described below.
2.2.4.1 Earth Science Enterprise
NASA's Earth Science Enterprise is dedicated to understanding the total Earth system and the effects of natural and human-induced changes on the global environment, and to improving the planet through research, education, and cooperation. The vantage point of space provides information about Earth's land, atmosphere, ice, oceans, and biota that is obtainable in no other way. Programs of the Enterprise study the interactions among these components to advance the new discipline of Earth System Science, with a near-term emphasis on global climate change. Research results contribute to the development of sound environmental policy and economic investment decisions.98
The Earth System Science and Applications Advisory Committee advises and makes recommendations to the NASA Administrator and the NASA Advisory Council on the full scope of Earth Science strategic goals and objectives. Agency programs for Earth Systems Science, applications, technology development, commercialization, and education are affected by these recommendations. The Committee meets twice yearly, and the plans and proceedings are published.99
The Enterprise interacts with universities, industries, and government agencies, providing Earth science data and information products to help them better perform essential services, such as weather forecasting, seasonal climate prediction, aviation safety, agricultural assessment, and infrastructure planning. These entities use the innovative remote sensing technologies that the Earth Science Enterprise develops to solve problems with food production, natural hazards, and water and other natural resources, among others. Facilities such as the Laboratory for Terrestrial Physics100 at NASA's Goddard Space Flight Center provide invaluable information about our planet by studying the physics and dynamics of the Earth, other planets, and their satellites, using technologies like laser remote sensing and performing global- and regional-scale vegetation monitoring.
Aside from helping others help the Earth, the NASA Earth Science Enterprise strives to share its discoveries with the public to enhance science, mathematics, and technology education and increase the scientific and technological literacy of all Americans. Earth Science combines the excitement of scientific discovery with the reward of practical contribution to the sustainability of planet Earth. It provides research opportunities to aspiring scientists and technologists in a wide range of possibilities.

25
For example, Jet Propulsion Laboratory (at the California Institute of Technology) and The University of Texas (UT) at Austin101 created the Topex/Poseidon102 project, an Earth-observing satellite that provides global sea-level measurements with unprecedented accuracy. The satellite project was planned for 3 years of operation, and supplied for 5 years of life, but is still running after 10 years.
The NASA Earth Science Enterprise also works within the federal government to enhance tax dollars’ effectiveness in a wide variety of ways. The Enterprise works on:
• Enhanced weather predication for Energy Forecasting (DOE, EPA)
• Weather/climate prediction for Agriculture Efficiency (USDA, DOE)
• Carbon sequestration assessment for Carbon Management (USDA, DOE)
• Digital atmosphere and terrain for Aviation Safety for Transportation (DOT/FAA)
• Early warning systems for air and water quality for Homeland Security (OHS, NIMA, USGS)
• Environmental indicators for Community Growth Management (EPA, USGS, NSGIC)
• Integrated hurricane and flooding prediction for Disaster Preparedness (FEMA, NOAA)
• Early warning systems for vector-borne infectious diseases for Public Health (NIH, CDC)
• Environmental indicators for Coastal Management (NOAA)
• Environmental models for Biological Invasive Species (USGS, USDA)
• Water cycle science for Water Management and Conservation (EPA, USDA)
• Regional to national to international atmospheric measurements and predictions for Air Quality Management (EPA, NOAA)
Another example of NASA applying Earth observations to improve environmental sustainability is NASA technology helping state and federal governments reclaim 15,100 acres of salt evaporation ponds in South San Francisco Bay in one of the nation's largest restoration projects. A small group of NASA scientists and technicians is studying salt evaporation ponds by using sensors on satellites and airplanes in addition to surface sampling, to learn how restoring the ponds to nearly their natural state may affect local ecology.103
2.2.4.2 Advanced Life Support and Commercial Centers
NASA's Office of Biological and Physical Research conducts interdisciplinary, peer-reviewed, fundamental and applied research to address the opportunities and challenges to NASA that the space environment and the human exploration of space provide. Part of this research is the Advanced Life Support Program.104
Research on human life support began in the 1950s with oxygen regeneration using algae. NASA's interest in such systems became more focused in the late 1970s in order to support long-term space missions. Since that time, the Advanced Life Support Program at NASA has examined growing plants for food and oxygen regeneration, and using physico-chemical and biological methods to process waste into usable resources. JSC has completed a number of closed-chamber tests in which human test subjects were included to determine the efficiency, reliability, and effectiveness of regenerative systems for long-duration
2-1: Closed Chamber Testing at JSC Using Machines and Plants to Recycle Water and Air

26
missions (Figure 2-1).104 As part of the advanced life support research, NASA sponsors university research and two Commercial Space Technology Centers, which promote commercialization of NASA technology. The same technology that helps humans extend our presence into space may help solve some of the key environmental sustainability issues described above.
The Environmental Systems Commercial Space Technology Center is housed at the University of Florida in Gainesville, Florida. The purpose of the center is to develop technologies for use in long-duration human spaceflight, while at the same time serving as a catalyst for current, “real-life,” commercial application of the technologies developed.105
The NASA Food Technology Commercial Space Center is located at Iowa State University in Ames, Iowa. The center’s purpose is to develop new processes and products that will permit astronauts to feed themselves with a combination of foods prepared on Earth and food products from crops produced in space by engaging the food industry and academia to develop these food systems.106
2.2.4.3 Headquarters Environmental Office
While NASA’s Earth Science Enterprise is dedicated to helping understand the Earth and its environment, it is the job of the Headquarters Office of Environmental Management, a unit of the Office of the Assistant Administrator for Management Systems,107 and the various NASA centers to ensure compliance with U.S. laws and regulations designed to protect that environment. There are also many restoration and remediation sites throughout the agency that are managed by these Environmental Offices.
The Environmental Management Division serves as agency lead in ensuring that NASA meets its federal stewardship responsibilities by applying principles of sustainability while carrying out its primary mission of understanding and protecting our home planet, exploring the Universe and searching for life, and inspiring the next generation of explorers.108 It also communicates with the Office of the Federal Environmental Executive.109 A 2001 report by the Environmental Management Division summarizes other agencies building efforts and describes sustainable design practices for NASA.110
2.2.4.4 JSC Environmental Office
The JSC Environmental Office spends most of its time and focus on compliance with EPA and TCEQ (the Texas Commission on Environmental Quality, formerly known as the Texas Natural Resource Conservation Commission) rules and with Federal Executive Orders (see section 2.2.3). The Environmental Office, along with the JSC Energy Manager, is responsible for implementing NASA Policy Directives and NASA Procedures and Guidelines related to environmental issues.111 Table 2.2 lists the primary responsibilities of the Office. Historically, the professional civil servant staff has been 4, with contractor support.
Air emission regulations address SO2, NOx and particulates released on site. Some permits and fees are required for these emissions. Under the recently developed “Mass Emissions Cap and Trade” program that is part of the Texas State Implementation Plan to address non-attainment of federal air quality standards in the Houston area, JSC has received certification for a level of activity consistent with 1997–1999 operations for NOx emissions. The vast majority of fuel consumed in these boilers is natural gas with a little bit of diesel oil during backup operations. The dozens of stationary and portable diesel generators on site are exempt due to the fact that they are operated only temporarily for backup power generation.
The Environmental Office monitors municipal and hazardous waste disposal. JSC’s largest hazardous waste stream now comes from metal finishing and cleaning since a photo waste processing system was installed a few years ago. Detailed pollution prevention and waste reduction goals can be found in site-specific plans for JSC main site and auxiliary facilities.112
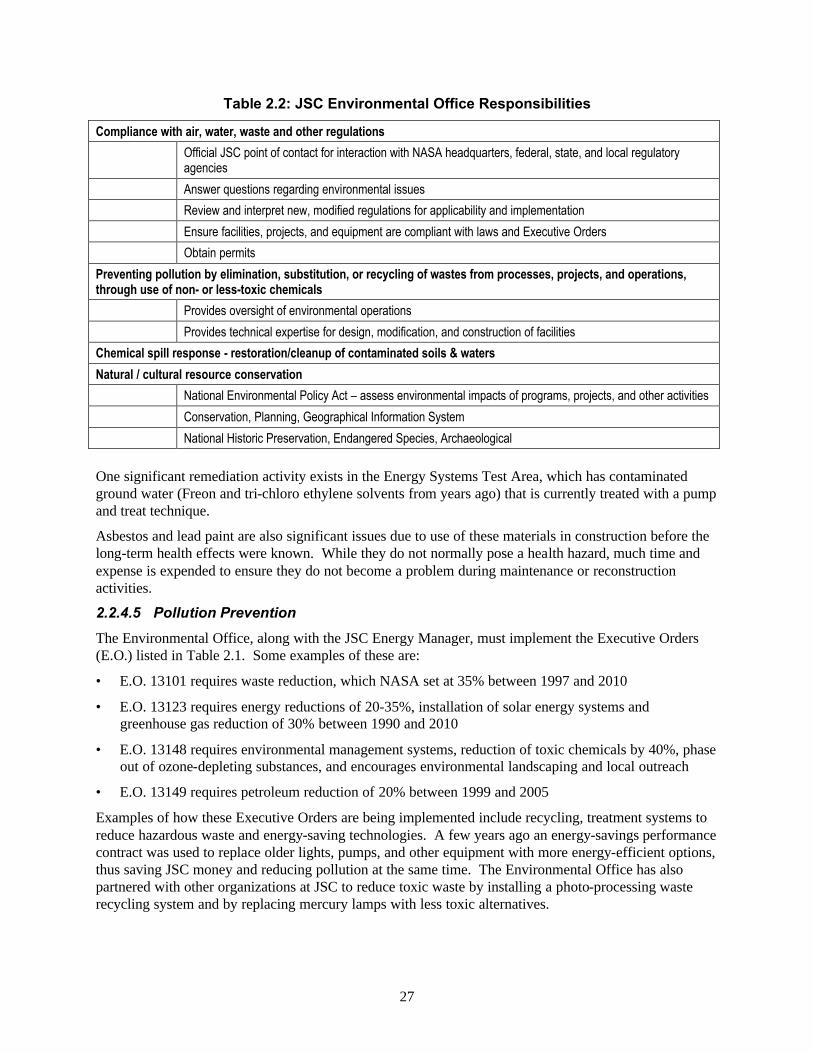
27
Table 2.2: JSC Environmental Office Responsibilities
Compliance with air, water, waste and other regulations
Official JSC point of contact for interaction with NASA headquarters, federal, state, and local regulatory agencies
Answer questions regarding environmental issues
Review and interpret new, modified regulations for applicability and implementation
Ensure facilities, projects, and equipment are compliant with laws and Executive Orders
Obtain permits
Preventing pollution by elimination, substitution, or recycling of wastes from processes, projects, and operations, through use of non- or less-toxic chemicals
Provides oversight of environmental operations
Provides technical expertise for design, modification, and construction of facilities
Chemical spill response - restoration/cleanup of contaminated soils & waters
Natural / cultural resource conservation
National Environmental Policy Act – assess environmental impacts of programs, projects, and other activities
Conservation, Planning, Geographical Information System
National Historic Preservation, Endangered Species, Archaeological
One significant remediation activity exists in the Energy Systems Test Area, which has contaminated ground water (Freon and tri-chloro ethylene solvents from years ago) that is currently treated with a pump and treat technique.
Asbestos and lead paint are also significant issues due to use of these materials in construction before the long-term health effects were known. While they do not normally pose a health hazard, much time and expense is expended to ensure they do not become a problem during maintenance or reconstruction activities.
2.2.4.5 Pollution Prevention
The Environmental Office, along with the JSC Energy Manager, must implement the Executive Orders (E.O.) listed in Table 2.1. Some examples of these are:
• E.O. 13101 requires waste reduction, which NASA set at 35% between 1997 and 2010
• E.O. 13123 requires energy reductions of 20-35%, installation of solar energy systems and greenhouse gas reduction of 30% between 1990 and 2010
• E.O. 13148 requires environmental management systems, reduction of toxic chemicals by 40%, phase out of ozone-depleting substances, and encourages environmental landscaping and local outreach
• E.O. 13149 requires petroleum reduction of 20% between 1999 and 2005
Examples of how these Executive Orders are being implemented include recycling, treatment systems to reduce hazardous waste and energy-saving technologies. A few years ago an energy-savings performance contract was used to replace older lights, pumps, and other equipment with more energy-efficient options, thus saving JSC money and reducing pollution at the same time. The Environmental Office has also partnered with other organizations at JSC to reduce toxic waste by installing a photo-processing waste recycling system and by replacing mercury lamps with less toxic alternatives.

28
2.2.4.6 Affirmative Procurement
E.O. 13101 requires that all federal agencies have a program in place to promote the purchase of environmentally preferable products and services. This is known as affirmative procurement. The main element of the requirement is to purchase items containing recycled content. EPA lists environmentally preferred products at http://www.epa.gov/oppt/epp/. Green product reviews can also be found at: http://www.buildinggreen.com/products/productslist.html.
Each year, NASA headquarters issues an annual data call to all centers requiring them to report purchase of items on the EPA's list. NASA then submits an agency-wide report to the Office of Federal Environmental Executive. The report is mandatory and each center is audited for compliance. In an effort to assist site users in understanding the regulations, policies, and data calls, the Environmental Office provides awareness sessions.
2.2.4.7 Construction and Maintenance
The Facilities Engineering Division at NASA headquarters and similarly named organizations at the field centers ensure that NASA has the facilities available that are necessary to meet NASA’s mission, that are safe and environmentally sound, are of the right type and size, and are affordable. A recent NASA policy directive states, “Facility projects planned, designed, and constructed under Agency authority or control will incorporate sustainable design principles to the maximum extent possible…” As this policy is implemented more and more, the technologies described below in section 4 will help to accomplish the goal.
2.2.4.8 Transportation
At JSC, a Transportation Branch in the Logistics Division operates shuttle buses and maintains the fleet of government vehicles used by JSC employees for official business. The federal government has tried to push technology and set a good example by using alternative fuel vehicles. At JSC, this has consisted mainly of using some compressed natural gas capable vehicles and some small electric vehicles. Vanpools are also available and encouraged for employee commuting.
2.2.4.9 Energy Management
To meet the pollution prevention and energy and water reduction goals mentioned above, the NASA energy manager leads an Energy Efficiency and Water Conservation Program,113 an agency-wide program to save energy and water and reduce costs. The program is important in helping ensure that NASA meets its federal stewardship responsibilities for the environment and that it achieves sustainability. At JSC, the Energy Manager resides in the Planning and Integration Office and is the only JSC member of NASA’s Energy Efficiency Panel.
The Energy Manager leads civil servant and contractor energy and water conservation and efficiency efforts. He or she is also involved in contracts for electricity, gas, and new facilities to ensure that renewable and efficiency energy measures are included. Note that there are differences in the electricity and gas prices between JSC main site, the Sonny Carter Training Facility, and Ellington Field, since the main site is able to achieve better rates due to higher usage.
2.2.5 Other
Besides the federal departments and agencies described above, the Department of Defense (DOD) has many environmental resources as part of its extensive operations. For example, the Army Environmental Requirements and Technology Assessments web page has listings for “Removal, Treatment, and Disposal Technologies for Lead-Based Paint Contamination” and “Direct Reuse of Waste Oil.” 114 No effort is made to summarize all DOD Web sites here, but a good starting point is the links page at www.federalsustainability.org.

29
A joint effort by USAID, DOE, and EPA seeks to form sustainable development partnerships with developing economies of other countries. The USAID effort targets new energy access for 150 million people through Global Village for Energy Development. DOE is trying to help reduce energy intensity by 20% in 20 countries through Energy Efficiency for Sustainable Development. EPA’s goal is to reduce the 3 million deaths per year attributable to indoor air pollution through Healthy Homes and Communities for Children.115
Several federal government agencies and departments have Small Business Innovative Research programs to help develop technology for their missions. These include EPA116, NASA117, DOE118 and DOD119.
2.3 Non-Federal Efforts
2.3.1 National Council for Science and the Environment
The National Council for Science and the Environment has made extensive recommendations to the federal government on ways to improve sustainability in the U.S. The group, funded primarily by universities and corporations, has been working since 1990 to improve the unbiased, scientific basis for environmental decision-making. They have sponsored three national conferences on science, policy, and the environment and another is planned for January 2004. 120
Many recommendations were prepared for the World Summit on Sustainable Development in 2002. Some of the most intriguing conference recommendations that relate specifically to NASA are121:
• Governments should develop and implement programs for reducing ozone depletion and the production of greenhouse gases.
• Increase R&D in renewable, low-emission and non-carbon fuel sources, including hydrogen.
• Maximize efforts to transfer sustainable energy technologies from the industrialized world to developing countries in a manner that is locally appropriate.
• Educate the public on the importance of more energy-efficient lifestyles and less harmful, renewable energy sources.
• Research should be undertaken to create mass balance models with an economic component.
• Governments should use their procurement processes to support sustainability.
• Governments and businesses should establish creative partnerships for achieving sustainability goals.
• Providers of remote sensing data should provide free data to all users, particularly to those in developing countries.
• Agencies should cultivate intermediary organizations that work with users to translate remote sensing data into useful information.
• Providers of remote sensing data should conduct and fund research to develop methods for using remote sensing to address environmental problems.
2.3.2 Texas State Offices
The TCEQ is the primary State of Texas agency charged with environmental compliance and pollution prevention efforts.122 Besides monitoring industrial and commercial activities for compliance with state regulations, TCEQ provides services such as various reports on public drinking water and an Air Quality Index Report123 that lists pollution levels for metro areas in Texas.
The Clean Texas program is a voluntary environmental leadership program to protect the state's air, water, and land. Clean Texas offers benefits and incentives to members who commit to improving the

30
environment and sustaining a quality of life for future generations. The program is open to industries, businesses, cities, counties, schools, universities, military bases, nonprofit groups, and other organizations.124 JSC joined Clean Texas in 1997.
Information on energy efficiency and renewable energy use in Texas is available from the General Services Commission, Texas State Energy Conservation Office at:
• Home Energy Conservation Series125
• Infinite Power, a Web site listing alternative ideas for renewable energy such as Sun, wind, and biomass126
• Texas Energy Partnership, a Web site with information to help with compliance with Texas Senate Bill 5 (SB5) 127
The Texas Energy Partnership Web site provides information designed to facilitate compliance with Texas SB5, also known as the Texas Emissions Reduction Plan. The bill was enacted in 2001 to assist the state in complying with the Federal Clean Air Act, and contains new energy efficiency measures that are designed to decrease electric consumption while improving air quality. All political subdivisions in 38 urban and surrounding counties in Texas are required to:
• Implement all cost-effective energy-efficiency measures to reduce electric consumption by existing facilities
• Adopt a goal of reducing electric consumption by 5% a year for 5 years, beginning January 1, 2002
• Report annually to the State Energy Conservation Office
2.3.3 Sustainability Research, Education, and Practice
2.3.3.1 Universities
Many universities now have programs in Sustainability or Futures studies, including:
• MIT Joint Program on the Science and Policy of Global Change128
• EPA-New England129
• University of Oregon130
• Brown University131
• University of Technology Sydney132
• University of British Columbia133
• Harvard134
Locally, the UT Health Science Center at Houston has had an aggressive sustainability program for about a decade. In the area of renewable energy, it added 13 kW of solar photovoltaic (PV) panels to their parking garage at University Center Tower in September 2002, bringing the total peak capacity of this system to 65 kW. They have expanded this grid-connected system in phases since September 1998. Even though the array only provides a small portion of the building’s electricity, it is an effective demonstration of the technology’s potential in downtown Houston. A new nursing school is currently under construction in the Texas Medical Center, which will demonstrate renewable energy as well as other sustainable design principles.135
Rice University boasts a Shell Center for Sustainability136 and a National Science Foundation Center for Biological and Environmental Nanotechnology.137 These centers are part of the Environmental & Energy

31
Systems Institute of Rice University, which supports and fosters partnerships between academia, business, governments, non-government agencies, and community groups to help meet society's needs for sustainable energy, environmental protection, economic development, and public health and safety.138
The Energy Systems Laboratory studies energy conservation and air-conditioning systems within the Texas Engineering Experiment Station in the Texas A&M University System. The laboratory is one of the largest university-based research programs of its kind in the United States. One of its principal projects is the Texas LoanSTAR Program, a State Energy Conservation Office program designed to “Save Taxes and Resources” by monitoring energy use and recommending energy-saving retrofits.139
The UT at Austin operates the Center for Energy and Environmental Resources, which has programs such as The Texas Air Quality Study and Texas Council on Environmental Technology.140 The University also operates Applied Research Laboratories.141
2.3.3.2 Nongovernmental Organizations
Various nonprofit, nongovernmental organizations such as Rocky Mountain Institute142 and Houston Advanced Research Center143 also explore the science of sustainability and seek to inform decision makers. The Millennium Ecosystem Assessment144 is an ambitious ongoing project bringing together researchers from all over the world to analyze the capacity of an ecosystem to provide goods and services important for human development. The project states “The capacity of ecosystems to produce goods and services ranging from food to clean water is fundamentally important for meeting human needs and ultimately influences the development prospects of nations. And when that capacity is diminished, the most serious toll is exacted on the poor, who often depend directly on forests, fisheries, and agriculture and who tend to be most vulnerable to the environmental problems that result from ecosystem degradation such as floods or crop failures. But while policymakers have ready access to information on the condition of their nation's economy, educational programs, or health care system, comparable information on the condition of ecosystems is unavailable despite the important role that they play. In fact, no nation or global institution has ever undertaken a comprehensive assessment of how well ecosystems are doing in meeting human needs.”
The Sustainable Village145 is a "social enterprise" of volunteers who donate/invest all profits for micro-finance and micro-enterprise projects in developing countries. They also help import products back to developed countries. These are just a few examples of the many organizations that try to promote environmental and social sustainability in the U.S. and worldwide.
2.3.3.3 The Natural Step
Dr. Karl-Henrik Robèrt, a leading Swedish Oncologist, founded an organization called The Natural Step146 in Sweden in 1989. Dr. Robèrt observed a significant increase in childhood leukemia cases, and traced the cause to increasing toxins in the environment due to human production processes. Concerned that so much of the environmental debate was focused on the effects of current methods of producing goods, he founded The Natural Step to address the systemic causes of environmental problems. Today the organization’s clients include The Home Depot, McDonalds, Bank of America, DuPont, and the City of Seattle among many others. According to the Natural Step, in a sustainable society, nature is not subject to systematically increasing:
1. Concentrations of substances extracted from the Earth's crust;
2. Concentrations of substances produced by society;
3. Degradation by physical means;
And, in that society,
4. Human needs are met worldwide.

32
2.4 Success Stories The DOE published “Clean Energy Partnerships: A Decade of Success” in March 2000 to demonstrate how R&D can pay rich dividend to society in terms of energy savings and reduced emissions.147 For example, a $1.1 million investment in R&D of high-efficiency compressors saved consumers more than $6 billion in energy costs in one decade.148
The “Joint Group on Pollution Prevention” is a partnership between the Military Services, NASA, and Defense Contract Management Agency, chartered by the Joint Logistics Commanders to reduce or eliminate hazardous materials or processes.149 The Army’s “Enviroquest” sustainability page has a list of technologies that can improve environmental sustainability.150
FEMP has links for New Technology Demonstration Program, Buying Energy-Efficient Products and Federal Success Stories at their Web site: http://www.eren.doe.gov/femp/prodtech.html. Global Network of Environment and Technology is an environmental technology, news, and business center that promotes the use of innovative environmental technologies.151
A recent "White Paper on Sustainability" published by Building Design and Construction Magazine highlights the history and success of the green building movement. It goes on to recommend several specific actions and policy statements for future progress toward building sustainability.152
3 Measuring Progress 3.1 Existing Metrics and Indicators In September 2002, the Heinz Center released “The State of the Nation’s Ecosystems,” the product of five years’ work by nearly 150 individuals from environmental organizations, businesses, universities, and federal, state, and local government.153 This is one example of increasing interest in quantifying our progress toward environmental sustainability. While a plethora of information is available, the sections below attempt to call attention to global efforts but focus on metrics that can be used by NASA.
3.1.1 International “Environmental Sustainability Index”
The Environmental Sustainability Index is a measure of overall progress toward environmental sustainability, developed for 142 countries.154 Its scores are based upon a set of 20 core “indicators,” each of which combines two to eight variables for a total of 68 underlying variables. The Environmental Sustainability Index permits cross-national comparisons of environmental progress in a systematic and quantitative fashion. It represents a first step toward a more analytically driven approach to environmental decision making. The index is the result of collaboration among the World Economic Forum's Global Leaders for Tomorrow Environment Task Force, The Yale Center for Environmental Law and Policy, and the Columbia University Center for International Earth Science Information Network.
3.1.2 U.S. Interagency Working Group on Sustainable Development Indicators
As part of an Interagency Working Group on Sustainable Development Indicators, personnel from 12 federal agencies worked cooperatively to select 40 indicators for monitoring sustainability in the United States. Their report, dated September 2001, is titled “Sustainable Development in the United States: An Experimental Set of Indicators.” 155 The group’s Web site describes the framework for the indicators, lists the indicators, and solicits comments.156 The site also has an inventory of Sustainable Development Indicators proposed or used by other federal and international agencies. According to the Web site, “The President's Council on Sustainable Development noted the importance of monitoring the nation's progress toward national sustainability goals. Good measures were of particular interest to the corporate representatives on the Council, which recommended that the federal government intensify its efforts to develop national indicators of progress toward sustainable development in collaboration with nongovernmental organizations and the private sector.”

33
3.1.3 NASA Environmental Tracking System
NASA Environmental Tracking System is a system for NASA centers to report environmental and energy data to NASA headquarters. JSC manages energy and environmental issues separately, but they are in the same division at headquarters. The system’s reports are collected in the areas shown in Table 3.1.
Table 3.1: NASA Environmental Tracking System Categories
Pollution prevention
Hazardous waste
Recycling & waste
Ozone-depleting substances
Energy
Energy & water management functional review
Environmental functional management
These data, which are already routinely collected, provide a good source of potential sustainability indicators.157
3.1.4 Air Pollution Emission Factors
Air pollution is the area in which metrics are the easiest to find thanks to regulatory requirements and increasing public interest in air quality and global warming. Whether to call CO2 a pollutant or not is debatable, but since it is clearly important to sustainability (in a negative way) and since it is conveniently analyzed in a manner similar to accepted air pollutants, this report includes CO2 in the analysis of air pollution. Reliable data are needed to quantify air pollution emitted by various processes and activities, including power generation, industrial processes, and vehicles.
The EPA offers several air emission calculators and software for more detailed analysis at http://yosemite.epa.gov/oar/globalwarming.nsf/content/ResourceCenterTools.html.
In one calculator, emissions factors158 that are attributed to a 2002 report by the Leonardo Academy159 are used. These values for Texas are:
• SO2: 1.76 g/kWh
• NOx: 1.22 g/kWh
• CO2: 674 g/kWh
• CO: 0.189 g/kWh
• PM10: 0.046 g/kWh
• VOCs: 0.020 g/kWh
• Mercury: 0.0000115 g/kWh
These values are updated periodically but they represent the most recent information found and were used in this report. They are based on the total electric generation mix for Texas, which is reported by the Public Utility Commission of Texas to be:160
• Coal and lignite 38%
• Natural gas 48%
• Nuclear 11%
34
• Renewable energy 1%
• Other 2%
Particulate emission of particles less than 10 microns in diameter (PM10) is used here because this typically represents close to 100% of all particulate emission and is a widely reported quantity.
Obviously, electric power plants have different air emissions based on the technology they use to generate electricity. Fortunately, most renewable energy technologies that are helpful in saving natural resources produce little or no emissions. Thus they offer a double benefit. Historically, coal has had the highest SO2 and particulate emissions of the fossil fuel options and fossil fuels have had the highest air emissions of all electricity generation options. Additionally there are other likely releases of greenhouse gases due to the extraction and distribution of fossil fuels, such as natural gas flaring from oil field production, methane releases from coal mining or gas exploration operations, and pipeline leaks.
In terms of global warming, “The generation of electricity is the single largest source of CO2 emissions in the United States. The combustion of fossil fuels such as coal is the primary source of these air emissions. Coal supplies 57% of the total energy harnessed to generate electricity (approximately 86% of all coal consumed in the United States is used for electricity generation).” 161
EPA’s AP-42 document gives detailed emission factors for a variety of industrial processes (including electricity generation technologies) and biological sources.162
3.1.5 Other Sources
Many corporations are beginning to promote sustainability by setting pollution reduction goals, engaging in carbon trading or reporting other sustainability metrics. For example, Bristol-Meyers Squibb Company has a sustainability home page, which lists their corporate indicators.163
A private company called Sustainable Measures offers training and help for companies and governments that want to establish indicators for their sustainability performance.164 Ideas for various indicators are listed on their Web site. One good example developed by Mathis Wackernagel and William Rees, called “ecological footprint,” shows that the amount of land area required to support the average North American has grown from 0.8 to 2 to 4.5 hectares (2 to 5 to 11 acres) from 1900 to 1950 to 1995. 165,166
The Sustainable Community Roundtable, initiated by the City of Olympia in 1991 and incorporated as an independent nonprofit organization in 1992, has more discussion about ecological footprints.167 An indicator from the Sustainable Community Roundtable's 1995 State of the Community Report describes waste generation. Their Web site includes a worksheet for calculating an individual's daily solid waste production rate and suggestions for reducing that number.168
3.2 Proposed Indicators for JSC Based on recommendations of the Interagency Working Group on Sustainable Development, discussed in section 3.1.2, and considering the data that are currently available at JSC, a recommended set of environmental sustainability indicators for JSC is shown in Table 3.2. For convenience, all parameters are measured such that a decrease is desirable. For example, we monitor air emissions and we want them to go down, so that indicator is straightforward. On the other hand, we track recycling efforts by subtracting recycled materials from new material use so that a decrease in the indicator is desired. While other aluminum besides cans is recycled at JSC, only cans were included in the indicator because other incoming sources could not be estimated accurately. The same is true of other metals. Recycling other metals would be another good indicator if these data were available. One or more indicators that reflect transportation impacts would also be a useful addition to the JSC indicators.

35
TABLE 3.2: JSC Environmental Sustainability Indicators
Air Pollution Waste and Resource Use Energy
SO2 emissions (kg/yr) Municipal waste (kg/yr) Electricity consumed (kWh/yr)
NOx emissions (kg/yr) Water use (Mgal/yr) Natural gas consumed (Mcf/yr)
Carbon emissions (kg/yr) Hazardous waste (kg/yr) Diesel oil consumed (gal/yr)
Particulate emissions (kg/yr) New paper use (kg/yr) Site energy inefficiency (BTU/GSF)
Ozone-depleting substances used (kg/yr) New aluminum can use (kg/yr) Nonrenewable energy use (%) Details of some of the calculations are as follows:
• All air pollution indicators except carbon are reported by calendar year. Water use is also by calendar year. All energy indicators, carbon, hazardous waste, paper, aluminum can, and municipal waste are reported by fiscal year (October – September).
• SO2, NOx, C and particulate emissions = on-site + off-site emissions (kg/yr), not including private or government vehicles. On-site emissions come mainly from boilers and diesel engines, while off-site emissions are due to the production of electricity in power plants. Off-site emissions account for more than on-site. Building 48 diesel generators produce half of the on-site NOx emissions at JSC (not including vehicles), with most of the rest coming from the boilers in building 24.
• Carbon emissions are in terms of kg of carbon, not CO2.
• “Ozone-depleting substances used” represents the sum of Class 1 ozone-depleting substances methyl chloroform, Halon 1211 and CFCs 11,12,13,113,115.
• Municipal waste does not include construction waste or wastewater.
• Water use = fresh water use – reuse of wastewater (Mgal/yr or millions of gallons per year), although there is currently no wastewater reuse at JSC.
• New paper use = purchased paper – recycled paper (kg/yr).
• New aluminum can use = estimated annual aluminum can use of 4410 kg – aluminum cans recycled (kg).
• Electricity consumed is the total for all facilities, measured in kilowatt hours (kWh) or megawatt hours (MWh) per year, as reported in the NASA Environmental Tracking System. Natural gas consumed is the total for all facilities, measured in thousands of cubic feet (Mcf) per year, as reported in the system. Note that in the reporting of energy consumption related to meeting Executive Orders, some buildings are exempt due to their special mission status.
• Site energy inefficiency = BTUs of total energy consumption/gross square feet (BTU/GSF) of all buildings at JSC, including Ellington Field and Sonny Carter Training Facility. BTUs are a summation of all energy used in the form of electricity, natural gas, diesel fuel and solar, all expressed in BTUs.
• Nonrenewable energy use (%) = [Total energy consumption (BTU) – renewable energy use (BTU)]/ Total energy consumption (BTU) × 100%.
The operation of JSC, and almost every other similar facility, has an influence on almost all of the environmental issues described in Section 1. This is illustrated in Table 3.3 by mapping JSC’s Indicators to the related discussion in Section 1. JSC, in the report, includes Ellington Field and Sonny Carter Training Facility, but not White Sands Test Facility. Additional indicators could be devised for JSC to

36
measure performance in the areas of biodiversity decline and food supply, but these are less relevant to JSC and beyond the scope of the present study.
By monitoring the trends in these indicators, NASA can track progress toward environmental sustainability. The trends are not expected to go in the desired direction (down) on their own. Action will be required to affect changes.
In the analysis of advanced life support systems for spacecraft, a technique called equivalent system mass analysis is used to identify new technologies that could make the most difference in reducing the all-important mass of the spacecraft.169 A similar strategy can be used to assess the potential for new technologies to improve NASA’s environmental sustainability. This will be discussed further in the Analysis Section.
Table 3.3 Environmental Issues Related to Indicators
Indicator Environmental Issue Section #’s
SO2 emissions air pollution, climate change, energy 1.1.2, 1.1.8, 1.1.9
NOx emissions air pollution, climate change, energy 1.1.2, 1.1.8, 1.1.9
Particulate emissions air pollution, climate change, energy 1.1.2, 1.1.8, 1.1.9
Carbon emissions air pollution, climate change, energy 1.1.2, 1.1.8, 1.1.9
Ozone-depleting substances ozone depletion, climate change 1.1.7, 1.1.8
Waste waste generation 1.1.6
Water water supply 1.1.3
Hazardous waste air pollution, water, food, waste 1.1.2, 1.1.3, 1.1.4, 1.1.6
New paper use waste generation, energy 1.1.6, 1.1.9
New aluminum can use waste generation, energy 1.1.6, 1.1.9
Electricity consumption air pollution, climate change, energy 1.1.2, 1.1.8, 1.1.9
Natural gas consumption air pollution, climate change, energy 1.1.2, 1.1.8, 1.1.9
Diesel fuel oil consumption air pollution, climate change, energy 1.1.2, 1.1.8, 1.1.9
Site energy inefficiency air pollution, climate change, energy 1.1.2, 1.1.8, 1.1.9
Nonrenewable energy % air pollution, climate change, energy 1.1.2, 1.1.8, 1.1.9
3.3 Historical Performance at JSC Data were collected for each of the Sustainability Indicators for JSC for the past several years. These historical trends are presented in Figures 3-1 through 3-15. As noted above, the data here represent totals and do not take into account exemptions, which are allowed in meeting some of the federal Executive Orders. Figures 3-9 and 3-10 refer to “net new” consumption because recycled amounts are subtracted from the total of new materials consumed.

37
0
50,000
100,000
150,000
200,000
250,000
300,000
350,000
400,000
1997 1998 1999 2000 2001 2002 2003
Year
JSC
SO
2 E
mis
sio
ns
(kg
/yr)
3-1: JSC Historical Performance for SO2 Emissions
0
50,000
100,000
150,000
200,000
250,000
300,000
350,000
1997 1998 1999 2000 2001 2002 2003
Year
JSC
NO
x E
mis
sio
ns
(kg
/yr)
3-2: JSC Historical Performance for NOx Emissions
0
5,000
10,000
15,000
20,000
25,000
30,000
1997 1998 1999 2000 2001 2002 2003
Year
JSC
Par
ticu
late
Em
issi
on
s (k
g/y
r)
3-3: JSC Historical Performance for Particulate Emissions
0
5,000,000
10,000,000
15,000,000
20,000,000
25,000,000
30,000,000
35,000,000
40,000,000
1997 1998 1999 2000 2001 2002 2003
Year
JSC
Car
bon
Em
issi
ons
(kg/
yr)
3-4: JSC Historical Performance for Carbon Emissions
0
2,000
4,000
6,000
8,000
10,000
12,000
14,000
1997 1998 1999 2000 2001 2002 2003
Year
Ozo
ne D
eple
ting
Sub
stan
ces
Use
d (k
g/yr
)
3-5: JSC Historical Performance for Ozone-Depleting Substances Used
0
200,000
400,000
600,000
800,000
1,000,000
1,200,000
1,400,000
1,600,000
1998 1999 2000 2001 2002 2003
Year
JSC
Mun
icip
al W
aste
(kg/
yr)
3-6: JSC Historical Performance for Municipal Solid Waste Generation

38
0
50
100
150
200
250
300
350
400
1997 1998 1999 2000 2001 2002 2003
Year
JSC
Wat
er U
se (
Mg
al/y
r)
3-7: JSC Historical Performance for Water Use
0
100,000
200,000
300,000
400,000
500,000
600,000
700,000
800,000
1997 1998 1999 2000 2001 2002 2003
Year
JSC
Haz
ard
ou
s W
aste
(kg
/yr)
3-8: JSC Historical Performance for Hazardous Waste Generation
0
100,000
200,000
300,000
400,000
500,000
600,000
700,000
1997 1998 1999 2000 2001 2002 2003
Year
JSC
Net
Pap
er U
se (
kg/y
r)
3-9: JSC Historical Performance for Net New Paper Use
0
500
1,000
1,500
2,000
2,500
3,000
3,500
4,000
1997 1998 1999 2000 2001 2002 2003
Year
JSC
Net
Alu
min
um
Can
Use
(kg
/yr)
3-10: JSC Historical Performance for Net New Aluminum Can Use
0
50,000
100,000
150,000
200,000
250,000
1997 1998 1999 2000 2001 2002 2003
Year
Ele
ctri
city
Co
nsu
med
(MW
h/y
r)
3-11: JSC Historical Performance for Electricity Consumption
0
50,000
100,000
150,000
200,000
250,000
300,000
350,000
400,000
450,000
1997 1998 1999 2000 2001 2002 2003
Year
JSC
Nat
ura
l Gas
Co
nsu
mp
tio
n
(Mcf
/yr)
3-12: JSC Historical Performance for Natural Gas Consumption

39
0
20,000
40,000
60,000
80,000
100,000
120,000
140,000
160,000
1997 1998 1999 2000 2001 2002 2003
Year
JSC
Die
sel F
uel
Co
nsu
mp
tio
n (
Gal
/yr)
3-13: JSC Historical Performance for Diesel Oil Consumption
0
50,000
100,000
150,000
200,000
250,000
300,000
1997 1998 1999 2000 2001 2002 2003
Year
JSC
En
erg
y In
effi
cien
cy (
BT
U/G
SF
-yr)
3-14: JSC Historical Performance for Site Energy Inefficiency (BTU/GSF)
0%
10%
20%
30%
40%
50%
60%
70%
80%
90%
100%
1997 1998 1999 2000 2001 2002 2003
Year
JSC
No
n-r
enew
able
En
erg
y (%
)
3-15: JSC Historical Performance for Non-Renewable Energy Use
4 Technological Developments This section discusses various technologies that can be used to improve environmental sustainability at JSC and elsewhere. It is arranged by technical discipline, much like the various subsystems of a spacecraft. Other divisions are possible, but hopefully the reader will be able to easily find the information he or she is looking for when using this section as a reference.
This is by no means an exhaustive list of environmentally friendly technologies. Rather, it offers sources and suggestions as a starting point for a sustainability journey. Where not obvious, applications are discussed and connections between various sections are described.
4.1 Air On Earth, air pollution has become a problem at various places and times throughout modern history. The process usually occurs over a period of years or even decades. In spacecraft, the artificial atmosphere is kept clean by an air revitalization system. Due to the small volume of the closed system, the system must deal with any pollution problems immediately.
On Earth, the concentration of atmospheric CO2 has increased from ~275 to ~370 ppm due to human-
induced changes. This is far below the spacecraft maximum allowable concentration of 13,000 mg/m3 or 7000 ppm170 because we know that humans can tolerate a much higher concentration than Earth’s

40
ecosystems (See discussion of climate change in section 1.1.8). Microbes breaking down CO2 is one of the potential benefits of microbe research identified by a recent science & government report from Technical Insights, a business unit of Frost & Sullivan.
Many technologies that have terrestrial benefits to air quality are reported under other sections of this report, such as Energy, Sustainable Habitats, or Transportation. For example, part of the Houston area plan to bring air quality standards into compliance with EPA guidelines is a ban on mowing in the morning hours. Implementation of 30 TAC 114.452(a), effective April 1, 2005, requires equipment powered by handheld and non-handheld spark ignition engines below 25 horsepower (hp) to not be operated between the hours of 6:00 am and noon during the period from April 1 to October 31. One technology that might address this issue is the fuel cell lawn mower discussed in section 4.5.5.3.
EPA provides information on air trends and the progress that has been made in the U.S. since 1970 in reducing air pollution.
4.1.1 Air Monitoring
One area in which technology advances are welcomed is air quality monitoring, for security, health, and environmental reasons. An area of R&D that is likely to contribute along these lines is MEMS technology. MEMS stands for microelectromechanical systems and is a broad category of devices that take advantage of circuit-board-type techniques to fabricate miniature sensors and machines. One such device that NASA is working on is called an electronic nose. It is being developed to identify targeted compounds for Space Shuttle and Space Station air quality monitoring.
4.1.2 Air Treatment Technologies
In the small closed volume of a human spacecraft, the air must be treated to remove CO2 and water vapor as well as trace contaminants and particles. Temperature swing solid amine is one technology NASA is investigating that may someday be applied to remove CO2 from power plant smoke stacks.171
4.1.3 Adhesives
One way to reduce VOC release due to adhesives in both spacecraft and ground applications may be to develop new adhesives based on nature. A U.S. Army-funded research project by Montana Biotech Corporation is investigating this approach.172
4.1.4 Painting
One source of unwanted VOCs is spray-painting operations. Water-borne, silicon based paints for protecting metal structures against corrosion have been developed as substitutes for traditional anticorrosion paints that contain large amounts of VOCs. Another advantage of these paints is that they do not require primers. These developments were made for Kennedy Space Center.173
PRO-ACT has a list of 22 General Services Administration stock-listed water-based acrylic-latex enamel spray paints that comply with the latest California VOC emission limitations for aerosols. They are recommended whenever possible as alternatives to solvent-based spray paints.174
4.2 Agriculture and Food The author of Eco-Economy states, “Expanding food production to feed the world’s growing numbers will be far more difficult during this half century than it was over the last.” In terms of production per person, grain, beef, mutton, and seafood all grew from 1950 to the 1970s or ’80s and then began to decline. The lasting solution is to raise productivity.19,175,176 This must be done in space habitats as well, if bio-regenerative life support systems are to be made practical.
Over a billion people on Earth are undernourished and underweight. The majority of these are rural poor living in the Indian subcontinent or sub-Saharan Africa. Unfortunately, these areas also face many of the

41
threats to farmland and water described in Section 1.1.175 Most of the developing world is classified as "low-income, food deficit countries" by the Food and Agriculture Organization of the UN. These countries do not produce enough food to feed their people and cannot afford to import sufficient amounts to close the gap. In these countries, some 800 million people are chronically malnourished and 2 billion people lack food security. Food production capacities in many poor countries are deteriorating due to soil degradation, chronic water shortages, inappropriate agricultural practices, and rapid population growth. Much agricultural land is also increasingly devoted to cash crops for export, depriving poor local people of land to farm and food to eat.1
Today, 15 crops provide 90% of the world's food intake. Three—rice, wheat and maize (corn)—are staple foods for two out of three people. The continuing genetic erosion of the Earth's wild strains of cereals and other cultivated plants threatens continuing efforts to improve staple crops. Unless the rate of plant genetic loss is halted or slowed substantially, as many as 60,000 plant species—roughly one quarter of the world's total—could be lost by 2025.1
Fish stocks are also under threat. According to the Food and Agriculture Organization, 69% of the world's commercial marine fish stocks are "fully exploited, over-fished, depleted, or slowly recovering." To accommodate the nearly 8 billion people expected on Earth by 2025 and improve their diets, “the world will have to double food production, and improve distribution to ensure that people do not go
hungry.” 1
In the past decade, aquaculture has led the increase in animal protein sources, thanks in large part to China integrating aquaculture into its farming techniques. India has also been very successful at converting crop residues into milk using water buffalo.177
Albert Einstein once said, “Nothing will benefit human health & increase the chances for survival of life on Earth as much as the evolution to a vegetarian diet.”178 However, human consumption of meat and consumption per person has increased substantially over the past 50 years.176 It takes more land and other resources to produce meat for food than it does plants. Some statistics are provided by the UN Population Fund. This becomes apparent when thinking of closed-loop life support in space as well. NASA contributions to sustainable food development, among others, could include the development of new crop-based foods such as sweet potato cereal being studied by Tuskegee University (Figure 4-1).179 NASA’s Food Technology Commercial Space Center (See Section 2.2.4.2) is also developing new foods for space missions in conjunction with industry partners. Some of these shelf-stable food products may be useful in feeding undernourished populations.
Food production is also closely linked to energy use, whether on Earth or in space. Factor Four illustrates how food can range from low-energy agriculture to foods that require humans to use more energy to produce
than they deliver when consumed.180
Various technologies and techniques may be useful in providing more food with less natural resource consumption. In St. Petersburg, rooftop gardens are becoming popular.181 Renewable energy can be used in agriculture in various ways such as for irrigation or cooling crops at harvest. A NASA-developed solar-powered refrigeration system and its application to milk cooling are discussed in section 4.6.2.2. Another agriculture-related field that has benefited from NASA research is potato “seeds” that are grown hydroponically.182
4-1: New Crop-Based Foods Are Being Developed by Advanced Life Support Researchers
42
4.3 Energy Energy is a broad topic, touching almost every area of our everyday lives. We have already seen above in section 1.1.9 the profound affect that energy extraction, generation, and use have on the environment. Many technologies and strategies that could improve our sustainable use of energy are considered below, from large-scale power-generation options to devices that save a few watts of electrical power. The topic of energy has attracted a great deal of attention lately; with well known scientists such as Nobel Laureate Richard Smalley calling for a major new research effort in the field of energy.183
NASA, along with other parts of the federal government, is already busy working toward better energy stewardship based on federal legislation and several Executive Orders as described in section 2.2.3. Some of the most significant goals for JSC are to reduce energy consumption per building area (BTU/GSF) 35% by 2010 (vs. 1985) for office buildings, 25% by 2010 (vs. 1990) for laboratories (a.k.a. energy-intensive facilities), and 35% by 2010 (vs. 1985) for “mission variable” buildings (even though this class is exempt).
There is a well-known correlation between energy consumption and standard of living. Even though the best development path is often debated, we know that abundant energy helps economic and social development. One source estimates that “economic prosperity requires approximately 6 kWt of thermal commercial power per person or about 2 kWe of electric power per person.” 184 Steam-cycle efficiencies (39 to 50%, including combined cycles and cogeneration) and overall primary energy-to-electricity efficiency (30 to 36%, including transmission losses) yield the nominal thermal-to-electric power conversion: 3 kWt (thermal) ≈ 1 kWe (electrical).33
This means that “a prosperous world of 10 billion people in 2050 will require ~ 60 terawatts (TWt) of commercial thermal power or 20 TWe of electric power.” 184 Since this is several times more power than we use today, it is likely that a more diverse mixture of energy sources will be required in the future. The selected mixture, however, will have a profound impact on many of the environmental sustainability issues described above.
4.3.1 Energy Conservation
Energy conservation means using energy more wiselyeither through improved efficiency or reduction in usage. Conservation often involves some action to use less energy. Conservation may involve some sacrifice in convenience, but often it is simply a matter of stopping waste. In Bangkok, city officials demonstrated the power of conservation by one evening broadcasting a message on all major television stations with a dial indicating the city’s current electric usage and a call for everyone to turn off unnecessary lights and appliances. As viewers watched, the dial dropped by 735 megawatts!185
A modern technological aid to the proverbial phrase “turn the lights off when you leave the room” has already been applied at JSC with the addition of automatic light schedules and motion sensors in conference rooms.
An important aspect of energy conservation is proper operations and maintenance of equipment in central plants and buildings. Leaking or poorly lubricated equipment can waste significant amounts of energy. And the best energy savings devices are useless if they are turned off or not working properly.
4.3.1.1 Control Systems
Having good data about energy use is a good starting point for conserving it. In the 1990s, JSC installed a Honeywell EBI Energy Management Control System in building 24 and DDC Building Controllers in all mall buildings to replace the old pneumatic control system.
California’s Department of General Services is experimenting with a web-based system called WebGen that uses artificial intelligence to learn the habits of buildings and check weather forecasts every

43
15 minutes in order to optimize energy use. The state plans to outfit over 40 buildings during a 2-year pilot project ending in June 2003.186
4.3.1.2 Computers
Small savings can accumulate if there are many occurrences of them. For example, JSC has about 10,000 personal computers, each consuming about 120 watts and running about 9 hours per day. Some are left on nights and weekends to serve a purpose and some that are left on serve no purpose. Even during the day, automatic power savings features that are built into the existing systems could save significant energy if exploited. For example, if default settings turned off just the monitor (reducing power consumption to 50 watts) after a half hour of inactivity, electricity savings at JSC could be over 200 megawatt-hours per year.
Going beyond just energy conservation, computers can be built in a more sustainable fashion. Hopes are that manufacturers and consumers will pay more attention to this in the future. One product that is already available is the NEC PowerMate eco, which uses a third as much energy as most computers. It is the only desktop PC that doesn't use a fan and is the first to address PC recycling. Its flat-panel screen does not contain boron, commonly found in monitors, and its motherboard is made with lead-free solder, which protects those doing the reclamation and the ground water in case of disposal. Also, the chassis is made of NEC's patented NuCycle plastic, which is 100% recyclable and uses nontoxic flame retardant materials.187
4.3.2 Energy Efficiency
Energy efficiency is a broad topic area as well as an important one in itself. Not to be confused with conservation, which includes making due with less energy services, energy efficiency deals with using energy more wisely or reducing losses in the machines we use. For example, a more efficient electric light turns more of the electricity into visible light and less into waste heat and a more efficient refrigerator may use better insulation to reduce heat gain through the walls and thus allow the compressor to run less.
In this report, the benefits of increased energy efficiency will be described by technology or application, such as lighting efficiency in section 4.5.4 or low heat gain roofs in section 4.5.2.
The efficiencies of mature technologies are well characterized.17,23 Most efficient are large electric
generators (98 to 99% efficient) and premium motors (90 to 97%). Rotating heat engines that are limited by the second law of thermodynamics follows these: gas and steam turbines (35 to 50%) and diesel (30 to 35%) and internal combustion (15 to 25%) engines. Electrolyte and electrode materials and catalysts limit electrochemical fuel cells (50 to 55% now, 70% eventually). Fuel cells may replace heat engines but will likely run on hydrogen (H2). A seamless transition would use H2 extracted from gasoline or methanol in reformers (75 to 80% efficient), then switch to renewable sources of H2. Renewable energy converters include PV cells (the best commercial arrays are about 15 to 20% efficient now; theoretical peak for single band-gap crystalline cells is ≈24%; higher for multiband cells, lower for more cost-effective amorphous thin films). Wind turbines (commercial units, about 30 to 40%) have theoretical "Betz limit" (≈59%). High-pressure sodium vapor (15 to 20%), fluorescent (10 to 12%), and incandescent (2 to 5%) illumination generate more heat than light. [Author’s note: other sources put these lighting efficiencies much higher] Photosynthesis has very low sunlight-to-chemical energy efficiency, limited by chlorophyll absorption bands (most productive ecosystems are about 1 to 2% efficient; theoretical peak independent of cell or ecosystem is ≈8%).188
Other resources dealing with energy efficiency are:
• http://www.oit.doe.gov/inventions/
• www.eren.doe.gov/femp/procurement
• http://www.eren.doe.gov/eere/
44
4.3.3 Combined Heat and Power Cogeneration
A special case of energy efficiency, called combined heat and power or cogeneration, involves systems that use the same device to produce electrical power and heat for some useful purpose. In this way, the fraction of energy that is used from a given fuel, and thus the efficiency, is much greater. All practical fuel energy sources used to produce electricity generate some heat due to inefficiency in the conversion process, but some are more suitable than others to use that heat due to temperature level or other characteristics. For example, gas turbines and certain types of fuel cells are good candidates for combined heat and power generation.
4.3.4 Gas Turbines
Natural gas turbines are cleaner than coal power plants and are increasingly used for power generation. Combined-cycle gas turbines and microturbines, in particular, are increasing in numbers. Combined-cycle generation is a configuration using both gas turbines and steam generators. In a combined-cycle gas turbine, the hot exhaust gases of a gas turbine are used to provide all, or a portion, of the heat source for the boiler, which produces steam for the steam generator turbine. This combination increases the thermal efficiency over a coal- or oil-fueled steam generator. The system has an efficiency of about 54%. A microturbine is a compact turbine generator that delivers electricity close to the point of use. Operating on a variety of gaseous and liquid fuels, this form of distributed generation technology made its commercial debut in 1998. Microturbines can serve as primary, emergency backup, or standby power. Units about the size of a refrigerator generate 30 to 60 kilowatts of electricity. Maximum thermal efficiencies can be achieved when the exhaust is used in a combined heat and power (or “cogeneration”) application.
4.3.5 Fossil Fuels and Carbon Sequestration
It may be possible to reduce emissions from systems using fossil fuels using innovative techniques. For example, Argonne National Lab reduced particulate emissions by 60% and NOx emissions by 15% at the same time in a laboratory locomotive diesel by carefully adjusting fuel injection timing and fuel flow and by using a separate oxygen source. Even though these are only laboratory results, it illustrates that incremental improvements are possible even with traditional technologies.189 DOE has a Web site devoted to fossil energy190 and www.agores.org also investigates “clean fossil fuels” as an alternative.
“CO2 emissions from fossil fuels are divided among the atmosphere, ocean, and terrestrial biosphere. Measurements indicate that the atmosphere is storing carbon at a rate roughly equivalent to 60% of the emissions being produced by fossil-fuel consumption.”191 One strategy to deal with global warming is to continue the increase in fossil fuel use, but to take other actions to neutralize or “sequester” excess carbon. There are several methods of doing this.
“The science and technology necessary for sequestration of CO2 in ocean hydrates may also hold the key for economical production of natural gas from the very large gas hydrate deposits that are currently untapped.” 192
Going even further than sequestration, some have suggested terraforming or geoengineeringthe deliberate manipulation of the planetary environment to counteract anthropogenic climate change. Of course, this is controversial and the opposing viewpoint is that “We would be wise to begin with a renewed commitment to reduce our interference in natural systems rather than to act by balancing one interference with another.”145
In another vision of "clean" coal, coal and/or biomass and waste materials are gasified in an oxygen-blown gasifier, and the product is cleaned of sulfur and reacted with steam to form H2 and CO2. After heat extraction, the CO2 is sequestered and the H2 used for transportation or electricity generation.39 Decarbonization is thus intimately linked to sequestration.

45
Secretary of Energy Spencer Abraham announced in 2003 that the United States will lead a $1 billion, public-private effort to construct the world's first fossil fuel, pollution-free power plant. The plant, known as FutureGen, will serve as a “living prototype” of new carbon sequestration technologies and produce both electricity and hydrogen. The prototype power plant will serve as the test bed for demonstrating the best technologies the world has to offer. Virtually every aspect of the prototype plant will be based on cutting-edge technology. The government will ask an industrial consortium to design a plant that will turn coal into a hydrogen-rich gas, rather than burning it directly.193
4.3.6 Nuclear Fission and Fusion
The power of nuclear fission was unleashed during World War II and subsequently harnessed for electricity production. Heat from nuclear reactions is used in a steam power cycle as uranium atoms are split. Even though we may have enough uranium to last for many years, nuclear fission is not a renewable energy source. However, since it does not contribute significantly to global warming or air pollution, it is sometimes called a “clean energy source.” In fact, individuals normally receive a larger dose of radiation from coal power plants than from nuclear plants.194 However, the cost, risk, and unknowns about nuclear waste disposal have slowed the development of nuclear energy worldwide.
Nuclear fusion, the process in which heat is released as atoms combine, is the process that occurs within our Sun. However, human attempts to control this reaction, so far, have required more energy input than energy produced. Nevertheless, the earliest gas turbines could barely turn their compressors. The development of fusion power could be similar. A $10 billion international thermonuclear experimental reactor could prove the concept of fusion power on Earth if supporters can gain funding; however, it would still be an experiment rather than a power plant prototype.155
4.3.7 Wind
In 2001, Texas trailed only Germany as the location of the most new wind turbinesthe modern name for windmillsused to generate electricity rather than grind grain. At King Mountain, Texas, 214 turbines, capable of generating 278 MW, were installed in less than a year. In terms of manufacturing, though, Enron was the only U.S. company to make it onto the top 10 list of suppliers.195
The wind industry is one in which R&D investments in technology have really paid off. As shown in Figure 4-2, the cost of wind energy has come down dramatically in the past decade to the point where it is economically competitive in many regions.196
According to the U.S. Wind Energy Association, the industry is expected to grow by 25% in 2003, up to 6,000 MW (enough to serve 1,500,000 homes).
4.3.8 Solar Photovoltaic
John Perlin describes the history of solar PV technology in his book From Space Down to Earth: The Story of Solar Electricity.197 While
not invented for use in outer space, the PV industry has seen strong growth in the past four decades due to applications on satellites and, ironically, off-shore oil drilling platforms. PV cells, commonly known as solar cells, are devices about the size of your hand, made of special materials that turn sunlight directly into electricity. The cells are strung together and packaged into modules that come in various sizes and voltages.198 In recent years, power
4-2: R&D Helps Wind Turbine Technology196
46
plants of over a megawatt have been constructed, but one of the big advantages of PV continues to be their scalability from a fraction of a watt to megawatts.199
PV system costs need to come down by another 50% to make use of market dynamics.200 System cost is not just the PV modules, but also installation, mounting frames and other electrical components such as inverters, which turn DC power into AC. “Although in the last 10 years costs have been cut by half already, there is clearly room for improvement here and several innovative designs and configurations are emerging on the market.” For example, some companies are beginning to integrate PV into roofing, windows, and other building products. BP has a PV cost calculator on their Web site, http://www.clean-power.com/bp/default.asp.
NASA has conducted various PV research activities over the years.201 DOE and university researchers are also involved in research efforts to improve PV efficiency and/or bring down costs. For example, one new PV cell is made from organic materials, which consist of small carbon-containing molecules, as opposed to the conventional inorganic, silicon-based materials in PV. The materials are ultra-thin and flexible and could be applied to large surfaces. The hope is that this might bring down the cost of PV.202
Household electrical systems running at 48 volts DC may be the way of the future, although this would actually be returning to Thomas Edison’s preferred system.203 Since PV panels generate DC power, this would be a good match. Most spacecraft electrical systems run at 28 volts DC and use solar arrays to generate their power. Although DC is not good for transmitting power over long distances, it has the distinct advantage of producing higher efficiency in motors and many other devices.2
4.3.8.1 PV Technology Options
Multi-junction solar cells are a technology that the Air Force and others have worked on for space applications and can now be found in terrestrial products. In this technology, multiple layers of PV materials that react to different wavelengths are stacked on top of each other. Air Force R&D has helped raise the efficiency of commercially available aerospace solar cells from 18% in 1990 to about 28% in 2002. These triple-junction, high-efficiency cells are made of gallium indium phosphide on gallium arsenide on germanium and cost about $250/watt compared to terrestrial products that cost about $4 or $5/watt today.204 ENTECH is a company that specializes in Fresnel lens PV technology. They have worked with NASA to create a multi-junction mini-module that achieved a module efficiency of over 30%.205
In May 2003, SunPower Corporation announced the world’s most-efficient, low-cost silicon solar cell. Based on a unique rear-contact design—which maximizes the working cell area, hides wires, and makes automated production easier—the A-300 cell achieves over 20% efficiency compared with currently available cells in the 12% - 15% range. Past SunPower cells have been used in a range of high-performance products, including NASA’s Helios solar airplane.206
A recent discovery due to research at Lawrence Berkley National Lab is also good news for PV efficiency. Scientists learned that the band gap of the semiconductor indium nitride is not 2 electron volts (2 eV) as previously thought, but instead is a much lower 0.7 eV. This discovery means that a single system of alloys incorporating indium, gallium, and nitrogen can convert virtually the full spectrum of sunlightfrom the near infrared to the far ultravioletto electrical current. This gives hope for higher-efficiency solar cells compared with today’s best, leading the researcher to say that it “could revolutionize the use of solar power not just in space but on Earth”.207
Following years of R&D, silicon solar cells have emerged as the current PV technology of choice for commercial applications. Galium arsenide is also a popular option for high-efficiency applications such as space. However, many competing technologies are being researched, all with an eye toward cost reduction. One example is a converter that is based on light harvesting by dye molecules on a metal surface.208 Other materials being used include copper-indium-diselinide and indium nitride.

47
One idea is to use the world’s desert lands for very large-scale solar power plants.209 The Sahara desert alone has over 600 terawatts of electrical generation capacity. However, the full impact of very large-scale PV on the environment and climate would need to be carefully considered.
4.3.8.2 Solar Power Satellites
Since solar energy is readily available and more intense outside Earth’s atmosphere, it makes sense that scientists have looked to space as a potential site for sustainable power generation. Satellites with huge solar PV arrays in geosynchronous orbit could gather solar energy continuously and beam it to the ground via microwaves that pass through rain, clouds and dust that complicate solar energy capture on Earth. Dr. John Mankins, at NASA headquarters Advanced Programs Office, points out the “importance of abundant and affordable energy in space exploration and development” and believes the development of large-scale space solar power is worthwhile.210
In the 1970s, a NASA-DOE study estimated that solar space power would cost $0.10/kWh but a National Research Council evaluation felt it would be 10 times higher. A recent Fresh Look Study found that the cost would be about $0.10 to $0.25/kWh and should be considered for a “two-planet economy.” 155 Of course, the economics are highly dependent on launch costs.
Solar power satellites and power beaming could be especially beneficial to outposts in Earth’s neighborhood. For terrestrial use, however, some have questioned the concept due to its scope and the current high cost of putting payloads into orbit. One comparison study found that “a terrestrial solar power system, built on the same area as the receiving antenna of a space-based system, would generate the same yearly average electric power as the space-based system.” The study also favored the terrestrial PV system from the standpoint of development risk and cost, technology maturity, modularity, maintainability, public acceptance and environmental concerns.211
4.3.8.3 Lunar Solar Power
By using the existing platform of the Moon and by further using the in situ resources of the Moon to make solar collectors, the proposition for space solar power becomes more attractive. Dr. David Criswell, director of the University of Houston’s Institute for Space Systems Operations, argues that lunar solar power is the only option capable of providing the Earth with 20 terawatts of inexpensive electrical power by 2050.212 This amount of power is 3–5 times current global capacity, but is reportedly necessary to bring prosperity to all people. The concept is to generate electricity from PV power plants near the edges of the Moon, turn that energy to microwaves, and beam it to Earth. It would be received by several thousand large rectennas located around the globe and reconverted to electricity. Safety and technology issues have been studied, and Dr. Criswell believes that, by replicating processing equipment on the Moon and using over 90% lunar materials for the collectors, the economics will work out as well.
4.3.9 Solar Thermal
4.3.9.1 Solar Dynamic Power
Various heat engines can be used to produce electricity from solar energy in space or on Earth. Solar dynamic power is an energy conversion process that uses the Sun's thermal energy to produce mechanical energy from which electricity is generated. Various thermodynamic cycles may be used for the thermal-to-mechanical energy conversion, including Brayton, Stirling and Rankine cycles. NASA Glenn Research Center has investigated various dynamic power systems for space applications since the 1960s. Early space station power system trade studies considered the use of solar dynamic power. Solar dynamic power was shown to offer life cycle cost advantages over PV power due to elimination of batteries for eclipse power,
4-3: Solar dynamic concept for Mir

48
reduction in station drag area, higher conversion efficiency, and less degradation in power output to end of system life. However, higher development costs and lack of in-space operating heritage led to the decision to baseline a conventional PV/battery system for the Space Station.
A demonstration of solar dynamic technology was performed at Glenn in 1994-1996 with a 2 kWe system known as the Ground Test Demonstration program. The Joint U.S.-Russian Solar Dynamic Flight Demonstration, depicted in Figure 4-3, was a cooperative program combining the solar dynamic technical expertise of Russia and the U.S. The project goals were to develop, launch, deploy, and operate successfully a solar dynamic demonstration unit on the Mir Space Station. Unfortunately, the flight demonstration program was terminated in February 1996 due to the elimination of the shuttle flight that was to send the system to Mir. Some of the hardware that was built for the flight demonstration program was subsequently tested on the ground. Some dynamic power work continues to be carried out within the Power and Onboard Propulsion Technology Division at Glenn Research Center, with most of the current efforts focused on Stirling power systems.213
Concentrating solar collectors are required to provide high enough temperature heat for the heat engines described above. They are also used in other high-temperature processes, including heat-driven cooling systems (see section 4.6.1.8). In space, mass is a key consideration whereas on Earth, cost is more important. Figure 4-4 shows a concentrating solar collector.214
4.3.9.2 Water heating
Solar water heaters have been around for over a century, but they have only seen widespread use off and on in certain regions of the world. The reason is the general availability of cheap electricity or natural gas. Israel is one country that currently has a high percentage of domestic solar water heaters. Plenty of information on solar water heaters is available from DOE215, state energy conservation offices,216 and research organizations.217 Various types of collectors and systems are available and can be used to heat potable water, buildings, industrial processes, and swimming pools.
JSC has several good applications for solar water heating. Most notable are the large pool at the Neutral Buoyancy Lab (NBL) and water for cooking/cleaning at the cafeterias. These applications have been evaluated and are under consideration for implementation.
Even though some segments of the solar water heater industry are fairly mature, there is still a great deal of room for technology improvement to advance the state-of-the-art and promote more widespread use. One technology NASA is researching that may be applied to solar water heaters is freezable tubing. In space, this would allow the use of fluids with better heat transfer properties to flow through radiator panels without worry of bursting at low temperatures. Similarly, in solar collectors on Earth, this would allow the use of water without anti-freeze additives. The additives have lower specific heat and degrade over time. Other technologies of mutual interest to NASA and the solar water heater industry include selective surfaces, high-temperature and high-conductivity materials, high-transmittance glazing, efficient pumps, and well-insulated tanks.
4-4: Concentrating Solar Collector

49
4.3.9.3 Power Towers
Central receivers, or “power towers,” use thousands of Sun-tracking mirrors to reflect solar energy onto a receiver located on top of a tall tower. The receiver collects the Sun's heat in a molten salt heat-transfer fluid that flows through the receiver. The salt's heat energy is then used to make steam to generate electricity in a conventional steam generator, located at the foot of the tower. The molten salt storage system retains heat efficiently, so it can be stored for hours or even days before generating electricity. By using thermal storage, power tower plants can potentially operate for 65% of the year without the need for a backup fuel source. Without energy storage, solar technologies like this are limited to annual capacity factors near 25%.
The DOE and a consortium of U.S. utilities and industry built two large-scale, demonstration solar power towers in the desert near Barstow, California. Both systems had the capacity to produce 10 MW of electrical power. Solar One operated successfully from 1982 to 1988, proving that power towers work efficiently to produce utility-scale power from sunlight. The Solar One plant used water/steam as the heat-transfer fluid in the receiver. Solar Two, which operated from 1996 to 1999, demonstrated how nitrate salt (molten salt) could be used as the heat-transfer fluid in the receiver and as the heat storage media as well. The molten nitrate salt reached approximately 565°C in the receiver and then traveled to a storage tank, which had a capacity of 3 hours, demonstrating how solar energy can produce power even when the Sun isn't shining.
Solar One and Solar Two fostered commercial interest in power towers. Two of the project's key industry partners have been pursuing commercial solar power tower plant opportunities in Spain. Solar energy premiums and other incentives under review in Spain are creating an attractive market opportunity for new technology. The Spanish project, called "Solar Tres" or Solar Three, will use all the proven molten-salt technology of Solar Two, scaled up by a factor of 3 and be operated by industry as a long-term power production project. This utility-scale solar power could be a major source of clean energy worldwide, offsetting as much as 4 million metric tons of carbon equivalent through 2010.218
A rather unique solar thermal power generation technology, referred to as a solar tower or solar chimney, uses the simple principle that hot air rises to generate electricity. A large area of desert is covered with glass a few meters off the ground and air heated under that glass flows toward a centrally located, very tall, hollow column. In the process, the rushing air turns emission-free turbines, generating power. With irrigation, a greenhouse agriculture industry could be coupled with power production. Enviromission Ltd is developing the world’s first 200 MW power plant using this approach in Australia. The challenge will be in constructing the 1000-m-high tower, which
will be the tallest structure in the world. It is a scale-up of a 50 kW plant built in Spain in 1982 (see Figure 4-5).219
4.3.9.4 Solar Ponds
A solar pond collects and stores heat in a body of very salty water. The salinity gradient stops the natural process of warmer water rising to the top when large quantities of salt are dissolved in the hot bottom layer of water. Thus, the water above serves as an insulator. The heat at the bottom of the pond can be
4-5: Prototype Solar Chimney in Spain
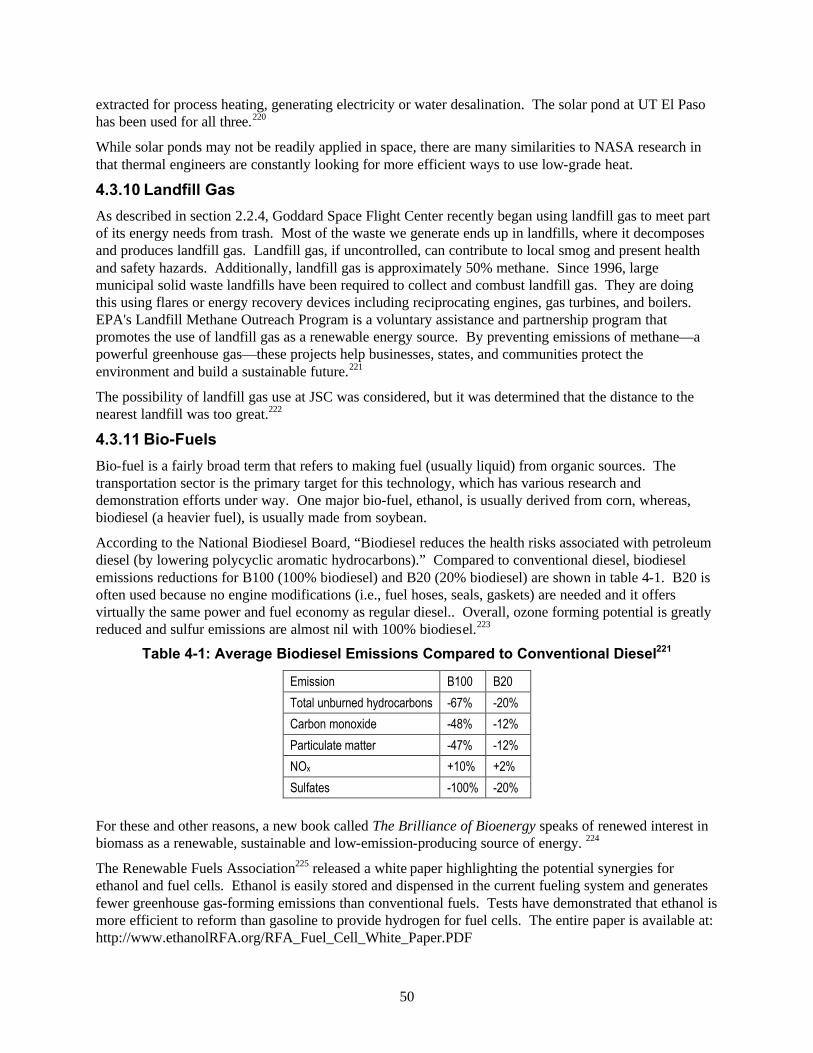
50
extracted for process heating, generating electricity or water desalination. The solar pond at UT El Paso has been used for all three.220
While solar ponds may not be readily applied in space, there are many similarities to NASA research in that thermal engineers are constantly looking for more efficient ways to use low-grade heat.
4.3.10 Landfill Gas
As described in section 2.2.4, Goddard Space Flight Center recently began using landfill gas to meet part of its energy needs from trash. Most of the waste we generate ends up in landfills, where it decomposes and produces landfill gas. Landfill gas, if uncontrolled, can contribute to local smog and present health and safety hazards. Additionally, landfill gas is approximately 50% methane. Since 1996, large municipal solid waste landfills have been required to collect and combust landfill gas. They are doing this using flares or energy recovery devices including reciprocating engines, gas turbines, and boilers. EPA's Landfill Methane Outreach Program is a voluntary assistance and partnership program that promotes the use of landfill gas as a renewable energy source. By preventing emissions of methane—a powerful greenhouse gas—these projects help businesses, states, and communities protect the environment and build a sustainable future.221
The possibility of landfill gas use at JSC was considered, but it was determined that the distance to the nearest landfill was too great.222
4.3.11 Bio-Fuels
Bio-fuel is a fairly broad term that refers to making fuel (usually liquid) from organic sources. The transportation sector is the primary target for this technology, which has various research and demonstration efforts under way. One major bio-fuel, ethanol, is usually derived from corn, whereas, biodiesel (a heavier fuel), is usually made from soybean.
According to the National Biodiesel Board, “Biodiesel reduces the health risks associated with petroleum diesel (by lowering polycyclic aromatic hydrocarbons).” Compared to conventional diesel, biodiesel emissions reductions for B100 (100% biodiesel) and B20 (20% biodiesel) are shown in table 4-1. B20 is often used because no engine modifications (i.e., fuel hoses, seals, gaskets) are needed and it offers virtually the same power and fuel economy as regular diesel.. Overall, ozone forming potential is greatly reduced and sulfur emissions are almost nil with 100% biodiesel.223
Table 4-1: Average Biodiesel Emissions Compared to Conventional Diesel221
Emission B100 B20
Total unburned hydrocarbons -67% -20%
Carbon monoxide -48% -12%
Particulate matter -47% -12%
NOx +10% +2%
Sulfates -100% -20%
For these and other reasons, a new book called The Brilliance of Bioenergy speaks of renewed interest in biomass as a renewable, sustainable and low-emission-producing source of energy. 224
The Renewable Fuels Association225 released a white paper highlighting the potential synergies for ethanol and fuel cells. Ethanol is easily stored and dispensed in the current fueling system and generates fewer greenhouse gas-forming emissions than conventional fuels. Tests have demonstrated that ethanol is more efficient to reform than gasoline to provide hydrogen for fuel cells. The entire paper is available at: http://www.ethanolRFA.org/RFA_Fuel_Cell_White_Paper.PDF

51
A UC Davis study of the health hazard potential of diesel and bio-diesel fuels found that “All particulate matter collected had measurable genotoxic (mutagenic) activity” but that “the 100% diesel fuel was higher than either the 100% rapeseed oil ethyl ester (REE) or the diesel-REE blends.”226
Technology for making fatty acid alkyl esters—generally known as biodiesel—from vegetable oil or animal fat is fairly straightforward. The Biofuels Program's Renewable Diesel Alternatives Project explores new fuels, feedstocks, and technologies, but primarily seeks to remove barriers to use of biodiesel and other biofuels in heavy-duty vehicles. As with bioethanol in light-duty vehicles, biodiesel can be used as an alternative fuel, but is primarily used as an additive to conventional diesel to reduce toxic air emissions.227
A team of researchers from NREL, Clark Atlanta University, Georgia Institute of Technology, Scientific Carbons and Enviro-tech has successfully demonstrated the use of biomass from peanut shells to produce hydrogen. NREL and Scientific Carbons filed for patent protection on a new slow-release fertilizer made while producing biomass-based hydrogen and a sequestered carbon.228
U.S. supporters of bio-fuels tout the benefits of having a domestic energy supply in addition to the health benefits. There are, however, some critics of bio-fuels. "Ethanol does not increase energy security," insists David Pimentel, an agricultural ecologist at Cornell University. "It remains a fact that it takes more energy to produce a gallon of ethanol than you get out of it."
Pimentel says ethanol, when made from corn, should not even be considered a renewable fueland actually provides little help on global warming. It takes large amounts of nonrenewable natural gas, coal, and oil to make fertilizer and grow the corn, process ethanol and transport it in trucks and rail cars.
By contrast, the Argonne lab and Agriculture Department studies conclude about 30% overall energy gain in using ethanol. Most of the energy used in making ethanol comes from coal or natural gas domestic sources instead of petroleum-based gasoline that relies on imports, they note.229
JSC currently uses diesel fuel as a backup in many stationary generators around the site, including backup for mission control. It is also used as a backup fuel source for the steam boilers, which normally run on natural gas. The boilers are operated on diesel fuel for one hour before each shuttle mission for check out, but have never operated due to a disruption of natural gas. Bio-diesel is being considered for use in the diesel generators at JSC.
4.3.12 Energy Storage
Energy storage technologies go hand in hand with renewable energy technologies since many renewable energy sources are intermittent. However, unless the energy storage and retrieval mechanisms are close to 100% efficient, this will detract from the system by wasting energy. Nevertheless, certain situations such as grid power outages or a solar-powered base on the Moon will require energy storage. There are many different ways to store energy, including liquid fuels such as the gasoline in our cars or hydrogen gas compressed into a canister.230 Only those technologies most suitable for storage and retrieval of electrical energy will be discussed in this section.
4.3.12.1 Batteries
Batteries are the ‘technology to beat’ for energy storage. They are a big part of modern life from cars to cell phones to laptop computers. Various technologies are used in different applications. Lead-acid batteries are used in almost all vehicles and in many stationary applications. Alkaline batteries are popular in small consumer products where disposable batteries are frequently used. In terrestrial applications where high energy density and recharging is important, lithium-ion technology has become popular.
Large-scale batteries called flow cell batteries may soon help strained electric power grids by storing large amounts of electrical energy. Besides reducing demand on peaking plants, which usually burn

52
natural gas, these devices could improve prospects for intermittent renewable power generators such as solar and wind. Tennessee Valley Authority’s Public Power Institute is directing an English company, Regenesys, in the installation of a large flow cell battery at Columbus Air Force Base in Mississippi. The battery will use tanks storing nearly 4 million liters of a sodium-based electrolyte and 24,000 fuel cells, which have half mm thick ion exchange membranes. The round trip charge/discharge efficiency is expected to be 60-65% and the cost is estimated at $2000/kW.231
Batteries have some environmental issues that will not be discussed in detail here, but these are primarily associated with disposal at the end of the useful life of the product. Life extension and recycling of batteries should be done wherever possible. A technique to rejuvenate sulfated lead-acid batteries is described in Home Power magazine.232
4.3.12.2 Hydrogen
Hydrogen gas (H2) is not an easily extractable primary energy source. Hydrogen can be extracted from hydrocarbon fossil fuels using chemical reformers, but more aptly hydrogen can be thought of as an energy carrier. Hydrogen sources, storage and transmission are discussed here, whereas hydrogen using technologies such as fuel cells are discussed elsewhere, including section 4.4. A great deal of information about fuel cells and hydrogen can be found at http://www.fuelcells.org.
One incremental development scenario is to introduce hydrogen from renewable sources into our existing infrastructure. Hydrogen is already added to the heavy components of crude oil and to coal to make our fuels. Refineries use massive amounts of hydrogen to make gasoline and diesel, and they need more and more as crude becomes heavier and regulations become tighter. Right now, much of this hydrogen comes from converting water and hydrocarbons to CO2 and H2using our carbon resources and putting CO2 into the atmosphere. If the refineries used H2 from renewable energy sources, then higher-quality fuels could be made with less pollution and oil or carbon use. The refinery/power plant equipment needed to use the hydrogen is already in place. Development of renewable energy systems is the main new component required to bring this to fruition, but advances in hydrogen production from water would also help. The technology that has been used to accomplish this for many years is electrolysisthe chemical splitting of water molecules with electricity.
Hydrogen Sources: Fossil fuels would provide a ready source of hydrogen and minimize changes in our energy supply infrastructure; however, stripping hydrogen from hydrocarbons leaves many of the same environmental sustainability issues associated with fossil fuels. For years, futurists have envisioned a “hydrogen economy” versus our current carbon-based energy system. When pure hydrogen is used, in a fuel cell for example, no air pollution or greenhouse gases are producedthe only product is water. Subsequently, water (H2O) can be split through a process known as electrolysis yielding hydrogen for reuse. If clean renewable energy resources provide the electricity required for electrolysis, the energy cycle is pollution-free and sustainable (see Figure 4-6).233
A demonstration of the clean hydrogen economy concept is being planned at the University of California’s White Mountain Research Station. It is expected to be the first sizeable stand-alone system that combines renewable energy sources with hydrogen production and storage. The project is expected to cost $2–3 million for the 150 kW peak (50-80 kW average) power system, but this is several times less than it would cost to replace the old power line that runs through the world’s oldest forest to the high-elevation research facility.234
Recently, at a Renewable Hydrogen Forum, the American Solar Energy Society brought together recognized experts in the field to highlight the role renewable energy resources like solar, wind and biomass can play in the production of hydrogen. Although the group sees hydrogen as an important energy resource of the future, it is concerned about the source of the hydrogen. The origin of the hydrogen to be used is critical to fulfilling its full promise as an abundant, available and sustainable

53
energy source. Experts at the forum discussed ways to keep the production of this "clean" fuel a clean process and how groundwork for a hydrogen economy is being laid right now. The final report from the Renewable Hydrogen Forum describes how hydrogen must be derived from renewable energy sources to be truly sustainable.235
Currently, most hydrogen production is by catalytic reforming of hydrogen-rich fuels. Fossil fuels, such as natural gas, petrol or heating oil, and biogenic/regenerative fuels, such as wood, alcohol or rapeseed oil, can be used in this process.231
The ideal energy required to produce hydrogen via electrolysis is about 32.9 kW-hr/kg. To run the water splitting reaction at a higher rate (generating more hydrogen in a given time), more voltage must be applied. For commercial electrolysis systems that operate at about 1 A/cm2, a voltage of 1.75 V is required. This translates into about 46.8 kW-hr/kg, which corresponds to an energy efficiency of 70%. Lowering the voltage for electrolysis, which will increase the energy efficiency of the process, is an important area for research.38
The world’s long-term energy trend has been from coal to oil to gas, with each fuel emitting progressively less CO2 per joule of heat. Continuation of the trend would lead to use of H2, a carbon-neutral fuel, but H2 does not exist in geological reservoirs. Energy is required to extract it from other sources such as fossil fuel feedstocks. Most H2 is produced today by steam-reforming of natural gas. Energy can be transferred to H2
with an efficiency of about 72% from gas, 76% from oil, and 55 to 60% from coal. Per unit of heat generated, making H2
from fossil fuel produces more CO2 than burning the fossil fuel directly. H2 manufactured by water electrolysis that is powered by renewable or nuclear sources would be emission free, but is not yet cost
effective.39
The DOE provides data on the current sources for hydrogen production worldwide, which is shown in Table 4-2.233 Most hydrogen produced today is consumed on site, such as at an oil refinery, and is not sold on the market. From large-scale production, hydrogen costs about $0.32/lb if consumed on site. When sold on the market, the cost of liquefying the hydrogen and transporting it to the user must be added to the production cost. This can increase the selling price to $1.00-$1.40/lb for delivered liquid hydrogen. Some users, such as the electronics industry, who require relatively small amounts of very pure hydrogen may use electrolyzers to produce high-purity hydrogen at their facilities. The cost of this hydrogen, which depends on the cost of the electricity used to split the water, is typically $2.20-$4.40/kg ($1.00-$2.00/lb).231
Researchers are looking for new, lower-energy ways to strip hydrogen from water, biomass or other materials. For example, an announcement was recently made that a new lower-cost catalyst made from nickel, tin, and aluminum was discovered that can be used in a process called aqueous-phase reforming, which converts plant byproducts to hydrogen. Scientists at Virent Energy Systems in Wisconsin are collaborating with the University of Wisconsin as part of a National Science Foundation Small Business Technology Transfer grant to develop catalysts for generating fuels from biomass.236 Another process being developed by SHEC Labs uses concentrated sunlight for the solar thermo catalytic production of hydrogen. The process developed by SHEC Labs dramatically lowers the temperature at which hydrogen can be extracted from water using a proprietary catalyst.237
4-6: When Hydrogen Is Generated From Renewable Sources, its Production and Use Are Part of a Clean Cycle
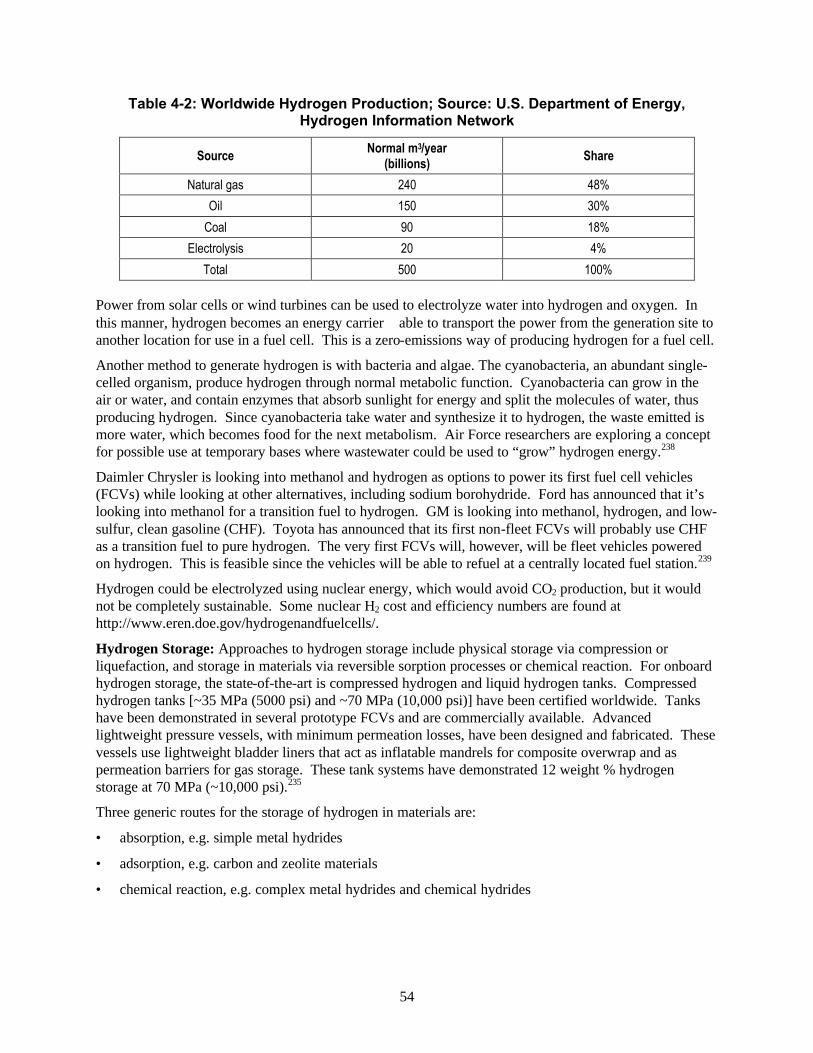
54
Table 4-2: Worldwide Hydrogen Production; Source: U.S. Department of Energy, Hydrogen Information Network
Source Normal m3/year (billions) Share
Natural gas 240 48%
Oil 150 30%
Coal 90 18%
Electrolysis 20 4%
Total 500 100% Power from solar cells or wind turbines can be used to electrolyze water into hydrogen and oxygen. In this manner, hydrogen becomes an energy carrierable to transport the power from the generation site to another location for use in a fuel cell. This is a zero-emissions way of producing hydrogen for a fuel cell.
Another method to generate hydrogen is with bacteria and algae. The cyanobacteria, an abundant single-celled organism, produce hydrogen through normal metabolic function. Cyanobacteria can grow in the air or water, and contain enzymes that absorb sunlight for energy and split the molecules of water, thus producing hydrogen. Since cyanobacteria take water and synthesize it to hydrogen, the waste emitted is more water, which becomes food for the next metabolism. Air Force researchers are exploring a concept for possible use at temporary bases where wastewater could be used to “grow” hydrogen energy.238
Daimler Chrysler is looking into methanol and hydrogen as options to power its first fuel cell vehicles (FCVs) while looking at other alternatives, including sodium borohydride. Ford has announced that it’s looking into methanol for a transition fuel to hydrogen. GM is looking into methanol, hydrogen, and low-sulfur, clean gasoline (CHF). Toyota has announced that its first non-fleet FCVs will probably use CHF as a transition fuel to pure hydrogen. The very first FCVs will, however, will be fleet vehicles powered on hydrogen. This is feasible since the vehicles will be able to refuel at a centrally located fuel station.239
Hydrogen could be electrolyzed using nuclear energy, which would avoid CO2 production, but it would not be completely sustainable. Some nuclear H2 cost and efficiency numbers are found at http://www.eren.doe.gov/hydrogenandfuelcells/.
Hydrogen Storage: Approaches to hydrogen storage include physical storage via compression or liquefaction, and storage in materials via reversible sorption processes or chemical reaction. For onboard hydrogen storage, the state-of-the-art is compressed hydrogen and liquid hydrogen tanks. Compressed hydrogen tanks [~35 MPa (5000 psi) and ~70 MPa (10,000 psi)] have been certified worldwide. Tanks have been demonstrated in several prototype FCVs and are commercially available. Advanced lightweight pressure vessels, with minimum permeation losses, have been designed and fabricated. These vessels use lightweight bladder liners that act as inflatable mandrels for composite overwrap and as permeation barriers for gas storage. These tank systems have demonstrated 12 weight % hydrogen storage at 70 MPa (~10,000 psi).235
Three generic routes for the storage of hydrogen in materials are:
• absorption, e.g. simple metal hydrides
• adsorption, e.g. carbon and zeolite materials
• chemical reaction, e.g. complex metal hydrides and chemical hydrides

55
In absorptive hydrogen storage, hydrogen is absorbed directly into the bulk of the material. In simple crystalline metal hydrides, this absorption occurs by the incorporation of atomic hydrogen into interstitial sites in the crystallographic lattice structure.240
Ammonia would be another way to store hydrogen. It is usually made from natural gas.241
Hydrogen Transmission: Current natural gas lines made of steel could not be used directly for hydrogen, but if, as lines are replaced, proper materials are used, then they could be converted to hydrogen later on.242
Hydrogen Safety: Many believe that one of the barriers to widespread use of hydrogen as an energy carrier is public acceptance. To this end, Rocky Mountain Institute has developed some informational materials on hydrogen.243 In general, hydrogen is neither more nor less inherently hazardous than gasoline, propane, or methane.
Makel Engineering, Inc. is designing a hydrogen sensor for the oxygen generation assembly of the International Space Station in addition to their commercial development efforts.244
4.3.12.3 Flywheels
Improvements in materials, magnetic bearing control and power electronics make flywheel batteries “serious contenders for a variety of important energy storage applications” according to the April 2002 issue of IEEE Spectrum. Applications such as power quality or transportation that require many charge/discharge cycles, but not long term storage, may be most appropriate. Competing technologies include superconducting magnetic energy storage (SMES) and the incumbent, electrochemical batteries. The article reports that Active Power of Austin, Texas will deliver 17 flywheels with a combined power rating of 4.75MW to a company that “needs them for power conditioning and to protect against outages”. The UT at Austin, where a great deal of research is going on, reports the cost of the flywheel battery as $400-$800/kW versus $50-$100/kW for the lead-acid battery, but notes that the life is over 4 times as long and the environmental concerns are less. Some application specific design details are given including a space station application for a 3.6kW unit. The charge/discharge efficiency is 93.7% compared to 80% for the current batteries.245 At UT, a composite flywheel recently set a speed record, spinning at 3,000 miles per hour, demonstrating the capability of storing 70% more energy than the same-sized flywheel made with current technology. The NASA program manager for the project said, “This is an important step toward the routine use of energy storage flywheels in space”.246
Other terrestrial applications are also possible. A hybrid electric bus with flywheel is being tested at UT Austin. Use in cars would require development of a “smaller flywheel that can be constructed economically today”. DARPA, Houston Transit Metro Authority and NASA have funded several projects to address flywheel safety. The U.S. Federal Railroad Administration has a program to develop flywheel batteries for high-speed rail.245
Honeywell International in Tempe Arizona is working on a system designed to provide up to 7.2 MJ of useable energy with a specific energy greater than 150 kJ/kg (42 Wh/kg) at efficiencies greater than 90%. Clarkson University and the University of South Africa are developing flywheel storage for the third of the world that has no electricity but could make better use of solar or wind energy if better energy storage were available.245
4.3.12.4 Ultra-Capacitors
Ultra-capacitors are another energy storage technology that may provide improved sustainability for some applications in the future. TPL, Inc. has done some R&D for Glenn Research Center on high energy density capacitors that have twice the energy density of polypropylene film capacitors.247 Terrestrial applications include short-term solar energy storage for various devices such as the solar refrigerator described in section 4.6.2.2.

56
4.3.13 Backup Power Options
JSC and other similar facilities often require backup-power generation capability in order to support critical loads in the event of a utility outage. This is typically provided by batteries and/or diesel generators, both of which raise some environmental issues.248
4.3.13.1 Uninterruptible Power and Emergency Lighting Systems
Most uninterruptible power supply (UPS) and emergency lighting unit systems now use lead-acid batteries to ensure continued operation of electrical equipment during power outages ranging from a few seconds to several hours. JSC has many small UPS systems for loads like individual computers and communications systems, as well as several larger UPS systems. Building 45, for example, has a 36-volt DC Centaurus Lightguard emergency lighting system.
Four 400 kW UPS systems (2 of which are redundant) can provide temporary backup power to mission control until backup generators can be brought on line.
Flywheel technology, described above, can be applied as a UPS. A 1999 commercialization study found that there is a sizeable market for “flywheel battery-UPS systems” if units can be manufactured in sufficient volume to bring the price down to $150 - $400/kW. The system described would be capable of 250 kW for up to 15 seconds as a ride-through capability to improve industrial power quality.249
4.3.13.2 Alternate Fuels in Existing Generators
In many cases, alternative fuels can be used in existing generators. Bio-fuels are described in section 4.3.11 above. Hydrogen can also be burned in internal combustion engines, but if they were not designed to run on hydrogen, they are not likely to run at peak efficiency with the alternate fuel.
4.3.13.3 Fuel Cells
Another promising device that combines UPS and backup power features is the fuel cell. Larger fuel cell generators such as some described in section 4.4 can be configured to run in parallel with the grid and then pick up selected loads if the grid goes down.
4.3.13.4 Microturbines
Recent development of smaller gas turbines has made this technology a candidate for backup power from a few kilowatts to a few hundred kilowatts. The Capstone MicroTurbine power generation system is about the size of a refrigerator and generates 30 kilowatts of electricity. MultiPac combines up to 10 units (300 kW).250 Other brands include General Electric, Ingersoll-Rand, Solar Turbines, and UTC.
4.3.13.5 Temporary & Remote Solar Power
JSC could make use of renewable energy for temporary or remote power for field monitors, holiday lighting or other applications that currently use portable generators. A solar PV system with regenerative fuel cell would combine power generation and storage into a package that would be useful at a Mars base as well as in many terrestrial applications (see section 4.4).
4.3.13.6 Micro-Grid
A clean, reliable micro-grid electrical system could be implemented at JSC or similar facilities to provide uninterruptible and/or backup power from a central generation point. This could also provide increased energy security for JSC. The costs would be significant new infrastructure for generation and distribution. The benefits would be:
• Elimination of some or all of the 3300 batteries at JSC, which are used in UPSs and emergency lighting units.

57
• Elimination of some or all of the 27 stationary backup diesel generators at JSC, which are used to provide backup power to various buildings during grid power outages.
• Potential improvement in power quality.
• Environmental benefits including reduced requirement for fuel containment and reduced air emissions if cleaner generating sources are used. These could include the various solar and wind generators described in sections 4.3.7 to 4.3.9.
DTE Energy Technologies is planning to develop, construct, operate, and maintain a state-of-the-art Microgrid at the NextEnergy site on the campus of Wayne State University in Detroit. The Microgrid project, fueled by hydrogen, natural gas and sunlight will include the use of several emerging on-site energy technologies, including fuel cells, internal and external combustion engines, miniturbine technology and solar PV. The Microgrid will also include underground electrical and thermal distribution systems to provide electricity, heating and air conditioning to the NextEnergy facility.251
The Nextek power system is a flexible electrical power control system that allows the replacement of AC lighting ballasts with centralized DC ballasts while using existing wiring.252 It allows easy integration of batteries and solar panels in a DC bus. At JSC, it might find application in a new building if solar PV panels were part of the project. Retrofit applications do not look attractive for JSC due to recent replacement of AC ballasts, emergency lighting requirements and the expense of working above asbestos ceiling tiles.253
4.4 Fuel Cells Fuel cells could have been described under the Energy section above, but they are not an energy source in and of themselves. Rather, they are an energy conversion device, combining hydrogen and oxygen to form water in a chemical reaction that produces electricity and heat. Potential sources of hydrogen for fuel cells and technologies to store that hydrogen were discussed above in section 4.3.12.2. Fuel cells could also have been listed by application such as building power or transportation. Since there are several ways to look at fuel cells and there is presently a great deal of interest and research activity on fuel cells, they are listed here under their own technology area.
Sir William Grove built the first fuel cell in 1839, but serious interest in the fuel cell as an electricity generator did not begin until the 1960's, when NASA developed fuel cells for the Gemini and Apollo spacecraft. Fuel cells provide electricity and potable water for the Space Shuttle today and are beginning to appear in many commercial applications on Earth. “An Introduction to Fuel Cells and Hydrogen Technology” is available on the fuelcellstore.com Web site254 and Table 4-3 presents some characteristics of different types of fuel cells.
Any hydrogen-rich material can be used as a fuel source for fuel cells. This includes fossil fuels – methanol, ethanol, natural gas, petroleum distillates, liquid propane and gasified coal. Hydrogen is produced from these materials by a process known as reforming. Usually, fuel is combined with steam by vaporizing them together at high temperatures, but this requires energy. Hydrogen is then separated out using membranes. Another type of reformer is the partial oxidation reformer. CO2 is emitted in the reforming process, which means it is not emission-free.
4.4.1 Types of Fuel Cells
4.4.1.1 Phosphoric Acid
The phosphoric acid fuel cell (PAFC) was the first commercially available fuel cell. It operates at temperatures of approximately 200ºC, and at pressures from 1 atmosphere to 8 atmospheres. The fuel cells require hydrogen for fuel, as well as noble metals for catalysts. The PAFC operates in a manner similar to the Proton Exchange Membrane (PEM) Fuel Cell (PEMFC), except that the electrolyte is pure phosphoric acid, held in a compatible matrix. Stacks and systems have been produced with capacities as

58
large as 1000 kW. Since the fuel of choice for these large fuel cells is natural gas, a reformer is needed to supply the PAFC with hydrogen rich reformate. The PAFC, unfortunately, is adversely affected by other materials that are present in the typical reformate streams. Its operating life is also adversely affected by high temperature operation. Since the overall efficiency of a PAFC system can be significantly increased by including some subsystem that can utilize the waste heat of the PAFC stack, and the “value” of that waste heat increases with increasing temperature, there is typically a trade off which must be made to provide for the appropriate operating life of the fuel cell stack and the overall efficiency of the PAFC and waste heat utilizing subsystem.
The DOD completed an effort to install PAFCs at some 30 U.S. DOD locations between 1994 and 1997. They provide a Web site with performance data for electrical efficiency, system availability, and methods for use of waste heat.
4.4.1.2 Proton Exchange Membrane
The PEMFC has become one of the most technologically advancing fuel cells in the last decade. It operates at temperatures of approximately 60ºC, and at pressures from 1 atmosphere to 8 atmospheres. The fuel cells require hydrogen for fuel, as well as noble metals for catalysts. The PEMFC uses a fluorinated sulfonic acid polymer, or other similar polymer, as the electrolyte material. A considerable amount of technology development in recent years has been in the development of reformer systems that would allow the use of hydrocarbon fuels with PEMFCs for transportation applications. Unfortunately, even if the technical limitations of such systems can be overcome (and that has proved to be a daunting task), the overall efficiency of these reformer/PEMFC transportation systems will only be slightly greater than the current internal combustion engine capability. As the world’s technology development switches towards hydrogen as a fuel, the PEMFC should prove to be in a position of readiness to support transportation applications. What remains to be overcome is the completion of a hydrogen generation, storage, and distribution infrastructure.
Ballard Power Systems of Burnaby, BC, operated a PEMFC running on pure hydrogen and oxygen under contract with NASA in 1998 for just over 11000 hours while producing current at 500 to 800 amps per square foot. There was very little fuel cell performance degradation over this period.
4.4.1.3 Solid Oxide
The solid oxide fuel cell operates at the highest temperature of all the fuel cell types. Because of its high temperature, precious metal catalysts are not needed. It uses a solid (ceramic) electrolyte, so problems associated with liquid electrolyte management do not exist for this type of fuel cell. Most of the problems associated with this fuel cell have to do with structural and material properties at high temperatures. A particular tubular geometry for the fuel cell is currently the most advanced configuration for this type of fuel cell. With this configuration, the fuel cells are arranged such that the oxidizer (air) is exposed to the cathode at the inside of the tubes, and the fuel is exposed to the anode at the outside of the tubes. The tubular fuel cells are then mounted in a framework that provides for conduction of electrical power away from the cells, while at the same time allowing for thermal movement of the cells relative to the supporting framework. In the future, the solid oxide fuel cell should be one of the more successful fuel cells as far as natural gas utilization in the utility area is concerned, provided that issues related to thermal stresses and waste heat utilization can be overcome.
4.4.1.4 Molten Carbonate
The molten carbonate fuel cell has recently been developed commercially. It utilizes a liquid mixture of various carbonates suspended in a graphite matrix. Its internal cell reactions are slightly more complicated than the other types of fuel cells. For this fuel cell, CO2 is consumed at the cathode. At the
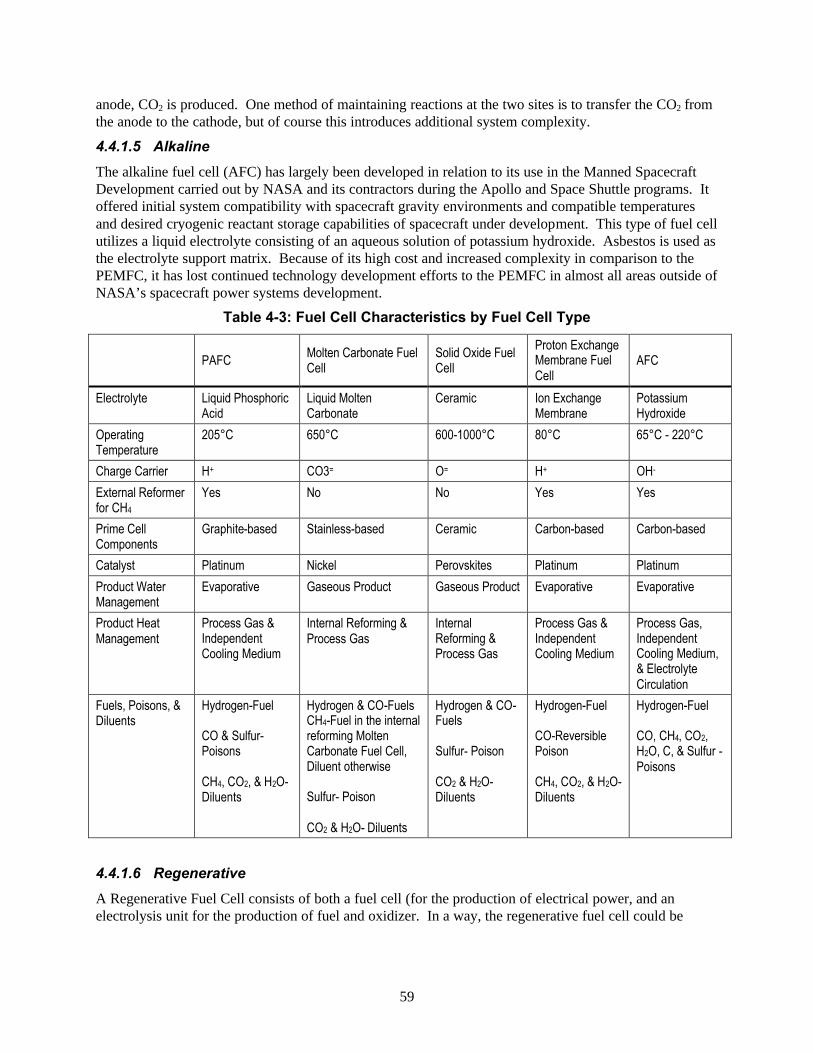
59
anode, CO2 is produced. One method of maintaining reactions at the two sites is to transfer the CO2 from the anode to the cathode, but of course this introduces additional system complexity.
4.4.1.5 Alkaline
The alkaline fuel cell (AFC) has largely been developed in relation to its use in the Manned Spacecraft Development carried out by NASA and its contractors during the Apollo and Space Shuttle programs. It offered initial system compatibility with spacecraft gravity environments and compatible temperatures and desired cryogenic reactant storage capabilities of spacecraft under development. This type of fuel cell utilizes a liquid electrolyte consisting of an aqueous solution of potassium hydroxide. Asbestos is used as the electrolyte support matrix. Because of its high cost and increased complexity in comparison to the PEMFC, it has lost continued technology development efforts to the PEMFC in almost all areas outside of NASA’s spacecraft power systems development.
Table 4-3: Fuel Cell Characteristics by Fuel Cell Type
PAFC Molten Carbonate Fuel Cell
Solid Oxide Fuel Cell
Proton Exchange Membrane Fuel Cell
AFC
Electrolyte Liquid Phosphoric Acid
Liquid Molten Carbonate
Ceramic Ion Exchange Membrane
Potassium Hydroxide
Operating Temperature
205°C 650°C 600-1000°C 80°C 65°C - 220°C
Charge Carrier H+ CO3= O= H+ OH-
External Reformer for CH4
Yes No No Yes Yes
Prime Cell Components
Graphite-based Stainless-based Ceramic Carbon-based Carbon-based
Catalyst Platinum Nickel Perovskites Platinum Platinum
Product Water Management
Evaporative Gaseous Product Gaseous Product Evaporative Evaporative
Product Heat Management
Process Gas & Independent Cooling Medium
Internal Reforming & Process Gas
Internal Reforming & Process Gas
Process Gas & Independent Cooling Medium
Process Gas, Independent Cooling Medium, & Electrolyte Circulation
Fuels, Poisons, & Diluents
Hydrogen-Fuel CO & Sulfur- Poisons CH4, CO2, & H2O- Diluents
Hydrogen & CO-Fuels CH4-Fuel in the internal reforming Molten Carbonate Fuel Cell, Diluent otherwise Sulfur- Poison CO2 & H2O- Diluents
Hydrogen & CO-Fuels Sulfur- Poison CO2 & H2O- Diluents
Hydrogen-Fuel CO-Reversible Poison CH4, CO2, & H2O- Diluents
Hydrogen-Fuel CO, CH4, CO2, H2O, C, & Sulfur - Poisons
4.4.1.6 Regenerative
A Regenerative Fuel Cell consists of both a fuel cell (for the production of electrical power, and an electrolysis unit for the production of fuel and oxidizer. In a way, the regenerative fuel cell could be

60
called an electrically rechargeable fuel cell. Two types of electrolysis units that are commercially available are the Proton Exchange Membrane and the Alkaline-based.
North American electrolysis manufacturers include Stuart Energy Systems in Toronto, Canada, Teledyne Brown in Maryland, Proton Energy in Rocky Hill, Connecticut, and Hydrogen Systems in Montreal, Quebec Canada. DOE’s Hydrogen, Fuel Cells & Infrastructure Technologies Program is working with partners to accelerate the development and successful market introduction of technologies such as these.Error! Bookmark not defined.
One photovoltaic/wind/regenerative fuel cell effort is reported at http://www.palcan.com/s/ NewsReleases.asp?ReportID=43935. Also, Proton Energy Systems, Inc. has been awarded a contract to develop a 1-kW regenerative solar/fuel cell system to demonstrate use of a grid-independent power plant that generates electricity in a closed-loop system from renewable, non-polluting resources. The contract, with Jacobs Sverdrup Technology, Inc., a subcontractor to the U.S. Navy, will support testing at the Naval Air Weapons Station at China Lake, California. The demonstration system will integrate Proton's UNIGEN® Regenerative Fuel Cell System, which includes several subsystems, including a hydrogen generator, hydrogen storage tanks, a PEMFC, and a Navy-supplied solar PV array.255
4.4.2 Fuel Cell Research
4.4.2.1 Department of Energy, Department of Defense
Both the Department of Energy and the DOD have a long legacy of research and project development in the area of fuel cells. Their scope is too great for this document. The reader should reference Web sites and other sources in order to gain additional insight into these developments. Much of the current technology development level of fuel cells in general has been brought about in large part by government-funded projects that have provided the “push” where it was not commercially available. In one example, the U.S. Department of Energy selected DTE Energy as its partner in a first-ever hydrogen power park project. The system will run on hydrogen generated from renewable resources. During off-peak operating hours, electricity from landfill gas or conventional central-station power (as a benchmark) will be used in an electrolysis process to produce hydrogen gas from pure water. The hydrogen will be compressed and stored for later use. During peak operating hours, the stored hydrogen will be used to operate a 50-kW fuel cell and a 25-kW Stirling Engine or advanced reciprocating engine. The electricity produced will be used to offset the normal energy requirements of a typical office park, while the heat generated will be used to supplement existing heating and cooling systems.256
4.4.2.2 NASA Efforts
NASA’s Gemini program used PEMFCs for all of its missions except the first three. General Electric was the contractor for the Gemini fuel cells. Because of delays in the development of the General Electric PEM fuel cell, batteries were needed for the first 3 Gemini missions. The Apollo program contracted with Pratt & Whitney Aircraft to develop a high-temperature alkaline fuel cell power plant for the Command and Service Module. This power plant successfully carried out the Apollo missions, but proved to be difficult and costly to start and operate. For the Space Shuttle, International Fuel Cells of United Technologies Corporation produced a lower temperature alkaline fuel cell that produced almost ten times the power of the Apollo alkaline fuel cell while having just slightly more weight. Because of high cost for maintenance and refurbishment, and to counter certain obsolescence issues, NASA began an effort in 1998 to develop an upgrade to the Shuttle alkaline fuel cell by replacing it with a PEMFC. Two conceptual design contracts were awarded to International Fuel Cells and Allied Signal Corporation for the Shuttle fuel cell upgrade. An option was awarded to these two contractors to also develop cost and schedule estimates for development, qualification, and delivery of power plants based on their conceptual designs. At the same time, NASA produced an in-house estimate of the total cost to retrofit the Shuttle fleet with PEMFC power plants; these estimates proved to be too costly for the Shuttle program.
61
At about the same time, a proposal was made to the Space Shuttle program to produce a 5000-hour, long life alkaline fuel cell that could be retrofitted into the existing fleet of Shuttle Orbiters. A NASA PEMFC team kept alive some in-house development tasks following the end of the Shuttle Upgrades effort of 1998. NASA’s Space Launch Initiative asked for proposals for technology advancement in the area of Next Generation Launch Technologies. A NASA-led Proton Exchange Membrane development program was selected for funding. During this effort, two contractors were selected to provide breadboard PEMFC power plants with power production capability of 1-6 kW using hydrogen and oxygen. Gravity-independent operation was not required for the breadboard units. Following delivery to NASA and evaluation by NASA, one vendor was selected to produce an engineering model. At the beginning of the contract award for the engineering model option, NASA added requirements to the selected vendor to provide for gravity-independent-operations capability for the engineering model for its final delivery configurations. Teledyne Energy Systems, Inc. is the current vendor producing the gravity-independent PEMFC engineering model for this effort. Their status for the breadboard unit that they delivered to NASA is given at: http://www.teledyne.com/news/5kpem.asp. Their status on the engineering model development is given at: http://www.teledyne.com/news/nasa-pem.asp.
NASA has also developed in-house fuel cell power systems, component-level subsystems, and has a significant institutional fuel cell development, test, and evaluation base and expertise from which to work. In addition, NASA has developed and evaluated both commercially- and contractually-acquired fuel cell system components and subsystems.
4.4.2.3 Non-government Activities
The U.S. Fuel Cell Council is an industry association dedicated to fostering the commercialization of fuel cells in the United States.257 They offer information and tools to estimate fuel cell energy costs given fuel, load, and other user input.
In September 2002, the Houston Advanced Research Center (HARC) announced that they had successful connected a 5-kW Plug Power PEMFC system into the electric grid. HARC stated that they believed that this was the first residential-size fuel cell to be connected to the grid in Texas using mandated interconnection codes.258
Fuel cells are another promising area for the use of MEMS technology.259 Several groups are working in this area, such as Case Western Reserve University, which sees applications in everything from automobiles to cell phones to computers.260
4.4.3 Fuel Cell Issues
Hydrogen sources, storage, transmission, and safety were discussed in section 4.3.12.2. These factors as well as other technical and non-technical issues will shape our energy future and ultimately determine if and when we convert to a “hydrogen economy.”
4.4.3.1 Technical
Technical issues related to fuel cells reach into a very wide variety of areas. These include process control, instrumentation, fluids, electrical power distribution, environmental and economic planning, etc. The scope of these issues (and others that are not listed) covers a large range, depending on the particular fuel cell application.
4.4.3.2 Safety
As stated earlier in this report, the safety of hydrogen does not differ significantly in magnitude from gasoline. Of course, the safety of fuel cell systems will be directly related to the particular configuration of these systems on an individual basis.

62
4.4.3.3 Reliability
Plug Power has announced the completion of its fuel cell demonstration program at the Watervliet Arsenal (NY), which was funded by the DOD. The company's ten grid-parallel 5-kW fuel cell systems operated for more than 80,000 hours and generated approximately 210,000 kWh of electricity throughout the year demonstration. The systems operated at or above 94% average availability during the year, exceeding the contract requirement of 90%.261. As more fuel cell systems are put through the paces of commercial demonstrations, the general reliability of fuel cell systems is destined to increase. Also, as the transition is made more towards hydrogen-fueled fuel cell systems from fossil-fuel/reformate fueled fuel cell systems, the reliability of these systems will increase further because the overall system complexity will be significantly reduced.
4.4.3.4 Environmental Performance
One of the most significant contributions to the overall global energy picture that fuel cells have is the potential to bring forth an energy-equalizing capability. Given the production and use characteristics of hydrogen, the opportunities for control at the individual person’s level is considerably more than has been realized with the fossil fuel technologies that are currently in use. And, by their very nature, these technologies are inherently sustainable and environmentally benign.
4.4.4 Commercial Availability of Fuel Cells
In just the past five years, a significant change has occurred in the commercial availability of fuel cell systems. There are now several fuel cell power modules or systems available to original equipment manufacturers. New companies have come on line, companies have merged, and many companies are now actively pursuing commercial agreements and sales. At least one of the major U.S. automakers stated at a recent HARC sponsors meeting that his company had recognized that the key to removing all of the environmental and sustainability questions and concerns from the automotive market was with the hydrogen fuel cell powered automobile.
The commercial availability of fuel cells is expected to increase in both numbers of commercial product suppliers and in commercial viability in the next several years. Because of the current pace of evolution of this market and its expected increase in rate in the next 5 to 20 years, a listing of commercial vendors would be just a snapshot of a particular point in time. At this time, many of the commercial suppliers are producing commercial demonstrators.
4.5 Sustainable Habitats Green building is catching on as people begin to realize that investments in good building practices up front lead to financial benefits not only in terms of energy savings, but also improved occupant productivity.
“Green building” is a colloquial term for building practices that are environmentally sound and holistic. The same principles are often called “sustainable design”. As an example of green building, the White House installed several solar energy systems in 2002.262 JSC began design in 2003 of its first new building to be certified “green.”
A 2001 NASA report110 on sustainable design lists the essential elements of sustainability as:
• Energy efficiency and water conservation
• Site selection to minimize environmental and transportation impact
• Sustainable materials (i.e., reused, recycled, recyclable, non-toxic, low embodied energy content, renewable)
• Durable and efficient materials and equipment
63
• A healthy environment, including indoor air quality
• Features in support of enhanced worker productivity
• Design for personnel safety and security
• Design for decommissioning and disposal
• Enhanced building operating and maintenance characteristics (i.e., Design for Maintainability, continued efficiency, and low toxicity)
• A philosophy that defines facility operational objectives, then tests and verifies that all building systems and components have been properly installed and perform to the level intended (i.e., Total Building Commissioning).
Energy-efficient building and office design offers the possibility of significantly increased worker productivity according to a paper by the DOE and the Rocky Mountain Institute.263 The paper documents eight cases where green building increased productivity.
According to a Lawrence Berkeley study, “the potential direct increase in office workers’ performance was estimated to range between 0.5 and 5%. For the U.S., the corresponding annual health-care savings plus productivity gains are $6 to $19 billion from reduced respiratory disease, $1 to $4 billion from reduced allergies and asthma, $10 to $20 billion from reduced sick building syndrome symptoms, and $12 to $125 billion from direct improvements in worker performance that are unrelated to health.”264 For example, NASA and others have studied the benefits of plants on indoor air quality.265
Since green building is really a collection of technologies and practices that basically make people think twice about the value of positive indoor and outdoor environments, the green building movement may be one of the most successful applications of sustainability principles to an entire industry. Though not a complete list, several “green building” technologies are discussed below. For more information, the U.S. Green Building Council and others offer excellent Internet resources. The Leadership in Energy & Environmental Design (LEED) Green Building Rating System™ has been developed by the Green Building Council to help rate the “green” performance of buildings.266
NASA has recently adopted the policy to do sustainable design on all new buildings and renovations.
Building deconstruction, as opposed to demolition, is a technique that helps save materials, however lead paint and asbestos have made this too costly to do at JSC.
4.5.1 “Green” Products and Sources
Fly ash concrete, used by JSC, is one example of a product that takes waste (from coal power plants) and makes a building product that is actually stronger than regular concrete. The Sustainable Building Sourcebook is one good reference that describes products in the areas of water, energy, building materials and solid waste.267 Other Web sites with a great deal of good information on green building include:
• http://www.ci.austin.tx.us/greenbuilder/
• www.bre.co.uk
• www.sustainable.doe.gov
• http://www.rebuild.org/index.asp
• www.richardrodgers.co.uk
• www.solarcentury.co.uk
• http://www.rkmfg.com/grassypavers.asp (grass parking lots)

64
• http://www.controlledenergy.com/ (point of use water heaters)
• http://www.syndesisinc.com/ (Syndecrete ®)
• Shade cloths – Forbis Energy Solutions, Inc. (254)498-4410
4.5.2 Low Heat Gain Roofs
White roofs or “cool roof” applications are getting a big push in Texas recently. A cool roof application does not need to be white; it is simply one that causes low heat gain into the building. The key is the albedo (i.e. reflectivity) and emissivity of the product. A cool roof application will cost more than a built up roof but it can also be cheaper than some metal roofs. However, the cool roof will have lower temperatures allowing for a reduction in air-conditioning required.
Modern materials have been used to address the problem of light colored roofs getting black over time. According to Peter DeAntonio of Sarnafil, market share for reflective roofs has grown from 9% to 12% in just the past 3 years.268
The DOE did a study of a retail store in Austin, Texas, in which an original black rubber membrane was replaced with a white thermoplastic resulting in a decrease in the average maximum roof surface temperature from 76ºC (168ºF) to 52ºC (126ºF). Total annual energy demand savings were estimated to be $7200. Based on cost data provided by the building manager, the payback is instantaneous with negligible incremental combined labor and material costs.”269
A recent report by Lawrence Berkeley National Laboratory found that in Houston the potential annual energy savings of heat island reduction strategies “are estimated at $82 M, with an avoidance of 730 MW in peak power and a reduction in annual carbon emissions of 170 ktC.” The heat island reduction strategies modeled were shade trees, high-albedo roofs, and urban reforestation with high-albedo pavements and building surfaces. Of these total savings estimates, $38.3 M, 523 GWh of electricity, and 80,000 metric tons of carbon emissions were due to increasing the reflectivity of roofs from 20% to 50% (residential) and 60% (commercial).270
JSC is moving toward implementation of cooler roofing as part of sustainable design. This will probably come through incorporating an Energy Star requirement in roofing specifications. The Energy Star Web site also has a savings calculator available for roofing. In Houston, the humid climate promotes mold growth, so the long-term performance of a white roof must be considered as well as their initial performance. Ways to treat these surfaces so that they retain their reflectivity better over time is an important technology area.
Another strategy that can reduce cooling and heating costs as well as help with storm water management is the use of vegetative roof cover or “roof gardens.” Water runoff can be reduced by 50% or more and improved acoustics and durability are other advantages.268 Well done roof gardens, are expected to last 30-50 years. Chicago City Hall recently completed a major renovation with a roof garden. Roof gardens may even play a role in gray water reuse in the future. See Section 4.9 for technologies that NASA and others are researching.
4.5.3 Windows
Window technology has made great strides in recent years. "Superwindow" is a term used for double or triple-paned windows filled with argon or krypton gas having a nearly invisible low-emissivity coating. They offer R-values of 4.5 to almost 12. Superwindows also block noise and protect interior finishes from UV damage. Though they cost more, they save heating and cooling energy.
Kalwall Corporation271translucent Aerogel doubles light transmission and thermal insulation over other technologies and can form walls or roofs of structures. Nanogel translucent insulation by Cabot Corporation272 is designed for daylighting.271,272

65
4.5.4 Lighting
4.5.4.1 LEDs
Lighting is a $12 billion worldwide market. White light-emitting diodes (LEDs) are expected to become more common as efficiency and brightness improve. White LEDs have been investigated for the Space Shuttle as well as for buildings on Earth. Solid-state lighting “could reduce total electricity consumption in the U.S. by 10% and cut carbon emissions by the equivalent of 28 million tons per year” according to Smalltimes magazine.273 Lumileds Lighting, for instance, has just released the Luxeon III light source, which uses LEDs to produce up to 80 lumens of white light while consuming about 3.9 watts of power. That's still fewer lumens per watt than most compact fluorescent lights, but more energy-efficient than an incandescent light. For instance, a 60-watt incandescent bulb typically produces about 900 lumens, or about 15 lumens per watt, compared to 20.5 lumens per watt for the Luxeon III LED light.274 Other companies are studying nanoengineered organic LEDs, made from carbon based molecules instead of semiconductors.
Stoplights are already a good application for the use of colored LEDs. Besides their energy saving properties, they also reduce maintenance costs because they last longer.
4.5.4.2 Daylighting
Using natural light or “daylighting” is an effective way to reduce energy consumption in buildings and improve the indoor environment at the same time.275 Daylighting is more easily incorporated into new buildings than old, but there may also be some opportunities for retrofit at JSC.
4.5.4.3 Exit Lights
LED exit signs that replace or convert incandescent or compact fluorescent exit signs save energy. Energy Star-labeled products operate at a maximum power of 5 W.276 When existing signs use two 20-W incandescent lamps, the savings for each sign is 35 W. Exit signs operate 24/7/365 (8760 hrs/yr), so the energy savings ($25 at $.08/kWh) pay back the purchase and installation of new signs in less than 3 years.
An even lower power option for exit lights may exist thanks to some technology used on the Space Station. Luna Technologies International, Inc. has developed a line of glow-in-the-dark signs based on advances in photoluminescent technology that result in 15 to 25 times greater brightness. LUNAplastTM delivers 400 to 600 millicandellas initially and glows up to 30 hours. It meets the National Fire Protection Association’s 101-Life Safety Code as a replacement for conventional exit signs.277
4.5.5 Landscaping
4.5.5.1 Water Reuse
Grey water from sinks, showers, and washing machines can sometimes be reused for irrigation. However, some questions remain about this “new,” though old, concept. The Texas Water Resources Institute has some information about this topic and the debate in Texas over the legal definitions of greywater and blackwater.278 NASA R&D dealing with water recycling is described in section 4.9 below. At JSC, it might also be possible to purchase treated water from Clear Lake City Water Authority at a discounted rate for use in irrigation or possibly cooling towers. The Water Wise Council of Texas offers water saving advice for proper irrigation and selection of native plants.
4.5.5.2 Paving
Pervious pavement is one way to reduce water runoff and heat island effects. Several products are now available for parking lots and similar areas.279 A recent example of this in Houston is the parking lot of the new football stadium.280

66
4.5.5.3 Lawn Care Equipment
Cleaner technologies for lawn care and landscaping will help improve air quality in cities. As mentioned in section 4.1, part of the plan to reduce air pollution in Houston is to prohibit the use of spark ignition engines below 25 horsepower between 6 am and noon during summer starting in 2005. With a little bit of technology development, it may be possible for JSC to develop fuel cell powered lawn mowers and landscape carts that would save the landscaping crews from these restrictions. A concept for packaging the fuel cells in the space currently occupied by batteries in electric cart models is show in Figure 4-7.281
4.6 Thermal Control
4.6.1 Air-Conditioning Systems
Houston, Texas, is reportedly the most air-conditioned city in the world.282 JSC, like many large building complexes, uses large electric and steam turbine driven chillers and a chilled water distribution system to air-condition its buildings. However, many buildings, which do not have access to the central system, have their own direct expansion units and a few have their own chillers.
In the central plants, about 0.6 kW/ton of cooling2 is required for the electric chillers and 11 lb of steam per ton3 is required for the turbine driven chillers. Chilled water leaves the central plant at 42°F and returns at 52°F.283
Berkeley Lab provides advice for chiller replacement projects at http://ateam.lbl.gov/coolsense/index.htm.
4.6.1.1 Refrigerants
Most modern chemical refrigerants are less than 50 years old. Unfortunately, certain types, such as chlorofluorocarbons or “CFCs” were discovered to cause major environmental problems only after millions of kilograms were released into the Earth’s atmosphere. The resulting hole in the ozone layer is discussed in section 1.1.7. Even though humanity is on the road to recovery from this environmental ill, there is always room for better refrigerants in terms of better thermal performance, which in turn reduces energy impacts on the environment.
Recovery of class I and class II ozone-depleting substances (e.g., CFC-12), used as refrigerants, is required under EPA regulations (40 CFR 82, Subpart F). Additionally, recovery of substitutes of class I and class II substances (e.g., HFC-134a) are also required as of November 1995 under Section 608 of the CAA.
Several non-ozone-depleting refrigerants are available commercially.284 HC-12 and HC-22 are two natural and environmentally friendly hydrocarbon refrigerants that operate at lower pressures than 134a285; however, flammability concerns have precluded their use in the U.S.
JSC is still in the process of phasing out CFCs completely as they had many uses, not only as refrigerants. Refrigerants developed as non-toxic alternatives for spacecraft may be useful at JSC.
2 A ton of cooling is 12,000 BTU/hr 3 New steam turbine chillers being planned will require 6-7 lb of steam/ton
4-7: Fuel cells could be placed under the seat to power an electric cart for landscape use

67
4.6.1.2 Refrigerant Additives
Polarized Refrigerant Oil Additive (PROA) is a technology developed within the last 20 years, designed to reduce energy consumption in air-conditioners by treating internal metal surfaces to improve heat transfer. It is added like refrigerant or oil by a technician and has been reported to reduce energy consumption about 10 – 30 % in most units. The effect is greater, the older the unit. There are several brands on the market and economic payback times as low as 1-2 years are reported.
As with any new product, questions exist about performance and long-term effects. Conflicting information was found about the technology. For this reason, JSC initiated a test of several products in 2003. Additional information will be provided in the Appendix, to be published internally in a later revision.
4.6.1.3 Arctic Master
In the JSC test mentioned above, a device called Artic Master that is reported to save energy in refrigeration systems was also evaluated.286 The device is designed to reduce the compression ratio required of the compressor by inducing a passive vortex pumping action. The JSC test of one 10-ton unit did not demonstrate energy savings, but others have reported significant energy savings.287 At this time it is unknown why the device seems to work only in certain situations.
4.6.1.4 Microelectromechanical Systems for Cooling
One way to reduce concerns over chemical refrigerants would be to significantly reduce the quantities used in refrigeration systems. This may be possible through the use of MEMS technology. Since small distances allow better heat transfer, it may be possible to get high cooling rates from smaller refrigeration equipment with MEMS techniques. Jet Propulsion Laboratory is investigating a MEMS-based pumped liquid cooling system for deep space probes with power levels of 10 to 50 watts.288 Some other organizations developing or tracking MEMS cooling technologies are:
• Cool Chips http://www.coolchips.com/
• Pacific Northwest Lab http://www.pnl.gov/microcats/
• JSC Engineering Directorate http://mems.jsc.nasa.gov/
• JSC SR&QA Directorate http://wwwsrqa.jsc.nasa.gov/nano/
4.6.1.5 Centrifugal Chillers
Centrifugal chiller technology generally allows higher efficiency in refrigeration systems due to lower mechanical friction and the absence of inlet and exit port valves. However, centrifugal chiller costs are usually higher and peak efficiency range may be more limited. For example, the York 700-TR centrifugal chiller equipped with an OptiSpeedTM variable speed drive can have significant energy benefits.289 Mainstream Engineering290 has developed 60- and 120-ton, high-speed centrifugal chillers with water-cooling and is working on an air-cooled model.
4.6.1.6 Programmable Thermostats
Programmable thermostats can be used in homes and commercial buildings to reduce energy consumption by relaxing setpoints when air-conditioning or heating is not needed. Buildings at JSC that are not on the central chilled water system could benefit from the installation of programmable thermostats. A peak electric demand reduction was demonstrated at JSC a few years ago as part of a solar heat pump experiment. Overall energy consumption should be reduced as well if programmed to cut back on hot or cool air when the building is not in use.

68
4.6.1.7 Heat Pipe HXs
One way to increase the dehumidification capability of an air-conditioner and save energy was adapted from NASA technology by inventor Khanh Dinh, president of Heat Pipe Technologies, Inc.291 The heat pipes pre-cool the air before it reaches the evaporator coils (or chilled water coils), which increases the amount of moisture that those coils extract. The heat pipes also reheat the outgoing air, which leaves the system just slightly warmer than it would have been had the heat pipes not been there at all. This reheated air is also significantly drier than it otherwise would have been and the process is totally passive. This can be a particularly effective technology in humid climates such as Houston.
4.6.1.8 Heat-Driven Cooling Systems
While the bulk of today’s air-conditioning systems use mechanical compressors driven by electric motors, the earliest refrigeration systems actually used thermal or “heat-driven” thermodynamic processes. Chemical processes such as absorption and adsorption can be used to produce cooling effects.292 Large absorption chillers are commercially available and are used in many large facilities, but not at JSC. Since they are typically driven by high temperature heat produced by combustion of natural gas, their popularity depends on energy prices in the region as well as operations and maintenance considerations.
If heat from renewable sources or so called “waste heat” from other energy processes can be used in a heat-driven cooling system, then these technologies become much more interesting from an environmental perspective. Research and development that allows these devices to operate with lower grade (i.e. lower temperature) heat and at higher efficiencies will promote their increased use.
A new technology by Energy Concepts Company applies advancements in absorption-refrigeration technology to produce either refrigeration or power from low-level waste heat sources. 293 The dual-function absorption cycle converts waste heat that is 250°F to 650°F to electric power and/or refrigeration. A closed-flow loop with a transfer fluid collects waste heat from several sources into a centralized absorption cycle. Power is produced when high-pressure ammonia vapor drives a turbine. In the refrigeration mode, high-pressure ammonia vapor flows to a condenser, and the condensate is expanded into an evaporator to produce refrigeration.294
One method that has the potential to increase overall system efficiency is the use of a heat-driven water vapor removal system to dehumidify the air within a building, since a significant portion (25% - 50%) of the cooling load in humid regions such as the Gulf Coast, is due to the condensation of water vapor in the ambient air stream. In this system, fresh incoming air, which typically has a high water vapor content, passes through a desiccant bed that absorbs most of the water vapor. The desiccant bed is then reactivated (water desorption) by using hot air (approximately 200°F), which has been heated by waste heat from another energy system such as the cogeneration systems described in the Energy section. One estimate indicates that desiccant systems can potentially save about 400 trillion BTU of energy each year in U.S. buildings and can prevent the emission of more than 24 million tons of CO2.295
A study was conducted for JSC to evaluate the potential of driving a desiccant dehumidification system with waste heat from a UTC 200 kW fuel cell (see section 4.4.1.1).296 The heat-driven air-conditioning system, with the fuel cell at full power, can supply 3000 cfm of reactivation air at 205 °F to a 42 inch diameter desiccant wheel. The fresh airflow through the desiccant wheel into a building’s air handling system can be as high as 5000 cfm. This air will be at temperature of 114 °F with a dew point of 44 °F. As a result, 170 lb/hr of water can be removed and 54 kW of condensation energy savings could be achieved. The net energy savings, which includes cooling the fresh air to room temperature (75 °F), is 37 kW.
Several companies offer solid desiccant systems and a few are working on technology involving liquid desiccants.297, 298, 299, 300

69
4.6.2 Refrigeration
4.6.2.1 Efficiency Improvements
There are many ways to improve the efficiency of refrigeration systems, starting with the household refrigerator/freezer. While most consumers prefer models with the lowest initial cost or certain features, manufacturers have responded with more efficient units each time government standards have been raised. Factor Four2 reports that average energy use per U.S. model decreased by 65% between 1972 and 1993 and shows evidence of why “the super-refrigerator revolution has only just begun.” On the other hand, when there is no motivational force to lower energy consumption, manufacturers seldom push the state of the art. For example, the Energy Star rating for a “commercial” refrigerator/freezer is 2851 kWh per year compared to 511 kWh per year for the same size “residential” unit. The technologies are the same; the only difference is that the government set legislative standards for the one and not the other.301 Perhaps affirmative procurement could be used to get better commercial units for JSC’s cafeterias.
NASA needs efficient refrigerators and freezers for food and scientific sample storage on the Space Station and future outposts. Although requirements such as very high reliability or low noise may occasionally drive a unique technology,302 very often technology developments for space can be applied on the ground. A refrigerator/freezer tested at JSC used about 104 kWh/yr of electricity, compared to 520 kWh/yr for comparably sized commercial models, as shown in Figure 4-8.
Technologies such as vacuum insulation, variable speed DC compressors, better fans and lights, smart defrost and Stirling coolers hold great promise.
0
20
40
60
80
100
120
140
160
0 5 10 15 20 25 30 35
Total Volume, cu.ft.
kWh
/yr
per
cu
.ft.
NASA Solar Refrigerator
Commercial Refrigerators
4-8: Potential for Refrigerator Energy Savings
4.6.2.2 Solar-Powered Refrigeration
On several occasions, NASA has spurred development of solar-powered refrigerators as a spin-off technology.303 In the 1980s, NASA Lewis Research Center (now called Glenn Research Center) carried out a rural PV electrification project in Gabon, Africa, that included four solar-powered medical refrigerators. From 1996 to 1999, three solar refrigerators were developed and tested at JSC based on thermoelectric, Stirling, and vapor compression technologies. 304 The vapor compression system resulted in 3 U.S. patents dealing with a battery-free or “PV-direct” approach.

70
SunDanze Refrigeration, Inc.305 has commercialized a small refrigerator based on this technology and is studying solar refrigeration in transportation applications for the Department of Energy.306 For this application, good structural and good thermal insulation properties need to be combined in addition to the solar-powered cooling system.
In a related effort under a NASA grant to New Mexico State University, 4 solar refrigerators were deployed and field-tested in remote locations with good results. Under the same effort, the feasibility of a solar-powered milk tank cooling system was evaluated.307 This initial study of the economics involved was favorable; however, as with most new technologies, an investment in development and some amount of financial risk will be required to bring it to market. Since NASA does not have a mission requirement for milk cooling, it is hoped that other organizations will pick up development of this technology. Applications would include thousands of small rural dairies around the world.
The Solar/Greenfreeze Vaccine Cooler and Refrigerator (SolarChill) with a solar-powered compressor is the result of a separate development effort in Europe.308 Ice builders & Hydrocoolers are currently used in agriculture. There will likely be many more good applications for solar-powered cooling systems as R&D improves the systems and makes them more economical. Applications for solar-powered refrigeration include:295
• Off-grid and grid-connected refrigerators and freezers
• Refrigerated transport by truck and train
• Field cooling of agricultural produce and milk
• Ice making
• Electric car air-conditioning
• Cooling of field samples or instruments
4.6.3 Thermal Energy Storage
Building thermal energy storage systems use a large chilled water tank or a phase change material generally water/iceto store extra cooling capacity at night for use during the next day when electricity and cooling costs are higher. In a spacecraft, the opposite strategy might be used to take advantage of “cheap” solar power from the sunny side of an orbit. Terrestrially, these types of systems have been available for many years and there are several systems in Houston area buildings, including those of schools, NASA contractors, and the Museum of Natural Science. The motivation for installing such a system is usually economic since many commercial customers pay more for electricity during the day than at night (called peak or demand charges). There is some environmental benefit in that the cooling system runs more efficiently when rejecting heat to the cooler nighttime environment, but there are also system losses due to the extra pumping, colder evaporator (for the ice system), and thermal storage requirements.
JSC has studied the use of thermal energy storage in the past. A study completed in 1995 found that a chilled water storage system for JSC would have a 10.2-year simple payback.309 The 1990s Honeywell ESPC contract report also did not recommend thermal storage as an energy conservation measure. A 2001 study by Shaw Smith & Associates for central plant chiller options again stated, “Thermal storage is not recommended due to the extended payback period”.310 Additional information will be provided in the Appendix, to be published internally in a later revision.

71
4.7 Transportation Urbanization has been a trend that has only accelerated in recent history. As discussed in section 1.1.1.1, this often leads to traffic congestion and wasted time and fuel. Water scarcity and the Internet might reverse the urbanization trend, but it is difficult to predict the future.
The U.S. Department of Energy projects that the number of vehicles in the industrialized world will nearly double to one billion vehicles by 2050. Coupled with the projection of twelve-fold growth in the developing world, it’s forecasted that there will be approximately 3.5 billion vehicles in the world in 2050, five times more than today. In response to these predictions and the increasing environmental and political pressures caused by current vehicles using petroleum, the federal government is making an aggressive push for transportation technology, such as fuel cell cars, to leap ahead. “The day of the hydrogen economy, while not imminent, is now within sight,” according to DOE secretary Spencer Abraham. “It promises the kind of transformation not seen since the 19th and early 20th centuries, when the world experienced the last energy revolution.”311
However, we have a long way to go. With the growing popularity of minivans and SUVs, the overall fuel economy for all U.S. vehicles continued a steady decline that has been under way since the late 1980s, when average fuel economy for all vehicles was nearly 26 miles per gallon.312
Fewer than 6% of new U.S. cars and trucks get better than 30 miles per gallon (mpg), according to the EPA. In 2001, the weighted average of all new passenger cars and trucks was 20.4 mpga 21-year low, according to CNN.313 Information about vehicle fuel efficiency can be found at http://www.fueleconomy.gov/.
As of 2001, there were about 456,000 alternative-fuel powered vehicles licensed in the United States, including those that run on batteries, natural gas and ethanol. Another 40,000 are hybrids, in which a gasoline engine is paired with an electric motor to boost fuel efficiency and reduce emissions. This is a small number compared to the 210 million gasoline and diesel cars and trucks on the roads.304
More efficient automotive power conversion is possible, but emissions also depend on vehicle mass, driving patterns, and aerodynamic drag, as well as “well-to-wheels efficiency” [(torque × angular velocity at wheels)/(fossil fuel power in)]. According to Science Magazine, power trains are typically 18 to 23% efficient for internal combustion (IC), 21 to 27% for battery-electric (35 to 40%, central power plant; 80 to 85%, charge-discharge cycles; 80 to 85%, motor), 30 to 35% for IC-electric hybrid (higher efficiency from electric power recovery of otherwise lost mechanical energy), and 30 to 37% for fuel cell-electric (75 to 80%, reformer; 50 to 55%, fuel cell; 80 to 85%, motor).314
Oak Ridge National Laboratory recently published a report investigating the possibility of developing an Energy Star labeling system for cars and light duty trucks.315 The authors conclude that such a rating system is feasible and could help consumers select vehicles with high fuel economy, low greenhouse gas emissions, and low oil use while preserving a full range of service (size and acceleration) and body style choice. The authors observed that existing miles per gallon data of vehicles has limitations since it only the addresses the distance a vehicle will go on a gallon of fuel, without reference to other vehicle benefits such as passenger and cargo volume, horsepower, four-wheel drive capability, and payload and towing capabilities.
The Energy Policy Act of 1992 required 75% of new U.S. government vehicle acquisitions in covered fleets to be alternative fueled (with some exemptions). Beginning in fiscal year 1999, federal agencies had to begin reporting alternative fuel vehicles to Congress. Fuel credit is available for bio-diesel. Executive order 13149 requires a 20% reduction in petroleum use by covered federal fleets between fiscal years 1999 and 2005 and a 3 mile per gallon increase in new vehicle operations over the same time period. DOE classifies the following as alternative fuels: bio-diesel, electricity, ethanol, hydrogen,

72
methanol, natural gas, propane, p-series4, and solar energy. In FY00, the total federal use of alternative fuels was the equivalent of 1,825,794 gallons of gasoline.316
For individuals, car sharing is one innovative strategy to reduce the environmental impact of transportation. Since fuel tends to be only 1/5 or less of the average total cost per mile for cars, Factor 4 suggests that 2 or more families or a neighborhood group might share vehicles, thus saving money as well as material resources.2
4.7.1 Alternative Fuel Vehicles
4.7.1.1 Commercially Available Vehicles and Fuels
In June 2002, Texas Governor Rick Perry requested that Texas Department of Transportation (TxDOT) immediately begin using cleaner diesel fuel (emulsified diesel) in 75% of the Houston district fleet to help improve air quality in Southeast Texas. The emulsified diesel fuel was supplied by Lubrizol Corporation under the brand name “PuriNOx®” consisting of 20% water, 77% diesel fuel, and 3% additives (by weight). Later that month, TxDOT initiated a research project with the UT Engines Research Program to evaluate the positive benefits and negative impacts of PuriNOx®, including health, safety, performance, and cost effectiveness. The claimed benefits are nominal 20% reduction in NOx emissions, and 40% reduction in particulate matter (soot). The UT study found PuriNOx® provided close to the claimed NOx reduction benefit, but was not cost-effective in the TxDOT fleet due mainly to low equipment utilization rates. Separation of the fuel emulsion occurred unless engines were started twice a week.317
Alternative fuel vehicles that are available through JSC’s supplier of vehicles, the General Services Administration, include:
• Compressed natural gas
• Ethanol/gasoline “flex fuel”
• Bio-diesel
The GEM electric vehicle, manufactured by Global Electric Motorcars (Fargo, ND) is a multipurpose neighborhood electric vehicle with rechargeable batteries. The GEM is street-legal as a low-speed vehicle. The GEM is electronically limited to a maximum speed of 25 mph to conform with federal low-speed vehicle standards. The GEM can be driven on public roads posted at 35 mph or less, in states that have approved the use of neighborhood electric vehicles. It is for sale at dealerships now in two- and four-passenger configurations, with a manufacturer’s suggested retail price between $6,995 and $8,995.318 JSC recently received the GEM car shown in Figure 4-9 through a program with NASA headquarters and other NASA centers.
Electric bicycles are another option for short trips, such as on-site at JSC. This option might be a good one to augment the fleet of pedal bicycles already in use at JSC.
4 P-series fuels, created by Pure Energy Corp., are blends of ethanol, methyltetrahydrofuran, natural gas liquids, and in some cases butane to meet cold-start requirements.
4-9: Global Electric Motorcar (GEM)

73
While not yet commercially available, the Hypercar concept by Rocky Mountain Institute is designed to achieve 3 to 5–fold improvement in fuel economy with equal or better performance and safety than today's vehicles.319
4.7.1.2 Solar and Fuel Cell Electric Vehicles
According to an interview with Reuters in October 2003, Mr. Larry Burns, Vice President of Research, Development and Planning for General Motors stated GM has invested about $1 billion in developing fuel cells to power electric motors in vehicles, and wants to be the first auto maker to sell a million FCVs. GM hopes to commercialize FCVs by 2010, which is considered one of the most optimistic targets in the industry.320
The Clean Urban Vehicle, manufactured by Anuvu Incorporated (Sacramento, CA), is a true Zero Emission Vehicle designed with a limited range for highway use. Using a conventional vehicle chassis, the Clean Urban Vehicle offers the safety, comfort, and styling of modern vehicles, merged with hydrogen hybrid engine (fuel cell and Battery) with regenerative braking at a cost of roughly $100,000. This is much less expensive than prototype fuel cell cars designed by the major automakers that typically cost in excess of one million dollars each. The Anuvu Clean Urban Vehicle can be ordered now by fleet operators as well as individuals who have access to hydrogen fuel cell fueling stations.321
But the Honda FCX was the world’s first fuel-cell vehicle to be certified for everyday use by the California Air Resources Board and the EPA. Both government agencies have categorized it as a Zero- Emission Vehicle. Maximum output is 80 horsepower and 201 foot-pounds of torque, similar to a Honda Civic, and range is up to 220 miles. With seating for four people, Honda plans to lease approximately 30 of these fuel-cell cars in California and Japan during the next several years.322
The trend among automakers in the last few years has been to use pure hydrogen versus onboard reformers with a hydrocarbon fuel. This is very similar to the approach that will probably be used by NASA for planetary rovers, except that these rovers will have to carry oxygen as well, since they can’t scavenge it from the air. As shown in Figure 4-10, JSC has been experimenting with fuel cell-powered rovers that will eventually transport astronauts on the Moon or Mars.
ECTOS is a state-of-the-art demonstration of hydrogen technology running part of the public transport system with fuel cell busses in Reykjavík, Iceland.323
A few solar electric tractors have been built by individuals for agricultural purposes. The Electric Ox is an electric lawn tractor with either a 36V or 48V battery pack, but it costs much more than its gasoline powered counterpartspresumably due to limited production.324 Other than this agricultural application and a very few Mars rovers that have been solar-powered, the most R&D on solar-powered cars has been done by university teams that compete in solar car races such as the World Solar Challenge.325 Besides encouraging improvements in electric vehicles, these competitions help prepare the next generation of engineers for the transportation challenges of the future. In a similar way, JSC has used student design projects for model solar cars and a solar go-cart as part of its education outreach program.
4-10: Fuel Cell-Powered Rover Development for Future Human Space Exploration

74
4.7.2 Aerial and Space Vehicles
Having come 100 years since the first human flight at Kitty Hawk, the human race has just begun to experience air and space travel. Undoubtedly, technologies that benefit long-term sustainability will continue to evolve from aerospace R&D. As discussed in section 4.3.8, solar cell technology has already been spurred by satellite development. A unique NASA program called Environmental Research Aircraft and Sensor Technology is developing unmanned aerial vehicle technology and miniature science instruments and sensors that can be carried by those aircraft.326 This program produced the Helios solar-powered airplane shown in Figure 4-11.327
Unfortunately, the Helios aircraft crashed into the ocean in 2003 during a test flight. The craft experienced control difficulties that resulted in severe oscillations before Helios sustained some structural damage and went down. The solar aircraft team, run by the project’s prime contractor AeroVironment, had previously conducted nine successful flights with the Helios Prototype and more than 40 on predecessor solar aircraft. The team hopes to continue development after the crash is fully investigated.
Fuel cell electric airplanes are another technology that may come from the unmanned aerial vehicle program.328 According to NASA’s Office of Aerospace Technology, “Fuel cells offer higher energy efficiency with no emissions when compared to existing piston and turbine power plants.” The Zero CO2 project's goal is twofold: to drastically reduce or eliminate the environmental impact of subsonic air breathing propulsion system as a source of global climate change by reducing CO2 emissions from present-day levels to zero while concurrently reducing NOx emissions by more than a factor of five over present-day levels.
NASA ED01-0230-4
4-11: NASA’s Helios Solar-Powered Airplane Set an Altitude Record of 96,863 Feet in 2001

75
One hope for low cost, low environmental impact access to space is a space elevator.329 Special linear carbon nanotubes may allow this concept of stringing a long, extremely high strength cable 35,800 km from a geosynchronous satellite down to Earth.
4.8 Waste E.O. 13101 requires solid waste reduction goals for federal agencies, and NASA has set a goal of diverting 35% of its municipal solid waste from landfills by 2010 compared to 1997. Some additional goals relate specifically to hazardous waste. Thus far, JSC has achieved a 3% reduction in solid waste.
Other organizations are trying strategies that JSC may be able to use as well. For example, EPA’s new “green cafeteria” offers compostable serviceware. EPA also offers a handbook called “Full cost accounting for municipal solid waste management”.
NASA is also investigating novel methods of waste reduction and reuse for space missions in the Advanced Life Support Office.104 Technologies being developed include compaction, lyophilization, composting and incineration among others.
4.8.1 Hazardous Waste
In 1999, 3.5 billion kilograms of toxic chemicals, or 12.7 kg/person, were released into the U.S. environment. Half of this was from metal mining and 15% was from electric plants.3 Texas industries produce more than 1/3 of the hazardous waste in the U.S. – 15 million tons in 1999. Almost 2/3 of that came from Harris, Brazoria, and Galveston counties.330 The EPA’s annual Toxic Release Inventory provides community specific information to inform citizens. Most countries do not have as good a reporting process, and even the U.S. report does not count pesticides. In Russia, among other places, the health effects of environmental pollutants have become significant. In December 2000, delegates from 122 countries approved an agreement aimed at banning 12 of the most persistent organic pollutants now in use. Once 50 countries ratify the treaty, implementation will begin.3 We may discover more problems as time goes by since it takes a long time for water-soluble toxic chemicals to reach underground aquifers.
Consequently, technologies that can be used to clean up ground water sources are in demand. Examples of NASA technologies that may find terrestrial uses are JPL’s work on PCB and PFT field detection and JSC’s work on biological water treatment.
At NASA, Dryden Flight Research Center achieved a reduction in Hazardous Chemicals and reduced chemical costs by using a HazMat pharmacy concept where hazardous chemicals are supplied from a central “pharmacy” when needed.331
4.8.2 Waste Reduction/Recycling
JSC began recycling a number of years ago and has expanded the program over time. Materials currently recycled include mixed paper, cardboard, batteries, aluminum cans and all types of scrap metal. Yet, more could be done, and grass-roots efforts continue to explore options to improve JSC’s performance.
“Beyond RCRA: Prospects for Waste & Materials Management in the Year 2020” is a discussion paper which was developed jointly by the EPA and state environmental agencies. Its goal is to open and inspire dialogue on what the future could hold for the Resource Conservation and Recovery Act (RCRA) program in 20 years. The paper identifies a number of trends that could affect the future of waste and materials management, resource conservation, and human and environmental health and also suggests certain general strategies and tools that might be used to build a new vision for the future of the RCRA program.332
Industry in the U.S., Japan, and Europe has managed to reduce waste outputs greatly by internally recycling materials, but packaging waste remains a problem for the modern consumer society according to Factor 4.2 In 1991, Germany began the “Green Dot” program with differentiated fees to encourage

76
reduced and recyclable packaging. “It reduced municipal waste, but eventually failed due to complexity and cost.” The authors of Factor 4 favor a technical solution – namely replacing polyvinyl chloride (PVC), polyethylene, or other wrapping plastics with Belland material. This material, developed by German engineer Roland Belz, becomes water-soluble at pH values a little over 7, so it can be recovered from mixed refuse by washing in a mild citric acid solution.333
The Army produced a report called “Selection of Methods for the Reduction, Reuse, and Recycling of Demolition Waste” in 2001. Another area that would have a great effect on sustainability due to the proliferation of electronic gadgets is recycling of computers. “Computers contain a diverse array of materials, many of them toxic, including lead, mercury and cadmium, that makes them difficult to recycle,” so only 11% of computers are recycled compared to 70% of refrigerators.334
A U.S. carpeting company named Interface has committed itself to changing its course to become sustainable. Instead of selling carpeting that will inevitably end up in landfills, they plan to sell carpeting services to companies over a contract period and ensure that old carpet is recycled.335
4.8.3 Waste Processing Technologies
4.8.3.1 Super Critical Water Oxidation
According to Dr. Mike Modell of MIT, supercritical water oxidation is cost-effective for treating municipal sewer sludge if the waste streams can be separated at the source.336 All organics oxidize in the supercritical water oxidation process at 250 atmospheres and 250 to 600°C. Cruise ships, stadiums, and theme parks with separated toilets may be able to make early use of this technology.
4.8.3.2 Composting
The University of Florida has made advancements in anaerobic composting that are attracting commercial attention.337 Anaerobic digestion for reduction and stabilization of the organic fraction of solid wastes has the advantages of not requiring oxygen or high temperature and pressure while producing methane, CO2, nutrients, and compost as valuable products. This could be particularly valuable inside a spacecraft. The university has a patented high-solids process called sequential batch anaerobic composting, which is near commercialization. Twelve reactors have been designed and constructed for planned installation in the Levita Brown Recycling Center in Gainesville, Florida, and another site to be determined. NASA research has helped reduced the reactor volume of this process.
JSC has recently started on-site composting activities in an old gravel storage area. Landscaping contractors have started with grass clippings, trimmings, and branches, with plans to expand the type and volume of compostable materials. The compost will be used around flower beds and trees on site to initially reduce and potentially eliminate purchases of commercial fertilizer and mulch materials.338
The EcoPOD is an example of a commercially available composting system for large-scale operations.339 Organic material is loaded into what looks like long, plastic trash bags and conditions are carefully controlled, resulting a composting process that can drastically reduce waste volume in a matter of weeks.
4.8.3.3 Pyrolysis
Pyrolysis can be used as a pretreatment for a simplified combustion process, to produce fuel gases for life support, fuel gases for fuel cell power generation, and/or chemical feedstocks and materials (e.g., activated carbon) on the ground or in space. The University of Florida has an approach that uses pyrolysis of solid waste in a two-stage reactor to produce fixed gases, fuel gases, a char residue, and potentially activation of the char residue to produce activated carbon sorbents.340

77
4.9 Water Water is an important area where technology might be able to help. The World Health Organization estimates that about 1.1 billion people do not have access to clean water. “While global population has tripled over the past 70 years, water use has grown six-fold. Worldwide, 54% of the annual available fresh water is being used, two thirds of it for agriculture.” 341 For the first time, in 2001, World Health Organization statistics reflected a decline in water coverage compared to previous estimates. In developing countries, 90-95% of sewage and 70% of industrial wastes are dumped untreated into surface waters where they pollute the water supply. In many industrial countries, chemical run-off from fertilizers and pesticides, and acid rain from air pollution require expensive and energy-intensive filtration and treatment to restore acceptable water quality.” 314
Technology may help the situation but it is not a panacea. One UN report says “Purely technological solutions to water scarcity are likely to have limited effect. Desalinized sea-water is expensive and now accounts for less than 1 per cent of the water people consume.” Their recommendation is: “Protecting water supplies from pollutants, restoring natural flow patterns to river systems, managing irrigation and chemical use, and curbing industrial air pollution are vital steps to improving water quality and availability.”
Several good sources of more information on water are:
• “The World’s Water 2000-2001,” the biennial report on Freshwater Resources by Peter H. Gleick.342
• www.worldwater.org/links.htm
• www.worldbank.org/depweb/english/modules/environm/water/index.htm
• http://www.safewatersystems.com/
4.9.1 Water Purification Technologies
Wastewater purification technologies range from common ones like chlorination to exotic ones like use of Moringa tree seeds, which make a very effective coagulant for high turbidity water.343 Sodium hypochlorite is currently used as a disinfectant by JSC, while gaseous chlorine has been used in the past.
Reverse osmosis costs have come way down in recent history, bringing this technology closer to conventional treatment in terms of cost. Desalination has been used in various locations around the world for over a hundred yearsgenerally when fresh water is not available and fuel costs are low. The Water Re-use Promotion Center in Tokyo has developed a desalination system, which uses a membrane distillation process powered by heat and electricity from the Sun.344 Waterhealth International, Inc. also offers solar PV-powered UV light disinfection units.
Many municipalities treat and indirectly reuse gray water after it has returned to the environment for a period of time. On the other hand, many cities also prohibit gray water use.345 Gray water (or Greywater) is wastewater that does not include toilet waste (although sometimes urine is included)normally just sinks, showers, washing machines, etc. Black water includes toilet waste. Currently, regulations prevent use of reclaimed water on crops in the U.S. NASA research may help determine appropriate safety precautions and standards for different types of water reuse processes and technologies.346 Optimization and testing of various water processing technologies for future human space missions is ongoing at JSC.
Kennedy Space Center is studying gray water use and state rules and conducting a demonstration project.347 The pilot project may benefit south Florida communities and help protect their nearby coral reefs. The Space Center is testing how landscape plants can be used in place of a septic tank drain field. Black water is flowed through an isolated root zone and in some cases gray water is added to the plant beds. Since the system is mostly closed, it is immune to surges of storm water. If monitoring indicates adequate water quality, the discharge from this type of system could then flow into ground water sources.

78
Four 4.6-m2 (50-ft2) beds are being used to test various protocols and initial results have been encouraging.
Magnetically Agitated Photocatalytic Reactor is another water treatment technology under study by NASA-funded research.348 The goal of the research has been to develop a post processor for 100% water recovery. The core technology focuses on magnetic agitation of barium ferrite coated with titania dioxide. To increase robustness for both space and terrestrial applications, the incorporation of sorbents with the magnetic media has been investigated. In addition, the photocatalytic sorbents have been investigated without magnetics. Initial findings from the project have led to additional funding from the EPA and pending support from the DOE. These projects focus on the development of smart particles for water purification and monitoring and removing VOCs and HAPs from coal-fired utility plants.
Further NASA-funded research is in the area of biological pathogen removal from contaminated water sources. The technology uses electropositive nano-scale alumina-based fibers built on a microglass substrate. The electropositive nature of the fibers attracts principally electronegative pathogens and adsorbs them into the depths of the media. This technology has applications ranging from water remediation following a biological weapons attack to water purification for hikers in remote environments.
4.9.2 Clean Water Efforts
Water For People helps impoverished people worldwide improve their quality of life by supporting locally sustainable drinking water, sanitation, and hygiene education projects.349 Water for People is sponsored by American Water Works Association, the professional society for potable water providers.
Locally, HARC is studying wastewater reuse in the Rio Grande valley. (See www.harc.edu/mitchellcenter/mexico350 and the Rio Grande/Rio Bravo Basin Coalition351 for more information.) Texas Tech University also has a NASA-funded project to study use of constructed wetlands with native plants for homes without sewage treatment. Several other innovative water projects are being planned by cities in Texas such as San Antonio selling tertiary treated water to industry through reuse pipelines and Brownsville building a desalination plant.
5 Systems Analysis 5.1 Study Approach A great many of the technologies described above could apply to JSC and many other public and private facilities. However, a fair amount of analysis and “leg-work” is inevitably required to determine the feasibility and desirability of each application. To be complete, this involves financial analysis and a review of organizational goals, which are beyond the scope of this document. Rather, the approach taken here is to first assess the potential for these various technologies to improve environmental sustainability. In this way, through a systems analysis approach, the ones that will have the greatest impact can be identified for further consideration.
In order to estimate, and eventually measure improvements in environmental sustainability, indicators are required. Thus, in section 3.2 a set of Sustainability Indicators for JSC was developed. As depicted in Figure 5-1, these indicators can then be used to assess the savings in terms of reduced resource utilization and environmental damage due to the use of various technologies. A dual approach was used in that both technologies and potential applications were studied in order to match up specific implementations that appeared promising for JSC.
As can be seen in section 4 above, the maturity level of the technologies studied ranged from those still under development to ones that are commercially available. Although there is some crossover depending on application, the technologies were divided into “Current” and “Future” categories for convenience of

79
reporting. The specific applications were then refined, making assumptions as necessary, into conceptual designs for JSC. The technologies were assumed to apply as widely (in as many areas) as seemed reasonable around the Center. The Current and Future technologies that were assessed in the systems analysis are listed in Tables 5-1 and 5-2, respectively.
Resource
Utilization
Environmental
Quality
Resource
Utilization
Environmental
Quality
Technologies Applications
Analysis
5-1: Dual Approach to Sustainability Assessment
Table 5-1: Current Sustainability Technologies Analyzed for JSC
Current Technologies Considered• Air
– Low NOx burners• Agriculture & Food• Energy
– Efficiency & conservation– Wind– Solar water heaters and PV– Bio-fuels– Various energy storage options– Gas turbine combined heat and power– Vegetable oil transformer– Backup power
• Fuel Cells– PEM– Phosphoric acid using natural gas
• Green Building – “Cool” low heat gain roofs– Insulating windows– General & exit lighting with LEDs
• Thermal Control– Polarized refrigerant oil additives– Artic Master– Heat pipe heat exchangers– Desiccant systems– Solar powered refrigeration– Programmable thermostats– Instantaneous water heaters– High efficiency vending machines– Thermal storage for A/C– High efficiency refrigerators & freezers
• Transportation– Alternative fuel vehicles– Segways & bikes
• Waste– Reduction/recycling– Composting– Super-critical water oxidation– Rechargeable batteries
• Water– Reuse for irrigationNote: Those in blue were analyzed quantitatively

80
Table 5-2: Future Sustainability Technologies Analyzed for JSC
Future Technologies Considered• Air
– Advanced air monitors• Agriculture & Food
• Crop based foods requiring little energy• Energy
– Higher efficiency motors– Clean coal & carbon sequestration– Nuclear fusion– Solar (inc. lunar PV power)– Bio-fuels– Various energy storage options
• Fuel Cells– PEM– Regenerative– Fuel cell landscape cart & mower
• Green Building – LED lighting
• Thermal Control– Micro-electromechanical systems
(MEMS) cooling devices– Better refrigerants– High efficiency centrifugal chiller– Desiccant cooling systems– Solar powered refrigeration– Vacuum insulation– Phase change material refrigerator– Refrigerator efficiency improvements
• Transportation– Fuel cell vehicles– Hypercar– Aerial vehicles
• Waste– Composting– Super-critical water oxidation– Disposable cup/utensil alternatives
• Water– Reuse for irrigation
Note: Those in blue were analyzed quantitatively
For a particular technology, the environmental benefits could be assessed for one’s own facility or at a state, national or even global level. Of course, this requires data on potential demand for the technology. Thus, the analysis describe here calculates the benefits only at the JSC level of use. Also, not all the technologies described above could be entered into the systems analysis due to lack of data or time.
A systems analysis tries to take into account all aspects of a project and quantify interrelated effects. For example, if increased electrical efficiency allows a motor to use less energy, then the pollution associated with generating that electricity is also reduced. In some cases a technology that saves energy or reduces waste may require increased use of another resource such as water. It is important to consider this as well for a complete systems analysis.
Another aspect of the study approach was to make use of the technical expertise that is already available at JSC. A “Sustainability Team” was formed to advise the author in various technical areas and to help search for the best applications of sustainability technologies at JSC. Besides the obvious benefit of data collection, it is felt that this approach also promotes communication and teamwork among various organizations at JSC.
5.2 Analysis Details
5.2.1 Costs and Factors
Unless otherwise stated below, the following projected JSC energy costs were used in the analysis.
• Electricity: $0.061/ kWh
• Natural gas: $4.28/ million BTU
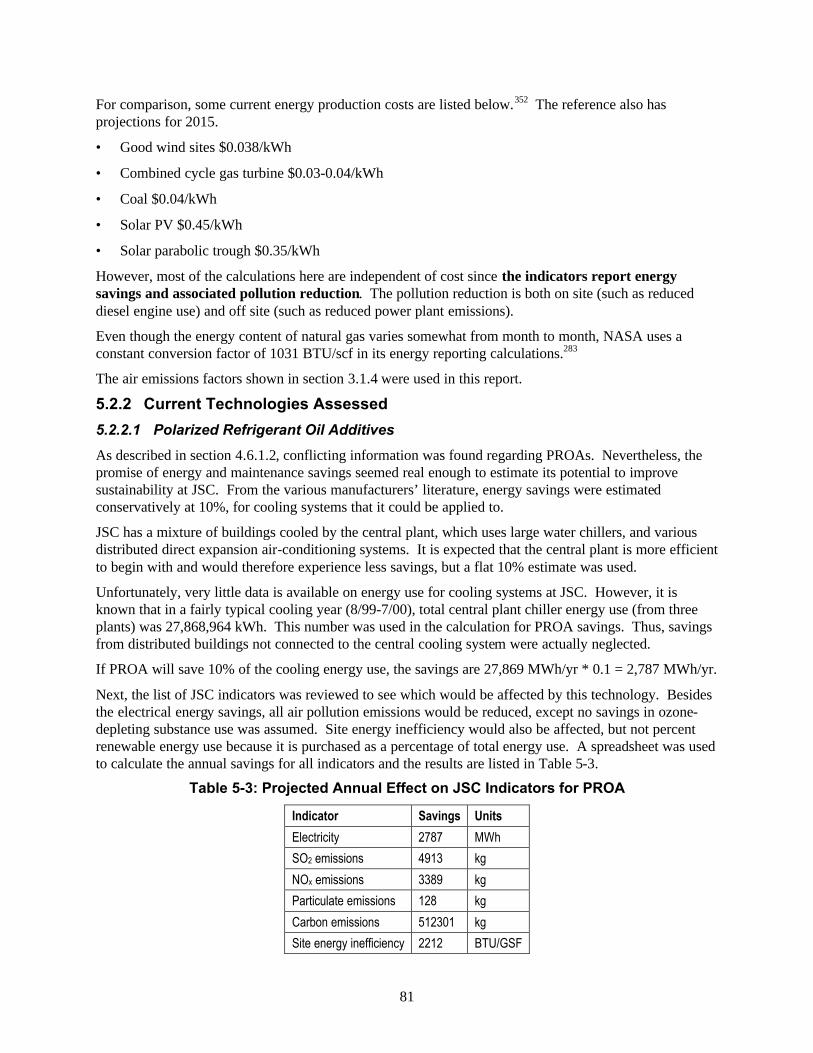
81
For comparison, some current energy production costs are listed below.352 The reference also has projections for 2015.
• Good wind sites $0.038/kWh
• Combined cycle gas turbine $0.03-0.04/kWh
• Coal $0.04/kWh
• Solar PV $0.45/kWh
• Solar parabolic trough $0.35/kWh
However, most of the calculations here are independent of cost since the indicators report energy savings and associated pollution reduction. The pollution reduction is both on site (such as reduced diesel engine use) and off site (such as reduced power plant emissions).
Even though the energy content of natural gas varies somewhat from month to month, NASA uses a constant conversion factor of 1031 BTU/scf in its energy reporting calculations.283
The air emissions factors shown in section 3.1.4 were used in this report.
5.2.2 Current Technologies Assessed
5.2.2.1 Polarized Refrigerant Oil Additives
As described in section 4.6.1.2, conflicting information was found regarding PROAs. Nevertheless, the promise of energy and maintenance savings seemed real enough to estimate its potential to improve sustainability at JSC. From the various manufacturers’ literature, energy savings were estimated conservatively at 10%, for cooling systems that it could be applied to.
JSC has a mixture of buildings cooled by the central plant, which uses large water chillers, and various distributed direct expansion air-conditioning systems. It is expected that the central plant is more efficient to begin with and would therefore experience less savings, but a flat 10% estimate was used.
Unfortunately, very little data is available on energy use for cooling systems at JSC. However, it is known that in a fairly typical cooling year (8/99-7/00), total central plant chiller energy use (from three plants) was 27,868,964 kWh. This number was used in the calculation for PROA savings. Thus, savings from distributed buildings not connected to the central cooling system were actually neglected.
If PROA will save 10% of the cooling energy use, the savings are 27,869 MWh/yr * 0.1 = 2,787 MWh/yr.
Next, the list of JSC indicators was reviewed to see which would be affected by this technology. Besides the electrical energy savings, all air pollution emissions would be reduced, except no savings in ozone-depleting substance use was assumed. Site energy inefficiency would also be affected, but not percent renewable energy use because it is purchased as a percentage of total energy use. A spreadsheet was used to calculate the annual savings for all indicators and the results are listed in Table 5-3.
Table 5-3: Projected Annual Effect on JSC Indicators for PROA
Indicator Savings Units
Electricity 2787 MWh
SO2 emissions 4913 kg
NOx emissions 3389 kg
Particulate emissions 128 kg
Carbon emissions 512301 kg
Site energy inefficiency 2212 BTU/GSF

82
5.2.2.2 Combined Heat and Power - Gas Turbine
Gas turbines could be used to generate combined heat and power at JSC as described in section 4.3.4. Oak Ridge National Lab did a study in 2003 that assessed the use of gas turbines to provide power to mission control using either a combined cycle or a simple cycle. Two 1.2-MW gas turbines were considered in place of the diesel engine and grid electricity that currently supply mission control. For the combined cycle case, the pollution savings were calculated and are shown in Table 5-4. These numbers do not take into account additional savings that would accrue from use of condenser waste heat. Depending on how much waste heat could be used from condenser cooling, the simple economic payback was as short as 11.3 years. The Oak Ridge study also found that a simple-cycle system with two Saturn 20 gas turbine/generators with heat recovery, inlet-air cooling and supplemental firing to provide steam for the entire site was feasible with a simple economic payback of 13 years.
Table 5-4: Projected Annual Effect on JSC Indicators for Combined Cycle Gas Turbines
Indicator Savings Units Electricity 16439 MWh Natural gas -201600 Mcf Diesel 99720 Gallons SO2 emissions 24230 kg NOx emissions 27171 kg Particulate emissions 629 kg Carbon emissions 182400 kg Site energy inefficiency -32103 BTU/GSF
5.2.2.3 Solar Water Heaters
Installation of solar water heaters at JSC’s NBL and its cafeterias would result in significant natural gas savings. The NBL contains a very large pool (see Figure 5-2) used to train astronauts in a simulated microgravity environment.
Savings were projected for the NBL pool only. Natural gas savings from a moderate sized solar pool heater were estimated to be 4151 Mcf/yr out of the current estimated usage of 17000 Mcf/yr. These savings would translate into the additional environmental savings shown in Table 5-5 based on reduced operation of the current gas boilers. However, additional electricity (estimated at 100 MWh/yr) must be used to run the solar water heater pumps, resulting in increased power plant emissions (off site). Thus, the savings shown in the table are net savings and some are negative, indicating an increase rather than a savings.
5-2: JSC’s Neutral Buoyancy Lab Pool A Candidate for Solar Heat

83
Table 5-5: Projected Annual Effect on JSC Indicators for NBL Solar Water Heater
Indicator Savings Units
Electricity -100 MWh
Natural gas 4151 Mcf5
SO2 emissions -175 kg
NOx emissions 167 kg
Particulate emissions -1 kg
Carbon emissions 43738 kg
Site energy inefficiency 1912 BTU/GSF
Nonrenewable energy 0.4 %
5.2.2.4 Low NOx Burners
An effort already under way at JSC involves retrofit of the natural gas burners in two central plant boilers to reduce NOx emissions using state-of-the-art technology. The annual effect on JSC sustainability indicators is shown in Table 5-6. Assumptions involved in these calculations are: 353
• Theoretical annual emission change is 35.2 tons per year NOx decrease per boiler times two boilers
• NOx reduction is from 0.12 lb/MMBTU6 to 0.011 lb/MMBTU. 1.031MMBTU/Mcf
• Boiler gas use for 2001 was 60620 Mcf and 164494 Mcf or a total of 225114 Mcf for the two boilers; assume other years are similar to 2001
• Increased power is required for a forced draft fan; replace 75-hp fan (assume 90% efficient) with a 200-hp fan (95% efficient); combined run time = 2763 hrs
Table 5-6: Projected Annual Effect on JSC Indicators for Low NOx Boiler Burners
Indicator Savings Units
Electricity -262 MWh
SO2 emissions -462 kg
NOx emissions 11154 kg
Particulate emissions -12 kg
Carbon emissions -48160 kg
Site energy inefficiency -208 BTU/GSF
5.2.2.5 Computer Power Savings
As described in section 4.3.12, if most of the computer monitors at JSC were set to automatically power down after a period of non-use, the energy savings could add up to a significant amount with little effort or expense required for implementation. The projected savings are shown in Table 5-7 and specific assumptions are listed below.
• There are about 10000 ODIN workstations at JSC.354 Assume that half do not have any power-save settings turned on.
5 Mcf = 1000 standard cubic feet (scf) 6 MMBTU = million British Thermal Units (BTUs)
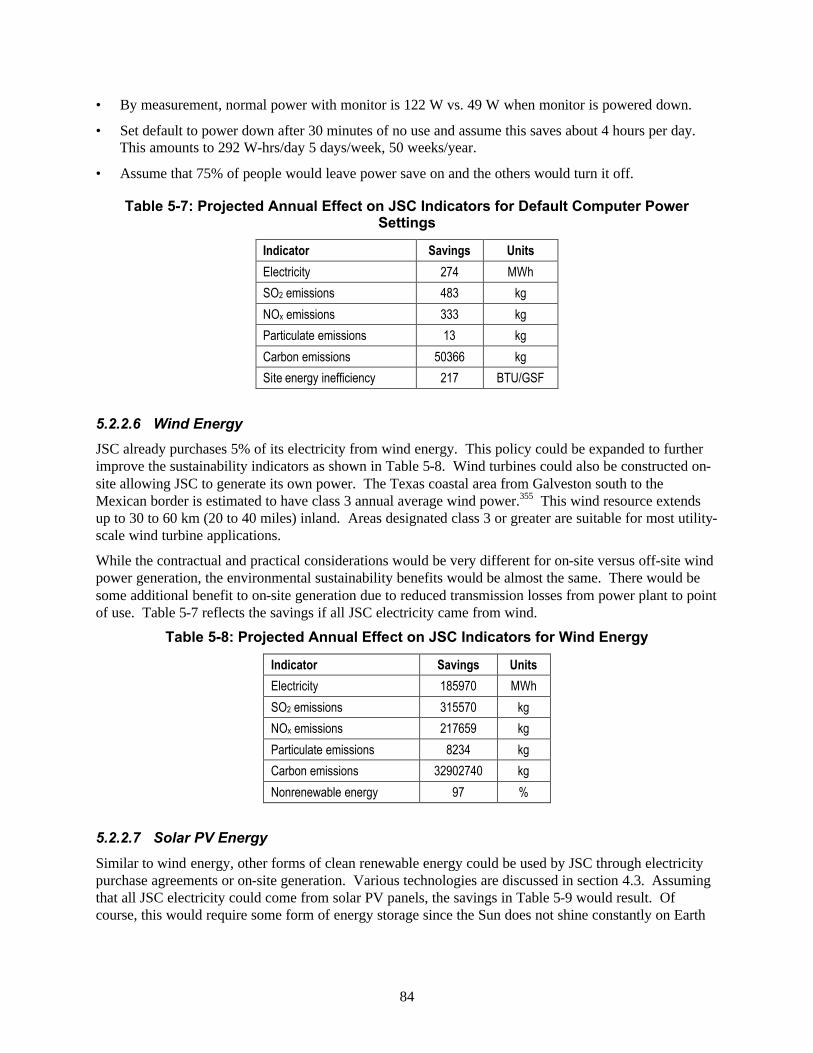
84
• By measurement, normal power with monitor is 122 W vs. 49 W when monitor is powered down.
• Set default to power down after 30 minutes of no use and assume this saves about 4 hours per day. This amounts to 292 W-hrs/day 5 days/week, 50 weeks/year.
• Assume that 75% of people would leave power save on and the others would turn it off.
Table 5-7: Projected Annual Effect on JSC Indicators for Default Computer Power Settings
Indicator Savings Units
Electricity 274 MWh
SO2 emissions 483 kg
NOx emissions 333 kg
Particulate emissions 13 kg
Carbon emissions 50366 kg
Site energy inefficiency 217 BTU/GSF
5.2.2.6 Wind Energy
JSC already purchases 5% of its electricity from wind energy. This policy could be expanded to further improve the sustainability indicators as shown in Table 5-8. Wind turbines could also be constructed on-site allowing JSC to generate its own power. The Texas coastal area from Galveston south to the Mexican border is estimated to have class 3 annual average wind power.355 This wind resource extends up to 30 to 60 km (20 to 40 miles) inland. Areas designated class 3 or greater are suitable for most utility-scale wind turbine applications.
While the contractual and practical considerations would be very different for on-site versus off-site wind power generation, the environmental sustainability benefits would be almost the same. There would be some additional benefit to on-site generation due to reduced transmission losses from power plant to point of use. Table 5-7 reflects the savings if all JSC electricity came from wind.
Table 5-8: Projected Annual Effect on JSC Indicators for Wind Energy
Indicator Savings Units
Electricity 185970 MWh
SO2 emissions 315570 kg
NOx emissions 217659 kg
Particulate emissions 8234 kg
Carbon emissions 32902740 kg
Nonrenewable energy 97 %
5.2.2.7 Solar PV Energy
Similar to wind energy, other forms of clean renewable energy could be used by JSC through electricity purchase agreements or on-site generation. Various technologies are discussed in section 4.3. Assuming that all JSC electricity could come from solar PV panels, the savings in Table 5-9 would result. Of course, this would require some form of energy storage since the Sun does not shine constantly on Earth

85
due to clouds and night. Using current PV technology, about one fourth of JSC’s usable land area would be required for the solar array.
Table 5-9: Projected Annual Effect on JSC Indicators for Solar PV Energy
Indicator Savings Units
Electricity 185970 MWh
SO2 emissions 315570 kg
NOx emissions 217659 kg
Particulate emissions 8234 kg
Carbon emissions 32902740 kg
Nonrenewable energy 97 %
5.2.2.8 200kW Natural Gas Phosphoric Acid Fuel Cell
The PAFC discussed in sections 4.4.1.1 was analyzed for a potential combined heat and power application at JSC’s building 29 and results are shown in Table 5-10. There it could provide power to the building at 480 volts and provide all the heat required for the large training pool in the building. Assumptions used in the study were:
• UTC model PC25C fuel cell with a 5 year life.
• Full 200kW electrical output.
• Of the potential 900,000 BTU/hr waste heat, the pool could use 1640 MMBTU/yr of displaced gas heat.
Table 5-10: Projected Annual Effect on JSC Indicators for 200kW Fuel Cell Using Some of its Waste Heat to Heat the Building 29 Pool
Indicator Savings Units
Electricity 1752 MWh
Natural gas -16805 Mcf
SO2 emissions 3089 kg
NOx emissions 2228 kg
Particulate emissions 82 kg
Carbon emissions 190009 kg
Site energy inefficiency -2640 BTU/GSF
5.2.2.9 Cool Roofs
As discussed in section 4.5.2, there are several ways to lower heat gain through the roof of buildings and this is generally a positive thing in hot climates such as Houston. Using the Energy Star calculator, analysis was conducted for a typical building at JSC assuming an albedo increase from 0.1 to 0.6 by installing a reflective roof. The savings were then extrapolated to the entire built-up roof area at JSC. The results are shown in Table 5-11.
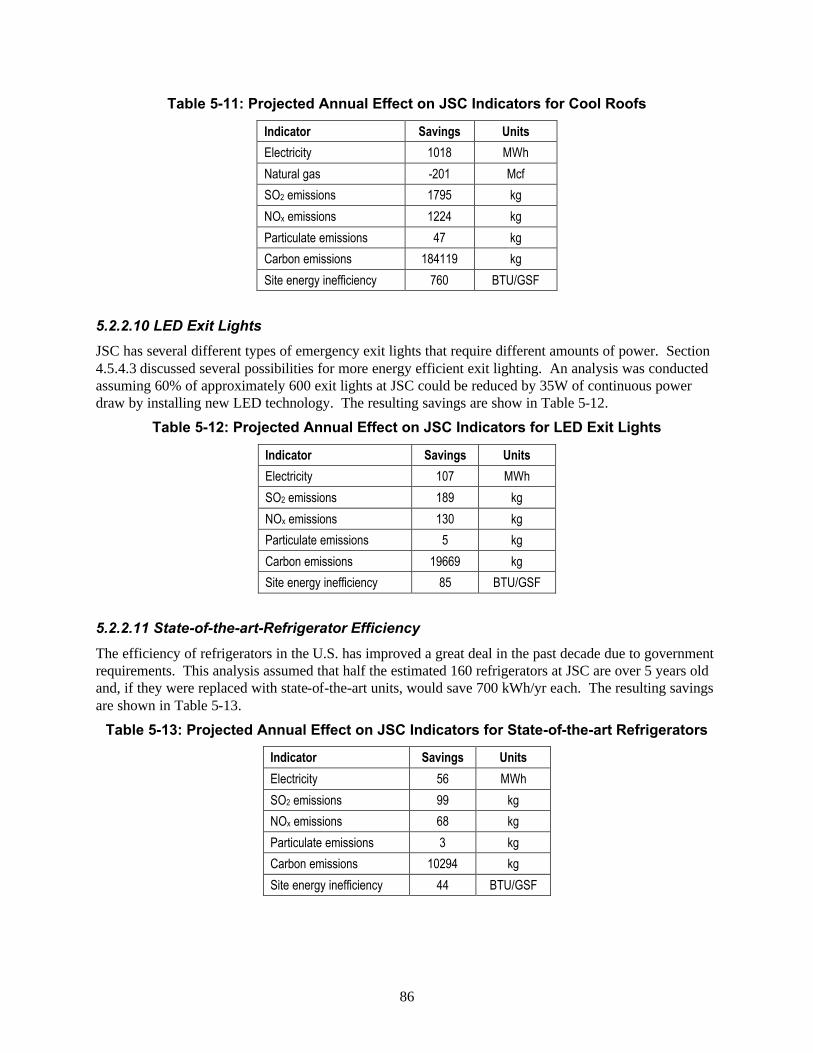
86
Table 5-11: Projected Annual Effect on JSC Indicators for Cool Roofs
Indicator Savings Units
Electricity 1018 MWh
Natural gas -201 Mcf
SO2 emissions 1795 kg
NOx emissions 1224 kg
Particulate emissions 47 kg
Carbon emissions 184119 kg
Site energy inefficiency 760 BTU/GSF
5.2.2.10 LED Exit Lights
JSC has several different types of emergency exit lights that require different amounts of power. Section 4.5.4.3 discussed several possibilities for more energy efficient exit lighting. An analysis was conducted assuming 60% of approximately 600 exit lights at JSC could be reduced by 35W of continuous power draw by installing new LED technology. The resulting savings are show in Table 5-12.
Table 5-12: Projected Annual Effect on JSC Indicators for LED Exit Lights
Indicator Savings Units
Electricity 107 MWh
SO2 emissions 189 kg
NOx emissions 130 kg
Particulate emissions 5 kg
Carbon emissions 19669 kg
Site energy inefficiency 85 BTU/GSF
5.2.2.11 State-of-the-art-Refrigerator Efficiency
The efficiency of refrigerators in the U.S. has improved a great deal in the past decade due to government requirements. This analysis assumed that half the estimated 160 refrigerators at JSC are over 5 years old and, if they were replaced with state-of-the-art units, would save 700 kWh/yr each. The resulting savings are shown in Table 5-13.
Table 5-13: Projected Annual Effect on JSC Indicators for State-of-the-art Refrigerators
Indicator Savings Units
Electricity 56 MWh
SO2 emissions 99 kg
NOx emissions 68 kg
Particulate emissions 3 kg
Carbon emissions 10294 kg
Site energy inefficiency 44 BTU/GSF

87
5.2.2.12 Composting
As discussed in section 4.8.3.2, composting can greatly reduce the volume of organic waste steams such as most of the municipal solid waste from JSC. Of the 1.24 million kg of solid waste generated at JSC each year (not including construction waste), an estimated 60% is organic, so the analysis assumed that 50% could be composted to allow for things that would be hard to gather. Even this assumption means that a significant effort would be required to collect trash in a way that it could be easily sorted for composting. Using a device such as the Ag-Bag system also requires power for stirring and aeration and thus increases air pollution, so these effects were taken into account in the systems analysis. However, the mass balance of the biological processes involving carbon and nitrogen were not taken into account in the calculation. The resulting savings (or increases if negative) are shown in Table 5-14.
Table 5-14: Projected Annual Effect on JSC Indicators for Composting
Indicator Savings Units
Solid Waste 8270000 kg
Electricity -18 MWh
SO2 emissions -44 kg
NOx emissions -256 kg
Particulate emissions -16 kg
Carbon emissions -9680 kg
Site energy inefficiency -16 BTU/GSF
5.2.3 Future Technologies Assessed
5.2.3.1 Fuel Cell Landscaping Carts and Mowers
Fuel cell carts, mowers, and other landscaping equipment could potentially help JSC comply with future restriction on air emissions and on operation of gasoline-powered equipment (see section 4.1). One case that was analyzed was the fuel cell cart described in section 4.5.5.3. Assuming that six landscape vehicles of this type, which are operated a combined total of 2250 hours per year, are converted to fuel cell power and that the hydrogen they use comes from renewable sources, the benefits of this technology are shown in Table 5-15.
Table 5-15: Projected Annual Effect on JSC Indicators for Fuel Cell Carts
Indicator Savings Units
SO2 emissions 7 kg
NOx emissions 124 kg
Particulate emissions 8 kg
Carbon emissions 3317 kg
5.2.3.2 Refrigerator Efficiency With R&D
Using the same assumptions as in section 5.2.2.11 for refrigerator energy-efficiency improvements, but projecting additional efficiency improvements based on technology development work at JSC, additional savings were calculated as shown in Table 5-16. These savings are based on a 30% improvement in coefficient of performance and a 33% increase in insulation resistance over state-of-the-art values.

88
Table 5-16: Projected Annual Effect on JSC Indicators for Advanced Refrigerators
Indicator Savings Units
Electricity 40 MWh
SO2 emissions 71 kg
NOx emissions 49 kg
Particulate emissions 2 kg
Carbon emissions 7408 kg
Site energy inefficiency 32 BTU/GSF
5.2.3.3 High-Efficiency Centrifugal Chiller
Because JSC has a large electrical load due to water chillers that provide air-conditioning to the many buildings on site, this is a prime area for application of more energy-efficient technologies. In particular, buildings not connected to the central chilled water system could be improved the most, resulting in the savings reported in Table 5-17. This analysis was based on chillers similar to those mentioned in section 4.6.1.5 and the following assumptions:
• Reduction from 1.4 to 0.8 kW/ton for ten 110-ton units.
• 50% duty cycle for an 8-month cooling season.
Table 5-17: Projected Annual Effect on JSC Indicators for Higher-Efficiency Chillers
Indicator Savings Units
Electricity 1900 MWh
SO2 emissions 3350 kg
NOx emissions 2310 kg
Particulate emissions 87 kg
Carbon emissions 349255 kg
Site energy inefficiency 1508 BTU/GSF
5.2.3.4 Solar PV Energy from the Moon
As discussed in section 4.3.8.3, renewable energy could also be generated at a remote location, as far away as the Moon, and transmitted to JSC. The projected annual effect on JSC indicators for this would be roughly the same as those shown in Table 5-9.
5.3 Analysis Results
5.3.1 JSC Mass Balance
Historical data for the JSC Environmental Sustainability Indicators was shown in section 3.2. Another way to look at JSC’s current sustainability performance is to consider a system mass balance as is typically done in spacecraft analysis. This shows the material resources that come into the Center and the waste and emissions that flow out, giving some indication of how close (or far) we are from a closed system. Figure 5-3 shows a top-level mass balance for JSC in the year 2002.

89
5-3: JSC 2002 Mass Balance
5.3.2 Potential Savings Due to Various Technologies
Calculations were done to project the savings of as many technologies as possible for JSC. Information and time limitations forced this to be a subset of the technologies described in section 4; however, this type of analysis can always be extended in the future. The results are shown in Tables 5-17 and 5-18 for current and future technologies, respectively. Data from 2002 are shown for each indicator at the top as a baseline to compare savings against. Any negative numbers represent an increase rather than savings.
5.3.3 Analysis Summary
The results of the analysis presented above indicate that there are a few ways to significantly reduce the majority of JSC Sustainability Indicators with a single technology. This is possible by switching from current fossil fuel sources to a clean, renewable energy source. Alternately, if this is not possible or if

90
additional resource savings are sought, a variety of the other sustainability technologies could be implemented such that the savings add up. For example, many of the technologies explored help to save energy. Several of these could be implemented together to save 20% or more energy at JSC while at the same time increasing utilization of new energy generation technologies. By looking at the results of the analysis, particular indicators (such as NOx or carbon) might also be targeted for reduction.
As mentioned at the beginning of this report, a rigorous economic analysis of the various technology options was beyond the scope of this effort. A worthy extension of this systems analysis would be a full economic assessment of the options based on all utility costs, including hidden costs (maintenance, etc.) and cost to society (externalities).
6 Recommendations Of all the many roles that NASA could play in promoting sustainability as a way “to understand and protect our home planet,” the most logical and attractive role may be that of demonstrationto “walk the walk.” Of course, public policy, education, and many other factors are necessary for progress toward sustainability, but application and demonstration of appropriate technologies and systems thinking would draw on NASA’s inherent strengths. Our existing facilities can be used as a test bed for sustainable practices and new technologies. If carried out properly, this strategy could be implemented at no net cost to the Agency. In fact, by increasing our efficiency, we can improve our productivity while reducing costs and reducing our impact on planet Earth, leading to a sustainable future.
Walt Disney had a dream for an Experimental Prototype Community Of Tomorrow (EPCOT) that came to fruition at Disney World in Florida. While there are certainly elements of research and education in this commercial endeavor, EPCOT is primarily a theme park. NASA has a better opportunity to develop, first on Earth, “communities of tomorrow” that will “inspire the next generation of explorers” and teach them to close the loop, thus allowing humanity to reach further into space.
Many successful efforts are already under way. Many more are possible. The recommendations below are intended to provide ideas of what JSC’s role can be in a sustainable futureone of innovation and leadership! The recommendations are arranged in 3 sections:
• Technology Investments – R& D areas that are recommended for increased emphasis due to their potential impact on our sustainable future in addition to their importance to NASA’s space exploration mission
• Center Projects – Pilot projects, practices and application of technologies that are recommended for JSC facilities
• Management – A collection of ideas for implementing the first two recommendations as well as community outreach activities that would be synergistic with them
6.1 Technology Investments Based on the results of the analysis presented above and synergism with NASA technology development needs, the technology areas below are recommended for additional emphasis because the benefits of R&D in these areas will go far beyond the direct benefit to NASA projects.
The JSC Advanced Technology Development Office has a Web site with the purpose of providing technology developers a starting point for identifying potential sources of funding inside and outside of NASA.356 One such source is the Environmental Security Technology Certification Program, whose goal is to demonstrate and validate promising, innovative technologies that target the DOD's most urgent environmental needs through their implementation and commercialization.357 NASA’s Office of Biological and Physical Research has “task books” available listing current and past research related to that Enterprise at http://research.hq.nasa.gov/taskbook.cfm.

91
Table 5-17: Projected JSC Savings for Currently Available Sustainability Technologies
Air Pollution Indicators Resource Use and Waste Indicators Energy Indicators
SO2 NOx Particulate Carbon ODS* Solid waste Water Haz. Waste
New paper
New Al cans Electricity Nat. gas Diesel Inefficiency Non-
RE
Technologies kg/yr kg/yr kg/yr kg/yr kg/yr kg/yr Mgal/yr kg/yr kg/yr kg/yr MWh/yr Mcf/yr gal/yr BTU/GSF-yr %
Baseline> 321017 258692 12960 34491000 1449 15922302 328.3 150631 395379 3081 185970 342653 115000 233490 97
Low NOx boiler burners -462 11154 -12 -48160 0 0 0 0 0 0 -262 0 0 -208 0
Conservation - computer settings 483 333 13 50366 0 0 0 0 0 0 274 0 0 217 0
Wind - purchased or 85 MW on site 315570 217659 8234 32902740 0 0 0 0 0 0 185970 0 0 0 97
Solar PV - 143 MW terrestrial 315570 217659 8234 32902740 0 0 0 0 0 0 185970 0 0 0 97
Solar thermal - pool heating - NBL -175 167 -1 43738 0 0 0 0 0 0 -100 4151 0 1912 0.4
Cogeneration - 200kW PAFC 3089 2228 82 190009 0 0 -0.01 0 0 0 1752 -16805 0 -2640 0
Cogeneration – Gas turbine 24230 27171 629 182400 0 0 0 0 0 0 16439 -201600 99720 -32103 0
Cool roofs 1795 1224 47 184119 0 0 0 0 0 0 1018 -201 0 760 0
LED exit lights 189 130 5 19669 0 0 0 0 0 0 107 0 0 85 0
Refrigerant additive (PROA) 4913 3389 128 512301 0 0 0 0 0 0 2787 0 0 2212 0
Refrigerator efficiency – state of the art 99 68 3 10294 0 0 0 0 0 0 56 0 0 44 0
Composting - (half site trash) -44 -256 -16 -9680 0 8270000 0 0 0 0 -18 0 0 -16 0
* ozone-depleting substance

92
Table 5-18: Projected JSC Savings for Future Sustainability Technologies
Air Pollution Indicators Resource Use and Waste Indicators Energy Indicators
SO2 NOx Particulate Carbon ODS Solid waste Water Haz.
Waste New paper
New Al cans Electricity Nat. gas Diesel Inefficiency Non-
RE
Technologies kg/yr kg/yr kg/yr kg/yr kg/yr kg/yr Mgal/yr kg/yr kg/yr kg/yr MWh/yr Mcf/yr gal/yr BTU/ GSF-yr %
Baseline> 321017 258692 12960 34491000 1449 15922302 328.3 150631 395379 3081 185970 342653 115000 233490 97
Solar PV - lunar 315570 217659 8234 32902740 0 0 0 0 0 0 185970 0 0 0 97
Fuel cell landscaping cart 6.6 124 8.1 3317 0 0 0 0 0 0 0 0 0 0 0
High efficiency centrifugal chiller 3350 2310 87 349255 0 0 0 0 0 0 1900 0 0 1508 0
Refrigerator efficiency - R&D increase 71 49 2 7408 0 0 0 0 0 0 40.3 0 0 32 0
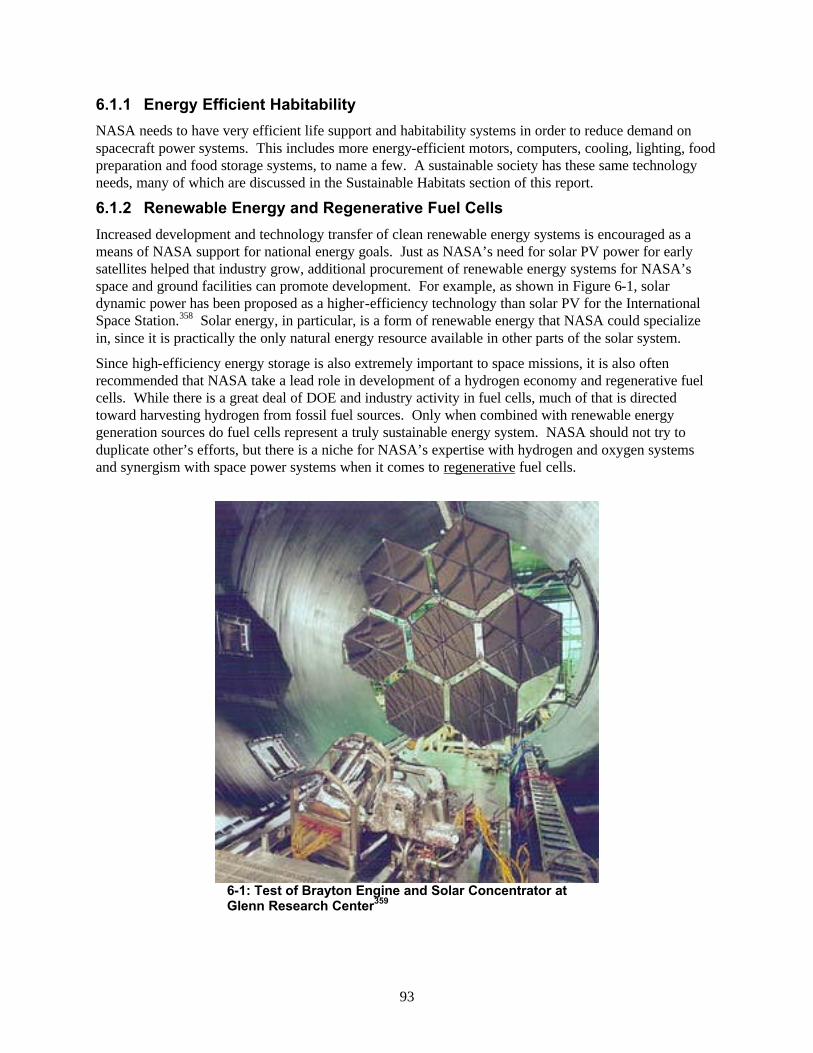
93
6.1.1 Energy Efficient Habitability
NASA needs to have very efficient life support and habitability systems in order to reduce demand on spacecraft power systems. This includes more energy-efficient motors, computers, cooling, lighting, food preparation and food storage systems, to name a few. A sustainable society has these same technology needs, many of which are discussed in the Sustainable Habitats section of this report.
6.1.2 Renewable Energy and Regenerative Fuel Cells
Increased development and technology transfer of clean renewable energy systems is encouraged as a means of NASA support for national energy goals. Just as NASA’s need for solar PV power for early satellites helped that industry grow, additional procurement of renewable energy systems for NASA’s space and ground facilities can promote development. For example, as shown in Figure 6-1, solar dynamic power has been proposed as a higher-efficiency technology than solar PV for the International Space Station.358 Solar energy, in particular, is a form of renewable energy that NASA could specialize in, since it is practically the only natural energy resource available in other parts of the solar system.
Since high-efficiency energy storage is also extremely important to space missions, it is also often recommended that NASA take a lead role in development of a hydrogen economy and regenerative fuel cells. While there is a great deal of DOE and industry activity in fuel cells, much of that is directed toward harvesting hydrogen from fossil fuel sources. Only when combined with renewable energy generation sources do fuel cells represent a truly sustainable energy system. NASA should not try to duplicate other’s efforts, but there is a niche for NASA’s expertise with hydrogen and oxygen systems and synergism with space power systems when it comes to regenerative fuel cells.
6-1: Test of Brayton Engine and Solar Concentrator at Glenn Research Center359

94
6.1.3 Electric Vehicles
Robotic electric vehicles such as “Spirit,” shown in Figure 6-2, are already exploring Mars. Technologies from these vehicles can potentially help improve cars and other vehicles on Earth as more emphasis is placed on electric and hybrid vehicles as a means of improving environmental sustainability. JSC is developing fuel cell-powered rovers for future human exploration of the Moon and Mars. Thus, NASA can play an important role in the further development of electric vehicles for on- and off-road uses.
6-2: Mars Solar Electric Vehicle “Spirit”
6.1.4 Waste and Water Reuse
As humankind ventures farther away from Earth, we must reuse the water we take along and eventually even our waste. The Advanced Life Support Office at JSC is investigating ways to recycle air-conditioning condensate, wash water, and even urine.104 In bio-regenerative or physicochemical systems, it may be possible to recover useful compounds from human waste and other sources. These types of technologies, such as composting and supercritical water oxidation, hold promise for closing the materials loop in space and on Earth. Thus, research in these areas has a dual benefit.
6.2 JSC Projects The JSC projects and studies presented below are recommended as ways to promote sustainability through demonstration of technologies at our facilities that may or may not be commercially available yet. Since NASA is a leader in developing new technologies for space, it makes sense to also apply our technological talents in our mission to “protect our home planet.”
6-3: Solar-Powered Recharge Station at JSC’s Mars Terrain

95
6.2.1 Solar Recharge Station
In a small pilot project, the JSC Environmental Office has already collaborated with the Advanced Extravehicular Activity (EVA) group to bring a more prototypic and environmentally friendly power source to JSC’s EVA Remote Field Demonstration Test Site, which simulates the surface of Mars for Earth-based testing of EVA and robotic equipment. The solar recharge station shown in Figure 6-3 will be used to power and recharge electric tools and equipment during field tests at JSC. It consists of a 120-watt solar PV panel, gel-cell lead-acid battery, charge controller, inverter, 12-Vdc and 110-Vac power outlets, and a mobile frame. It was designed and built with commercially available components by Solarcraft, Inc., in Stafford, Texas.
The solar station provides a quieter and more prototypic power source for space suit tests than the gasoline generator used previously. While emissions from small gasoline engines are not currently regulated nor quantified here, all fossil fuel-powered machines have been under examination due to Houston’s persistent air pollution problem. Other uses of gasoline and diesel engine generators at JSC should be studied to see if there are other candidates for switching to more environmentally sustainable technologies. With all the advanced technology work going on at JSC, the solar recharge station is one good example of how state-of-the-art technology can be applied to improve life on Earth as well as explore space.
6.2.2 Self-Contained Solar Refrigerator
JSC research and technology development has led to the battery-free solar refrigerator innovation shown in Figure 6-4.303 JSC could work with NASA power system researchers at other locations to get a very high-efficiency PV panel to integrate with the battery-free solar refrigerator. By mounting it in the space available on top of JSC’s refrigerator, a demonstration unit could be created for use at outdoor functions at JSC and elsewhere. This unit would then showcase two NASA technologies while in the process of providing useful cooling.
6.2.3 Fuel Cell Uninterruptible Power Supply
The JSC Environmental Office and Energy Systems Test Branch purchased and installed a commercially available AirGen. This first-generation PEM fuel cell UPS is shown in Figure 6-5. The system will be evaluated for performance and ease of operations as a backup power source for critical test computers and other equipment. If successful, this technology may be useful to eliminate batteries in various facilities at JSC and even aboard spacecraft.
6.2.4 Building-Integrated Fuel Cells
As fuel cell technology becomes more commonplace and affordable, more and more businesses, and even individuals, will begin to generate their own power. At least in the near future, the fuel of choice will probably be natural gas. Of the fuel cell technologies described in section 4.4, phosphoric acid and PEM are the best candidates for integration into a building at JSC, and the United Technologies Corporation phosphoric acid fuel cell is the only one over 10 kW capacity that is commercially available today. Their model PC25C fuel cell requires natural gas, water, and nitrogen for startup and shutdown purges, and an
6-4: Battery-Free Solar Refrigerator

96
external cooling module and/or system that will utilize the waste heat from the fuel cell. Electrical output is up to 200 kW at 480 volts; water and CO2 are produced as byproducts.
6-5: Commercial Fuel Cell UPS Installed to Back Up Power for a Test Computer at JSC
The PC25C model fuel cell was investigated for use at JSC and it was discovered that several pre-owned fuel cells may be available at a good price. If one of these models is installed at JSC and operated for several years, it could then be replaced by the leading technology at the time. Thus, a demonstration project using this technology is recommended. If a heat-driven air-conditioning or dehumidification system can also be demonstrated in conjunction with the fuel cell to utilize the waste heat, then the economic payback of the system should be improved. With its climate, JSC can use cooling and dehumidification for most of the year.
6.2.5 Fuel Cell Cart
Since there is currently a great deal of interest and emphasis on fuel cells for vehicles, including JSC’s own efforts to develop a fuel cell-powered rover for planetary exploration, a fuel cell cart demonstration project is recommended with application to JSC’s facility operation. Namely, a fuel cell utility cart used by landscaping crews would be a cleaner alternative to the gasoline carts currently used. These are low-speed vehicles that can be driven on roads and over grass. The onboard fuel cell power plant could also produce electricity while the cart is parked to power hedge clippers and other equipment. A preliminary investigation of this concept was done and found to be feasible using an existing electrically driven cart owned by JSC.281
A further terrestrial application of this general-size fuel cell would be to power riding lawn movers. If developed, this technology could help JSC and others deal with future energy restrictions, such as a possible ban on operation of gasoline-powered equipment during summertime morning hours. See section 4.1 for details.
6.2.6 Mission Control Backup Power
The largest requirement for backup power at JSC is to support mission control. This mission-critical capability has been provided by large diesel engines since the Apollo program. Currently, 5 diesel engines along with uninterruptible power supplies can provide the 1.5 to 3 megawatts of power required by mission control, with redundant capability. The engines are run for regular maintenance and whenever

97
severe weather threatens the area. Thus, they represent one of the larger sources of criteria air pollutants at JSC (see section 1.1.2).
To increase energy efficiency and reduce air pollution, a modern, combined heat and power system is recommended to provide backup power for mission control and other facilities at JSC. Heat produced by a fuel cell or gas turbine could be used to heat water, swimming pools, or buildings. For a large system such as required by mission control, steam could also be produced to distribute around the entire site.
Combined heat and power from gas turbines at JSC has been studied in the past (additional information will be provided in the Appendix, to be published internally in a later revision.), but Oak Ridge National Lab completed a new study in 2003 as part of DOE’s technical assistance program.360 The study found that a simple-cycle system with 2 Saturn 20 gas turbine/generators with heat recovery, supplemental firing, and inlet air cooling was feasible with a simple economic payback of 13 years. Redundancy requirements of this backup power application and inability to utilize all the waste heat prevent more efficient operation and a better payback scenario. Of course, the economic analysis is very sensitive to gas and electricity prices, so results should be reassessed as better information becomes available. Other combined heat and power architectures should also be studied, such as location of a similar or larger gas turbine at JSC’s central plant. As combined heat and power plants become more readily available, this option for building backup power should become even more attractive for JSC and other similar facilities (see sections 4.3.3, 4.3.13.3, and 4.3.13.4).
6.2.7 Energy Conservation and Efficiency Efforts
While it is a good idea to consider advanced technology options to save energy, the best place to start saving energy is usually with conservation as described in section 4.3.1. A large part of using energy more wisely is understanding how much goes where. Thus, JSC should strengthen its monitoring efforts for electricity and natural gas usage.
Beyond energy conservation, new developments in energy efficiency technologies should be constantly monitored. Section 4 of this report should provide a wealth of information and sources to make this easier. Some specific recommendations for energy conservation and efficiency at JSC are described below.
6.2.7.1 LED Traffic Lights
Though no analysis was done on this technology, it is recommended that JSC replace all traffic light bulbs with LEDs based on their Energy Star rating and the fact that many cities have already found them to be preferable.
6.2.7.2 Computer Power Settings
Since most computers at JSC are supplied and maintained by a single organization, it would be relatively easy to change the default power settings on personal computers to automatically power down the monitor, and possibly the hard drive, after 20 or 30 minutes of non-use. Individual users should be allowed to change their own settings to their own personal preferences, but many would stay with the default. Specific guidelines should be developed in conjunction with the Information Resources Directorate. As shown in section 5.2.2.5, this action could save a significant amount of electricity at JSC.
6.2.7.3 Set-Back Thermostats
Buildings connected to the JSC central chilled water system as well as some others already have controllers that shut off air-handlers during non-work hours to conserve energy. Working together with the facility managers in each building, these schedules should be reviewed to determine if the powered off time can be extended, keeping in mind that the building will have some thermal capacitance.

98
Additionally, buildings without this capability should have an inexpensive set-back thermostat installed and programmed to reduce heating and cooling energy use.
6.2.7.4 Cool Roofs
As described in sections 4.5.2 and 5.2.2.9, special roofs that reduce building heat gain by reflecting a large part of the Sun’s rays can save a significant amount of energy in a hot climate. Thus, it is recommended that all future roof replacements at JSC use “cool roof” technology.
6.2.7.5 Science Freezers
Due to JSC’s leading role in life sciences, a large number of freezers (at various temperature levels) are used in ground facilities. Freezers are also required in space and current development efforts at JSC are focusing on energy efficiency as well as other mission requirements. As science sample preservation requirements are considered, JSC should strive to use the best commercially available cooling system and insulation technology, or even develop state-of-the-art cold stowage systems based on technology for spaceflight.
6.2.7.6 Low-Power Exit Lights
Exit lights are required for safety in all buildings, but due to their number and constant operation, they represent a fairly large electrical energy requirement. As discussed in sections 4.5.4.3 and 5.2.2.10, several modern technology options for low power exit lights exist. While many of JSC’s lights have already been replaced, some incandescent fixtures still remain. It is recommended that these, and possibly even others, be replaced with either LED or photoluminescent technology.
6.2.8 Air Conditioning Additives
Several brands of air-conditioning additives are on the market that report significant energy savings (see section 4.6.1.2). As shown in section 5.2.2.1, if the products live up to their claims, they would produce significant energy savings at JSC. To evaluate PROA products, a test was conducted on several 10- to 30-ton cooling-capacity units at JSC; test results will be provided in the Appendix, to be published internally in a later revision.. Unfortunately, while some units seem to show an increase in efficiency, thus far the test results have not been conclusive in demonstrating guaranteed savings.
6.2.9 Heat-Driven Air-Conditioning
Since heat is a form of energy, it can actually be used as the source to drive a cooling system. As described in section 4.6.1.8, this can be done in several ways. A very effective demonstration of sustainable energy technology would be to utilize solar or waste heat to power one of these types of systems. At JSC, it is recommended that this demonstration project be coupled with the building integrated fuel cell demonstration described in section 6.2.4. In Houston’s humid climate, a desiccant-type system whose primary function is to reduce humidity of the air (i.e. latent load) would be particularly interesting. Either a commercially available solid desiccant technology or a developmental liquid desiccant technology could be used.296 Either one may have applications on board spacecraft.
6.2.10 High-Efficiency Chillers
Higher-efficiency chillers and air-conditioners save energy and thus promote environmental sustainability. At JSC, the central plant chillers that produce chilled water for site-wide distribution are fairly efficient, running at about 0.6 kW/ton of cooling.283 Chillers and air-conditioners at outlying buildings not connected to the central system are not as efficient. These units may be good candidates for replacement with newer technology. While Energy Star rating is a minimum requirement at JSC, even higher-efficiency units may be available commercially or developmentally, as described in section 4.6.1.5. Units of this type should be considered for appropriate-size buildings at JSC.

99
6.2.11 Solar Water Heaters
Solar water heaters have been cost-effective at various times and locations for over a hundred years. Low natural gas prices in Texas have prevented widespread use; nevertheless, they are a mature and reliable technology that promotes environmental sustainability and compliance with Executive Orders. Applications where low-temperature heat is required (such as swimming pools) are particularly effective. As shown in section 5, significant reductions of both natural gas and carbon emissions can be achieved with this technology. It is recommended that JSC vigorously pursue installation of solar water heaters at the NBL, cafeterias, and all new buildings.
6.2.12 Sustainable Buildings and Test Facilities
The recently adopted policy at JSC to construct LEED-certified buildings should be continued and expanded. (LEED was described in section 4.5.) Existing facilities that are major resource consumers should also be studied from a sustainability standpoint. All options to accomplish the mission should be considered. At JSC, these assessments could include:
• Arcjetdue to its large power requirements
• Use of bio-diesel in all generators on site
• Vacuum chamber facilities
6.2.13 Alternative Fuel Vehicles
JSC’s use of alternative fuel vehicles under E.O. 13149 should be encouraged and expanded to all contractor fleet vehicles. Efforts should be made to obtain a local source of ethanol so that existing flex-fuel vehicles can use ethanol rather than gasoline. New technologies and the necessary infrastructure to support them should be investigated. This may include:
• Electric car recharging
• Hybrid gas-electric vehicles for increased fuel efficiency
• Hydrogen fuel cell cars
• Electric carts and work vehicles in place of larger gasoline-powered ones
6.2.14 Long-Range Planning Studies
It is important for federal facilities to have an up-to-date long-range plan to anticipate future mission requirements and to prepare for them in an efficient and sustainable manner. At JSC, specific consideration should be given to:
• Eliminating the central steam distribution system in favor of providing local building heating by fuel cells, solar, and direct natural gas heating
• Generating all electrical power from renewable resources on site
• Converting early on to a ‘hydrogen economy’ with integrated renewable electricity generation, hydrogen energy storage, and use of hydrogen for building and vehicle energy needs
• Studying the water distribution system. Consider past problems, life expectancy, and projected future requirements. Incorporate water reuse, if possible.
• Developing a reliable micro-grid using clean, secure energy sources or stand-alone backup power systems that incorporate available renewable energy sources with existing emergency battery systems
• Composting as much solid waste as possible on site

100
6.3 Management While many sustainability practices and behaviors can be realized through a change in culture and “grass-roots” efforts, there is no doubt that management actions can also promote sustainability. The recommendations below are ideas that JSC managers can use at different levels to improve our sustainable future.
6.3.1 Become an Exemplary Federal Facility
Nineteen outstanding federal facilities received the designation of Federal Energy Saver Showcase in 2002.361 These facilities are expected to save the government 32 million kWh or about $2 million in energy costs, each year. Besides the savings to the government, recognition such as this would give JSC an even better image in the community. Federal Energy Saver Showcase facilities are nominated by their respective agencies and feature energy efficiency, renewable energy, or water-conserving technologies designed to save natural resources and reduce operating costs.
JSC should join the DOE/EPA Labs 21 program described in section 2.2.1.3. Efforts to obtain better energy use data at the Center should be accelerated as well as alternative-fuel vehicle utilization. Demolition projects should be reassessed for their potential to be reused for a similar or altogether different purpose. For example, an old water tower could be used for non-potable irrigation water or an old structure could be used to hold solar panels. The Texas Parks Department has some innovative ways to use excess federal land that can even make money for the owners.362 JSC should explore these options. One award offered for environmental excellence in Texas by TCEQ is the Texas Environmental Excellence Award.363
6.3.2 Increase Employee Awareness
JSC management and the Environmental Office can do many things to increase employee awareness of environmental sustainability principles. This should have the effect, over time, of reducing resource utilization at the Center. Specific actions that could be taken include:
• List on a JSC Web site the names of personnel who bike, vanpool, or drive hybrid or electric vehicles to work. Salute them as “JSC Future Thinkers.”
• Invite companies with sustainability products to market to JSC employees at a volume discount.
• Use pencils made of recycled materials with the saying “Close the Loop, Recycle” to spread the message.
• Initiate new sustainability training programs. Cooperate with other groups, such as TCEQ or the Natural Step, who have similar interests. In fact, JSC held a pilot class for one directorate in August 2001. These efforts should be continued.
• Actively promote the NASA headquarters code JX and JE Sustainability training courses, which were recently developed.
• Use e-mail announcements and signs in the cafeterias to educate about recycling, renewable energy, affirmative procurement, and other positive activities that employees can participate in at JSC.
• Encourage employees to represent NASA at community events such as Earth Day celebrations or renewable energy fairs.
• Join the million solar roofs partnership (http://www.texasmillionsolarroofs.org/).
• Educate employees on actions they can take, such as checking for available used equipment before purchasing new items. The DOD has a large depot of federal equipment in San Antonio.

101
6.3.3 Procurement Practices
JSC management and the Environmental Office should emphasize and expand many of the good sustainability practices already in place at the Center. There are several excellent sources for shopping “green” as described in section 2.2.4.6. Affirmative procurement is policy at JSC, but additional actions could be taken to facilitate this. For example, coming up with contract language to put in new contracts is important. Kennedy Space Center is working as NASA’s lead center for recycling and affirmative procurement to try to get appropriate language into specifications.
JSC could also purchase more renewable energy. Dyess Air Force Base has a new wind power contract that will provide 100% of the energy needs for the base for two years, which is estimated at 78 million kWh annually.364
6.3.4 Partnerships
JSC recently signed the Texas Environmental Partnership charter agreement at Randolph Air Force Base in San Antonio. Signatories to the charter included representatives from the Texas Natural Resource Conservation Commission, EPA, Texas, DOD component installations (USAF, USN, USA), USCG, DOE, U.S. Fish and Wildlife Service, and NASA JSC. The purpose of the partnership is to promote an open dialogue and environmental information exchange between the state and federal environmental regulators and Texas sited federal facility installations to improve compliance and reduce the generation and release of pollutants.
The multi-angle imaging spectroradiometer, an instrument that flies on NASA's Terra satellite, is helping researchers find out exactly where, how much, and what type of pollution is in Houston. This project is a good example of a partnership between NASA, universities, and a state agency.365
Through Space Act Agreements or other mechanisms, JSC could work with universities and organizations such as HARC143 to apply space age technology to everyday environmental issues.
6.3.5 Sustainable Technology Projects in Existing Programs
Various funding mechanism already exist within NASA for technology development projects. It is possible that some of these can be used with slight modification to develop technology for NASA’s terrestrial mission in addition to its space mission. For example, a new subtopic for environmental sustainability could be created or adapted in the Small Business Innovative Research Program. Likewise, the Center Director’s Discretionary Fund could set aside funding for in-house projects in environmental sustainability. Much NASA-sponsored university R&D is already involved with terrestrial applications, but an effort should be made to bring these technologies forward by implementing them at federal facilities. Other existing programs that could be integrated into the sustainability theme involve education. These are described below.
6.3.6 Education Outreach
NASA has a new focus on education as described on some excellent Web sites:
http://edspace.nasa.gov/
http://education.nasa.gov
Education may well be the most important factor in promoting environmental sustainability. Most people care about the environment we live in, but often, children and adults alike simply lack the information to understand the workings of our atmosphere and our ecosystems. As described in section 2.3.3.1, many universities already have extensive programs in environmental studies.
Many universities also have programs to engage teams of senior-level engineering students in solving real world problems, mainly through industry sponsorships. JSC has sponsored projects such as this in the

102
past, giving students space-related problems to solve. NASA could further exploit this method of getting work done and extend the focus of projects to more sustainability issues. One avenue that already exists for student projects is the Texas Space Grant Consortium.366 The Space Grant Consortium has national coverage and has various programs that focus on Earth, air, and space education.
JSC could support sustainability by devoting some researchers from the Summer Faculty Fellowship program or Graduate Student Research Program to work with the Environmental Office.
The goals of the Space Agriculture in the Classroom program are to increase awareness of the role agriculture plays in the economy and society, increase awareness and excitement in the space program and to train tomorrow's scientists and engineers, among other things. If coordinated effectively, this type of outreach could also promote environmental sustainability and increased efficiency in agriculture. Innovative ways of using the Internet, satellites, and mobility have also been used by other organizations such as Journey to Forever to educate and help people around the world.367
JSC already has some education outreach activities that promote environmental awareness. These include “Recycling in Space,” model solar car design, and the solar go-cart shown in Figure 6-6.
6.3.7 Public Relations and Community Outreach
As JSC strengthens its environmental sustainability performance and educates its own workforce, it will be logical and useful to share information and accomplishments with the public. Some ideas would be community information meetings, technical papers, a Web site, and a display about JSC’s sustainability efforts at various public forums. Outreach related to “greening the government” is encouraged in E.O. 13148.
NASA’s strengths can be emphasized. For example, NASA has experience with reliable power supplies in remote locations and with extreme environments. And NASA works on developing new technology every day. An Agency-wide meeting could be organized to discuss NASA's potential contributions to “sustainable” technologies.
Local efforts such as Cool Houston or the Houston Federal Executives Board’s activities for clean air in Houston could be supported.
6.3.8 Technology Transfer
Part of JSC’s mission is to transfer technology to U.S. industries.368 As more emphasis is placed on synergism between space and terrestrial problems, it is likely that additional technologies, which solve environmental problems on Earth, will be developed. By working closely with advanced integrated facilities testing life support and other technologies at JSC, commercialization of these technologies can be enhanced.
6-6: Solar-Powered Go-Cart Education Project at Seabrook Intermediate School

103
6.3.9 Sustainability Partnership
Sustainability champions should be appointed in various organizations to emphasize and coordinate environmental sustainability activities at the Center. A cross-directorate working group or “Sustainability Partnership” could be an effective way to promote teamwork toward a goal that is good for everyone. One suggestion for a slogan is “JSC Sustainability ProjectClose the Loop!”
6.4 Further Study Of course, there is always room for improvement and there are many more ideas that could be explored. Thus, several recommendations for further study and continued action are presented below.
6.4.1 Sustainability Indicators
The 15 JSC Sustainability Indicators proposed here should be periodically reviewed and revised as necessary to provide a good measure of JSC’s environmental performance. Specific measures to add, if possible, are:
• Steel or ‘scrap’ metal use and recycling
• Indicators that gauge progress in transportation such as reduced petroleum consumption and air emissions
• A measure of hazardous wastes that are recycled
Improvements could be made in estimating the amounts of new materials such as paper and metals that come into JSC. Then, measurement of what percentage is recycled will be more accurate.
6.4.2 Systems Analysis
The systems analysis presented here should be expanded in both breadth and depth. Some technologies were described in this report but not refined into specific implementations in order to calculate the sustainability benefits. These should be included along with additional innovative ideas as they arise.
In order to reflect as accurately as possible the total environmental effects of our operations, this analysis should be expanded to include as many system-level effects as possible. An important second order effect that was included in the analysis is the air emissions that result from JSC’s energy consumption both on site and off site. However, additional second- and third-order effects were not included, such as the additional energy used when aluminum is not recycled, and the subsequent air emissions that result from that. Recommendations for additional effects to be included in future analysis are discussed below.
No effects of transportation were included in the present analysis, but should be incorporated in future analyses. This includes government and contractor cars, trucks, and aircraft. Personal vehicles could also be included to capture the benefit of improvements in commuting to work.
6.4.2.1 Additional Technologies
Additional technology ideas that should be refined and analyzed include:
• Crop-based foods requiring little energy
• Efficient motors
• Efficient computers
• Control systems for energy conservation
• Energy-saving paints
• Carbon sequestration
• Solar thermal power generation
• Bio-diesel
• Hydrogen energy storage
• Flywheels
• Fuel cell lawn mowers
• Energy-efficient windows

104
• LED lighting
• Daylighting
• MEMS cooling
• Heat pipe heat exchanger
• Thermal storage for air-conditioning
• Liquid desiccant dehumidification
• Vacuum insulation
• Instantaneous water heaters
• Efficient vending machines
• Hazardous waste treatment
• Reuse/recycling of waste
• Disposable cup/utensil alternatives
• Rechargeable batteries
• Water reuse for irrigation
Additionally, the broad areas of transportation and nanotechnology show great promise for further exploration, as they were only touched on briefly in this report.
6.4.2.2 Second-Order Effects
To make the systems analysis of environmental sustainability as complete as possible, it is recommended that the following factors be included in future analysis efforts if possible:
• Air emissions due to solid waste
• Energy use due to water consumption
• Water use due to energy production
• Water and/or energy use due to hazardous waste
• Water and energy use due to new paper, aluminum, and steel use
An EPA publication369 and the JSC Environmental Office Web site370 have information about the environmental and financial benefits of recycling.
6.4.3 Cost and Benefit Analysis
For technologies that show the greatest promise from this study, the next level of analysis should be performed, including the costs and benefits of implementing the idea at JSC. A complete economic assessment of the options should be based on all utility costs and hidden costs such as maintenance, and cost to society (externalities) such as pollution and its health effects.
7 References 1 “The State of World Population 2001,” http://www.unfpa.org/swp/2001/english/ch01.html. 2 Factor 4. Weizsacker, Ernst von, Lovins, Amory B. and Lovins, L. Hunter, Factor Four: Doubling Wealth, Halving Resource Use, Earthscan Publications Ltd., London, ISBN 1853834076, copyright 1997). 3 Brown, Lester R., Eco-Economy: Building an Economy for the Earth, W.W. Norton & Company, 2001. 4 Ibid, p. 193. 5 Brown, Lester R., Paving the Planet: Cars and Crops Competing for Land, for the Earth Policy Institute, February 14, 2001, http://www.earth-policy.org/Alerts/Alert12.htm. 6 EPA Urban Heat Island Mitigation Initiative,” http://satellite.zodiak.com/destination/frames_version/EPA-UHI.htm.

105
7 “Air Pollution Prevention Through Urban Heat Island Mitigation: An Update on the Urban Heat Island Pilot Project,” Virginia Gorsevski, et al., http://www.ghcc.msfc.nasa.gov/uhipp/epa_doc.pdf. 8 “Recommendations for Environmental Improvement,” Report of Houston Environmental Foresight Habitat, Parks and Water Issues Work Group, December 2000, Houston Advanced Research Center. 9 “Environmental Medicine” by Walter J. Crinnion, http://www.thorne.com/altmedrev/fulltext/med5-1.html; http://www.thorne.com/altmedrev/fulltext/envmed5-2.html. 10 EPA Six Principal Pollutants Web site, http://www.epa.gov/airtrends/sixpoll.html. 11 Green-e Renewable Electricity Certification Program – Health Web site, http://www.green-e.org/your_e_choices/health.html. 12 Galveston-Houston Association for Smog Prevention, “Thirty Years of Negligence: History of the Houston SIP, 1970 to 2001,” www.ghasp.org/publications/sipchallenge/chronology.html. 13 Safe Water Systems, 2800 Woodlawn Drive, Suite 265, Honolulu, HI 96822, Tel: 808.539.3937, Fax: 808.539.3935, email: [email protected], http://www.safewatersystems.com/. 14 United Nations Population Fund Web site, http://www.unfpa.org. 15 “Why First World Solutions don’t work in Bangladesh,” Andrew Kohnhorst, pg. 19, A Common Place, a publication of Mennonite Central Committee, September 2001. 16 Brown, Eco-Economy, p. 155. 17 Citizens’ Environmental Coalition newsletter (spring 2003) reporting information provided by Texas Environmental Profiles. 18 Brown, Eco-Economy, p 174. 19 Brown, Eco-Economy, p. 146. 20 Brown, Eco-Economy, p. 50. 21 Brown, Eco-Economy, pp. 58-60. 22 Brown, Eco-Economy, p. 172. 23 Costanza, R. The value of the world's ecosystem services and natural capital. Nature, 387, 253-260, 1997. 24 U.S. Environmental Protection Agency Municipal Solid Waste Web site, http://www.epa.gov/epaoswer/non-hw/muncpl/facts.htm. 25 U.S Department of the Interior, Guiding Principles of Sustainable Design Web site, Ch. 9, http://www.nps.gov/dsc/dsgncnstr/gpsd/ch9.html. 26 Weizsacker, et al., p. 239. 27 Schmidt-Bleek, P. Wieviel Umwelt braucht der Mensch? Birkhäuser Verlag, Basel, 1994. 28 Texas Environmental Profiles: An Information and On-line Activism Resource for the State of Texas, State Summaries, http://www.texasep.org/html/wst/wst_1msw.html.

106
29 AUS-e-TUTE, CFCs and Ozone Depletion, http://www.ausetute.com.au/cfcozone.html. 30 The U.S Global Change Research Information Office, Environmental effects of ozone depletion: 1998 assessment, http://www.gcrio.org/UNEP1998/. 31 CFCs and Stiff Differential Equations at DuPont, Paul Davis, SIAM News, Vol. 28, No. 9, November 1995, http://www.siam.org/siamnews/mtc/0195111.htm. 32 “Montreal Protocol on Substances That Deplete the Ozone Layer”, 1987, prepared by the Center for International Earth Science Information Network/GCRIO, Washington, DC, http://www.ciesin.org/TG/PI/POLICY/montpro.html. 33 NASA Ames Research Center, Information Sciences and Technology Directorate, NASA Advanced Supercomputing (NAS) Division, Moffett Field, California; Educational Resources: Stratospheric Ozone Depletion. 34 Brown, Paving the Planet, pg. 246. 35 “Waves in the Atmosphere Batter South Pole, Shrink 2002 Ozone Hole,” top story (Goddard Space Flight Center web publication), December 6, 2002, http://www.gsfc.nasa.gov/topstory/20021206ozonehole.html. 36 EPA Global Warming Web site, http://yosemite.epa.gov/oar/globalwarming.nsf/content/Climate.html. 37 “Shifts in Rice Farming Practices in China Reduce Greenhouse Gas Methane,” NASA News Archive, http://earthobservatory.nasa.gov/Newsroom/NasaNews/2002/2002121911020.html. 38 DOE/EIA-0383(2003): “Annual Energy Outlook 2003 With Projections to 2025,” Energy Information Administration, January 9, 2003, http://www.eia.doe.gov/oiaf/aeo/. 39 Science 2002 November 1; 298: 981-987. 40 Dr. James Hansen, Goddard Institute, World Space Congress talk, Houston, Texas, October 18, 2002. 41 Advanced Technology Paths to Global Climate Stability: Energy for a Greenhouse Planet, Martin I. Hoffert et al., Science Magazine, November 1, 2002, Vol. 298, Number 5595, http://www.sciencemag.org/cgi/content/full/298/5595/981. 42 “Landcover Changes May Rival Greenhouse Gases as Cause of Climate Change,” top story (Goddard Space Flight Center web publication), October 1, 2002, http://www.gsfc.nasa.gov/topstory/20020926landcover.html. 43 American Petroleum Institute, Web site on Environmental Commitment, http://api-ec.api.org/environ/index.cfm?bitmask=99A691F1-5951-11D5-BC6800B0D0E15BFC. 44 Sir John Browne, Group Chief Executive of BP, in a speech to Stanford Graduate School of Business, March 11, 2002. 45 A globally coherent fingerprint of climate change impacts across natural systems, Camille Parmesan and Gary Yohe, Nature 421, 37–42, 02 January 2003, http://www.nature.com/cgi-taf/DynaPage.taf?file=/nature/journal/v421/n6918/abs/nature01286_fs.html. 46 Ice, Cloud, and land Elevation Satellite (ICESat) Web site from NASA Goddard Space Flight Center, http://icesat.gsfc.nasa.gov/. 47 U.S. Department of Energy Federal Energy Management Program Web site, http://www.eren.doe.gov/femp. 48 “Sustainable Development Strategies for Cleaner, Healthier Communities,” Patrick G. Lana, U.S. Dept. of Energy, Denver Regional Office, http://www.ccities.doe.gov/conference/pdfs/lana.pdf.

107
49 Energy Flow Charts for the United States, Lawrence Livermore National Laboratory, http://en-env.llnl.gov/flow/. 50 RIGZONE.com, “BP Announces Major Spending Plan in Gulf of Mexico”, Thursday, August 01, 2002, http://www.rigzone.com/news/article.asp?a_id=3966. 51 Brown, Eco-Economy, p. 86. 52 “Recommendations for Achieving Sustainable Communities”, Second National Conference on Science, Policy and the Environment, December 6-7, 2001, http://www.cnie.org/ncseconference/2001conference/report/2001_conf_report.pdf. 53 Energy Information Administration’s “Annual Energy Outlook (2003),” http://www.eia.doe.gov/oiaf/aeo/. 54 Brundtland Commission on Environment and Development (WCED, 1987), http://www.worldsummit2002.org/guide/brundtland.htm. 55 Sustainable Development Indicators Web page, http://www.sdi.gov. 56 World Resources Institute, MacKenzie et al., 1992. 57 Humboldt State University lecture slides, http://www.humboldt.edu/~envecon/ppt/309/unit4/tsld027.htm. 58 Brown, Eco-Economy, p. 235. 59 Brown, Eco-Economy, p. 244. 60 Romm, Joseph J., Cool Companies: How the Best Businesses Boost Profits and Productivity by Cutting Greenhouse Gas Emissions, Island Press, 1999, p. 3. 61 Nattrass, Brian and Altomare, Mary, The Natural Step for Business, New Society Publishers, 1999. 62 Home Page of economist Dr. William D. Nordhaus, http://www.econ.yale.edu/~nordhaus/homepage/homepage.htm. 63 Personal communication with Dr. Jim Airola, Assistant Professor of Economics, Naval Postgraduate School. 64 Nature science update, August 9, 2002, “Exploitation costs the Earth,” http://www.nature.com/nsu/nsu_pf/020805/020805-11.html. 65 “Economic Impacts of Texas Air Quality,” article in Spring 2003 “Reflector,” a publication of the Texas Solar Energy Society, reporting on the Perryman study “The Importance of Maintaining a Proper State Implementation Plan to Address Air Quality Issues in Texas: An Economic and Fiscal Impact Assessment.” 66 Friends of the Earth Web site, http://www.foe.co.uk/. 67 Chicago Climate Exchange Web site, http://www.chicagoclimatex.com. 68 Earth Simulator Web site, http://www.es.jamstec.go.jp/esc/eng/. 69 PROACT “Cross Talk” supplement edition, Air Force Center for Environmental Excellence, April 2001. 70 Center for International Earth Science Information Network, Environmental Sustainability Index Web page, http://ciesin.columbia.edu/indicators/ESI/.

108
71 PRO-ACT “Cross Talk” edition 82, Air Force Center for Environmental Excellence, May 2001. 72 Population Reference Bureau, “Population, Health, and Environment” Web page, http://www.prb.org/Content/NavigationMenu/Measure_Communication/Environment2/WSSD/WSSD.htm. 73 Official United Nations Web site for the Johannesburg Summit 2002 – the World Summit on Sustainable Development, http://www.johannesburgsummit.org. 74 UN Department of Economic and Social Affairs, Division for Sustainable Development Web page, http://www.un.org/esa/sustdev/. 75 UN Environment Programme, Division of Technology, Industry and Economics Web page, http://www.uneptie.org/. 76 “Energy Efficiency for Sustainable Development” presentation by Robert Card and Dr. David Kemp, http://fire.pppl.gov/wssd_card2_083002.pdf. 77 The Federal Network for Sustainability Web page, http://www.federalsustainability.org. 78 United States Environmental Protection Agency Web site, http://www.epa.gov/. 79 Technology Transfer Network Clean Air Technology Center, http://www.epa.gov/ttn/catc/. 80 United States Environmental Protection Agency Office of Research & Development Web site, http://www.epa.gov/ord/. 81 United States Environmental Protection Agency Center for Environmental Industry & Technology Web site, http://www.epa.gov/ne/assistance/ceit/index.html. 82 United States Environmental Protection Agency Environmental Technology Verification Program Web site, http://www.epa.gov/etv/. 83 United States Environmental Protection Agency Energy Star Web site http://www.energystar.gov. 84 United States Environmental Protection Agency Labs21 Web site, http://www.epa.gov/labs21century. 85 Department of Energy Office of Energy Efficiency and Renewable Energy Web site, http://www.eere.energy.gov/. 86 Sandia National Laboratories Renewable Energy Technologies Division Web site, http://www.sandia.gov/Renewable_Energy/renewable.htm. 87 Department of Energy National Renewable Energy Laboratory Web site, http://www.nrel.gov/. 88 Department of Energy National Renewable Energy Laboratory International Co-Control Benefits Analysis Program Web site, http://www.nrel.gov/icap/. 89 Department of Energy Sustainable National Renewable Energy Laboratory Web site, http://www.nrel.gov/sustainable_nrel/. 90 Department of Energy Press Releases Web site, http://www.energy.gov/engine/content.do?BT_CODE=PR_PRESSRELEASES&TT_CODE=PRESSRELEASE&PUBLIC_ID=14368. 91 Federal Energy Management Program overview Web site, http://www.eren.doe.gov/femp/aboutfemp/fempoverview.html.

109
92 Department of Energy’s Energy Efficiency and Renewable Energy Network Federal Energy Management Program Web site, http://www.eren.doe.gov/femp/aboutfemp/benefits.html. 93 Federal Energy Management Program SAVEnergy Program audit forms, http://www.eren.doe.gov/femp/techassist/audit.html. 94 Federal Energy Management Program industrial facilities Web site, http://www.eren.doe.gov/femp/techassist/industrial_facilities.html. 95 Federal Energy Management Program Technical Assistance Web site, http://www.eren.doe.gov/femp/techassist.html. 96 Biomass Research and Development Act of 2000, Public law 106-224, June 20, 2000. 97 EPA Newsroom, “Whitman Lauds Space Flight Center; First Federal Facility Using Landfill Gas as On-Site Energy Source,” May 8, 2003, http://www.epa.gov/newsroom/headline2_050803.htm. 98 NASA Destination Earth Web site, http://www.earth.nasa.gov/. 99 NASA Destination Earth Web page – A Vision for the Future, http://www.earth.nasa.gov/visions/index.html. 100 Goddard Space Flight Center’s Laboratory for Terrestrial Physics, http://www.eos.nasa.gov/. 101 The University of Texas at Austin Web site, http://www.utexas.edu/. 102 Jet Propulsion Laboratory, Ocean Surface Topography from Space Web site, http://topex-www.jpl.nasa.gov/index.html. 103 Space Daily, “NASA Helps Reclaim 15,100 Acres Of San Francisco Bay Salt Ponds,” July 14, 2003, http://www.spacedaily.com/news/earth-03t.html. 104 NASA Advanced Life Support Web site, http://advlifesupport.jsc.nasa.gov/. 105 Environmental Systems Commercial Space Technology Center Web site, http://www.ees.ufl.edu/escstc/. 106 NASA Food Technology Commercial Space Center, http://www.ag.iastate.edu/centers/ftcsc/. 107 NASA's Energy Efficiency and Water Conservation Program Web site, http://www.hq.nasa.gov/office/codej/codeje/je_site/about_us/about_us.html. 108 About Sustainability at NASA, NASA Headquarters Web page, http://www.hq.nasa.gov/office/codej/codeje/je_site/sustainability/about_sustainability.html. 109 Office of the Federal Environmental Executive Web site, http://www.ofee.gov/. 110 Report on Sustainable Design, Design for Maintainability and Total Building Commissioning For National Aeronautics and Space Administration Facilities Engineering Division, March 7, 2001. 111 NASA Environmental Management Reference Manual. 112 NASA JSC Source Reduction and Waste Minimization and Pollution Prevention Plan, January 2000; NASA Ellington Field and Sonny Carter Training Facility (Draft) Source Reduction and Waste Minimization and Pollution Prevention Plan, December 2000.

110
113 NASA's Energy Efficiency and Water Conservation Program Web page, http://www.hq.nasa.gov/office/codej/codeje/je_site/energy/about_energy.html. 114 Defense Environmental Network & Information Exchange Web site, https://www.denix.osd.mil/. 115 U.S. Department of State Web page Healthy Homes and Communities, http://www.state.gov/g/oes/rls/fs/2003/19942.htm. 116 EPA National Center For Environmental Research, Small Business Innovative Research Web site, http://es.epa.gov/ncer/sbir/. 117 NASA Small Business Innovative Research Web site, http://sbir.gsfc.nasa.gov/SBIR/SBIR.html. 118 Department of Energy Small Business Innovative Research Web site, http://sbir.er.doe.gov/sbir/. 119 Department of Defense Small Business Innovative Research Web site, http://www.dodsbir.net/. 120 National Council for Science and the Environment Web site, http://www.ncseonline.org/. 121 “Recommendations for Achieving Sustainable Communities: Science and Solutions, A Report from the second National Conference on Science, Policy, and the Environment, December 6-7, 2001, http://www.ncseonline.org/NCSEconference/2001Conference/report/page.cfm?FID=1692. 122 Texas Commission on Environmental Quality Web site, http://www.tceq.state.tx.us/. 123 Air Quality Index Web page, http://www.tnrcc.state.tx.us/cgi-bin/monops/psi_rpt. 124 Clean Texas Web page, http://www.tnrcc.state.tx.us/exec/sbea/cleantx/index.html. 125 The University of Texas at Arlington, Home Energy Conservation Series Web site, http://www.uta.edu/ees/listing.html. 126 Texas State Energy Conservation Office, Infinite Power of Texas Web site, http://www.infinitepower.org. 127 Texas Energy Partnership Web site, http://www.texasenergypartnership.org/. 128 Massachusetts Institute of Technology Joint Program on the Science and Policy of Global Change Web site, http://web.mit.edu/globalchange/www/reports.html. 129 EPA Colleges and Universities Web site, http://www.epa.gov/ne/assistance/univ/index.html. 130 Sustainable Oregon Web site, http://www.oregonsolutions.net/A_university/. 131 Brown University, Brown is Green Web site, http://www.brown.edu/Departments/Brown_Is_Green/index.html. 132 University of Technology Sydney – Sustainability Web site, http://www.sustainability.uts.edu.au/index.html. 133 The University of British Columbia, Sustainability Office Web site, http://www.sustain.ubc.ca/index.html. 134 Harvard University, Sustainability Science Web site, http://sust.harvard.edu/. 135 University of Texas Health Science Center at Houston Facilities Planning Department Web page, http://www.uth.tmc.edu/ut_general/admin_fin/ss/FPD/index.html. 136 Shell Center for Sustainability of Rice University Web site, http://www.ruf.rice.edu/~eesi/scs/.

111
137 Center for Biological and Environmental Nanotechnology at Rice University Web site, http://www.ruf.rice.edu/~cben/. 138 Environmental and Energy Systems Institute of Rice University Web site, http://www.ruf.rice.edu/~eesi/sustain/. 139 Energy Systems Laboratory at Texas A&M University Web site, http://www-esl.tamu.edu/esl_home_page.html. 140 The University of Texas at Austin Center for Energy and Environmental Resources Web site, http://www.utexas.edu/research/ceer/. 141 The University of Texas at Austin Applied Research Laboratories Web site, http://www.arlut.utexas.edu/. 142 Rocky Mountain Institute Web site, www.rmi.org. 143 Houston Advanced Research Center Web site, www.harc.edu. 144 Millennium Ecosystem Assessment Web site, http://www.millenniumassessment.org/. 145 Sustainable Village Web site, http://www.thesustainablevillage.com/. 146 The Natural Step Web site www.naturalstep.org. 147 DOE Office of Scientific and Technical Information report, http://www.osti.gov/bridge/product.biblio.jsp?osti_id=769578. 148 Appliance R&D at ORNL's Buildings Technology Center Web page, http://www.ornl.gov/ORNL/BTC/appl_randd.htm. 149 Joint Group on Pollution Prevention Web site, http://www.jgpp.com/. 150 U. S. Army Enviroquest Web site, http://www.envquest.com/default.asp. 151 G Net Website that promotes the use of innovative environmental technologies, http://www.gnet.org/. 152 “White Paper on Sustainability” on Building Design & Construction Web page, http://www.bdcmag.com/newstrends/BDCWhitePaperR2.pdf. 153 Environmental Sustainability Index Web page, http://www.heinzctr.org/ecosystems/index.htm. 154 Environmental Sustainability Index Web page, http://www.ciesin.columbia.edu/indicators/ESI/. 155 “Sustainable Development in the United States: An Experimental Set of Indicators,” report of the U.S. Interagency Working Group on Sustainable Development Indicators, http://www.sdi.gov/SDIG/sdig2001.doc. 156 Sustainable Development Indicators Web site, http://www.sdi.gov/. 157 NASA Environmental Tracking System Web site, http://nets.grc.nasa.gov. 158 Cleaner and Greener Reports, a Program of Leonardo Academy, http://www.cleanerandgreener.org/multipollutant.htm. 159 Leonardo Academy, Inc. Web site, http://www.leonardoacademy.org/. 160 Texas Electric Choice Web site of the Public Utility Commission of Texas, http://www.powertochoose.org/).

112
161 Power Scorecard Web page on Climate Change, http://www.powerscorecard.org/issue_detail.cfm?issue_id=1. 162 EPA Web page “Compilation of Air Pollutant Emission Factors, AP-42, Fifth Edition,” http://www.epa.gov/ttn/chief/ap42/. 163 Bristol-Meyers Squibb Company Sustainability Web site, http://www.bms.com/ehs/. 164 Sustainable Measures Web site, http://www.sustainablemeasures.com/index.html. 165 Sustainable Measures “Ecological footprint” Web page, http://www.sustainablemeasures.com/Indicators/IS_EcologicalFootprint.html. 166 Buddycom “Ecological footprint” Web page, http://www.buddycom.com/animal/envirimg/footprint/index.html. 167 Sustainable Community Roundtable “Ecological Footprint” Web page, http://www.olywa.net/roundtable/footprint/index.html. 168 Sustainable Community Roundtable Web site, http://www.olywa.net/roundtable/. 169 NASA Advanced Life Support Web site, http://advlifesupport.jsc.nasa.gov/. 170 Ewert, et al., “Advanced Life Support Requirements Document”, CTSD-ADV-245B, JSC38571B, October 2001. 171 Personal communication 10/14/03, Dr. John Graf, Johnson Space Center. 172 Hazardous Technical Information Services bulletin, July-August 2002, Defense Supply Center Richmond. 173 NASA Tech Briefs, November 2002. 174 PRO-ACT “Cross Talk”, edition 83, June 2001, Air Force HQ AFCEE/EQ, 314 E. Commerce St., Suite 200, San Antonio, TX 78205. 175 Brown, Eco-Economy, p. 147. 176 Brown, Eco-Economy, p. 149. 177 Brown, Eco-Economy, pp. 160-161. 178 No More Chernobyles Web page on Albert Einstein, http://www.ecn.cz/private/c10/einstein.html. 179 “Functional Properties, Sensory Characterization and Consumer Acceptance of an Extruded Ready-to-Eat Hydroponic Sweetpotato Breakfast Cereal” presentation to NASA Advanced Life Support Technical Interchange Meeting 11/21/02. 180 Weizsacker, et al., plate #5, 1997. 181 Educational Concerns for Hunger (ECHO) Web page on Saint Petersburg Urban Gardening Club, http://www.echonet.org/spugc/index_en.html 182 Personal communication with Ray Wheeler, NASA Kennedy Space Center. 183 Home page of Dr. Richard E. Smalley, http://smalley.rice.edu 184 Watts, Robert G., editor, Innovative Energy Strategies for CO2 Stabilization, Cambridge University Press, 2002.

113
185 Brown, Eco-Economy, p. 102. 186 Federal Computer Week, p. 42, December 2, 2002. 187 PC Magazine Web page on “NEC PowerMate eco,” http://www.pcmag.com/article2/0,4149,543807,00.asp 188 NASA Advanced Supercomputing Division Web page on Stratospheric Ozone Depletion http://www.nas.nasa.gov/About/Education/Ozone/ 189 “Cleaner Diesels,” pp. 18-20, Mechanical Engineering Power, ASME, July 1999. 190 DOE Office of Fossil Energy Web site, http://www.fe.doe.gov/ 191 NASA's Energy Efficiency and Water Conservation Program Web site, http://www.hq.nasa.gov/office/codej/codeje/je_site/about_us/about_us.html, p. 3-3. 192 NASA's Energy Efficiency and Water Conservation Program Web site, http://www.hq.nasa.gov/office/codej/codeje/je_site/about_us/about_us.html, p. 1-6. 193 U.S. Department of Energy, remarks by Secretary of Energy Spencer Abraham at May 14, 2003, National Coal Council meeting in Washington, D.C., http://www.energy.gov/engine/content.do?PUBLIC_ID=12802&BT_CODE=PR_SPEECHES&TT_CODE=PRESSSPEECH 194 Oak Ridge National Laboratory: Gabbard, Alex, “Coal Combustion: Nuclear Resource or Danger,” http://www.ornl.gov/info/ornlreview/rev26-34/text/colmain.html 195 Source: Renewable Energy World: Review Issue 2002-2003, James & James, London, publishers, pg. 33-47. 196 SpaceDaily Web site: “New Technique Could Lead to Widespread Use of Solar Power,” http://www.eren.doe.gov/power/success_stories/wind_cost.html 197 Perlin, John. From Space to Earth: The Story of Solar Electricity. aatec Publications. 06/01/1999. Ann Arbor, Michigan. 198 U.S. Department of Energy Office of Energy Efficiency and Renewable Energy: Photovoltaics, http://www.eere.energy.gov/RE/solar_photovoltaics.html 199 Global Solar Web site, http://www.globalsolar.com/ 200 “Driving PV System Costs Down”, pp. 35-39, Jan/Feb 2002, Refocus, the official magazine of the International Solar Energy Society. 201 NASA Glenn Research Center Web site: Contributions to International Space Station, http://www.grc.nasa.gov/WWW/PAO/issgrc.htm. 202 SpaceDaily Web site: “New Technique Could Lead to Widespread Use of Solar Power,” http://www.spacedaily.com/news/solarcell-03e.html. 203 Factor 4, p. 46. 204 Source: AFRL Technology Horizons, December 2002.

114
205 “High Power Density Photovoltaics,” pg. 106, Renewable Energy World, September-October 2002, James & James Ltd. 206 SunPower Web site, http://www.sunpowercorp.com/. 207 Berkeley Lab Research News Web site: “An unexpected discovery could yield a full spectrum solar cell,” http://www.lbl.gov/Science-Articles/Archive/MSD-full-spectrum-solar-cell.html. 208 Nature, February 6, 2003, Macmillan Publishers Ltd. 209 “Power from the Desert”, pp. 62-75, Renewable Energy World, James & James, Ltd., May-June 2003. 210 Mankins, John C., “The Promise and the Challenge of Space Solar Power in the 21st Century: Picking up the Gauntlet”, The World Space Congress 2002, Houston, Texas, October 10-19, 2002. 211 REFOCUS, a publication of the International Solar Energy Society, “Utilities in the sky?” pp. 54-57, December/November 2002, Elsevier Science Ltd. 212 “Solar Power via the Moon,” David R. Criswell, The Industrial Physicist, April/May 2002. 213 NASA Glenn Research Center Solar Dynamic Power (SDP) Overview http://space-power.grc.nasa.gov/ppo/projects/sdp/index.html. 214 Proton Energy Systems Web site, http://www.protonenergy.com/index.php/html/energysystems/home/index.html. 215 U.S. Department of Energy, Office of Energy Efficiency and Renewable Energy: Solar Water Heating Web Site, http://www.eere.energy.gov/erec/factsheets/solrwatr.html. 216 Texas State Energy Conservation Office Web site, http://www.infinitepower.org/. 217 University of Central Florida Florida Solar Energy Center Web site, http://www.fsec.ucf.edu/. 218 U.S. Department of Energy Fact Sheet: Concentrating Solar Power: Energy from Mirrors, http://www.eere.energy.gov/erec/factsheets/csp.html. 219 REFOCUS, a publication of the International Solar Energy Society, “World’s first down under?”, pp. 44,45, December/November 2002, Elsevier Science Ltd. 220 Center for Environmental Resource Management Web site, http://www.cerm.utep.edu. 221 U.S. Environmental Protection Agency Landfill Methane Outreach Program Web site, http://www.epa.gov/lmop/. 222 Personal communication with David Hickens, JSC Environmental Office. 223 Biodiesel emissions fact sheet, National Biodiesel Board, http://nbb.org/, http://nbb.org/pdf_files/emissions.PDF. 224 ISBN 1 902916 28 X, James and James, London. February 2002. 225 Renewable Fuels Association Web site, www.ethanolrfa.org. 226 “Chemical and Bioassay Analyses of Diesel and Biodiesel Particulate Matter: Pilot Study -- Final Report” By Norman Y. Kado, Robert A. Okamoto and Paul A. Kuzmicky. Department of Environmental Toxicology, University of California, Davis, California, 95616, for Howard E. Haines. The Montana Department of Environmental Quality,

115
The U.S. Department of Energy and The Renewable Energy Report Library, Montana State Library, 1515 East Sixth Avenue, Helena, Montana 59620-I 800, November 1996, http://journeytoforever.org/biofuel_library/UCDavisSumm.html. 227 U.S. Department of Energy, Office of Energy Efficiency and Renewable Energy, Biofuels for Sustainable Transportation Web site, http://www.ott.doe.gov/biofuels/what_we_do.html. 228 GNET News Center Web site: “Hydrogen Research Project Delivers,” http://www.gnet.org/news/newsdetail.cfm?NewsID=22050. 229 Peter Behr, Washington Post Staff Writer, Tuesday, June 3, 2003; Page E01. 230 Keller, J., “Evaluation of Various Energy Storage Systems”, Lockheed Martin Space Operations report # MSAD-03-0218, July 18, 2003. 231 “Recharging the Power Grid”, p. 50, Technology Review, March 2003. 232 home power: The Hands-On Journal of Home-Made Power Web site, Batteries page, http://www.homepower.com/magazine/downloads_batteries.cfm. 233 U.S. Department of Energy, Office of Energy Efficiency and Renewable Energy, Hydrogen, Fuel Cells & Infrastructure Technologies Program, http://www.eere.energy.gov/hydrogenandfuelcells/. 234 REFOCUS, a publication of the International Solar Energy Society, “High Energy,” pp. 58,59, December/November 2002, Elsevier Science Ltd. 235 American Solar Energy Society, Renewable Hydrogen Forum: A Summary of Expert Opinion and Policy Recommendations, http://www.ases.org/hydrogen_forum03/Forum_report_c_9_24_03.pdf. 236 National Science Foundation, Office of Legislative and Public Affairs: “New Catalyst Paves Way for Cheap, Renewable Hydrogen,” http://www.nsf.gov/od/lpa/news/03/pr0369.htm. 237 Solar Hydrogen Energy Corporation Web site: “Government of Canada to fund Solar Hydrogen Energy Corporation's Process for Producing Hydrogen from Water Vapour,” http://www.shec-labs.com/press/releases/2003Apr21press.htm. 238 AFRL Technology Horizons, June 2003, pp. 32,33. 239 Fuel Cells 2000The Online Fuel Cell Information Center, http://www.fuelcells.org/fcfaqs.htm. 240 U.S. Department of Energy, Office of Energy Efficiency and Renewable Energy, Hydrogen, Fuel Cells & Infrastructure Technologies, Hydrogen Storage Technologies http://www.eere.energy.gov/hydrogenandfuelcells/hydrogen/storage.html. 241 European Fertilizer Manufacturers Association Web site, Production of Ammonia, June 2000, http://www.efma.org/publications/BAT%202000/bat01/index.asp. 242 Personal communication, George King, Former Director of Energy Programs, Houston Advanced Research Center. 243 Rocky Mountain Institute Web site, search for hydrogen, http://www.rmi.org/sitepages/art7516.php. 244 Intersociety Conference on Environmental Systems, SAE paper 2002-01-2406.

116
245 Hebner, Robert, Beno, Joseph, and Walls, Alan; Flywheel Batteries Come Around Again,” IEEE Spectrum, April 2002, pg. 46-51. 246 University of Texas at Austin News Web site: “University of Texas at Austin flywheel spins to a milestone speed record,” http://www.utexas.edu/opa/news/03newsreleases/nr_200311/nr_flywheel031106.html. 247 NASA Tech Briefs, p. 44, February 2003. 248 “The Dirt on Diesel”, Environmental Exchange, Houston Citizens Environment Coalition newsletter, May 2002. 249 “Flywheel Battery Commercialization Study,” EPRICSG Final report TR-113541, http://www.e2i.org/docs/TR-113541.pdf. 250 Capstone Web site, http://www.microturbine.com/index.asp. 251 DTE Energy Technologies Web site, “DTE Energy Technologies Signs Contract to Develop Microgrid at NextEnergy Site” http://www.dteenergy.com/pressRoom/pressReleases/DTechNextEnergy.html?searchType=&searchValue=DTE+Energy. 252 Nextek Power System Web site; http://www.nextekpower.com. 253 Personal communication, Reinhart Brueckner, JSC Facilities Engineering Division. 254 Cook, Brian, An Introduction to Fuel Cells and Hydrogen Technology, Heliocentris, Vancouver, BC Canada, http://www.fuelcellstore.com/products/heliocentris/INTRO.pdf. 255 “Proton Energy Systems Awarded Solar/PEM Fuel Cell Power System Project at China Lake,” http://www.corporate-ir.net/ireye/ir_site.zhtml?ticker=prtn&script=410&layout=6&item_id=374133. 256 Detroit, September 23, 2002/ PR Newswire-First Call. 257 U.S. Fuel Cell Council Web site, http://www.usfcc.com/. 258 Houston Advanced Research Center Web site, http://www.harc.edu/pressroom/02_0903.html. 259 Mechanical Technology Inc., Web site, http://www.mechtech.com/link.cfm?link=http://www.mtimicrofuelcells.com. 260 Case Western Reserve University Web Site: “CWEU researchers develop prototype of miniature fuel cell,” http://www.cwru.edu/pubaff/univcomm/fuelcell.htm. 261 Energy Info Source Web site: “Plug Power Completes U.S. Department of Defense Fuel Cell Demonstration Program,” http://www.energyinfosource.com/dg/news.cfm?id=17849. 262 BuildingGreen.com Web site: “Solar at the White House,” http://www.buildinggreen.com/news/white_house.html. 263 Greening the Building and the Bottom Line, Romm, Joseph J. and Browning, William D., copyright December 1994 (revised 1998) by Rocky Mountain Institute. 264 Lawrence Berkeley National Laboratory Center for Building Science News #15 Spring 1997. 265 Wolverton BC, Johnson A, Bounds K. Interior landscape plants for indoor air pollution abatement. 1989. National Aeronautics and Space Administration. John C Stennis Space Center, MS.

117
266 U.S. Green Building Council Web site, http://www.usgbc.org/. 267 Green Building Program, Sustainable Building Sourcebook, http://www.greenbuilder.com/sourcebook/. 268 Peter DeAntonio representing Sarnafil Inc., talk at Cool Houston meeting on 10/10/02. 269 Personal communication with Mike Meyers, DOE. 270 “Energy Savings of Heat-Island Reduction Strategies in Chicago and Houston (Including Updates for Baton Rouge, Sacramento, and Salt Lake City),” Konopacki, S. and Akbari, H., Lawrence Berkeley National Laboratory report # LBNL-49638, February 2002. 271 Kalwall Web site, www.kalwall.com. 272 Cabot Corporation Web site, www.cabot-corp.com. 273 Smalltimes magazine, March/April 2003, Smalltimes Media, LLC. 274 EERE NETWORK NEWS -- October 15, 2003. A weekly newsletter from the U.S. Department of Energy's Office of Energy Efficiency and Renewable Energy. 275 Daylighting collaborative Web site, http://www.daylighting.org/. 276 Energy Star Web site, lighting products exit signs: http://www.energystar.gov/index.cfm?c=exit_signs.pr_exit_signs. 277 Spinoff 2003, NASA Office of Aerospace Technology Commercial Technology Division, NP-2003-08-307-HQ, ISBN 0-16-067895-1, pp. 36-37. 278 Texas A&M University, Texas Water Savers; News of Water Conservation and Reuse in Texas; Volume 5, Number 1, Winter 1998: “Greywater reuse future depends upon definition and agencies’ rulings,” http://twri.tamu.edu/newsletters/TexasWaterSavers/tws-v5n1.pdf. 279 Stoney Creek Materials Web site, http://www.stoneycreekmaterials.com/index.html. 280 Corpus Christi Caller Times Web site, Texas Sports, “Air conditioning key to Houston’s chances of landing ’12 Games,” http://www.caller2.com/2001/july/14/today/texasspo/5262.html. 281 Morton, R.D., “Fuel Cell Powered Utility Cart Report,” Lockheed Martin report # MSAD-03-0245, July 28, 2003. 282 Science Daily Web site, http://www.sciencedaily.com/encyclopedia/Houston,_Texas. 283 Personal communication with Dennis Klekar, JSC Energy Manager. 284 Oak Ridge National Laboratory Buildings Technology Center Web site: Advanced Refrigeration, http://www.ornl.gov/ORNL/BTC/advrefr.html. 285 Hydro Cool Inc. Web site, www.hydrocoolonline.com. 286 ArticMaster Web site, http://www.articmaster.com/home.html. 287 Private communication with Terry Cohea of CompressShield, November 15, 2002, regarding field test results.

118
288 Gajanana C. Birur, Tricia Waniewski Sur*, Anthony D. Paris, Partha Shakkottai, Amanda A. Green, and Siina I. Haapanen, Jet Propulsion Laboratory, California Institute of Technology, Pasadena, CA, USA, Science Applications International Corporation, San Diego, CA, USA*, Micro/nano spacecraft thermal control using a MEMS-based pumped liquid cooling system, http://www.alumni.caltech.edu/~waniewsk/papers/waniewsk4.pdf. 289 Engineered Systems Web site: “New centrifugal chillers an instant hit at Sony CD facility,” http://www.esmagazine.com/CDA/ArticleInformation/Case_Item/0,2534,83344,00.html. 290 Mainstream Engineering Corporation Web site, http://www.mainstream-engr.com/. 291 BuildingGreen Web site: “Enhancing Dehumidification with Heat Pipes,” http://www.buildinggreen.com/products/heatpipe.cfm. 292 Ewert, M.K., “Terrestrial and Aerospace Solar Heat Pump Development: Past, Present and Future,” ASME, Solar 98. 293 U.S. Department of Energy Energy Efficiency and Renewable Energy Web site: Weatherization & Intergovernmental Program: Inventions & Innovation, http://www.oit.doe.gov/inventions/factsheets/energyconcepts.pdf. 294 Energy Concepts Co., LLC Web site, www.energy-concepts.com. 295 U.S. Department of Energy National Renewal Energy Laboratory, Advanced Desiccant Cooling & Dehumidification Program Web site, http://www.nrel.gov/desiccantcool/tech.html. 296 Keller, J.R., “Heat-Driven Air-Conditioning Options for the Johnson Space Center,” Lockheed Martin report #MSAD-03-0300, September 30, 2003. 297 Munters Web site, http://www.muntersamerica.com/. 298 DryKor Web site: Dehumidification and Cooling Products, www.drykor.com. 299 AIL Research web site, http://www.ailr.com/. 300 Kathabar Web site, http://www.kathabar.com/default.asp. 301 Personal communication with Donald Moritz, Lawrence Berkley Lab. 302 Winter, J., et al., “The Crew Refrigerator/Freezer Rack for the International Space Station,” paper # ES41-27, International Conference on Environmental Systems, Society of Automotive Engineers, 2001. 303 Ewert, M.K., “Commercialization of Solar Powered Refrigeration Systems,” American Solar Energy Society national conference, Austin, TX, June 2003. 304 Ewert, M.K., et al., “Experimental Evaluation of a Solar PV Refrigerator with Thermoelectric, Stirling and Vapor Compression Heat Pumps,” ASES, Solar 98. 305 SunDanzer Solar Refrigerators and Freezers Web site, http://www.sundanzer.com/. 306 Bergeron, D.J., “Solar Powered Refrigeration for Transport Applications: A Feasibility Study – Final Report”, for Sandia National Laboratories, March 23, 2001. 307 “Final Project Report: Direct Drive PV Refrigerators for Latin America and Technology Feasibility Assessment for Milk Tank Cooling”, Robert E. Foster, et al., NASA grant # NAG9-1303, October 2002).

119
308 United Nations Environmental Program Division of Technology, Industry, and Economics Web site: Solar Chill: The Versatile Solar Greenfreeze Refrigerator for Vaccine & Food Preservation, http://www.uneptie.org/ozonaction/library/tech/solarchill.pdf. 309 “Engineering Study: Thermal Energy Storage System at NASA Johnson Space Center,” ZBA, Inc., ZBA 1591, Feb. 1995. 310 “Study for Building 24 Steam Driven Chiller Replacement and Chilled Water Filtration,” NAS9-98097, DO 15, Shaw Smith & Associates, August 17, 2001. 311 American Chemical Society Web site, http://www.chemistry.org/portal/Chemistry?PID=feature_pol.html&id=be062a06f8df11d6f1c06ed9fe800100, November 19, 2002. 312 ABC News Web site, “SUV Fuel Efficiency down; EPA Releases Latest Gas Mileage Data,” http://abcnews.go.com/sections/business/DailyNews/epa_fueleconomy_001002.html October 2, 2001. 313 CNN Web site, http://www.cnn.com/2002/TECH/09/15/alternative.vehicles.ap/index.html. 314 Science Magazine: “Advanced Technology Paths to Global Climate Stability: Energy for a Greenhouse Planet,” http://www.sciencemag.org/cgi/content/full/298/5595/981. 315 Energy Star Concepts for Highway Vehicles, Greene, D.L., R.C. Gibson and K.G. Duleep, U.S. Department of Energy, Oak Ridge National Laboratory, June 2003 (ORNL/TM-2003/37) http://www.ornl.gov/%7Ewebworks/cppr/y2001/rpt/116286.pdf. 316 PRO-ACT Fact Sheet, July 2001, http://www.afcee.brooks.af.mil/pro-act. 317 Lubrizol, PuriNOx Technology Web site, http://www.lubrizol.com/PuriNOx/default.asp; Center for Transportation Research Web site, http://www.utexas.edu/research/ctr/program/diesel_eval.html. 318 Global Electric Motorcars, LLC Web site, http://www.gemcar.com/. 319 Rocky Mountain Institute Transportation Web site: The Hypercar Concept, http://www.rmi.org/sitepages/pid386.php. 320 EV World Communique Web site: “Fuel Cell Cars Will Make Hybrids Obsolete, GM Says,” http://www.evworld.com/databases/shownews.cfm?pageid=news061003-03. 321 Anuvu Inc. Web site, http://www.anuvu.com/autos.html. 322 Honda Corporation Web site, http://www.hondacorporate.com/environ_tech/index.html. 323 Ectos: Ecological City Transport System Web site, http://www.newenergy.is/ectos.asp. 324 Mother Earth News, April/May 2002, pp. 106-108. 325 7th world solar challenge 2003 Web site, http://www.wsc.org.au/. 326 NASA Dryden Flight Research Center, Environmental Research Aircraft and Sensor Technology Web site, http://www.dfrc.nasa.gov/Research/Erast/erast.html. 327 AeroVironment Web site: Unmanned Aerial Vehicles, http://www.aerovironment.com/area-aircraft/unmanned.html.

120
328 NASA Office of Aerospace Technology; NASA Aerospace Technology News Web site: “Electric Engines for Cars, Space Shuttle Experiments, UAVs, and now, Airplanes,” http://www.aero-space.nasa.gov/curevent/news/vol3_iss4/eengines.htm. 329 “The Space Elevator – Spaceflight Without Rockets,” USRA Researcher, Spring 2002, www.usra.edu. 330 “Texas: Number One in Hazardous Waste Production,” “Environmental Exchange,” April 2002 Newsletter of the Citizens’ Environmental Coalition. 331 Marshall Space Flight Center Marshall Star Newsletter, http://www1.msfc.nasa.gov/STAR/old_star/2-1-01.pdf. 332 Environmental Protection Agency; Beyond RCRA: Waste and Materials Management in the Year 2020 Web site; http://www.epa.gov/epaoswer/osw/vision.pdf. 333 Factor 4, p. 106. 334 Brown, Eco-Economy, p. 125. 335 Brown, Eco-Economy, p. 264. 336 Dr. Mike Modell, 3/14/02 presentation at JSC. 337 University of Florida Environmental Systems Commercial Systems Space Technology Center 2003 Annual Report, http://www.ees.ufl.edu/escstc/reports/ar2003-web/index.htm. 338 Weekly activity report 12/03/02, JSC Environmental Office. 339 Ag-Bag, International Ltd., Web site, www.ag-bag.com. 340 NASA/University of Florida Environmental Systems Commercial Systems Space Technology Center Web site, http://www.ees.ufl.edu/escstc. 341 The State of World Population 2001 Web site, Chapter 1: Overview, http://www.unfpa.org/swp/2001/english/ch01.html. 342 Gleick, P.H. 2000. The World's Water 2000-2001: The Biennial Report on Freshwater Resources. Island Press, Washington, D.C. 343 IslandOnline.net Web site, “The Moringa Tree: Nature’s Pharmacy”; http://www.islamonline.net/english/science/2003/02/article06.shtml. 344 CADDET Renewable Energy Web site, http://www.portalenergy.com/caddet/retb/no46.pdf. 345 http://twri.tamu.edu/twripubs/WtrSavrs/v5n1/article-01.html, written winter 1998, accessed 5/23/03. 346 Personal communication, Dr. Karen Pickering, Johnson Space Center, 8/28/02. 347 Jay Garland, Dynamac Corp., KSC, NASA Bioastronautics Investigators Workshop, Galveston, Texas, January 13-15, 2003. 348 Principal Investigator David Mazyck, Assistant Professor, University of Florida, [email protected], http://www.ees.ufl.edu/escstc. 349 Water for People Web site, http://www.waterforpeople.org.

121
350 Houston Advanced Research Center Mitchell Center for Sustainable Development Web site, www.harc.edu/mitchellcenter/mexico. 351 Rio Grande/Rio Bravo Basin Coalition Web site, www.rioweb.org. 352 “A Renewable Energy Vision,” pp. 28 – 33, Solar Today, Nov./Dec. 2002. 353 Kirk Hummel, JSC Air Quality Specialist, personal correspondence, 5/30/03. 354 Personal communication with Nick Mesloh, JSC Information Systems Directorate. 355 Department of Energy’s Renewable Resource Data Center, http://rredc.nrel.gov/wind/pubs/atlas/chp3.html#s_central. 356 NASA Johnson Space Center Advanced Technology Development Office Web site, http://atdo.jsc.nasa.gov/. 357 Department of Defense Environmental Security Technology Certification Program Web site, http://www.estcp.org/index.cfm. 358 NASA Glenn Research Center Power & Propulsion Office Web site, Solar Dynamic Power Overview page, http://space-power.grc.nasa.gov/ppo/projects/sdp/. 359 NASA Glenn Research Center Thermo-Mechanical Systems Branch Web site, http://www.grc.nasa.gov/WWW/tmsb/dynamicpower/doc/sd_gtd.html. 360 Pierce, F.E., Oak Ridge National Laboratory, “Assessment of CHP Application for NASA Johnson Space Center,” August 5, 2003. 361 Federal Energy Management Program Web site, Federal Success Stories, http://www.eere.energy.gov/femp/prodtech/successstories.html. 362 Personal communication with Sandy Parker, NASA Johnson Space Center. 363 Texas Environmental Excellence Awards Web site; http://www.teea.org/. 364 SolarAccess Web site: “SMA America Practices What They Preach”; http://www.SolarAccess.com, Abilene, Texas - February 11, 2003. 365 Jet Propulsion Laboratory: Getting the Big Picture on Houston’s Air Pollution; http://www.jpl.nasa.gov/earth/features/houston.cfm, January 7, 2003. 366 Texas Space Grant Consortium, http://www.tsgc.utexas.edu/. 367 Journey to Forever Web site, http://journeytoforever.org/. 368 Johnson Space Center Technology Transfer & Commercialization Office Web Site, http://technology.jsc.nasa.gov/. 369 U.S. Environmental Protection Agency Solid Waste and Emergency Response Web Site: “Puzzled About Recycling’s Value? Look Beyond the Bin” http://www.epa.gov/epaoswer/non-hw/recycle/benefits.pdf. 370 JSC Environmental Office Web site, http://www4.jsc.nasa.gov/scripts/org/ja/ja13/index.cfm.