joint monitoring of livestock stocking rates and rangeland
TRANSCRIPT

Available online at http://www.ifgdg.org
Int. J. Biol. Chem. Sci. 14(6): 1941-1956, August 2020
ISSN 1997-342X (Online), ISSN 1991-8631 (Print)
© 2020 International Formulae Group. All rights reserved. 8535-IJBCS
DOI : https://dx.doi.org/10.4314/ijbcs.v14i6.2
Original Paper http://ajol.info/index.php/ijbcs http://indexmedicus.afro.who.int
Joint monitoring of livestock stocking rates and rangeland vegetation of
Hombori district in Mali during the 2010-2011 dry season
Mamadou Oumar DIAWARA1*, Pierre HIERNAUX2, Eric MOUGIN3, Sory SISSOKO1,
Laurent KERGOAT3, Hawa Salif DIAKITE4, Abdoulaye DIALLO1 and
Nogmana SOUMAGUEL5
1 Département de Biologie, Faculté des Sciences et Techniques (FST), Université des Sciences, des Techniques
et des Technologies de Bamako (USTTB), Colline de Badalabougou, B.P. 3206 Bamako, Mali. 2 Hiernaux, Pierre, Pastoc, 30 chemin de Jouanal, 82160 Caylus, France.
3 Géosciences Environnement Toulouse (GET), Observatoire Midi-Pyrénées, Université de Toulouse, CNRS,
IRD, 14 avenue Edouard Belin, 31400 Toulouse Cedex – France. 4 Institut d’Economie Rurale (IER), Centre Régional de Recherche Agronomique de Sotuba (CRRA),
Laboratoire Sol – Eau – Plante, Unité Système d’Information Géographique et Télédétection, B.P. 262
Bamako, Mali. 5 Centre IRD de Bamako, Quartier Hippodrome, BP. 2528 Bamako, Mali.
*Corresponding author; E-mail: [email protected]
ABSTRACT
Sahel rangelands degradation is prone to many controversies. In Sahel, rangeland forage resources
availability is characterized by large spatial heterogeneity and wide seasonal and interannual variations. Pastoral
livestock systems adapt to these patchy and variation resources by herd mobility and some supplement feeding
that only partially overcome seasonal forage shortages in dry years. This study aimed at analyzing the relationship
between livestock stocking rates and forage availabilities during the 8-9 month dry season at the scale of the
Hombori district. Stocking rates were estimated by monthly count of livestock by species, sex and age classes at
the main pastoral water points. Herbaceous forage over the district was assessed at the onset of the dry season
over using NDVI-MODIS remote sensing calibrated with in situ measurements. In addition, forage availabilities
were monitored monthly in the service area of three selected water points as a function of distance from the water
point up to 12 km. The results indicated that despite the large numbers of livestock and the weak mobility of the
resident herds, the overall stocking rate in the Hombori district remains low, as it entails an average grazing
exploitation rate of only 9.4% of the fodder resource during the dry season. The grazing exploitation rate
invalidates the statement of widespread 'overgrazing' of forage resources by livestock in the Sahel often advanced
in rangeland ecology and management projects.
© 2020 International Formulae Group. All rights reserved.
Keywords: Rangelands, stocking rate, dry season, degradation rate, overgrazing, Sahel.
INTRODUCTION
The Sahel region located in tropical
Africa between the latitudes 12°N and 20°N, is
characterized by a dry monsoonal climate with
rainfall ranging from 100 mm in the north to
600 mm in the south (Nicholson, 2013).
Rainfall are highly variable between years and
the rainfall brought by convective events
M. O. DIAWARA et al. / Int. J. Biol. Chem. Sci. 14(6): 1941-1956, 2020
1942
during the wet season are very patchy (Frappart
et al., 2009).
Livestock numbers in this region are not
exactly known because of the poor reliability
and infrequent censuses. The livestock losses
during the drought periods in the six Sahelian
countries of West Africa (Mali, Senegal, Chad,
Burkina Faso, Niger and Mauritania) were
estimated between 25% and 50% of the
livestock numbers prior to the drought
depending on the country (Toulmin, 1985).
However, a succession of wet years
interspersed with very dry years that prevail
since the mid-90s led to the rebuilding of
livestock populations (Ickowicz et al., 2012).
Despite small ruminant higher mortality, their
number increased at a greater rate than cattle
because of the diversity of their diet selection
(Assouma et al., 2018) and their shorter
reproductive cycle with lower age at first
lambing/kidding and shorter duration between
successive lambing/kidding. Food and
Agriculture Organization of United Nations
(2007) estimated the average annual increase
of 4.1% for sheep and 5.9% for goats compared
with 3% for cattle in West Africa based on
national censuses.
The increase in livestock number
combined with the reduction in rangeland area
due to the expansion of cultivated fields in
southern Sahel increased grazing pressure is
often blamed of local environment degradation
(Lhoste, 2007). Moreover, pastoralism is
believed to lead desertification and the
progression of the Sahara Desert to the south
(Weber and Horst, 2011). The degradation
diagnostic put forward overgrazing with
seasonal stocking rates over the carrying
capacity of the rangelands (McLeod, 1997).
The carrying capacity concept also implies
well defined animal production objectives
which is a challenge in rangelands managed
communally with mixes of livestock species
and breeds. Moreover, herd seasonal mobility
and communal management of rangeland
resources in Sahel raise controversies as to the
validity of the carrying capacity concept in a
non-equilibrium ecosystem (Krätli et al.,
2015).
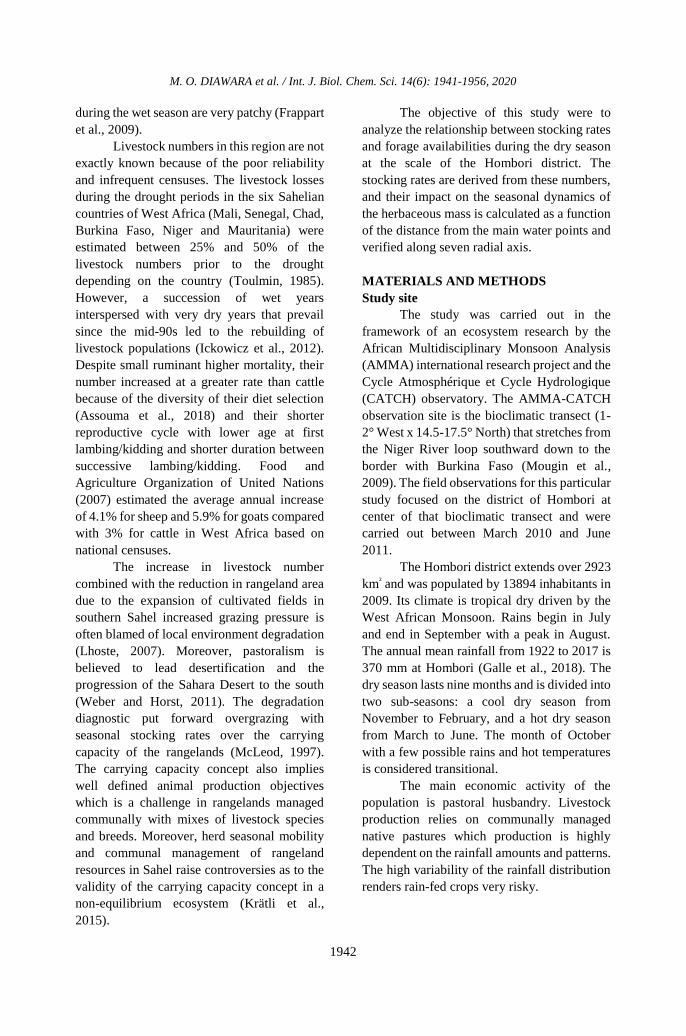
The objective of this study were to
analyze the relationship between stocking rates
and forage availabilities during the dry season
at the scale of the Hombori district. The
stocking rates are derived from these numbers,
and their impact on the seasonal dynamics of
the herbaceous mass is calculated as a function
of the distance from the main water points and
verified along seven radial axis.
MATERIALS AND METHODS
Study site
The study was carried out in the
framework of an ecosystem research by the
African Multidisciplinary Monsoon Analysis
(AMMA) international research project and the
Cycle Atmosphérique et Cycle Hydrologique
(CATCH) observatory. The AMMA-CATCH
observation site is the bioclimatic transect (1-
2° West x 14.5-17.5° North) that stretches from
the Niger River loop southward down to the
border with Burkina Faso (Mougin et al.,
2009). The field observations for this particular
study focused on the district of Hombori at
center of that bioclimatic transect and were
carried out between March 2010 and June
2011.
The Hombori district extends over 2923
km² and was populated by 13894 inhabitants in
2009. Its climate is tropical dry driven by the
West African Monsoon. Rains begin in July
and end in September with a peak in August.
The annual mean rainfall from 1922 to 2017 is
370 mm at Hombori (Galle et al., 2018). The
dry season lasts nine months and is divided into
two sub-seasons: a cool dry season from
November to February, and a hot dry season
from March to June. The month of October
with a few possible rains and hot temperatures
is considered transitional.
The main economic activity of the
population is pastoral husbandry. Livestock
production relies on communally managed
native pastures which production is highly
dependent on the rainfall amounts and patterns.
The high variability of the rainfall distribution
renders rain-fed crops very risky.

M. O. DIAWARA et al. / Int. J. Biol. Chem. Sci. 14(6): 1941-1956, 2020
1943
Rangeland vegetation monitoring forage
availability at the onset of the dry season
(NDVI-MODIS)
The herbaceous yield in late growing
season was measured in the four vegetation
sites listed above. The measure method was
destructive with cutting at ground level in
stratified random 1x1m samples along
transects of 1000 m long. The stratification was
done in two steps facieses may be recognized
when the species composition markedly
distinguishes between topographic,
geomorphological or land use components.
Each vegetation facies are stratified according
to apparent bulk of herbaceous layer in four
strata: O= bare soil, L=low, M= median and H=
high bulk densities (Hiernaux et al., 2009). The
stratification is recorded each meter along one
or two 1000 m long linear transect at each site.
Three (strata L and H) or six (strata M) random
samples 1x1 m, of the herbaceous layer are
selected along the transects to assess cover,
height, plant density, species composition and
to measure herbaceous mass by mowing at
ground level, drying and weighing. In the dry
season standing straws and litter are harvested
separately. The site variables were calculated
by weighting the strata means by the relative
frequency of the strata along the 1000 m
transect (Hiernaux et al., 2009).
The herbaceous fodder availability at
the end of the growing season, in the late
September, was assessed over the entire district
of Hombori and surroundings by the mean of a
linear regression:
HDMM = 9979.4 x mNDVI – 738.09 r =
0.75
established between the herbaceous dry matter
mass (HDMM, kg ha-1) measured in 12
vegetation sites and the wet season (10 June -
30 September 2010) mean of the Normalized
Difference Vegetation Index (mNDVI) (L3
Global 250 m) in 16 days composites
(maximum NDVI within the 16 days) provided
by the MODIS-Terra satellite (downloaded
from http://daac.oml.gov/modiswebservice).
Long term monitoring of Gourma
rangeland sites
The monitoring of rangeland resources
was initiated in 1984 on 30 vegetation sites
sampled by the International Livestock Center
for Africa (ILCA) and research teams of the
Institut d’Economie Rurale (IER). The goal
was to assess the impact of the drought that
occurred on the rangelands and pastoral
production systems in 1983-84 years and the
observations were continued till 1994. The
monitoring was resumed in 2000 under the
African Multidisciplinary Monsoon Analysis
(AMMA) – Cycle Atmosphérique and Cycle
Hydrologique (CATCH) observing system
(Mougin et al., 2009).
The 30 monitoring sites arranged along
bioclimatic and edaphic gradients were done
the regular measurements of herbaceous and
wood plant cover, standing mass and species
composition. Meteorological data such as
rainfall, temperature, wind speed and direction
of the wind, soil moisture were recorded. Ten
of 30 monitoring sites are located in the
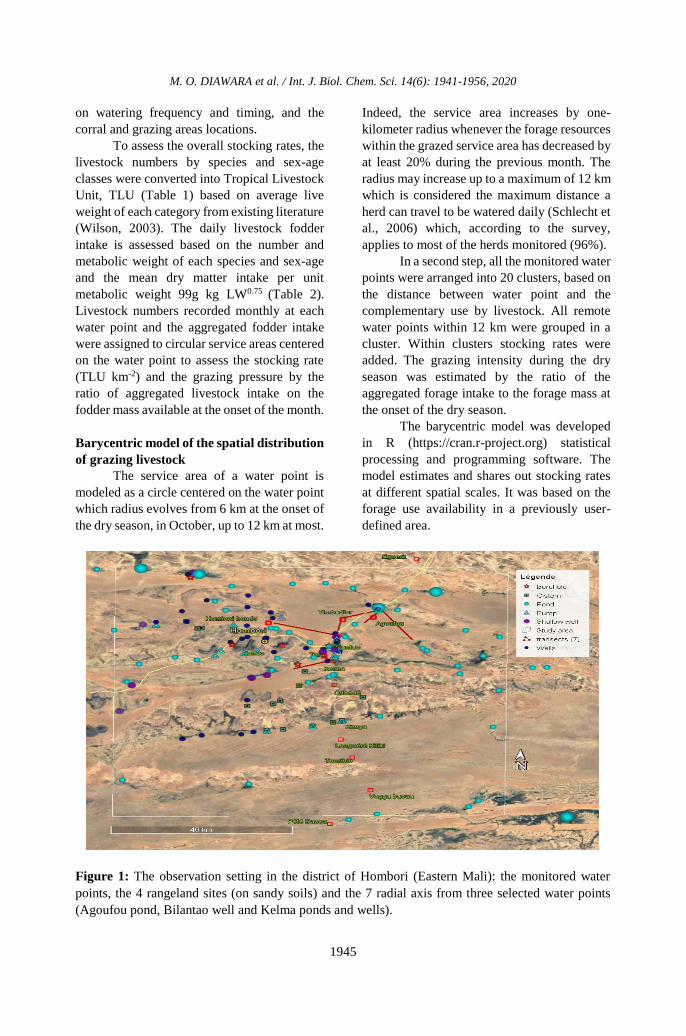
Hombori district and surroundings. Four of
these ten vegetation sites (Agoufou,
Timbadior, Hombori-Hondo and Tara), located
at various distances from permanent water
points were selected to conduct a monitoring of
the herbaceous vegetation and livestock
attendance during the 2010-2011 dry season
(Figure 1).
The four selected sites were subjected to
disparate seasonal grazing pressure allowing
the assessment of the impact of livestock on the
short-term dynamics of the herbaceous layer
during the dry season. This assessment was
conducted along a radial axis of 3 to 14 km long
with beacons every 500 m, radial from the
water points: the Agoufou permanent pond, the
well of Bilantao, temporary ponds relayed by
two wells in Kelma.
Monitoring of the Forage availability from
October to June
The forage availability from October to
June associate observations and destructive
measures performed in the four selected sites

M. O. DIAWARA et al. / Int. J. Biol. Chem. Sci. 14(6): 1941-1956, 2020
1944
under similar stratified sampling as for the
measure of September, to systematic visual
estimates performed along 7 axes each
radiating from three selected water points. The
field visual estimates were made for each 100
m segment along each radial transects, and they
include: the extent (%) of bare soil patches, the
proportion of standing straw (% extend of
classes) within the herbaceous mass also
composed of litter. To try and reduce estimate
errors, the assessments were preceded by auto-
calibration tests. These tests consist of the
visual estimation of the herbaceous mass and
the proportion of standing straw in a random
sample of 20 1x1 m quadrats along the radial
axis. Standing straws and litter are then
harvested and weighed and compared to the
estimations. These auto-calibration tests were
run several times during the dry seasons. From
the herbaceous mass measures on the 4
vegetation sites and estimates on the 7 radial
axis monthly loss rates of herbaceous mass
were calculated as the ratio of the difference in
mass between two consecutive observations
(Di, Di+1) on the mass at the first observation
reduced to a period of 30 days following the
equation:
(HDMM D – HDMM D1) / (HDMM D) x (30 /
D 1 - D)
HDMM (D1) denotes the herbaceous dry mass
measured at the date D1 and HDMM (D), the
herbaceous dry mass measured at the time D.
The dynamics of the herbaceous mass
during the dry season was also assessed by
remote sensing using the Soil Tillage Index
(STI), provided by MODIS (MCD43A4,
collection 5) every 8 days at a spatial resolution
of 500 m. The STI index is the ratio between
bands b6 (1628 - 1652 nm) and b7 (2105 - 2155
nm). It has been used to estimate dry season
forage mass (Jacques et al., 2014; Kergoat et
al., 2015). To estimate the mass of straws and
litter in the study area during the 2010-2011
dry season we used the linear regression
established by Jacques et al. (2014) between
the STI index and the dry season (2004-2011)
herbaceous mass (HDMM) of 20 of the
AMMA-CATCH long term vegetation sites in
the Gourma region including the 4 sites
retained in this study:
HDMM = 3371 x (STI - 1.06) r = 0.75
STI derived mass estimates were
extracted in the four selected sites and along
the seven radial transects and compared with
field estimates. The STI derived herbaceous
mass estimates were then used to assess the
forage seasonal dynamics over the whole study
area and particularly within the service areas of
the 55 seasonally monitored water points.
Monthly loss rates of herbaceous mass were
calculated from the STI derived estimates as
for field measures and estimates.
Monitored water points
Most of the water points in the Hombori
district are used to water livestock. They
capture the functional diversity of water
sources in the Sahel with temporary and
permanent ponds, deep and shallow wells,
boreholes and cisterns. Wells and boreholes
have lower capacities to provide water to
livestock because of the chore or the cost
required to draw the water out. Typically wells
and boreholes are used from March to June
depending on years and forage availability at
their vicinity. The cisterns are exploited in the
middle dry season with limited access due to
their small capacity and the competition of
other domestic uses. In a few sites, shallow
wells relay temporary ponds and give
opportunities to water livestock from March to
July of wet years and from February to May dry
years.
Herd monitoring
Livestock numbers per herd were
systematically recorded over 24 hours, once
every month at the water points on the same
day than the visual estimates of herbaceous
mass were performed along the radial transects.
Indeed, during the dry season livestock are
watered every day or every two days (Diawara,
2015) at a limited number of permanent water
points. For each herd, the timing and the
composition of the herd are systematically
recorded by species, sex and three age classes:
adult, weaned young and unweaned young.
Also, a survey is done with the herder/shepherd
M. O. DIAWARA et al. / Int. J. Biol. Chem. Sci. 14(6): 1941-1956, 2020
1945
on watering frequency and timing, and the
corral and grazing areas locations.
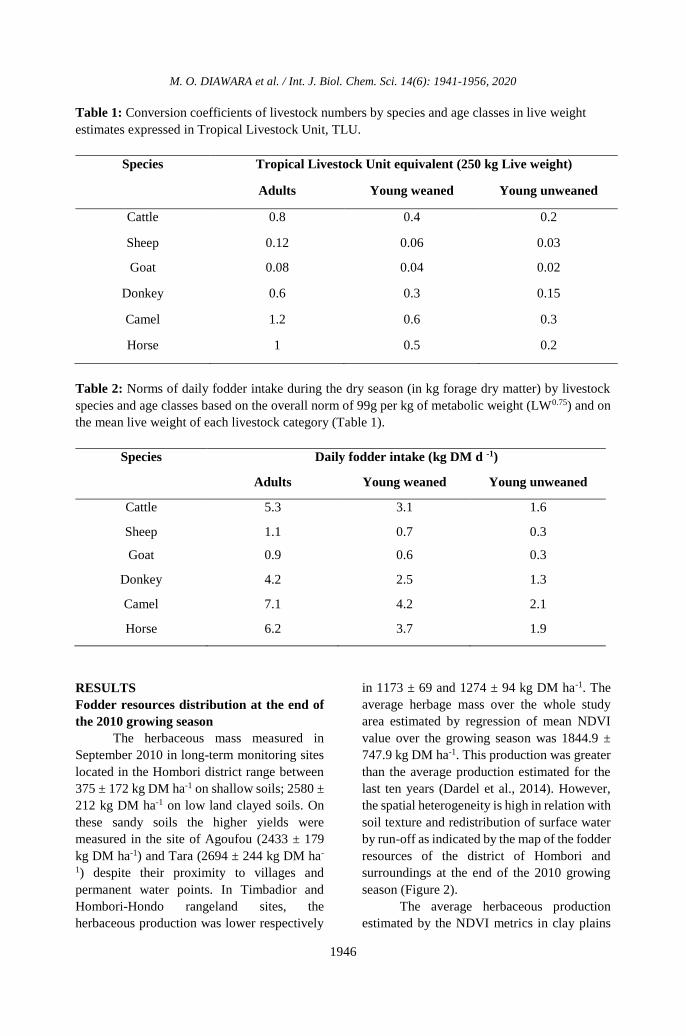
To assess the overall stocking rates, the
livestock numbers by species and sex-age
classes were converted into Tropical Livestock
Unit, TLU (Table 1) based on average live
weight of each category from existing literature
(Wilson, 2003). The daily livestock fodder
intake is assessed based on the number and
metabolic weight of each species and sex-age
and the mean dry matter intake per unit
metabolic weight 99g kg LW0.75 (Table 2).
Livestock numbers recorded monthly at each
water point and the aggregated fodder intake
were assigned to circular service areas centered
on the water point to assess the stocking rate
(TLU km-2) and the grazing pressure by the
ratio of aggregated livestock intake on the
fodder mass available at the onset of the month.
Barycentric model of the spatial distribution
of grazing livestock
The service area of a water point is
modeled as a circle centered on the water point
which radius evolves from 6 km at the onset of
the dry season, in October, up to 12 km at most.
Indeed, the service area increases by one-
kilometer radius whenever the forage resources
within the grazed service area has decreased by
at least 20% during the previous month. The
radius may increase up to a maximum of 12 km
which is considered the maximum distance a
herd can travel to be watered daily (Schlecht et
al., 2006) which, according to the survey,
applies to most of the herds monitored (96%).
In a second step, all the monitored water
points were arranged into 20 clusters, based on
the distance between water point and the
complementary use by livestock. All remote
water points within 12 km were grouped in a
cluster. Within clusters stocking rates were
added. The grazing intensity during the dry
season was estimated by the ratio of the
aggregated forage intake to the forage mass at
the onset of the dry season.
The barycentric model was developed
in R (https://cran.r-project.org) statistical
processing and programming software. The
model estimates and shares out stocking rates
at different spatial scales. It was based on the
forage use availability in a previously user-
defined area.
Figure 1: The observation setting in the district of Hombori (Eastern Mali): the monitored water
points, the 4 rangeland sites (on sandy soils) and the 7 radial axis from three selected water points
(Agoufou pond, Bilantao well and Kelma ponds and wells).
M. O. DIAWARA et al. / Int. J. Biol. Chem. Sci. 14(6): 1941-1956, 2020
1946
Table 1: Conversion coefficients of livestock numbers by species and age classes in live weight
estimates expressed in Tropical Livestock Unit, TLU.
Species Tropical Livestock Unit equivalent (250 kg Live weight)
Adults Young weaned Young unweaned
Cattle 0.8 0.4 0.2
Sheep 0.12 0.06 0.03
Goat 0.08 0.04 0.02
Donkey 0.6 0.3 0.15
Camel 1.2 0.6 0.3
Horse 1 0.5 0.2
Table 2: Norms of daily fodder intake during the dry season (in kg forage dry matter) by livestock
species and age classes based on the overall norm of 99g per kg of metabolic weight (LW0.75) and on
the mean live weight of each livestock category (Table 1).
Species Daily fodder intake (kg DM d -1)
Adults Young weaned Young unweaned
Cattle 5.3 3.1 1.6
Sheep 1.1 0.7 0.3
Goat 0.9 0.6 0.3
Donkey 4.2 2.5 1.3
Camel 7.1 4.2 2.1
Horse 6.2 3.7 1.9
RESULTS
Fodder resources distribution at the end of
the 2010 growing season
The herbaceous mass measured in
September 2010 in long-term monitoring sites
located in the Hombori district range between
375 ± 172 kg DM ha-1 on shallow soils; 2580 ±
212 kg DM ha-1 on low land clayed soils. On
these sandy soils the higher yields were
measured in the site of Agoufou (2433 ± 179
kg DM ha-1) and Tara (2694 ± 244 kg DM ha-
1) despite their proximity to villages and
permanent water points. In Timbadior and
Hombori-Hondo rangeland sites, the
herbaceous production was lower respectively
in 1173 ± 69 and 1274 ± 94 kg DM ha-1. The
average herbage mass over the whole study
area estimated by regression of mean NDVI
value over the growing season was 1844.9 ±
747.9 kg DM ha-1. This production was greater
than the average production estimated for the
last ten years (Dardel et al., 2014). However,
the spatial heterogeneity is high in relation with
soil texture and redistribution of surface water
by run-off as indicated by the map of the fodder
resources of the district of Hombori and
surroundings at the end of the 2010 growing
season (Figure 2).
The average herbaceous production
estimated by the NDVI metrics in clay plains

M. O. DIAWARA et al. / Int. J. Biol. Chem. Sci. 14(6): 1941-1956, 2020
1947
equals 2664.3 ± 519.1 kg DM ha-1 and it equals
2122.1 ± 290.2 kg DM ha-1 in the deep sandy
soils (65% of the area). Both means are close
to the mean of the herbaceous mass measured
on the sample sites in clay and sandy soil, while
the mean production estimated by NDVI on the
loamy soil, hard pan and sandstone outcrop
sites is estimated at 925.6 ± 328.9 kg DM ha-1
superior to the mean mass measured on the n
sites monitored on shallow soils within the
district of Hombori.
Remote sensing estimates of the herbaceous
decay during the dry season
The herbaceous mass estimated from
the Simple Tillage Index (STI) values were
extracted along the radial axis and the values
plotted against the visual estimations made
along the 7 radial axis during the dry season the
10th of November, 11 of February, 11 of April
and 11 of June (Figure 3). The correlation
indicates a good fit (r = 0.87; n = 80) between
the two estimations. The standing straw and
litter mass dynamics during the dry season
were established for 20 vegetation sites of the
Gourma region in Mali using STI estimations
(Jacques et al., 2014). For the 4 vegetation sites
close to the three selected water points and
transects, Jacques et al. (2014) obtained r =
0.74 over 232 measures and 8 years period
(2004-2011).
Straws and litter mass dynamics during the
dry season along the radial axis
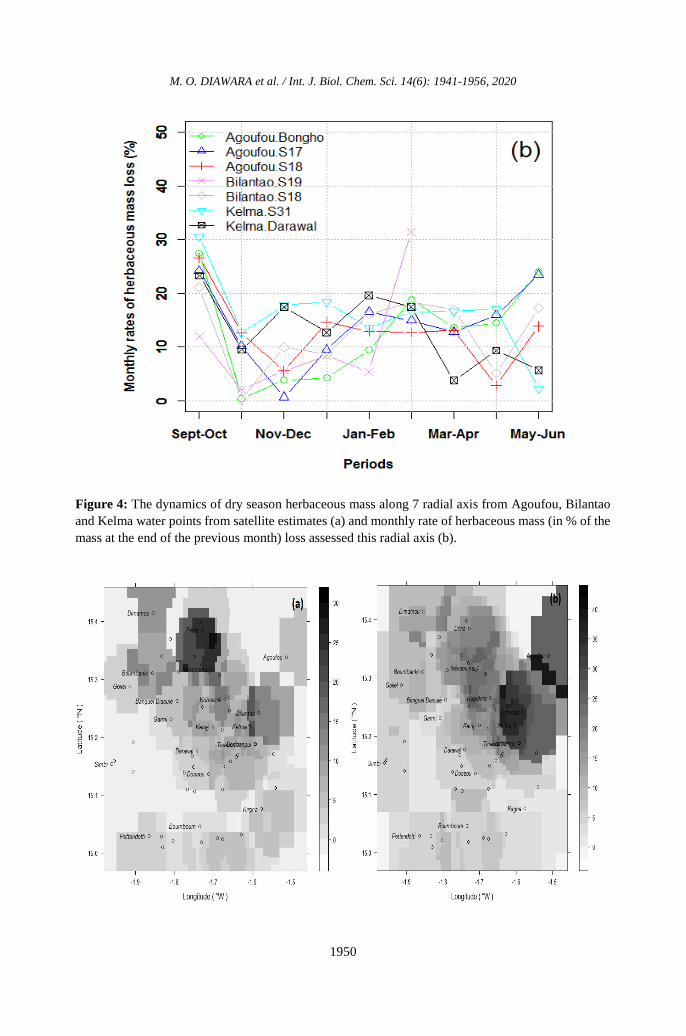
The monthly disappearance of
herbaceous mass as derived from the STI along
the 7 radial axes indicate strong losses along
the dry season (Figure 4a). The rates of losses
were not constant throughout the season
(Figure 4b). They were high at the dry season
onset, 31.7% on average between the late rains
and the end of November. Loss rates stabilize
from February on, with smaller spatial
heterogeneity, and increase again at the end of
the dry season with rapid decomposition
triggered by the first rains. The rate of losses
also differs between axis depending on the
intensity of the grazing pressure related to the
number of livestock using each water point and
the availability of forage resources in their
service areas. The exceptionally high rate of
loss observed in February along the Hombori -
Hondo axis from the Bilantao well is due to an
accidental fire that burned the straws and litter
over half the transect length.
Spatial distribution of the livestock stocking
rates
The stocking rates were mapped
monthly over the Hombori district and
surroundings using the barycentric model
outputs (Figure 5). These maps revealed the
strong spatial heterogeneity of livestock
distribution concerning the distance to
accessible water points and their capacity to
provide water. For permanent and temporary
ponds, the monthly means vary by 61% from
November 2010 and June 2011around shallow
wells, by 36% around cisterns, by 35% around
wells and only by 13% around boreholes.
Despite water availability spans over the whole
dry season in wells and boreholes they are of
secondary importance to water livestock
because of the work and cost of water lifting.
The livestock watered from wells and
boreholes were few and in relatively stable
number over time. Livestock numbers watered
from cisterns were also low and stable, because
of the small storage capacity of the cisterns and
their private management. On the contrary,
livestock numbers watered from permanent
ponds and shallow wells that relay temporary
ponds when they dry up were large and vary
greatly during the dry season.
Comparing the barycentric model
predictions to the transect field observations
The trends of herbaceous mass obtained
by interpolation from the herbaceous mass
losses calculated in the service area of the
water points were compared to the herbaceous
loss rates estimated on the field through visual
estimates of the herbaceous masses along the 7
radial axis (Figure 6). The comparison bears on
the average loss rates of the herbaceous mass
every kilometer along each axis. Despite the
limitations of the interpolation method only
based on distance from the water point, which

M. O. DIAWARA et al. / Int. J. Biol. Chem. Sci. 14(6): 1941-1956, 2020
1948
tends to overestimate stocking rates where
water point service areas overlap each other,
the loss rates calculated with the barycentric
model fit the loss rates observed on the field.
Close to permanent ponds, seasonal loss rates
of herbaceous mass exceed 82.4% of the mass
at the onset of the dry season, when the same
rates are 61.5% at 10 km away from the pond.
Grazing efficiency
The exploitation rate of forage has been
calculated for the service areas of the 20 water
point clusters (Figure 7a) the ratio of cumulated
grazing uptake by the variable livestock
numbers (Figure 7b) during the dry season over
total herbaceous mass at the onset of the dry
season. The rates of grazing exploitation over
the Hombori district and surroundings were
overall low with large variability between
water point clusters, being 9.4% on average
with a coefficient of variation of 96.9%. The
drying up of most ponds early in the dry season
severely limits the rangeland area accessible
for grazing during the second half of the dry
season and leads to a concentration of livestock
around the few permanent ponds. Around these
permanent ponds (Agoufou and Dimamou) and
to a lesser extent close to the deep and shallow
wells (such as Bilantao), the forage utilization
rate reaches the maximum limit which equals
1/3 of the herbaceous mass at the onset of the
dry season.
Figure 2: Spatial distribution of fodder availability at the end of the 2010 growing season.

M. O. DIAWARA et al. / Int. J. Biol. Chem. Sci. 14(6): 1941-1956, 2020
1949
Figure 3: Comparison between STI derived herbaceous mass and visual estimated mass along
Agoufou-Bongho radial axis (15.36°N, - 1.46°W; 15.28°N, – 1.41°W) during the 2010-2011dry
season.
M. O. DIAWARA et al. / Int. J. Biol. Chem. Sci. 14(6): 1941-1956, 2020
1950
Figure 4: The dynamics of dry season herbaceous mass along 7 radial axis from Agoufou, Bilantao
and Kelma water points from satellite estimates (a) and monthly rate of herbaceous mass (in % of the
mass at the end of the previous month) loss assessed this radial axis (b).

M. O. DIAWARA et al. / Int. J. Biol. Chem. Sci. 14(6): 1941-1956, 2020
1951
Figure 5: Spatial distribution of livestock stocking rates (TLU km-2) over the district of Hombori and
surroundings in November 2010 (a), March 2011 (b) and June 2011 (c).
Figure 6: Comparison between the barycentric grazing model of herbaceous cumulated loss rates and
cumulated loss rates estimated from visual estimates of herbaceous masses along 7 radial axis from
the water points.

M. O. DIAWARA et al. / Int. J. Biol. Chem. Sci. 14(6): 1941-1956, 2020
1952
Figure 7: The impact of the grazing intensity on the herbaceous mass losses during the dry season
around pastoral water points: (a) rate of pastoral exploitation of the herbaceous fodder assessed over
the potential service area of the water points from October 2010 to June 2011; (b) median, lower and
upper quartiles, minimum and maximum stocking rates assessed in the potential service area of each
water point from October 2010 to June 2011.
DISCUSSION
Straws and litter decay during the dry
season
The residual mass of straws by the end
of the dry season in the four sites monitored
only accounted for 9.8, 6.4 and 1.3% of
herbaceous mass at the onset of the dry season
in the Agoufou, Timbadior and Tara sites
respectively located at 2.3, 10.1 and 1.6 km
from the closer permanent water point. Indeed,
in addition to forage intake, trampling and the
time livestock rest and ruminate by the water
point also contributes to the loss of standing
straws and litter masses. In average livestock
spend one and a half hours by wells and
boreholes while they spend about three hours
by permanent ponds. This rumination time
depends on the livestock species, watering
frequency, and the water point accessibility and
capacity to provide water.
The high rate of disappearance of the
straws at the vicinity of the water points
following the transfer from standing straw to
litter mass is often mentioned as a trait of Sahel
pastoral overgrazing (Sanon et al., 2015). This
high loss rate could be due to the high rate of
organic decomposition with remnant soil
moisture and still high atmospheric humidity
(Delon et al., 2015), it could be favored by the
massive dispersion of diaspores, especially that
of grasses, and shade and rapid decomposition
of the leaves of some of the herbaceous
dicotyledons, including the legumes Zornia
glochidiata and Alysicarpus ovalifolius, also
Cassia ssp, Tribulus terrestris (Diawara et al.,
2018).

M. O. DIAWARA et al. / Int. J. Biol. Chem. Sci. 14(6): 1941-1956, 2020
1953
Assessing stocking rate, fodder intake with
the barycentric model
The stocking rates calculated over the
service areas were most likely a bit lower than
the actual stocking rates in the district because
all water points were not surveyed. The spatial
distribution of the stocking rates was also to be
taken cautiously because of the simplifications
made in their assessment. For example, if the
stocking rate is considered even within the
circular service area whereas, it probably
higher at the vicinity of the water point and
decreases as one moves away from it. Despite
these limitations, the study has identified the
areas where livestock concentrated during the
dry season, with potential risks of rangeland
degradation and livestock losses.
The fodder intake estimates are crude,
they don’t account for the live weight
difference between males and females, for
weight losses of animals during the dry season,
or for adaptative grazing selection by livestock
(Fernandez-Rivera et al., 2005).
The trends of herbaceous mass obtained
by interpolation from the herbaceous mass
losses calculated in the service area of the
water points were compared to the herbaceous
loss rates estimated on the field through visual
estimates of the herbaceous masses along the 7
radial axis. The comparison bears on the
average loss rates of the herbaceous mass every
kilometer along with each axis. Despite the
limitations of the interpolation method only
based on distance from the water point, which
tends to overestimate stocking rates where
water point service areas overlap each other,
the loss rates calculated with the barycentric
model fit the loss rates observed on the field.
Close to permanent ponds, seasonal loss rates
of herbaceous mass exceed 82.4% of the mass
at the onset of the dry season, when the same
rates are 61.5% at 10 km away from the pond.
The loss rates of herbaceous masses during the
dry season calculated based on the grazing
pressure assessed by the barycentric model
were plausible, close to the rates reported by
Valenza and Diallo (1972) for Senegal
rangelands between the last rains to March
range from June. It seems however, that the
barycentric model outputs slightly
underestimate the loss rates in the vicinity of
the water points.
Rate of fodder use: are the rangelands under
or over grazed?
Comparing the aggregated fodder
uptake with the rates of herbaceous losses
reveals that a large fraction of the herbaceous
mass losses during the dry season is not due to
livestock intake but either to other herbivore
consumption, including termite and other
insects and rodents, physical break down
accelerated by livestock trampling or fungal
and microbial decomposition (Diawara et al.,
2018). In all these cases this disappearing
herbaceous mass, at least two thirds of the
standing mass at the onset of the dry season, is
locally recycled (Hiernaux et al., 2013).
The mean rate of fodder intake in the
service areas of the 20 water point clusters
indicates that despite the large numbers of
livestock recorded at the water points and the
weak mobility of the resident herds, the overall
stocking rate in the Hombori district remains
low, as it involved an average grazing
exploitation rate of only 9.4% of the fodder
resource. This rate invalidates the statement of
widespread 'overgrazing' of forage resources
by livestock in the northern Sahel (Zampaligré
et al., 2019) often advanced in rangeland
ecology and development and natural resource
management projects, and already questioned
in the 80’s (Gilles and Jamtgaard, 1981).
However, stocking rates and forage use rates
varied widely between service areas of water
point clusters. The forage use rates estimated in
the service areas of the permanent ponds reach
33% which is close to the maximum rate
possible considering the unavoidable effects of
trampling, other herbivores and organic
decomposition processes (Diawara et al.,
2018).
The high grazing rates observed locally
at the vicinity of permanent water points
mitigate the diagnostic of overall
underutilization of fodder resources based on
the district average rate of 9.4%; the use
intensity is thus a matter of scale. The overall

M. O. DIAWARA et al. / Int. J. Biol. Chem. Sci. 14(6): 1941-1956, 2020
1954
under-using rate observed in the district of
Hombori and surroundings during the 2010-
2011 dry season should also be put in
perspective, as rainfall were particularly
abundant and well distributed in 2010 in
Hombori (433 mm) and surrounding districts
(Dardel et al., 2014) contributing to limit the
inflow of 'foreign' herds this year and therefore
the stocking rates.
Conclusion
At the scale of the Hombori district,
rangelands were not subject to grazing
exceeding fodder availability. Hence this result
disputes the concept of rangeland overgrazing
often alleged in the Sahel. However, the
herbaceous masses observed at the vicinity of a
water point in the late dry season were often
below 100 kg DM ha-1 of litter and therefore
enhance the risk of soil deflation or top soil
crusting due to trampling.
The barycentric model offers good
prospects to assess the use of commonly
managed rangelands during the dry season.
One of the merits of the tool is to work at a
range of scales from individual water points
(livestock counts), to service areas for
individual and clusters of water points and
whole territories such as administrative
districts. The model only applies to graze
livestock in communally managed rangelands.
Its application could rely easily on accessible
satellite remote sensing estimates of rangeland
fodder resources but requires laborious
seasonal monitoring of livestock populations at
the water points. Providing these precise and
timely data on livestock numbers are recorded,
the barycentric model could guide
infrastructure management (water points,
livestock corridors) and pastoral livestock
development projects. It could technically
support the implementation of policies
targeting the reduction of livestock
productivity losses though optimal use of the
forage resource during the dry season.
COMPETING INTERESTS
The authors declare that they have no
competing interests.
AUTHORS’ CONTRIBUTIONS
All authors contributed to the field work
data collection, MOD conceived, designed the
monitoring, conducted some of the analyses,
wrote the manuscript, PH conducted some of
the analyses and, EM, SS and LK conducted
some of the analyses too and provided editorial
advices.
ACKNOWLEDGMENTS
This work was partially funded by the
(French) National Research Agency as part of
the ECliS (Livestock, Climate and Society)
research project. The authors are indebted
towards the researchers and technicians of the
AMMA-CATCH Observatory Service in Mali.
The authors are grateful to the fellow
investigators who contributed to the surveys
and the herders of the Hombori district for their
availability and patience.
REFERENCES
Assouma MH, Lecomte P, Hiernaux P,
Ickowicz A, Corniaux C, Decruyenaere
V, Diarra AR, Vayssières J. 2018. How to
better account for livestock diversity and
fodder seasonality in assessing the fodder
intake of livestock grazing semi-arid sub-
Saharan Africa rangelands. Livestock
Science, 216: 16‑ 23. DOI:
10.1016/j.livsci.2018.07.002.
Dardel C, Kergoat L, Hiernaux P, Mougin E,
Grippa M, Tucker CJ. 2014. Re-greening
Sahel. 30 years of remote sensing data
and field observations (Mali, Niger).
Remote Sensing of Environment, (140):
350-364. DOI:
10.1016/j.rse.2013.09.011.
Delon C, Mougin E, Serça D, Grippa M,
Hiernaux P, Diawara M, Galy-Lacaux C,
Kergoat L. 2015. Modelling the effect of
soil moisture and organic matter
degradation on biogenic NO emissions
from soils in Sahel rangeland (Mali).
Biogeosciences, 12. DOI: 10.5194/bg-12-
3253-2015.
Diawara MO, Hiernaux P, Mougin E, Grippa
M, Delon C, Diakité HS. 2018. Effets de
la pâture sur la dynamique de la
végétation herbacée au Sahel (Gourma,

M. O. DIAWARA et al. / Int. J. Biol. Chem. Sci. 14(6): 1941-1956, 2020
1955
Mali) : une approche par modélisation.
Cahiers Agricultures., 27 : 15010. DOI :
10.1051/cagri/2018002.
Diawara MO. 2015. Impact de la Variabilité
Climatique au Nord Sahel (Gourma,
Mali) sur la Dynamique des Ressources
Pastorales, Conséquences sur les
Productions Animales. Ph.D. Thesis,
Université Toulouse 3, Toulouse, France,
176p.
http://www.theses.fr/2015TOU30029.
FAO. 2007. Les ruralités en mouvement en
Afrique de l’Ouest. Conférence
internationale sur la réforme agraire et le
développement rural, du 07 au 10 mars,
Porto Alegre au Brésil. 73p.
Fernandez-Rivera S, Hiernaux P, Williams TO,
Turner MD, Schlecht E, Salla A,
Ayantunde AA, Sangaré M. 2005.
Nutritional constraints to grazing
ruminants in the millet-cowpea-livestock
framing systems of the Sahel. Coping
with feed scarcity in smallholder
livestock systems in developing
countries. ILRI, Nairobi, 157-82.
Frappart F, Hiernaux P, Guichard F, Mougin E,
Kergoat L, Arjounin M, Lavenu F, Koité
M, Paturel J-E, Lebel T. 2009. Rainfall
regime over the Sahelian climate gradient
in the Gourma, Mali. Journal of
Hydrology, 375: 128-142. DOI:
10.1016/j.jhydrol.2009.03.007.
Galle S, Grippa M, Peugeot C, Moussa IB,
Cappelaere B, Demarty J, Mougin E,
Panthou G, Adjomayi P, Agbossou EK,
Ba A, Boucher M, Cohard J-M,
Descloitres M, Descroix L, Diawara M,
Dossou M, Favreau G, Gangneron F,
Gosset M, Hector B, Hiernaux P,
Issoufou B-A, Kergoat L, Lawin E, Lebel
T, Legchenko A, Abdou MM, Malam-
Issa O, Mamadou O, Nazoumou Y,
Pellarin T, Quantin G, Sambou B,
Seghieri J, Séguis L, Vandervaere J-P,
Vischel T, Vouillamoz J-M, Zannou A,
Afouda S, Alhassane A, Arjounin M,
Barral H, Biron R, Cazenave F, Chaffard
V, Chazarin J-P, Guyard H, Koné A,
Mainassara I, Mamane A, Oi M, Ouani T,
Soumaguel N, Wubda M, Ago EE, Alle
IC, Allies A, Arpin-Pont F, Awessou B,
Cassé C, Charvet G, Dardel C, Depeyre
A, Diallo FB, Do T, Fatras C, Frappart F,
Gal L, Gascon T, Gibon F, Guiro I,
Ingatan A, Kempf J, Kotchoni DOV,
Lawson FMA, Leauthaud C, Louvet S,
Mason E, Nguyen CC, Perrimond B,
Pierre C, Richard A, Robert E, Román-
Cascón C, Velluet C, Wilcox C. 2018.
AMMA-CATCH, a Critical Zone
Observatory in West Africa Monitoring a
Region in Transition. Vadose Zone
Journal 17 : 0. DOI:
10.2136/vzj2018.03.006.
Gilles JL, Jamtgaard K. 1981. Overgrazing in
pastoral areas. Sociologia Ruralis,
21: 129–141. DOI: 10.1111/j.1467-9523.
1981.tb01084. x.
Hiernaux P, Mougin E, Diarra L, Soumaguel
N, Lavenu F, Tracol Y, Diawara M. 2009.
Sahelian Rangeland Response to Changes
in Rainfall over Two Decades in the
Gourma Region, Mali. Journal of
Hydrology, 375: 114–27. DOI:
10.1016/j.jhydrol.2008.11.005.
Hiernaux P, Mougin E, Diawara M,
Soumaguel N, Diarra L. 2013. How much
does grazing contribute to herbaceous
decay during the dry season in Sahel
rangelands? Elevage Climat et Société,
ECliS 3.4, Géosciences Environnement
Toulouse, GET, Toulouse, France, 22p.
Ickowicz A, Ancey V, Corniaux C, Duteurtre
G, Poccard-Chappuis R, Touré I, Vall E,
Wane A. 2012. Crop–livestock
Production Systems in the Sahel–
increasing Resilience for Adaptation to
Climate Change and Preserving Food
Security. Building Resilience for
Adaptation to Climate Change in the
Agriculture Sector, 23: 261.
Jacques DC, Kergoat L, Hiernaux P, Mougin
E, Defourny P. 2014. Monitoring dry
vegetation masses in semi-arid areas with
MODIS SWIR bands. Remote Sensing of
Environment, 153: 40–49. DOI:
10.1016/j.rse.2014.07.027.

M. O. DIAWARA et al. / Int. J. Biol. Chem. Sci. 14(6): 1941-1956, 2020
1956
Kergoat L, Hiernaux P, Dardel C, Pierre C,
Guichard F, Kalilou A. 2015. Dry-season
vegetation mass and cover fraction from
SWIR1.6 and SWIR2.1 band ratio:
ground-radiometer and MODIS data in
the Sahel. International Journal of
Applied Earth Observation and
Geoinformation, 39: 56-64. DOI:
10.1016/j.jag.2015.02.011.
Krätli S, Kaufmann B, Roba H, Hiernaux P, Li
W, Easdale M, Hülsebusch C. 2015. A
House Full of Trap Doors.
http://pubs.iied.org/pdfs/10112IIED.pdf.
Lhoste P. 2007. Sociétés pastorales et
désertification au Sahel. Bois et Forêts
des Tropiques, 3: 49-59.
McLeod SR. 1997. Is the Concept of Carrying
Capacity Useful in Variable
Environments? Oikos, 79(3) : 529–542.
DOI: 10.2307/3546897.
Mougin E, Hiernaux P, Kergoat L,
Grippa M, de Rosany P, Timouk F, Le
Dantec V. 2009. The AMMA-CATCH
Gourma Observatory site in Mali:
relating climatic variations to changes in
vegetation, surface hydrology, fluxes
and natural resources. Journal of
Hydrology, 375: 14-33. DOI:
10.1016/j.jhydrol.2009.06.045.
Nicholson SE. 2013. The West African Sahel:
A Review of Recent Studies on the
Rainfall Regime and Its Interannual
Variability. ISRN Meteorology, 1‑ 32.
DOI: 10.1155/2013/453521.
Sanon O, Ouattara F, Sawadogo M. 2015.
Seasonal dynamic of herbaceous fodder
production in the Sahelian pastures used
by domestic ruminants. Journal of
Agriculture and Environment for
International Development (JAEID),
109: 123-138. DOI:
10.12895/jaeid.20151.317.
Schlecht E, Hiernaux P, Kadaouré I,
Hülsebusch C, Mahler F. 2006. A
spatio-temporal analysis of forage
availability and grazing and excretion
behaviour of herded and free grazing
cattle, sheep and goats in Western Niger.
Agriculture, Ecosystems &
Environment, 113: 226–42. DOI:
10.1016/j.agee.2005.09.008.
Toulmin C. 1985. Livestock losses and post-
drought rehabilitation in sub-Saharan
Africa. LPU working paper N°9.
International Livestock Centre for
Africa, Addis Ababa, Ethiopia.
Valenza J, Diallo AK. 1972. Étude des
Pâturages du Nord Sénégal. IEMVT:
Paris; 311p.
Weber KT, Horst S. 2011. Desertification and
livestock grazing: The roles of
sedentarization, mobility and rest.
Pastoralism: Research, Policy and
Practice 1, 19.
Wilson RT. 2003. Livestock Production and
farm animal genetic resources in the
Usangu Wetland of the Southern
Highlands of Tanzania. Livestock
Research for Rural Development, 15 (1).
http://www.lrrd.org/lrrd15/1/wils151.ht
m
Zampaligré N, Kagambega WF, Sanou L,
Sawadogo L. 2019. Impact of Grazing
Intensity on Floristic Diversity and
Woody Structure in Grazing Area Near
Kaboré Tambi National Park (Burkina
Faso). Journal of Agriculture and
Environmental Sciences, 8(2). DOI:
10.15640/jaes.v8n2a13.