jonathan f. d. liljeblad, istva´n furo´ and eric c. tyrode*
TRANSCRIPT

This journal is© the Owner Societies 2017 Phys. Chem. Chem. Phys., 2017, 19, 305--317 | 305
Cite this:Phys.Chem.Chem.Phys.,
2017, 19, 305
The premolten layer of ice next to a hydrophilicsolid surface: correlating adhesion with molecularproperties†
Jonathan F. D. Liljeblad, Istvan Furo and Eric C. Tyrode*
In order to establish the potential correlation between the macroscopic ice adhesion and the molecular
properties of the premolten layer (PML), the adhesion strength between ice and hydrophilic silica has
been measured as a function of temperature. In addition, temperature-dependent molecular properties
have been determined using techniques that are sensitive to different aspects of the PML, specifically
total internal reflection (TIR) Raman, vibrational sum frequency (VSFS) and NMR spectroscopies. The ice
shear adhesion strength was observed to increase linearly with decreasing temperature until �25 1C,
where a plateau marked the adhesive strength having reached the cohesive strength of ice. Interestingly,
at temperatures higher than �20 1C the ice samples slid on smooth (Ra o 0.4 nm) silica surfaces. This
sliding behavior was not observed on rougher silica surfaces (Ra B 6 nm). By varying the penetration
depth of the evanescent field, TIR Raman was used to establish an upper limit to the thickness of the
PML in contact with silica (o3 nm even at �0.3 K below the bulk melting temperature). Additional
quantitative determination of the temperature-dependent thickness of the PML was obtained from2H NMR measurements in mesoporous silica particles. Finally, the inherently surface specific technique,
VSFS, which probed changes in the hydrogen bond environment, indicated at approximately �25 1C the
onset of PML, followed by a marked structural change occurring just a fraction of a degree below the
melting temperature. Jointly, the experimental approaches link, strongly and consistently, ice adhesion
to the PML properties. Specifically, it is inferred that the premolten layer facilitates sliding and
contributes to the observed friction behavior, provided its thickness is comparable to the surface
roughness of the underlying silica substrate.
Introduction
Perhaps surprisingly, the statement of water being not solely inthe state of either bulk ice or bulk liquid – while having beenfirst floated by Faraday1 – only gained general acceptance in the1990s.2,3 Since then, a barrage of modern experimental techniqueshave provided irrefutable evidence for premelting of ice and,moreover, showed that this is a rather general phenomenon thatoccurs in many materials.2 Premelting arises at the surface of iceand manifests itself in structures that are more disordered, and
molecules that are more mobile, than those in the crystallinephase. As a surface phenomenon, it is expected to influenceproperties defined by the state of the surface, which includeamong other things, the reaction and release of trace gases fromice, as well as adhesion and friction.4 Interestingly, charge andmass transfer via pre-molten layers to and from hailstones is thepre-condition of the charge build up preceding lightning.3
Despite having gained acceptance as a phenomenon, thereis no detailed, molecular, experimentally, and consistentlytested understanding of premelting.5,6 The core problem isillustrated by the fact that experimental techniques differ byorders of magnitude when it comes to estimating either theextension of the PML or its temperature dependence!3,5,7 Thisapparent cacophony persists when looking at other derivedmolecular properties of the PML. It is also reflected by the lackof established terminology – PML is called disordered interfaceby equally many and quasi-liquid layer or liquid-like layer bysome. The lack of agreement in the estimated PML propertieshas often been attributed to impurities.8 While impuritiesmay certainly be a factor, the apparently divergent results of
Department of Chemistry, School of Chemical Science and Engineering, KTH Royal
Institute of Technology, SE-100 44 Stockholm, Sweden. E-mail: [email protected]
† Electronic supplementary information (ESI) available: Details of the ice-adhesion measuring device, movie showing the sliding behavior of ice on silica,details of the vibrational spectroscopy sample cell, TIR Raman spectra collectedfor ice at different polarization combinations, Raman D2O ice spectra at differenttemperatures, silica/ice SF spectra collected in the SPS polarization combination,Fresnel factor corrected VSF spectra, detailed fitting parameters of the SF spectra,AFM and profilometry images and roughness measurements, and raw 2H NMRspectra of the PML. See DOI: 10.1039/c6cp05303c
Received 31st July 2016,Accepted 18th November 2016
DOI: 10.1039/c6cp05303c
www.rsc.org/pccp
PCCP
PAPER
Ope
n A
cces
s A
rtic
le. P
ublis
hed
on 2
3 N
ovem
ber
2016
. Dow
nloa
ded
on 3
/19/
2022
2:3
5:31
PM
. T
his
artic
le is
lice
nsed
und
er a
Cre
ativ
e C
omm
ons
Attr
ibut
ion
3.0
Unp
orte
d L
icen
ce.
View Article OnlineView Journal | View Issue
306 | Phys. Chem. Chem. Phys., 2017, 19, 305--317 This journal is© the Owner Societies 2017
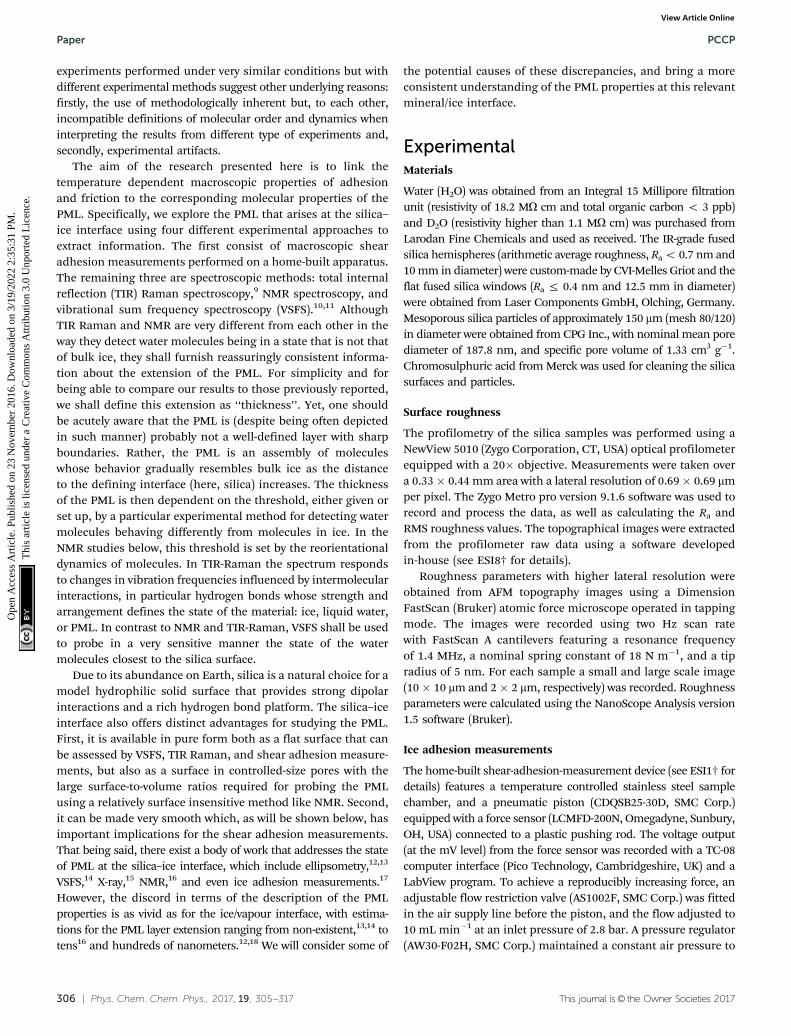
experiments performed under very similar conditions but withdifferent experimental methods suggest other underlying reasons:firstly, the use of methodologically inherent but, to each other,incompatible definitions of molecular order and dynamics wheninterpreting the results from different type of experiments and,secondly, experimental artifacts.
The aim of the research presented here is to link thetemperature dependent macroscopic properties of adhesionand friction to the corresponding molecular properties of thePML. Specifically, we explore the PML that arises at the silica–ice interface using four different experimental approaches toextract information. The first consist of macroscopic shearadhesion measurements performed on a home-built apparatus.The remaining three are spectroscopic methods: total internalreflection (TIR) Raman spectroscopy,9 NMR spectroscopy, andvibrational sum frequency spectroscopy (VSFS).10,11 AlthoughTIR Raman and NMR are very different from each other in theway they detect water molecules being in a state that is not thatof bulk ice, they shall furnish reassuringly consistent informa-tion about the extension of the PML. For simplicity and forbeing able to compare our results to those previously reported,we shall define this extension as ‘‘thickness’’. Yet, one shouldbe acutely aware that the PML is (despite being often depictedin such manner) probably not a well-defined layer with sharpboundaries. Rather, the PML is an assembly of moleculeswhose behavior gradually resembles bulk ice as the distanceto the defining interface (here, silica) increases. The thicknessof the PML is then dependent on the threshold, either given orset up, by a particular experimental method for detecting watermolecules behaving differently from molecules in ice. In theNMR studies below, this threshold is set by the reorientationaldynamics of molecules. In TIR-Raman the spectrum respondsto changes in vibration frequencies influenced by intermolecularinteractions, in particular hydrogen bonds whose strength andarrangement defines the state of the material: ice, liquid water,or PML. In contrast to NMR and TIR-Raman, VSFS shall be usedto probe in a very sensitive manner the state of the watermolecules closest to the silica surface.
Due to its abundance on Earth, silica is a natural choice for amodel hydrophilic solid surface that provides strong dipolarinteractions and a rich hydrogen bond platform. The silica–iceinterface also offers distinct advantages for studying the PML.First, it is available in pure form both as a flat surface that canbe assessed by VSFS, TIR Raman, and shear adhesion measure-ments, but also as a surface in controlled-size pores with thelarge surface-to-volume ratios required for probing the PMLusing a relatively surface insensitive method like NMR. Second,it can be made very smooth which, as will be shown below, hasimportant implications for the shear adhesion measurements.That being said, there exist a body of work that addresses the stateof PML at the silica–ice interface, which include ellipsometry,12,13
VSFS,14 X-ray,15 NMR,16 and even ice adhesion measurements.17
However, the discord in terms of the description of the PMLproperties is as vivid as for the ice/vapour interface, with estima-tions for the PML layer extension ranging from non-existent,13,14 totens16 and hundreds of nanometers.12,18 We will consider some of
the potential causes of these discrepancies, and bring a moreconsistent understanding of the PML properties at this relevantmineral/ice interface.
ExperimentalMaterials
Water (H2O) was obtained from an Integral 15 Millipore filtrationunit (resistivity of 18.2 MO cm and total organic carbon o 3 ppb)and D2O (resistivity higher than 1.1 MO cm) was purchased fromLarodan Fine Chemicals and used as received. The IR-grade fusedsilica hemispheres (arithmetic average roughness, Ra o 0.7 nm and10 mm in diameter) were custom-made by CVI-Melles Griot and theflat fused silica windows (Ra r 0.4 nm and 12.5 mm in diameter)were obtained from Laser Components GmbH, Olching, Germany.Mesoporous silica particles of approximately 150 mm (mesh 80/120)in diameter were obtained from CPG Inc., with nominal mean porediameter of 187.8 nm, and specific pore volume of 1.33 cm3 g�1.Chromosulphuric acid from Merck was used for cleaning the silicasurfaces and particles.
Surface roughness
The profilometry of the silica samples was performed using aNewView 5010 (Zygo Corporation, CT, USA) optical profilometerequipped with a 20� objective. Measurements were taken overa 0.33� 0.44 mm area with a lateral resolution of 0.69� 0.69 mmper pixel. The Zygo Metro pro version 9.1.6 software was used torecord and process the data, as well as calculating the Ra andRMS roughness values. The topographical images were extractedfrom the profilometer raw data using a software developedin-house (see ESI8† for details).
Roughness parameters with higher lateral resolution wereobtained from AFM topography images using a DimensionFastScan (Bruker) atomic force microscope operated in tappingmode. The images were recorded using two Hz scan ratewith FastScan A cantilevers featuring a resonance frequencyof 1.4 MHz, a nominal spring constant of 18 N m�1, and a tipradius of 5 nm. For each sample a small and large scale image(10� 10 mm and 2� 2 mm, respectively) was recorded. Roughnessparameters were calculated using the NanoScope Analysis version1.5 software (Bruker).
Ice adhesion measurements
The home-built shear-adhesion-measurement device (see ESI1† fordetails) features a temperature controlled stainless steel samplechamber, and a pneumatic piston (CDQSB25-30D, SMC Corp.)equipped with a force sensor (LCMFD-200N, Omegadyne, Sunbury,OH, USA) connected to a plastic pushing rod. The voltage output(at the mV level) from the force sensor was recorded with a TC-08computer interface (Pico Technology, Cambridgeshire, UK) and aLabView program. To achieve a reproducibly increasing force, anadjustable flow restriction valve (AS1002F, SMC Corp.) was fittedin the air supply line before the piston, and the flow adjusted to10 mL min�1 at an inlet pressure of 2.8 bar. A pressure regulator(AW30-F02H, SMC Corp.) maintained a constant air pressure to
Paper PCCP
Ope
n A
cces
s A
rtic
le. P
ublis
hed
on 2
3 N
ovem
ber
2016
. Dow
nloa
ded
on 3
/19/
2022
2:3
5:31
PM
. T
his
artic
le is
lice
nsed
und
er a
Cre
ativ
e C
omm
ons
Attr
ibut
ion
3.0
Unp
orte
d L
icen
ce.
View Article Online

This journal is© the Owner Societies 2017 Phys. Chem. Chem. Phys., 2017, 19, 305--317 | 307
the valve. The sample chamber was thermally insulated with a corkjacket and the temperature of the silica samples was monitoredwith a thermocouple mounted directly on one of the silica sub-strates. The temperature of the chamber’s baseplate was controlledby a Julabo fluid recirculating cooler (Julabo FP50-ME).
The ice/silica samples were prepared by placing a Tefloncylinder (internal diameter and wall thickness of 10 and 1 mm,respectively) filled with degassed water (0.8 mL) on top of thesilica windows. The temperature of the chamber was thenreduced to �20 1C to quickly freeze the sample. The intendedmeasuring temperature was subsequently set and the samplewas allowed to equilibrate for at least 20 minutes beforeperforming the ice adhesion measurement.
TIR Raman spectrometer
The Raman spectra were collected in a home-built spectrometerdescribed in detail elsewhere.19 The beam from the 532 nm CWlaser (Laser Quantum, UK) is focused on the sample positionwith a Gradium lens (focal length 80 mm). An ultra-long work-ing distance objective (M-Plan Apo 50X, NA 0.55, Mitutoyo,Japan) attached to a microscope was used to collect the Ramanscattered light which was subsequently directed first through along-pass filter and then to a combined spectrometer and CCDcamera (Shamrock 303i, Newton DU940N-BV, Andor, Ireland).The surface sensitivity results from the Total Internal Reflection(TIR) geometry where the penetration depth of the evanescentfield exciting the molecules is governed, among other things, bythe angle of incidence (aoi) of the laser beam.9,20 For the silica/ice system investigated here the minimum effectively achievablepenetration depth is E70 nm at 801 aoi. Polarization optics inthe beam path enables selective recording of different combina-tions of polarizations of the excitation laser and Raman scatteredlight. In this work, unless otherwise stated, the spectra wererecorded using S polarized incident light and y polarized scatteredlight (i.e. perpendicular to the plane of incidence of the excitationlaser). Laser power densities are described in detail in the Laserheating section below. The presented spectra have been smoothedusing running average over five data points, then baseline sub-tracted, and finally normalized to the highest intensity peak.
VSF spectrometer
The home built VSF spectrometer used in this research has beendescribed in detail elsewhere.21 Briefly, an 800 nm/90 fs/1 kHzpulse train is generated by a Integra-HE amplifier seeded by aTi:light oscillator (both from former Quantronix, now Amplitude,France). The tunable IR pulses are produced in a parametricamplifier, HE-TOPAS-C (Light Conversion, Lithuania) pumped by75% of the output power from the Integra-HE. The remainingpower is converted to a bandwidth-tunable picosecond pulse in ahome-built pulse shaper. The IR and 800 nm pulses are directedthrough the silica hemisphere in a co-propagating geometry andoverlapped in space and time on the silica/ice interface. Theangles of incidence, fixed at 701 and 551 for the 800 nm and IRbeams respectively, are selected for preferentially enhancing thehigh wavenumber OH-stretching region.21 A combined spectro-meter (Shamrock SR303i-B, Andor, Ireland) and EM-CCD camera
(Newton DU971N-UVB, Andor, Ireland) was used to record thesum frequency (SF) signal. A detailed description of the power andpower densities at the sample position is given in the Laserheating section below. A normalization procedure based onrecording the non-resonant SF response from a gold coated silicahemisphere was applied to the data.21 Spectra were smoothedusing running average over five data points, which resulted in atypical resolution of 3 cm�1.
A model function featuring a sum of complex Lorentzians(eqn (1)) has been fitted to the data using the Levenberg–Marquardt algorithm in a commercial software (Origin 9.0) toextract the non-resonant contribution to the signal ANR, as wellas the amplitude An, the resonance frequency on, and thehomogeneous line width Gn of the nth vibrational mode (oIR
represents the tunable IR frequency). This approach is neces-sary since both constructive and destructive interferencebetween peaks occurs in VSF spectroscopy.
ISFG oIRð Þ ¼ ANR þX
n
An
on � oIR � iGn
�����
�����
2
(1)
Before fitting, the data were normalized by the Fresnelfactors which depend on the IR frequency and the specificexperimental geometry employed21 (see ESI6† and ESI7† fordetails).
Spectroscopy cell and sample preparation
A custom-made sample cell (see ESI2† for details) was used forin situ freezing and temperature control of the silica/ice samplesinvestigated with TIR Raman and VSF spectroscopies. Coolingfluid was circulated in the stainless steel cell body that features acylindrical sample chamber (volume E0.5 mL) with tubingattached for injection of fluid. The open end of the chamberwas fitted with a fused silica hemisphere (r = 5 mm) sealed with aViton O-ring and clamped to the cell body with holders made outof a high thermal conductivity polymer (CoolPoly-E5101, CoolPolymers/Celeanese, RI, USA). The hemisphere was cleaned byimmersion in chromosulphuric acid for at least two hoursfollowed by repeated rinsing in ultrapure water. A cork jacketprovided thermal insulation of the sample cell. To avoid frostformation on the hemisphere surface its exterior was purgedwith a small laminar flow of dry cold air. Initially, the tempera-ture of an ice sample was measured using a thermocouplemounted in close proximity to the silica/ice interface to establisha calibration curve relating the temperature of the sample andthe cooling fluid. Thereafter, the experimental temperature wasset by the cooling fluid according to the calibration curve.Furthermore, after each experiment (i.e. measuring the fulltemperature series for a given sample) the temperature of thecell was slowly (in 0.1 K/10 minutes steps) increased until the icesample began to melt to obtain an absolute temperature refer-ence and verify the calibration curve. Before freezing at approxi-mately �20 1C, with the sample cell turned upside down and thehemisphere facing down, degassed ultrapure water was injectedto fill the cell, leaving a small air bubble inside which served toaccommodate for the expansion upon freezing. The sample was
PCCP Paper
Ope
n A
cces
s A
rtic
le. P
ublis
hed
on 2
3 N
ovem
ber
2016
. Dow
nloa
ded
on 3
/19/
2022
2:3
5:31
PM
. T
his
artic
le is
lice
nsed
und
er a
Cre
ativ
e C
omm
ons
Attr
ibut
ion
3.0
Unp
orte
d L
icen
ce.
View Article Online

308 | Phys. Chem. Chem. Phys., 2017, 19, 305--317 This journal is© the Owner Societies 2017
left to equilibrate at least 30 min before carrying out measure-ments at a given temperature.
The ice samples prepared were polycrystalline. Nevertheless,as the crystal sizes were at least ten times larger than thediameter of the laser beams used to probe the interfacialregion, all the vibrational spectroscopy data shown here wereobtained from single crystals of unknown orientation. Theborders between crystals could be easily identified by the grainboundaries at the melting point, as well as by direct inspectionof light microscope images using polarized light. SF spectrawere collected in several different ice samples, showing anoverall similar trend in the variation of the spectral featureswith temperature. However, for consistency and ease of com-parison, the SF data presented here result from measurementscarried out in a single ice sample.
Laser heating
A major concern when investigating the properties of the pre-molten layer is potential disturbances that the probing methodsmay induce. This is particularly relevant for TIR Raman andVSFS, where focused laser beams are directed towards the samplesurface. We tested the heating effect experimentally, employinginverted white-light microscopes set above the sample positionsin both spectrometers.21 Silica/ice samples were prepared andequilibrated at essentially the bulk melting point of ice (a fewhundredths of a degree below 0 1C). Then, the power densities ofthe relevant laser beams were slowly increased until melting wasfirst observed in the irradiated area. The microscope imagesprovided sufficient contrast to observe the formation of thinwetting films of just a few tens of nanometers thick.22 Measure-ments were then performed using power densities half to oneorder of magnitude lower than the experimentally determinedthreshold. For the broadband IR laser beam this threshold wasdetermined at B3200 cm�1, which is the peak absorptionfrequency in bulk ice. Note also that both the visible laser(800 nm) in VSF and the excitation beam in TIR Raman(532 nm) are totally internally reflected at the silica/ice interface,and thus do not propagate into the bulk ice beyond the penetra-tion depth of the evanescent field. For the TIR Raman measure-ments, the power at the sample position of the 532 nm laser was10 mW, with a projected beam waist of o10 mm. In the VSFmeasurements the power of the B100 fs IR laser varied between0.2–0.5 mW depending on the central wavelength, while that ofthe 800 nm visible beam was typically 15 mW. The projectedbeam waists for the IR and visible pulses were B0.3 mm andB0.4 mm, respectively.
NMR samples and setup
The mesoporous silica particles were cleaned by immersion inchromosulphuric acid at B40 1C for approximately four hours,followed by a rinsing procedure and vortex mixing, where thewater volume was exchanged at least 20 times. The particleswere then dried at B125 1C for several hours, before finallybeing placed in a 5 mm NMR tube and topped up with D2O. Thesample contained 26 mg porous silica that filled the NMR tubeup a column of B1 cm height. The nominal pore volume of the
silica used can be obtained from the specific pore volume of0.035 cm3. Prior to the experiment, the liquid level was reducedto ca. one mm above the level of the top of the water-saturatedporous silica column. The total heavy water content of thesample (mw = 109.6 mg) was established from the mass differenceafter having dried the sample at 106 1C in an oven (that is, afterhaving performed the NMR experiments). From the specific porevolume and the known density of D2O, the fraction of all addedwater contained within the pores was found to be xpore = 0.35.
The NMR experiments were performed on a Bruker AvanceIII 500 NMR spectrometer with 76.8 MHz resonance frequencyfor 2H. A conventional broadband-observe probe was used todetect the time-domain 2H NMR signal as recorded after asingle-pulse excitation. The length of the excitation pulse wasset to 1 ms that corresponds to a pulse angle of ca. 111(calculated form the 901 pulse length calibrated using the liquid2H NMR signal above melting). The actual temperature of thesample versus the set temperature was calibrated in situ withPt100 temperature sensors. The accuracy of the calibration(within the �0.1 K precision of the temperature regulator systemused) was tested by recording the characteristic signature (theappearance of a narrow peak) of melting in a bulk D2O sample.
Identification and measurement of the NMR signal ofpremolten water
Measuring the amount of water molecules in the premoltenlayer was based on the fact that, under the current detectionregime, bulk D2O ice does not provide a central peak in theNMR spectrum but only the quadrupolar Pake pattern that isbecoming increasingly featureless towards the melting point asa result of the increasing frequency of molecular jumps in ice.This feature is in stark contrast to the spectra recorded byquadrupole echo detection where a central peak appears.23 Thisbehavior, connected to the nature of the molecular jumps,23,24
will be further investigated in detail elsewhere. Here it sufficesto say that the spectra recorded for ice in porous silica differsfrom that in bulk ice, by the presence of a large central peak ofca. 8–10 kHz line width at all explored temperatures (see ESI10†for details). This 2H NMR peak is assigned to the premoltenlayer.25–27
One disadvantage with single-pulse detection is that proberinging introduces transients, which can be significantly sup-pressed by introducing a few microseconds waiting time afterthe excitation pulse. However, as a consequence of this waitingtime, the broad spectrum of the ice component becomesstrongly distorted, a problem that is amplified by the effectof the remaining transients. Hence, extracting the intensity ofthe peak assigned to the premolten layer requires extensivebaseline correction that is nonetheless, rather straightforwardat low temperatures, where a simple linear baseline correctionsuffices. However, closer to the melting point (see the discussionbelow concerning the melting point in pores) the spectrum ofthe ice component becomes increasingly motionally averaged23
and thereby narrower. Hence, distinguishing between the stillmuch broader ice peak and the relatively narrower premoltenpeak becomes less evident. In addition, close to the melting point a
Paper PCCP
Ope
n A
cces
s A
rtic
le. P
ublis
hed
on 2
3 N
ovem
ber
2016
. Dow
nloa
ded
on 3
/19/
2022
2:3
5:31
PM
. T
his
artic
le is
lice
nsed
und
er a
Cre
ativ
e C
omm
ons
Attr
ibut
ion
3.0
Unp
orte
d L
icen
ce.
View Article Online

This journal is© the Owner Societies 2017 Phys. Chem. Chem. Phys., 2017, 19, 305--317 | 309
‘‘central’’ peak even in the spectrum of bulk ice can be observed.Yet, at the highest temperature below the melting point exploredhere, the relative intensity of that peak is more than one order ofmagnitude lower than that of the premolten peak. These effectsjointly form one factor that limits our uppermost temperature toca. 1.5 1C below the pore melting point of ice.
The other limiting factor is the distribution of pore sizes inthe explored porous glass. As described by the Gibbs–Thomsonequation,28 materials melt in pores at temperatures inversely pro-portional to the pore size. Hence, a size distribution leads to adistribution of the pore melting points (indeed, this is the way oneoften detects pore size distribution in NMR cryoporometry29,30). Forthis reason, ice in pores smaller than the average size melts attemperatures lower than the average pore melting temperature.This is actually detectable by the appearance of a small andnarrower peak on the top of the premelting peak. Coincidentally,the onset of this effect is also around ca. 1–1.5 1C below the averagepore melting point of ice.
NMR intensity calibration and the extraction of the PMLthickness
The 2H integral intensity of the premolten peak IPML raw(T)recorded at different temperatures was first corrected asIPML(T) = IPMLraw(T)/iac(T) with relative variation of the integralintensity iac of perdeuterated acetone compared to its value at 5 1C(that is, iac(5 1C) = 1 while iac(�30 1C) = 1.25). This latter procedureaccounts for the intensity variation of the 2H NMR signal because ofthe inverse proportionality of the nuclear magnetization to thetemperature (Curie’s law) and because of the temperature depen-dence of NMR probe response.30 As resulted by this correction,IPML(T) is directly proportional to the number of water molecules inpremolten state. In addition, the 2H integral intensity Itotal wasrecorded at 5 1C where all ice was molten (note that bulk meltingtemperature for D2O is 3.8 1C). Considering that the fraction of waterimbibed into the pores was xpore = 0.35, the relative amount ofpremolten water within the pores can be obtained as
aPMLðTÞ ¼IPMLðTÞxpore � Itotal
(2)
After having obtained aPML, the width of the premolten layercan be calculated under the assumption of a specific poregeometry. Previous experiments have indicated that the poreshape is rather close to cylindrical.31 Hence, we assume thataPML reflects the volume of premolten layers with thickness lPML
in cylinders of d = 187.8 nm diameter, that is
aPMLðTÞ ¼d2 � d � 2lPMLðTÞ½ �2
d2(3a)
from which lPML can be obtained under the assumption of itbeing small as compared to the pore diameter as
lPMLðTÞ �aPMLðTÞ � d
4(3b)
We note that had the assumption of spherical, rather thancylindrical pores been used, the lPML values would uniformly be2/3 of those calculated by eqn (3b).
Results and discussionsIce adhesion on neat silica
Fig. 1 shows the maximum shear adhesion pressure (i.e. thepressure where failure occurs) of ice on ultra-smooth silica substrates(Ra o 0.4 nm) as a function of temperature (note that the shearadhesion differs from the tensile adhesion, which is typically anorder of magnitude higher for silica/ice interfaces).3,17,18 The datashows that the adhesion strength first increases almost linearly asthe temperature decreases, and then remains, within error, approxi-mately constant at temperatures below �25 1C. Depending on thetemperature of the measurement, three different behaviors werenoticed. The first, defined as cohesive failure and observed at�25 1Cand lower temperatures, is characterized by traces of ice left behindon the substrate upon removal of the ice cylinder. In this range, thestrength of the adhesion is at least comparable to, if not higher than,the cohesive strength of the bulk ice. The larger error bars in thisregime are a consequence of the stochastic breaking process occur-ring in the bulk (Fig. 1). The second, defined as adhesive failure andobserved between�20 1C and�25 1C, is assigned to cases where theice cylinder, at a given pressure, suddenly detaches completely fromthe substrate, leaving behind a clean silica surface. The third andmost interesting behavior was observed between 0 1C and B�20 1C,when the ice cylinder was seen to consistently slide on the silicasurface when performing the adhesion measurements (see movie inESI†). This latter behavior has been rarely reported in the iceadhesion literature.4,17
The sliding behavior is particularly worth remarking,because on rougher silica substrates (vide infra) ice does notslide at any temperature, detaching exclusively by adhesive orcohesive failure. The general trend depicted in Fig. 1, with analmost linear increase of the adhesion strength followed by acohesive regime, as well as the sliding behavior for smoothersamples is in agreement with what has been previously reported byJellinek.17,18 Although not experimentally proven, it was suggested
Fig. 1 Maximum shear adhesion pressure for the ice/silica interface(Ra o 0.4 nm) as a function of temperature. The dashed line is a guideto the eye, while the shadowed area marks the temperature range wheresliding occurs. The square at lower temperatures depicts the cohesivefailure regime.
PCCP Paper
Ope
n A
cces
s A
rtic
le. P
ublis
hed
on 2
3 N
ovem
ber
2016
. Dow
nloa
ded
on 3
/19/
2022
2:3
5:31
PM
. T
his
artic
le is
lice
nsed
und
er a
Cre
ativ
e C
omm
ons
Attr
ibut
ion
3.0
Unp
orte
d L
icen
ce.
View Article Online

310 | Phys. Chem. Chem. Phys., 2017, 19, 305--317 This journal is© the Owner Societies 2017
then that the transition from sliding to adhesive/cohesive failure,was influenced by the thickness of the PML relative to the surfaceroughness. The underlying argument is that the premolten layerpromotes sliding, provided it is sufficiently thick to preventmechanical interlocking by ice engaging groves in the substratesurface: the molecular properties of the premolten layer shouldthen govern the macroscopic adhesion. To establish such correla-tion we make use of vibrational spectroscopy and NMR.
The thickness of the premolten layer
TIR Raman spectroscopy. Vibrational spectroscopy is sensitive tochanges in the hydrogen bonding environment of water and ice andis thus suitable for investigating the presence and properties of theQLL. TIR-Raman enables depth profiling as well as independentrecording of the bulk spectrum which is particularly importantfor extracting potential contributions from the PML close to theinterface (vide infra).
Bulk. The OH-stretching region Raman spectra of bulk ice inthe temperature range from �35 1C to �1.0 1C and liquid waterat 0 1C are displayed for reference in Fig. 2. To facilitatecomparisons, all spectra have been normalized to the highestintensity peak, which for ice and liquid water, are centered atapproximately 3140 cm�1 and 3240 cm�1, respectively. Thedifferences between the spectra of liquid water and ice areevident, reflecting the lower average number and strength ofhydrogen bonds in the liquid phase. Additionally, Fig. 2 alsoshows how the bulk ice spectra changes with temperature, ashighlighted by the blue-shift of the B3140 cm�1 band with anaverage gradient of 0.35 cm�1 K�1, and an overall intensityincrease at higher wavenumbers reflecting the weakening of thehydrogen bonds as the melting temperature is approached.This is consistent with the increased frequency of molecularjumps in ice detected by NMR (see Experimental section).
A closer examination and fitting of the ice spectra in Fig. 2,together with those collected at other polarization combina-tions (see ESI3†), reveal the presence of at least four resolvable
bands, centered at approximately 3050, 3140, 3270, and 3375 cm�1.Although these bands associated with the OH stretching modeshave been previously identified,32–35 the detailed assignmentsremain a source of debate, mainly because of the complicatedinterplay between OH-bonds of different strengths and in particu-lar, their intermolecular coupling dynamics.36–38 Agreement isfound, however, in the assignment of the dominant B3140 cm�1
peak in Fig. 2 to the collective in-phase OH stretch of tetrahedrallycoordinated water molecules.32,33,35–37 Without going further in theassignment of the remaining bands, for the purpose of the generaldiscussion of the TIR Raman spectra below, it suffices to stress thespectral differences between the solid and liquid forms of H2O,namely sharp bands at lower wavenumbers are linked to stronglyhydrogen bonded molecules in ice, while broader features at higherwavenumbers are accordingly associated to more loosely coordi-nated molecules in the liquid.
Premolten layer. To obtain a signal from the PML using TIR-Raman spectroscopy, normalized spectra recorded at the sametemperature but for two extreme penetration depths, that is70 nm (i.e. ‘‘surface’’) and 4100 mm (i.e. bulk), were subtractedfrom each other. This latter procedure should yield the char-acteristic spectrum of the PML, provided it is sufficiently thick(i.e. 2–3% compared to the shortest probing depth) and alsospectrally distinct from bulk ice at the same temperature. Atthis point it is worth stressing the importance of using asreference, bulk ice spectra collected at the same temperaturefor extracting the PML contribution since, as demonstrated inFig. 2, the bulk spectral features are clearly dependent ontemperature. This fact has been neglected in a number ofATR IR studies of the PML,39–41 where the spectrum of ice at alow temperature, usually below�25 1C, has been used as referencefor extracting the PML contributions by subtraction of spectracollected at higher temperatures. It is thus apparent that in thosestudies the temperature dependent variations of the bulk icespectra have been misleadingly associated to the PML.
Fig. 3 left shows pairs of closely overlapping TIR Ramanspectra from the ‘‘surface’’ and bulk collected at three differenttemperatures, ranging from �35 1C to �0.3 1C. The differencespectra (Fig. 3 right) are significant, and show two clear peaksat B3410 cm�1 and B3620 cm�1, with essentially temperature-independent centre positions and absolute intensities. Theobserved lack of temperature dependence is inconsistent withthe expected behavior of a premolten layer, particularly whenapproaching the melting point. In order to determine the originof the peaks in the difference spectra, experiments were alsoperformed with D2O ice. Replacing the hydrogen atoms of waterby the heavier deuterium red-shifts all the ice spectral featuresby B900 cm�1, which should leave in principle, no bands in theOH stretching region. However, the same features observed forH2O ice remained for D2O ice (dashed line in Fig. 3 right),which implies that the bands do not arise from either ice or thePML. They are instead assigned to SiOH groups trapped withinthe bulk fused silica substrate.42,43
To make certain that potential spectral features from thePML were not obscured by substrate bands, additional TIRRaman measurements were performed with D2O ice (Fig. 4).
Fig. 2 TIR Raman spectra (Sy) of bulk H2O ice at various temperaturesranging from �35 1C to �1.0 1C (solid lines) and liquid H2O at 0 1C (dashedline). The ice spectra and the water spectrum have been normalized to thepeak at B3140 cm�1 and B3240 cm�1, respectively.
Paper PCCP
Ope
n A
cces
s A
rtic
le. P
ublis
hed
on 2
3 N
ovem
ber
2016
. Dow
nloa
ded
on 3
/19/
2022
2:3
5:31
PM
. T
his
artic
le is
lice
nsed
und
er a
Cre
ativ
e C
omm
ons
Attr
ibut
ion
3.0
Unp
orte
d L
icen
ce.
View Article Online

This journal is© the Owner Societies 2017 Phys. Chem. Chem. Phys., 2017, 19, 305--317 | 311
As previously recognized,32,37,38 the patterns of the spectralfeatures in D2O ice are not identical to those of H2O ice.Notwithstanding, they show obvious resemblance, with a moreintense peak at low frequencies (i.e. 2330 cm�1), followed byweaker and broader bands at higher wavenumbers (note thatD2O ice melts at +3.8 1C). The difference spectra in the ODstretching region shown in the inset of Fig. 4 may reveal everslightly higher intensities for the bands associated with weakerhydrogen bonds close to the melting point; however, withinerror, no significant differences are observed at the two extremetemperatures recorded.
There are two possible explanations for these results: (i) thePML thickness is very small compared to the shortest penetra-tion depth of the evanescent wave, and/or (ii) its spectralfeatures are not significantly different from those of bulk ice.
Option (ii) can be discarded, considering previous IR measure-ments on thin ice films,40 as well as confocal Raman measure-ments on porous silica samples (data to be presentedelsewhere), that indicate that the PML vibrational spectraclearly differs from that of ice, resembling more that of liquidor supercooled water. This is further substantiated with thesum frequency results described below. Hence, we infer thatthe thickness of the PML is lower than the detection limit ofTIR Raman at all temperatures measured. Specifically, from thesubtracted spectra shown in Fig. 3 and 4 and using as model forthe PML the spectra of supercooled water, the PML thickness asdetermined by TIR Raman, is conservatively estimated to bethinner than 3 nm, even at temperatures as close as 0.3 1C fromthe bulk melting temperature.
NMR spectroscopy. Although NMR is highly sensitive tomolecular dynamics, and thereby, well suited for studying thePML, it lacks the necessary surface specificity to detect the PMLcontributions on a single interface as the one probed by TIRRaman and VSFS. This apparent limitation is resolved byemploying mesoporous silica particles that effectively increasethe amount of PML present in the probed volume.
Following the procedure described in detail in the Experi-mental section, the estimated thickness of the premolten layerlPML (see eqn (3b)) as a function of temperature is presented inFig. 5. The temperature scale in Fig. 5 is relative to theapproximate mean pore melting point of 3.3 1C as obtainedby conventional cryoporometric experiments (the bulk meltingpoint inside the pores is suppressed as predicted by the Gibbs–Thomson equation).30
While premelting has been frequently detected by NMR bothin pores but also on free-standing small ice particles,44 thepreferred detection method has been 1H NMR.16 Yet, in the1H NMR spectrum the signals from ice and premolten watercannot be as easily distinguished45 as in the corresponding2H NMR spectrum, particularly when approaching the meltingpoint where the molecular mobility in ice increases.23 This isillustrated in the ESI10† where it is shown that the 2H NMR
Fig. 3 TIR Raman spectra (Sy) with bulk and 70 nm penetration depth of H2O ice at various temperatures ranging from �35 1C to �0.3 1C (left). Thespectra have been normalized to the peak at approximately 3140 cm�1. (Right) Solid lines show the ‘‘surface’’ contribution upon subtraction of thetwo spectra at a given temperature. Dashed line shows the OH-stretching region of a D2O ice sample. Features observed at 3410 cm�1 and 3620 cm�1
originate from contributions within the bulk silica substrate.
Fig. 4 TIR Raman Sy spectra of D2O ice (melting temperature +3.8 1C)next to a fused silica substrate at various temperatures, collected at twopenetration depths: ‘‘bulk’’ and 100 nm. The spectra have been normalizedto the peak centred at B2330 cm�1. The inset (magnification shown inESI4†) shows the surface contribution (subtraction of bulk spectrum from100 nm spectrum for each temperature).
PCCP Paper
Ope
n A
cces
s A
rtic
le. P
ublis
hed
on 2
3 N
ovem
ber
2016
. Dow
nloa
ded
on 3
/19/
2022
2:3
5:31
PM
. T
his
artic
le is
lice
nsed
und
er a
Cre
ativ
e C
omm
ons
Attr
ibut
ion
3.0
Unp
orte
d L
icen
ce.
View Article Online

312 | Phys. Chem. Chem. Phys., 2017, 19, 305--317 This journal is© the Owner Societies 2017
signal of the PML layer can be clearly distinguished uponcomparison of the spectra recorded in bulk ice and ice imbibedin the porous glass.
Further support for the identification of the PML–NMRsignal can be obtained by comparing the signal intensity inporous glasses with varying pore sizes. As indicated by eqn (3a)in the Experimental details, the relative intensity of the signalaPML is inversely proportional to the mean pore diameter, a factthat has been verified both for water45 and other liquidsexhibiting premelting.46 For the same reason, premelting inporous materials was typically observed by NMR in systemswith small pore sizes. Notwithstanding, as it has been demon-strated the PML thickness is sensitive to the curvature of thepore wall.46 Consequently, porous silica particles with ratherlarge pores (i.e. 187.8 nm) were selected in this study tofacilitate the comparison of the NMR data with the TIR Ramanand VSFS observations on flat surfaces.
The only comparable temperature-dependent data set we areaware of has been collected in Vycor glasses with 4–50 nm porediameter;16 Vycor glasses typically exhibit far less regular porestructures and broader pore size distributions30 than thosemanufactured by Controlled Pore Glasses. In contrast to thedata presented in Fig. 5, the data from Ishizaki et al.16 seem toindicate that the premolten layer grows continuously up tocomplete melting. We believe the data within a few degrees tothe pore melting temperature, were wrongly attributed to thePML16 since the contribution of completely molten porevolumes was neglected. Hence, the data from Ishizaki et al.16
reflects not the extension of the premolten layer but instead thewidth of their pore size distribution (see NMR section inExperimental details). As an additional contributing methodo-logical reason, the 1H NMR spectrum of the premolten phase isnarrower (ca. 3 kHz broad45) than the corresponding 2H NMRspectrum (ca. 8–10 kHz, vide supra), while the 1H spectrum of theliquid within molten pores is ca. 6 times broader (40.5 kHz,
caused by magnetic field inhomogeneity to which 1H is moresensitive, in direct proportionality to its high gyromagneticfactor) than the corresponding 2H NMR spectrum. Hence, theNMR signal contributions from the premolten layers and moltenpores cannot be easily distinguished by 1H NMR employed byIshizaki et al.16
The NMR data show a progressively faster increase in thePML thickness as the temperature approaches the meltingpoint but, due to the limitations discussed above, the thicknessat temperatures DT o 1.5 K, could not be assessed. Still, thislatter temperature range was accessible by TIR-Raman, yieldinga thickness estimate of o3 nm. On the other hand, the NMRdata presented in Fig. 5 shows that around DT B 25 K the PMLbecomes less than a monolayer thick. Notwithstanding, even inthat region we find that a very small fraction of water moleculesexhibits some rapid re-orientational dynamics, which is theunderlying reason for motionally averaging out the staticquadrupole coupling and thereby obtaining a broad, yet iso-tropic peak. The statement ‘‘less than a monolayer thickness’’implies that, in this temperature range, the premolten fractionis not any longer a continuous layer (and, thereby, may not becalled PML) but a collection of individual molecules thatbehave more like defects in a crystalline structure.
VSF spectroscopy: PML onset and molecular insight
In contrast to TIR-Raman, VSF spectroscopy is intrinsically sur-face specific because only molecules in a non-centrosymmetricenvironment (which is always the case at an interface) cancontribute to the sum frequency generation. This removes theneed for background subtraction. In addition, data can berecorded in different polarization combinations, which facilitatespectral assignments. In light of the essentially negative result(that is, the absence of a signal that can be assigned to PML) byTIR-Raman and the concluded lack of PML signature in previousspectroscopic experiments on silica or silica-like surfaces,13,14
one important function of the VSFS experiments was to verifyboth (i) the existence of molecules at the silica–ice interface thatare not in the state characteristic of bulk ice and (ii) verify thatthe system evolves with temperature on a manner that is con-sistent with the NMR results presented in Fig. 5.
In Fig. 6 the VSF spectra recorded in the SSP, PPP, and SPSpolarization combinations for�38 1C ice and liquid water, bothin contact with silica, are shown for reference. In contrast toTIR-Raman, the VSF spectra present additional bands at higherwavenumbers, demonstrating that at the interface there is asignificant larger fraction of water molecules that form weakerhydrogen bonds. We stress that this, in ice, is not a signature ofPML but the expected behaviour at an interface to which watercannot or has more limited options to hydrogen bond. Werecall that the experimental geometry used, preferentiallyenhances the SF response at high wavenumbers making iteasier to detect changes in the bands at high frequencies21
(Fresnel factor corrected spectra can be found in ESI7†). Whencompared with the VSF spectra of liquid H2O, the ice spectra at�38 1C displays lower absolute intensities, but at the same timesharper and more prominent bands at lower wavenumbers.
Fig. 5 The thickness of the PML layer derived (see lPML in eqn (3b)) from2H NMR measurements as a function of temperature, measured on poroussilica particles imbibed with D2O. The DT is relative to the approximatemean pore melting point that is B3.3 1C for the silica particles used. Theshaded area indicates the customary range given for the thickness of amonolayer of water in the liquid state.
Paper PCCP
Ope
n A
cces
s A
rtic
le. P
ublis
hed
on 2
3 N
ovem
ber
2016
. Dow
nloa
ded
on 3
/19/
2022
2:3
5:31
PM
. T
his
artic
le is
lice
nsed
und
er a
Cre
ativ
e C
omm
ons
Attr
ibut
ion
3.0
Unp
orte
d L
icen
ce.
View Article Online

This journal is© the Owner Societies 2017 Phys. Chem. Chem. Phys., 2017, 19, 305--317 | 313
As described in more detail below, this difference in absoluteintensities is attributed to the conflicting molecular orderingimposed by the underlying ice crystal and the negativelycharged silica surface.
Assignments. The SF ice spectra at �38 1C shows two wellresolved features at low frequencies, B3125 cm�1 and B3250 cm�1,which are close to the central peaks observed in the Raman andIR47,48 spectra of bulk ice, respectively. It is worth notinghowever, that the former is red-shifted by B15–20 cm�1 whencompared to the bulk Raman spectra collected at the sametemperature (see Fig. 2 and ESI3†). Moreover, this band hasbeen assigned to in phase OH collective modes, specificallyfrom the bilayer ‘‘stitching’’ bond vibrations present in the firstfew top bilayers.49–51 The band at B3250 cm�1, althoughpreviously identified in the SF spectra of single crystal ice/vapour interfaces at temperatures below 200 K,52,53 has receivedless attention. Following the work of Buch and Devlin in bulkice,33 the SF band, which is clearly observed in the SPS and PPPspectra (Fig. 6), has also been assigned to collective in phaseOH modes but with the distinction of having an antisymmetricstretch character.49 Skinner and coworkers reject the descrip-tion of bands in terms of symmetric and antisymmetric, asintramolecular couplings are negligible in H2O ice, and assignit instead to a so called ‘‘weak intermolecular coupling’’.37
Regardless of the apparent discrepancy in the detailed assign-ments, both bands remain associated to tetrahedrally coordi-nated water molecules that form strong hydrogen bonds andessentially connect the top two or possible three surfacebilayers (i.e. surface OH ‘‘stitching’’ modes).
The features observed at higher wavenumbers, mainly atB3350 cm�1, B3450 cm�1, B3550 cm�1, and B3630 cm�1 arein turn linked to under-coordinated water molecules present inthe top half bilayer, close or in direct contact to the silicasubstrate. The first two resonances are near in frequency tofeatures observed at the single crystal ice/vapour interfacebelow 200 K,51,52 which were tentatively assigned to three-coordinated water molecules with dangling lone pairs.51 Theremaining bands at the blue end of the spectra (Fig. 6), not
observed at the ice/vapour interface, are in turn assigned toweakly hydrogen bonded water molecules in direct contact tothe fused silica surface. The high frequency of these modeswould indicate that the molecules or moieties participatingin the H-bond pair do not accept themselves any additionalH-bonds.54,55 Although the peak position of the highest frequencymode closely corresponds with the band assigned in TIR Ramanto bulk SiOH groups (see Fig. 3), the OH feature in the SF spectrarapidly exchanges when in contact with D2O,19 which indicatesthat it originates from accessible surface groups. Nonetheless, SFexperiments using silica surfaces with varying Si–OH groupdensities (to be presented elsewhere), suggest that this latter bandmay indeed be linked to weakly hydrogen bonded surface silanolgroups.
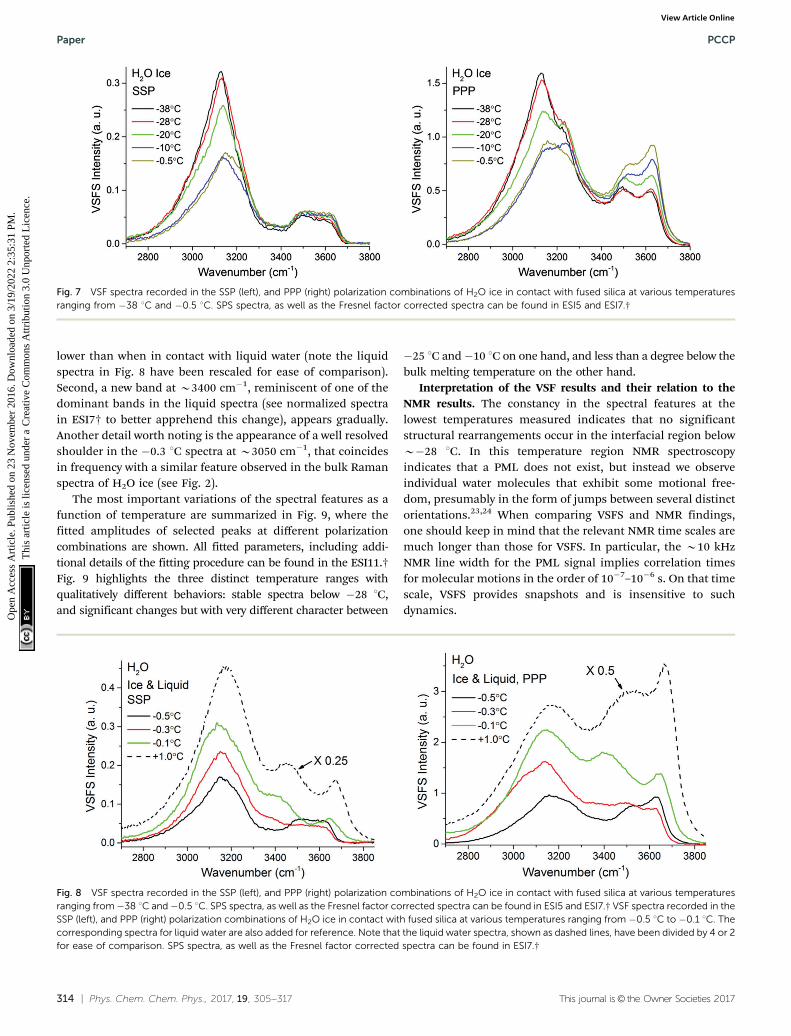
Temperature dependence. The evolution of the SF spectra inthe SSP and PPP polarization combinations upon increasingthe temperature up to �0.5 1C is presented in Fig. 7 (SPSspectra can be found in section ESI5†). In the SSP and PPPspectra the bands associated to the bilayer ‘‘stitching’’ modesexhibit a significant decrease in intensity between �28 1C to�10 1C, remaining approximately constant at temperaturesbelow and above this range (at least up to �0.5 1C). Interest-ingly, the modes at higher frequencies associated to watermolecules in direct contact to the silica substrate, follow anopposite trend in the PPP spectra, increasing from �20 1C andabove, while little or no changes are observed in the SSP andSPS (see ESI5†) polarization combinations. A closer inspectionof the spectra in Fig. 7 also shows some additional details, likethe change in relative intensity between the two lowest fre-quency modes at B3125 cm�1 and B3250 cm�1, as well as theB30 cm�1 blue shift of the former band in the temperaturerange considered.
At temperatures exceeding �0.5 1C and in a limited tem-perature interval before reaching the bulk melting temperature,the VSF spectral features display a contrasting behaviour asshown in Fig. 8, where both SSP and PPP spectra are presented.First and most remarkably, the overall intensity of the SFresponse rapidly increases, remaining however, substantially
Fig. 6 VSF spectra recorded in the SSP, PPP, and SPS polarization combinations of H2O ice at �38 1C (left) and H2O liquid at +1 1C (right). Note that theintensity in the PPP spectra has been divided by 2 for ease of comparison. The spectra fitted and corrected by the Fresnel factors can be found in ESI7.†
PCCP Paper
Ope
n A
cces
s A
rtic
le. P
ublis
hed
on 2
3 N
ovem
ber
2016
. Dow
nloa
ded
on 3
/19/
2022
2:3
5:31
PM
. T
his
artic
le is
lice
nsed
und
er a
Cre
ativ
e C
omm
ons
Attr
ibut
ion
3.0
Unp
orte
d L
icen
ce.
View Article Online
314 | Phys. Chem. Chem. Phys., 2017, 19, 305--317 This journal is© the Owner Societies 2017
lower than when in contact with liquid water (note the liquidspectra in Fig. 8 have been rescaled for ease of comparison).Second, a new band at B3400 cm�1, reminiscent of one of thedominant bands in the liquid spectra (see normalized spectrain ESI7† to better apprehend this change), appears gradually.Another detail worth noting is the appearance of a well resolvedshoulder in the �0.3 1C spectra at B3050 cm�1, that coincidesin frequency with a similar feature observed in the bulk Ramanspectra of H2O ice (see Fig. 2).
The most important variations of the spectral features as afunction of temperature are summarized in Fig. 9, where thefitted amplitudes of selected peaks at different polarizationcombinations are shown. All fitted parameters, including addi-tional details of the fitting procedure can be found in the ESI11.†Fig. 9 highlights the three distinct temperature ranges withqualitatively different behaviors: stable spectra below �28 1C,and significant changes but with very different character between
�25 1C and�10 1C on one hand, and less than a degree below thebulk melting temperature on the other hand.
Interpretation of the VSF results and their relation to theNMR results. The constancy in the spectral features at thelowest temperatures measured indicates that no significantstructural rearrangements occur in the interfacial region belowB�28 1C. In this temperature region NMR spectroscopyindicates that a PML does not exist, but instead we observeindividual water molecules that exhibit some motional free-dom, presumably in the form of jumps between several distinctorientations.23,24 When comparing VSFS and NMR findings,one should keep in mind that the relevant NMR time scales aremuch longer than those for VSFS. In particular, the B10 kHzNMR line width for the PML signal implies correlation timesfor molecular motions in the order of 10�7–10�6 s. On that timescale, VSFS provides snapshots and is insensitive to suchdynamics.
Fig. 7 VSF spectra recorded in the SSP (left), and PPP (right) polarization combinations of H2O ice in contact with fused silica at various temperaturesranging from �38 1C and �0.5 1C. SPS spectra, as well as the Fresnel factor corrected spectra can be found in ESI5 and ESI7.†
Fig. 8 VSF spectra recorded in the SSP (left), and PPP (right) polarization combinations of H2O ice in contact with fused silica at various temperaturesranging from �38 1C and �0.5 1C. SPS spectra, as well as the Fresnel factor corrected spectra can be found in ESI5 and ESI7.† VSF spectra recorded in theSSP (left), and PPP (right) polarization combinations of H2O ice in contact with fused silica at various temperatures ranging from �0.5 1C to �0.1 1C. Thecorresponding spectra for liquid water are also added for reference. Note that the liquid water spectra, shown as dashed lines, have been divided by 4 or 2for ease of comparison. SPS spectra, as well as the Fresnel factor corrected spectra can be found in ESI7.†
Paper PCCP
Ope
n A
cces
s A
rtic
le. P
ublis
hed
on 2
3 N
ovem
ber
2016
. Dow
nloa
ded
on 3
/19/
2022
2:3
5:31
PM
. T
his
artic
le is
lice
nsed
und
er a
Cre
ativ
e C
omm
ons
Attr
ibut
ion
3.0
Unp
orte
d L
icen
ce.
View Article Online

This journal is© the Owner Societies 2017 Phys. Chem. Chem. Phys., 2017, 19, 305--317 | 315
The first detectable changes take place in the temperaturerange between �25 1C and �10 1C with the marked decrease ofthe bands linked to 4-coordinated water molecules that are notin direct contact to silica, and which in principle connect thesurface bilayers (i.e. ‘‘stitching’’ modes). The appearance ofchanges in the spectral features can be interpreted as the onsetof the PML at the ice/silica interface, which we note is curiouslyB60 1C above the estimated onset temperature for the ice/vapour interface based on measurements using the sametechnique.14,56 A lower SF intensity implies a broadening ofthe orientational distribution and/or a decrease in the numberof molecules having that particular configuration.10,11 Interest-ingly, during this first transition, the features linked to watermolecules in direct contact to the silica substrate, show anopposite behavior, increasing in the PPP, and to a much lowerextent, also in the SSP spectra (Fig. 7 and 9), suggesting anarrowing of their average orientation. This behavior can beconsidered as the first evidence of the conflicting orderingimposed by the underlying ice crystal and the silica substrate,which becomes more apparent at higher temperatures (see below).In this region, the NMR-derived PML thickness is 1–3 monolayersthick, that – in a typical liquid-like material – is sufficient for losingsome spatial/orientational correlation. Hence, this is consistentwith the orientational distribution inferred above.
From B�10 1C and up to approximately �0.5 1C the spectralfeatures, besides some small changes in the high frequencymodes, remain largely constant suggesting limited structuralchanges in this temperature range. On the NMR side, one cannote that in the �10 1C to �1.5 1C range there are no dramaticchanges in either the line width of the PML signal or in theextension of the PML.
It is only when approaching the bulk melting temperaturethat dramatic onset of a new behavior is observed (Fig. 8 and 9);unfortunately, we lack NMR data in this interval, but TIRRaman sets a limit of o3 nm for PML thickness at �0.3 1C.
The overall increase in spectral intensity is linked to the thickeningof the PML, as the negative charge of the silica substrate startimposing an ordering of the interfacial water molecules with theirdipole moment oriented towards the silica surface, which is in clearcontrast to the ordering enforced by the underlying ice crystal. Thisconflict is exemplified for example with the increased amplitudeand probable change in phase of the B3450 cm�1 band, whichwould essentially indicate a flip of the average relative polarorientation14,20 of the contributing water molecules just a fractionof a degree below the bulk melting temperature (Fig. 8 and 9).Indeed, evidence of this change in orientation upon melting can befound in previous studies of the single crystal ice (basal plane)/silicainterface, where a flip of 1801 was concluded from examining theSF interference patterns between �20 1C ice and liquid water at aconstant frequency of 3150 cm�1.14 We note however, that ourfitted data from a single ice crystal but of unknown orientation,do not support such a change in phase for the B3125 cm�1
peak upon melting, but instead for that of the neighbouring bandat B3250 cm�1 when going through the first transition associatedto the PML onset (see Fig. 7 and ESI11†).
The significant lower intensity of the SF ice spectra at�0.1 1C compared to the water spectrum at +1 1C (Fig. 8), isan indication that the PML thickness is always smaller that theSF probing depth at the silica/water interface (i.e. just a fewmolecular layers). The significant increase in SF intensity uponmelting is not unique to silica, as a similar behaviour has beenrecently reported to occur with another negatively chargedsurface, specifically muscovite mica.57 Finally, we note that asthe PML becomes thicker it is also likely that SF signal can begenerated from the retreating ice/PML interface. We speculatethat this could be origin of the 3050 cm�1 feature resolved inthe �0.3 1C spectra (Fig. 8). However, a more conclusive pictureand interpretation of the experimental data must await newtheoretical calculations and models.
Concluding remarks
The three techniques used to probe the molecular properties ofthe premolten layer at the silica/ice interface have providedconsistent information. At the lowest explored temperaturesstarting from approximately �25 1C and below (that is, relativeto the bulk or pore melting in the particular set of exploredsamples), NMR indicated that very few water molecules (i.e. lessthan a monolayer coverage), possess rotational freedom thatpermits them to contribute to the peak assigned to the pre-molten state. In this region, VSFS reveals no temperaturedependence down to �38 1C. Hence, whatever order exists atvery low temperatures seems to persist up to B�25 1C. Insummary, there is no indication of a premolten layer at thelowest explored temperatures.
Our data jointly set the onset temperature for PML toapproximately �25 1C. Somewhere around this point the VSFspectral parameters start to show a temperature dependentvariation and to indicate a growing disorder at the interfacewhile the NMR-derived thickness exceeds that of a monolayer.
Fig. 9 Fitted amplitudes of selected modes in the VSF spectra collected inthe SSP, PPP and SPS polarization combinations. Note that the amplitudeshave been normalized by the corresponding bandwidths. For ease ofcomparison the amplitude values for the B3630 cm�1 band in PPP havebeen multiplied by �1 as they display an opposite phase. Additional fittedparameters and details of the procedure can be found in the ESI11.†
PCCP Paper
Ope
n A
cces
s A
rtic
le. P
ublis
hed
on 2
3 N
ovem
ber
2016
. Dow
nloa
ded
on 3
/19/
2022
2:3
5:31
PM
. T
his
artic
le is
lice
nsed
und
er a
Cre
ativ
e C
omm
ons
Attr
ibut
ion
3.0
Unp
orte
d L
icen
ce.
View Article Online
316 | Phys. Chem. Chem. Phys., 2017, 19, 305--317 This journal is© the Owner Societies 2017
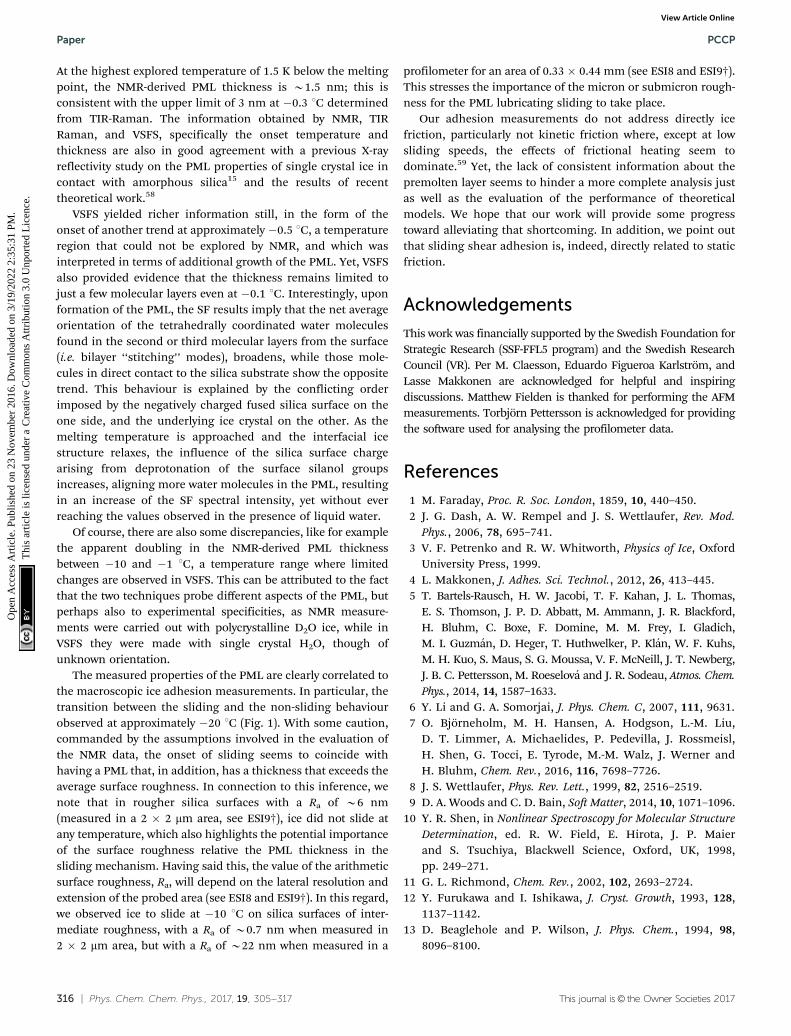
At the highest explored temperature of 1.5 K below the meltingpoint, the NMR-derived PML thickness is B1.5 nm; this isconsistent with the upper limit of 3 nm at �0.3 1C determinedfrom TIR-Raman. The information obtained by NMR, TIRRaman, and VSFS, specifically the onset temperature andthickness are also in good agreement with a previous X-rayreflectivity study on the PML properties of single crystal ice incontact with amorphous silica15 and the results of recenttheoretical work.58
VSFS yielded richer information still, in the form of theonset of another trend at approximately �0.5 1C, a temperatureregion that could not be explored by NMR, and which wasinterpreted in terms of additional growth of the PML. Yet, VSFSalso provided evidence that the thickness remains limited tojust a few molecular layers even at �0.1 1C. Interestingly, uponformation of the PML, the SF results imply that the net averageorientation of the tetrahedrally coordinated water moleculesfound in the second or third molecular layers from the surface(i.e. bilayer ‘‘stitching’’ modes), broadens, while those mole-cules in direct contact to the silica substrate show the oppositetrend. This behaviour is explained by the conflicting orderimposed by the negatively charged fused silica surface on theone side, and the underlying ice crystal on the other. As themelting temperature is approached and the interfacial icestructure relaxes, the influence of the silica surface chargearising from deprotonation of the surface silanol groupsincreases, aligning more water molecules in the PML, resultingin an increase of the SF spectral intensity, yet without everreaching the values observed in the presence of liquid water.
Of course, there are also some discrepancies, like for examplethe apparent doubling in the NMR-derived PML thicknessbetween �10 and �1 1C, a temperature range where limitedchanges are observed in VSFS. This can be attributed to the factthat the two techniques probe different aspects of the PML, butperhaps also to experimental specificities, as NMR measure-ments were carried out with polycrystalline D2O ice, while inVSFS they were made with single crystal H2O, though ofunknown orientation.
The measured properties of the PML are clearly correlated tothe macroscopic ice adhesion measurements. In particular, thetransition between the sliding and the non-sliding behaviourobserved at approximately �20 1C (Fig. 1). With some caution,commanded by the assumptions involved in the evaluation ofthe NMR data, the onset of sliding seems to coincide withhaving a PML that, in addition, has a thickness that exceeds theaverage surface roughness. In connection to this inference, wenote that in rougher silica surfaces with a Ra of B6 nm(measured in a 2 � 2 mm area, see ESI9†), ice did not slide atany temperature, which also highlights the potential importanceof the surface roughness relative the PML thickness in thesliding mechanism. Having said this, the value of the arithmeticsurface roughness, Ra, will depend on the lateral resolution andextension of the probed area (see ESI8 and ESI9†). In this regard,we observed ice to slide at �10 1C on silica surfaces of inter-mediate roughness, with a Ra of B0.7 nm when measured in2 � 2 mm area, but with a Ra of B22 nm when measured in a
profilometer for an area of 0.33 � 0.44 mm (see ESI8 and ESI9†).This stresses the importance of the micron or submicron rough-ness for the PML lubricating sliding to take place.
Our adhesion measurements do not address directly icefriction, particularly not kinetic friction where, except at lowsliding speeds, the effects of frictional heating seem todominate.59 Yet, the lack of consistent information about thepremolten layer seems to hinder a more complete analysis justas well as the evaluation of the performance of theoreticalmodels. We hope that our work will provide some progresstoward alleviating that shortcoming. In addition, we point outthat sliding shear adhesion is, indeed, directly related to staticfriction.
Acknowledgements
This work was financially supported by the Swedish Foundation forStrategic Research (SSF-FFL5 program) and the Swedish ResearchCouncil (VR). Per M. Claesson, Eduardo Figueroa Karlstrom, andLasse Makkonen are acknowledged for helpful and inspiringdiscussions. Matthew Fielden is thanked for performing the AFMmeasurements. Torbjorn Pettersson is acknowledged for providingthe software used for analysing the profilometer data.
References
1 M. Faraday, Proc. R. Soc. London, 1859, 10, 440–450.2 J. G. Dash, A. W. Rempel and J. S. Wettlaufer, Rev. Mod.
Phys., 2006, 78, 695–741.3 V. F. Petrenko and R. W. Whitworth, Physics of Ice, Oxford
University Press, 1999.4 L. Makkonen, J. Adhes. Sci. Technol., 2012, 26, 413–445.5 T. Bartels-Rausch, H. W. Jacobi, T. F. Kahan, J. L. Thomas,
E. S. Thomson, J. P. D. Abbatt, M. Ammann, J. R. Blackford,H. Bluhm, C. Boxe, F. Domine, M. M. Frey, I. Gladich,M. I. Guzman, D. Heger, T. Huthwelker, P. Klan, W. F. Kuhs,M. H. Kuo, S. Maus, S. G. Moussa, V. F. McNeill, J. T. Newberg,J. B. C. Pettersson, M. Roeselova and J. R. Sodeau, Atmos. Chem.Phys., 2014, 14, 1587–1633.
6 Y. Li and G. A. Somorjai, J. Phys. Chem. C, 2007, 111, 9631.7 O. Bjorneholm, M. H. Hansen, A. Hodgson, L.-M. Liu,
D. T. Limmer, A. Michaelides, P. Pedevilla, J. Rossmeisl,H. Shen, G. Tocci, E. Tyrode, M.-M. Walz, J. Werner andH. Bluhm, Chem. Rev., 2016, 116, 7698–7726.
8 J. S. Wettlaufer, Phys. Rev. Lett., 1999, 82, 2516–2519.9 D. A. Woods and C. D. Bain, Soft Matter, 2014, 10, 1071–1096.
10 Y. R. Shen, in Nonlinear Spectroscopy for Molecular StructureDetermination, ed. R. W. Field, E. Hirota, J. P. Maierand S. Tsuchiya, Blackwell Science, Oxford, UK, 1998,pp. 249–271.
11 G. L. Richmond, Chem. Rev., 2002, 102, 2693–2724.12 Y. Furukawa and I. Ishikawa, J. Cryst. Growth, 1993, 128,
1137–1142.13 D. Beaglehole and P. Wilson, J. Phys. Chem., 1994, 98,
8096–8100.
Paper PCCP
Ope
n A
cces
s A
rtic
le. P
ublis
hed
on 2
3 N
ovem
ber
2016
. Dow
nloa
ded
on 3
/19/
2022
2:3
5:31
PM
. T
his
artic
le is
lice
nsed
und
er a
Cre
ativ
e C
omm
ons
Attr
ibut
ion
3.0
Unp
orte
d L
icen
ce.
View Article Online

This journal is© the Owner Societies 2017 Phys. Chem. Chem. Phys., 2017, 19, 305--317 | 317
14 X. Wei, P. B. Miranda, C. Zhang and Y. R. Shen, Phys. Rev. B:Condens. Matter Mater. Phys., 2002, 66, 085401.
15 S. Engemann, H. Reichert, H. Dosch, J. Bilgram, V. Honkimakiand A. Snigirev, Phys. Rev. Lett., 2004, 92, 205701.
16 T. Ishizaki, M. Maruyama, Y. Furukawa and J. G. Dash,J. Cryst. Growth, 1996, 163, 455–460.
17 H. H. G. Jellinek, Can. J. Phys., 1962, 40, 1294–1309.18 H. H. G. Jellinek, J. Colloid Sci., 1959, 14, 268–280.19 E. Tyrode and J. F. D. Liljeblad, J. Phys. Chem. C, 2013, 117,
1780–1790.20 E. Tyrode, M. W. Rutland and C. D. Bain, J. Am. Chem. Soc.,
2008, 130, 17434–17445.21 J. F. D. Liljeblad and E. Tyrode, J. Phys. Chem. C, 2012, 116,
22893–22903.22 R. V. Klitzing, Adv. Colloid Interface Sci., 2005, 114–115,
253–266.23 R. J. Wittebort, M. G. Usha, D. J. Ruben, D. E. Wemmer and
A. Pines, J. Am. Chem. Soc., 1988, 110, 5668–5671.24 F. Fujara, S. Wefing and W. F. Kuhs, J. Chem. Phys., 1988, 88,
6801–6809.25 I. Furo and J. Daicic, Nord. Pulp Pap. Res. J., 1999, 14,
221–225.26 J. Rault, R. Neffati and P. Judeinstein, Eur. Phys. J. B, 2003,
36, 627–637.27 T. Sparrman, M. Oquist, L. Klemedtsson, J. Schleucher and
M. Nilsson, Environ. Sci. Technol., 2004, 38, 5420–5425.28 C. L. Jackson and G. B. McKenna, J. Chem. Phys., 1990, 93,
9002–9011.29 J. Mitchell, J. B. W. Webber and J. H. Strange, Phys. Rep.,
2008, 461, 1–36.30 O. V. Petrov and I. Furo, Prog. Nucl. Magn. Reson. Spectrosc.,
2009, 54, 97–122.31 O. Petrov and I. Furo, Phys. Rev. E: Stat., Nonlinear, Soft
Matter Phys., 2006, 73, 011608.32 E. Whalley, Can. J. Chem., 1977, 55, 3429–3441.33 V. Buch and J. P. Devlin, J. Chem. Phys., 1999, 110,
3437–3443.34 J. R. Scherer and R. G. Snyder, J. Chem. Phys., 1977, 67, 4794.35 T. Shigenari and K. Abe, J. Chem. Phys., 2012, 136, 174504.36 F. Li and J. L. Skinner, J. Chem. Phys., 2010, 133, 244504.37 L. Shi, S. M. Gruenbaum and J. L. Skinner, J. Phys. Chem. B,
2012, 116, 13821–13830.
38 L. De Marco, W. Carpenter, H. Liu, R. Biswas, J. M. Bowmanand A. Tokmakoff, J. Phys. Chem. Lett., 2016, 7, 1769–1774.
39 H. H. Richardson, J. Mol. Struct., 2006, 799, 56–60.40 V. Sadtchenko and G. E. Ewing, J. Chem. Phys., 2002, 116,
4686–4697.41 R. L. Walker, K. Searles, J. A. Willard and R. R. H. Michelsen,
J. Chem. Phys., 2013, 139, 244703.42 R. K. Iler, The chemistry of silica: solubility, polymerization,
colloid and surface properties, and biochemistry, Wiley, 1979.43 B. A. Morrow and A. J. McFarlan, J. Phys. Chem., 1992, 96,
1395–1400.44 Y. Mizuno and N. Hanafusa, J. Phys., Colloq., 1987, 48(C1),
511–517.45 R. Valiullin and I. Furo, J. Chem. Phys., 2002, 117, 2307–2316.46 O. V. Petrov, D. Vargas-Florencia and I. Furo, J. Phys. Chem.
B, 2007, 111, 1574–1581.47 C. Medcraft, D. McNaughton, C. D. Thompson, D. R. T.
Appadoo, S. Bauerecker and E. G. Robertson, Phys. Chem.Chem. Phys., 2013, 15, 3630–3639.
48 A. Wong, L. Shi, R. Auchettl, D. McNaughton, D. R. T. Appadooand E. G. Robertson, Phys. Chem. Chem. Phys., 2016, 18,4978–4993.
49 V. Buch, T. Tarbuck, G. L. Richmond, H. Groenzin, I. Li andM. J. Shultz, J. Chem. Phys., 2007, 127, 204710.
50 T. Ishiyama, H. Takahashi and A. Morita, J. Phys. Lett., 2012,3, 3001–3006.
51 M. J. Shultz, P. Bisson and T. H. Vu, Chem. Phys. Lett., 2013,588, 1–10.
52 H. Groenzin, I. Li, V. Buch and M. J. Shultz, J. Chem. Phys.,2007, 127, 214502.
53 P. J. Bisson and M. J. Shultz, J. Phys. Chem. A, 2013, 117,6116–6125.
54 K. Ohno, M. Okimura, N. Akai and Y. Katsumoto, Phys.Chem. Chem. Phys., 2005, 7, 3005–3014.
55 C. J. Tainter, Y. Ni, L. Shi and J. L. Skinner, J. Phys. Lett.,2013, 4, 12–17.
56 X. Wei, P. B. Miranda and Y. R. Shen, Phys. Rev. Lett., 2001,86, 1554–1557.
57 E. Anim-Danso, Y. Zhang and A. Dhinojwala, J. Phys. Chem.C, 2016, 120, 3741–3748.
58 D. T. Limmer and D. Chandler, J. Chem. Phys., 2014, 141, 8.59 B. N. J. Persson, J. Chem. Phys., 2015, 143, 224701.
PCCP Paper
Ope
n A
cces
s A
rtic
le. P
ublis
hed
on 2
3 N
ovem
ber
2016
. Dow
nloa
ded
on 3
/19/
2022
2:3
5:31
PM
. T
his
artic
le is
lice
nsed
und
er a
Cre
ativ
e C
omm
ons
Attr
ibut
ion
3.0
Unp
orte
d L
icen
ce.
View Article Online