jonathan rubens, november 18, 2009. vc fundraising to lowest point in 16 years in the third quarter....
TRANSCRIPT

Hunting Early-Stage Capital: Trends in a Down Market
Jonathan Rubens, November 18, 2009

• VC fundraising to lowest point in 16 years in the third quarter.
• 17 funds raised $1.6 billion Q3 2009; smallest number of funds raising money since Q3 1994, and smallest amount raised since 1Q 2003 ($938 million).
Largest funds raised Q3 2009: Khosla Ventures III, $750 million (for an early stage fund); Draper Fisher Jurvetson X, $196 million.
(Source: NVCA/Thomson Reuters)
Venture funding hits 16 year low
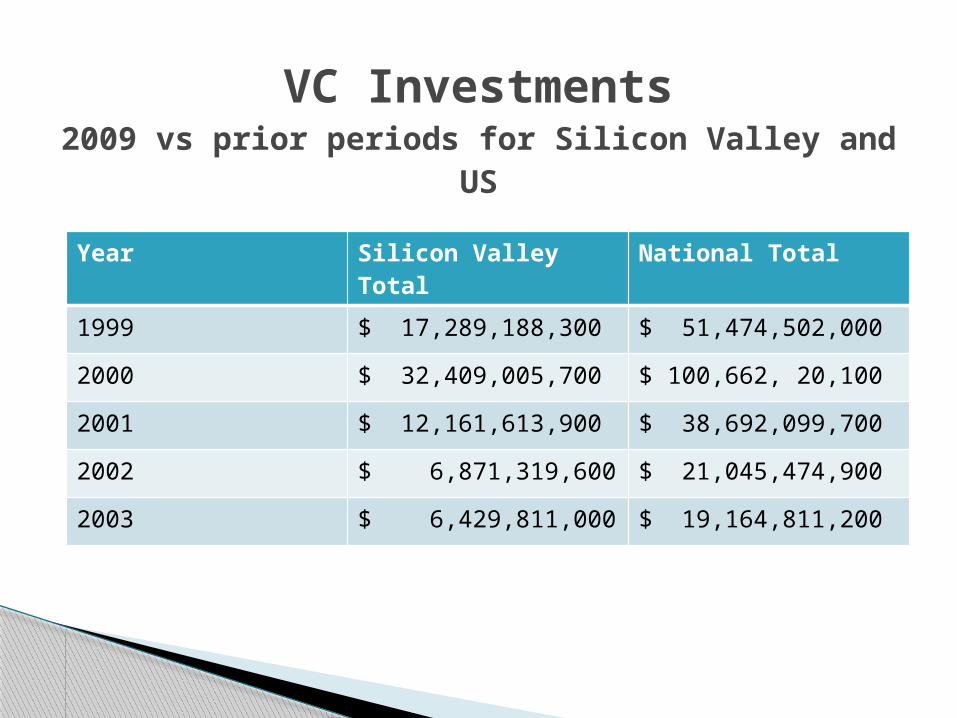
Year Silicon Valley Total National Total
1999 $ 17,289,188,300 $ 51,474,502,000
2000 $ 32,409,005,700 $ 100,662, 20,100
2001 $ 12,161,613,900 $ 38,692,099,700
2002 $ 6,871,319,600 $ 21,045,474,900
2003 $ 6,429,811,000 $ 19,164,811,200
VC Investments2009 vs prior periods for Silicon Valley
and US

Silicon Valley Total National Total
2004 $ 7,826,760,000 $ 21,998,609,800
2005 $ 8,177,639,900 $ 22,944,951,900
2006 $ 9,565,899,800 $ 26,438,886,800
2007 $10,859,086,400 $ 30,538,555,300
2008 $10,782,144,100 $ 27,958,705,800
2009 (through Q3 only)
$ 4,916,818,100 $ 12,246,954,800
VC Investments2009 vs prior periods for Silicon Valley and
US

Region
Q1 2009 Q2 2009 Q3 2009 2009 Q1 – Q3
Silicon Valley
$1,310,784,800 $1,372,075,400 $2,234,007,900 $4,916,686,100
LA / OC $ 223,917,200 $ 179,578,100 $ 39,182,000 $ 642,677,300
San Diego
$ 91,974,300 $ 251,879,000 $ 63,328,500 $ 580,181,800
Sac’o/NoCal
$ 7,000,000 $ 9,865,000 $ 1,950,000 $ 18,815,000
CA - total
$1,633,676,300 $1,813,397,500 $2,711,468,400 $6,158,542,200
VC Investment 2009California, select markets

2004
2005 2006 2007 2008 2009
Seed investments as a percent of totalinvestment
2.1% 4.0% 4.6% 4.7% 5.6% 10.7%
Seed/Startup vs. later stage

Q1 + Q2 2009, five IPOs raised $967 million.
Q3 2009 20 IPOs raised $5.8 billion
10 VC-backed IPOs Jan 1 -Oct. 20, 2009.
(Source: NVCA)
Uptick in IPO market?

I-Bank concentration: fewer boutique banks and fewer companies willing to use them
Longer time to IPO: 2008 median company age of 9.6 years vs. 4.5 years 1998
90’s: 80% of IPOs smaller than $50M; 2000s: 20% of IPOs smaller than $50M;
Problems for the IPO Market

2008 vs. 2007: Angel $ down 26% to $19.2 B; VC total investment down 8% to $30.9 B
Q1-Q2 09 vs. 08: 27% less $, slightly more deals vs same time last year, down overall.
19% less money invested at the earliest stages: 27% seed/startup, 58% post-seed.
More follow-on investing? Less risk-tolerant angels? More institutionalized angel investing?
(UNH – CVR)
Angels: fewer deals, fewer dollars

Kereitsu Forum – invests after $500K to $1.5 million seed round, often in a Series A alongside another institutional investor
Band of Angels – recently more follow-on than seed investing; often “lead a syndication of $2-3 million”
Some Angels more institutionalized, moving later

Angels Forum: “focus is seed and early stage companies seeking $100K to $1 million”
Sand Hill Angels: “as little as $100K to more than $500K”
Others still investing Early
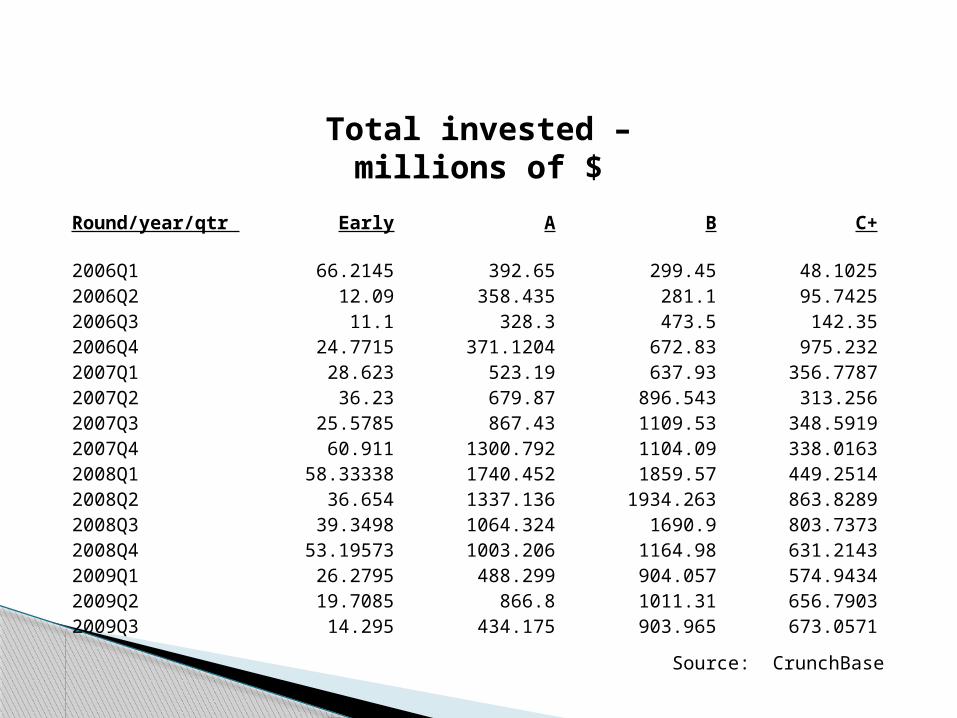
Round/year/qtr Early A B C+
2006Q1 66.2145 392.65 299.45 48.10252006Q2 12.09 358.435 281.1 95.74252006Q3 11.1 328.3 473.5 142.352006Q4 24.7715 371.1204 672.83 975.2322007Q1 28.623 523.19 637.93 356.77872007Q2 36.23 679.87 896.543 313.2562007Q3 25.5785 867.43 1109.53 348.59192007Q4 60.911 1300.792 1104.09 338.01632008Q1 58.33338 1740.452 1859.57 449.25142008Q2 36.654 1337.136 1934.263 863.82892008Q3 39.3498 1064.324 1690.9 803.73732008Q4 53.19573 1003.206 1164.98 631.21432009Q1 26.2795 488.299 904.057 574.94342009Q2 19.7085 866.8 1011.31 656.79032009Q3 14.295 434.175 903.965 673.0571
Total invested – millions of $
Source: CrunchBase

2006
Q1
2006
Q2
2006
Q3
2006
Q4
2007
Q1
2007
Q2
2007
Q3
2007
Q4
2008
Q1
2008
Q2
2008
Q3
2008
Q4
2009
Q1
2009
Q2
2009
Q30
500
1000
1500
2000
2500
3000
3500
4000
4500
C+BAEarly
Total invested – millions of $

2006
Q1
2006
Q2
2006
Q3
2006
Q4
2007
Q1
2007
Q2
2007
Q3
2007
Q4
2008
Q1
2008
Q2
2008
Q3
2008
Q4
2009
Q1
2009
Q2
2009
Q30
10
20
30
40
50
60
70
Early
Early
Total invested – millions of $

Round/year/qtr Early Rounds A B C+
2006Q1 16 49 25 3.252006Q2 18 48 25 5.52006Q3 11.5 52 33 8.3333332006Q4 25 75 49 7.82007Q1 51 98 52 162007Q2 58 129 73 18.22007Q3 52 141 86 172007Q4 65.5 135 83 142008Q1 82.5 177 116 23.285712008Q2 81.5 217 155 53.666672008Q3 66 156 125 40.666672008Q4 45.5 131 119 36.571432009Q1 48.5 115 115 40.142862009Q2 49 100 103 392009Q3 43 73 94 39
Number of Rounds recorded – Crunchbase sampling

2006
Q1
2006
Q2
2006
Q3
2006
Q4
2007
Q1
2007
Q2
2007
Q3
2007
Q4
2008
Q1
2008
Q2
2008
Q3
2008
Q4
2009
Q1
2009
Q2
2009
Q30
100
200
300
400
500
600
C+BAEarly Rounds
Number of Rounds recorded – Crunchbase sampling

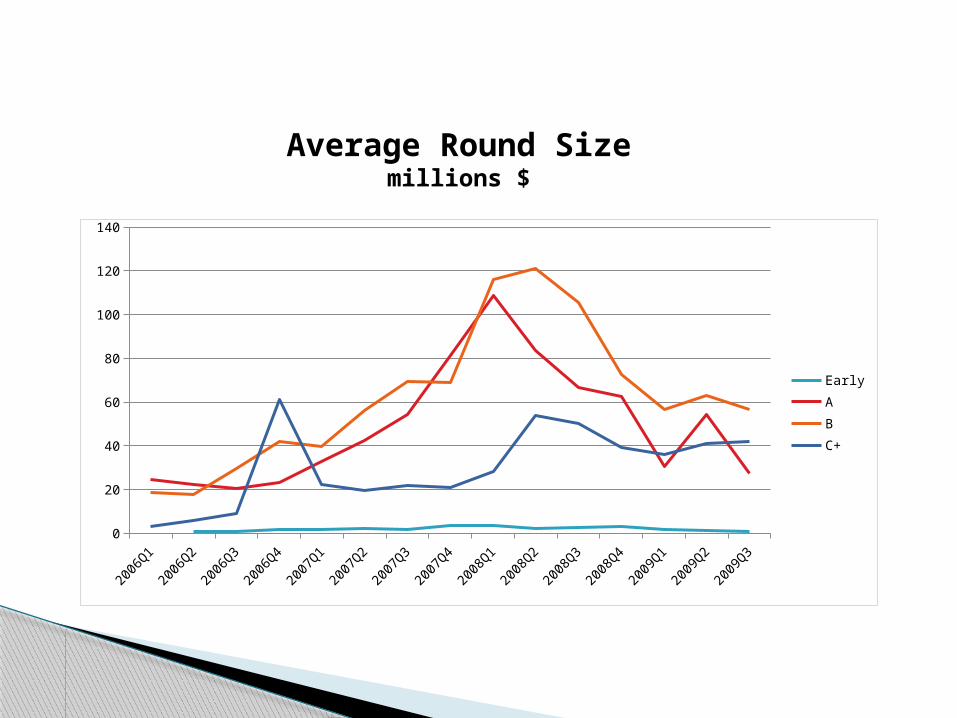
Round / year / qtr Early A B C+
2006Q1 24.540625 18.715625 3.00640625
2006Q2 0.755625 22.4021875 17.56875 5.98390625
2006Q3 0.69375 20.51875 29.59375 8.896875
2006Q4 1.54821875 23.195025 42.051875 60.952
2007Q1 1.7889375 32.699375 39.870625 22.2986688
2007Q2 2.264375 42.491875 56.0339375 19.5785
2007Q3 1.59865625 54.214375 69.345625 21.7869938
2007Q4 3.8069375 81.2995 69.005625 21.1260188
2008Q1 3.64583625 108.77825 116.223125 28.0782125
2008Q2 2.290875 83.571 120.891438 53.9893063
2008Q3 2.4593625 66.52025 105.68125 50.2335813
2008Q4 3.32473313 62.700375 72.81125 39.4508938
2009Q1 1.64246875 30.5186875 56.5035625 35.9339625
2009Q2 1.23178125 54.175 63.206875 41.0493938
2009Q3 0.8934375 27.1359375 56.4978125 42.0660688
Average Round Size millions $
2006
Q1
2006
Q2
2006
Q3
2006
Q4
2007
Q1
2007
Q2
2007
Q3
2007
Q4
2008
Q1
2008
Q2
2008
Q3
2008
Q4
2009
Q1
2009
Q2
2009
Q30
20
40
60
80
100
120
140
EarlyABC+
Average Round Sizemillions $

2006
Q1
2006
Q2
2006
Q3
2006
Q4
2007
Q1
2007
Q2
2007
Q3
2007
Q4
2008
Q1
2008
Q2
2008
Q3
2008
Q4
2009
Q1
2009
Q2
2009
Q30
0.5
1
1.5
2
2.5
3
3.5
4
Early
Early
Average Round SizeMillions $

Round/year/qtr Early A B C+2006Q1 0.4 6 11 12.551252006Q2 0.31625 5 8.7 8.793752006Q3 0.725 4.25 10.5 11.6252006Q4 0.24 4 10.5 9.82007Q1 0.25 3 10 12.9142007Q2 0.31 4 9 10.932007Q3 0.1875 3.5 10 10.791672007Q4 0.3025 3.3 10 18.214292008Q1 0.315 3.7 10 11.042862008Q2 0.2 3 8 12.458332008Q3 0.285 4.5 10 12.535422008Q4 0.2275 3.5 6.5 9.4639292009Q1 0.2 3 7 7.76252009Q2 0.1875 3 6.9 9.1764292009Q3 0.17625 2.5 6.6 9.592857
Median Round Size

2006
Q1
2006
Q2
2006
Q3
2006
Q4
2007
Q1
2007
Q2
2007
Q3
2007
Q4
2008
Q1
2008
Q2
2008
Q3
2008
Q4
2009
Q1
2009
Q2
2009
Q30
2
4
6
8
10
12
14
16
18
20
Early
A
B
C+
Median Round Size

2006
Q1
2006
Q2
2006
Q3
2006
Q4
2007
Q1
2007
Q2
2007
Q3
2007
Q4
2008
Q1
2008
Q2
2008
Q3
2008
Q4
2009
Q1
2009
Q2
2009
Q30
1
2
3
4
5
6
7
A
A
Median Round Size

2006
Q1
2006
Q2
2006
Q3
2006
Q4
2007
Q1
2007
Q2
2007
Q3
2007
Q4
2008
Q1
2008
Q2
2008
Q3
2008
Q4
2009
Q1
2009
Q2
2009
Q30
0.1
0.2
0.3
0.4
0.5
0.6
0.7
0.8
Early
Early
Median Round Size

Combination of incubator services, mentoring, microinvestments, for 2-8%
Seed investment plus RFR A round by affiliate later-stage fund
Examples:YCombinator, TechStarts, SeedCamp, LaunchBox, DreamIt Ventures, Highland Capital
Partners, Bay Partners
New early-stage groups, incubators, seed funds

UNH study: 13.4 of IPOs had angels as only investors
Companies with angel-only financing reached IPO sooner than purely VC-backed companies
IPOs with angel-only backing may tend to generate higher proceeds than VC-only IPOs
UMD: angel-only or VC-only companies were less likely to fail and more likely to have a successful liquidity event; companies that were backed by both angels & VC funds had inferior outcomes
Long term benefits of Angel Money?