journal of advanced research - ucy
TRANSCRIPT

Journal of Advanced Research 10 (2018) 1–8
Contents lists available at ScienceDirect
Journal of Advanced Research
journal homepage: www.elsevier .com/locate / jare
Original Article
Use of FTIR spectroscopy and chemometrics for the classificationof carobs origin
https://doi.org/10.1016/j.jare.2017.12.0012090-1232/� 2018 Production and hosting by Elsevier B.V. on behalf of Cairo University.This is an open access article under the CC BY-NC-ND license (http://creativecommons.org/licenses/by-nc-nd/4.0/).
Peer review under responsibility of Cairo University.⇑ Corresponding authors.
E-mail addresses: [email protected] (A. Agapiou), [email protected] (R. Kokkinofta).
Chrysanthi Christou a, Agapios Agapiou a,⇑, Rebecca Kokkinofta b,⇑aDepartment of Chemistry, University of Cyprus, P.O. Box 20537, 1678 Nicosia, Cyprusb State General Laboratory, P.O. Box 28648, 2081 Nicosia, Cyprus
g r a p h i c a l a b s t r a c t
a r t i c l e i n f o
Article history:Received 19 September 2017Revised 30 November 2017Accepted 1 December 2017Available online 24 December 2017
Keywords:Ceratonia siliqua L.Carob podsCarob seedsCultivarsFTIRChemometrics
a b s t r a c t
Carob samples from seven different Mediterranean countries (Cyprus, Greece, Italy, Spain, Turkey, Jordanand Palestine) were analyzed using Fourier Transform Infrared (FTIR) spectroscopy. Seed and flesh sam-ples of indigenous and foreign cultivars, both authentic and commercial, were examined. The spectrawere recorded in transmittance mode from KBr pellets. The data were compressed and further processedstatistically using multivariate chemometric techniques, including Principal Component Analysis (PCA),Cluster Analysis (CA), Partial Least Squares (PLS) and Orthogonal Partial Least Square-DiscriminantAnalysis (OPLS-DA). Specifically, unsupervised PCA framed the importance of the variety of carobs, whilesupervised analysis highlighted the contribution of the geographical origin. Best classification modelswere achieved with PLS regression on first derivative spectra, giving an overall correct classification.Thus, the applied methodology enabled the differentiation of carobs flesh and seed per their origin.Our results appear to suggest that this method is a rapid and powerful tool for the successful discrimi-nation of carobs origin and type.� 2018 Production and hosting by Elsevier B.V. on behalf of Cairo University. This is an open access article
under the CC BY-NC-ND license (http://creativecommons.org/licenses/by-nc-nd/4.0/).
Introduction
Carob tree (Ceratonia siliqua L.) has been widely grown inMediterranean region for centuries and is also widespread inalmost all continents (Europe, Africa, Australia, Asia, USA) [1].Furthermore, is an important component of the Mediterraneanvegetation and a characteristic part of the agricultural ecosystem

2 C. Christou et al. / Journal of Advanced Research 10 (2018) 1–8
in Cyprus. However, its economic, social and environmental impor-tance may not been fully appreciated. According to the Food Agri-culture Organization (FAO), the countries with the highest carobproduction in 2014 were Spain, Italy, Portugal, Morocco, Turkey,Greece, Cyprus and Lebanon [2]. The quality and quantity of carobsis affected by a number of parameters, such as the local micro-climate, water quality, soil content, altitude and sunshine. Themajority of the studies thus far on carob cultivars have focusedmainly on the local varieties e.g. in Morocco [3], Turkey [4–6],Spain [7] and in South Africa [8], overlooking its wide worldwideprevalence. The cultivars are characterized based on their geneticvariability, fruit description, chemical composition and agronomi-cal performance [9]. In Spain alone, there have been more than20 cultivars varieties reported growing in different areas [1].
The main components of carob tree are the pods and the seeds.The latter (about 10% of the fruit), are industrially used to producelocust bean gum (LBG, E410), which can be utilized as a thickenerand food stabilizer or in flavoring [10]. Indeed, this is the most val-ued part for the food industry; its market and food exploitation arestill under investigation. The evaluation of the rheological proper-ties and sugar content of LBG from Italian carob varieties wasexamined [11], whereas other researchers compared the structuraland rheological properties of locust bean galactomannans isolatedfrom carob seeds [12]. In the latter study, 12 carob trees from dif-ferent varieties and growth locations of Southern Greece wereexamined. The chemical composition of carobs is well known:carob pods contain high amounts of carbohydrates, polyphenolicand antioxidant compounds, insoluble dietary fibers and mineralsand low amounts of proteins and lipids [10]. Khlifa et al., studiedthe chemical composition of carob pods from Morocco, as well astheir morphological properties [13]. The elemental profiling ofcarob fruits (wild and grafted) has also been studied. The mostabundant minerals in carob fruit are calcium, potassium, magne-sium, sodium, phosphorus and iron [14]. Youseff et al., also exam-ined the gross chemical composition, minerals, vitamins, phenoliccompounds and fatty acid content of carob powder [15]. Carobflour is another important food ingredient produced from the carobseeds. Ayaz et al., studied the nutrient composition ofcommercially- and home-prepared carob flour [16], whereas Dur-razzo et al., examined the antioxidant properties of commerciallyavailable carob seed flours [17]. The effect of carob and germ flouraddition in gluten-free bakery products has been also reported[18–20], whereas the alternative uses of carob fruit are still exam-ined. Carob seed residues were proposed as substrate or soilorganic amendment [21], and the carob pods were recommendedfor the production of bioethanol after fermentation [22].
The biological and thearapeutic effects of carob fruit e.g. gas-trointestinal effects, anti-diabetic activity, anti-cancer, hyperlipi-demia and anti-diarrheal properties were recently reviewed. D-pinitol is considered an important bioactive compound of carobswith anti-diabetic activity [23]. It was identified along with sugarprofile in carob syrup, a traditional product produced from carobpods [5]. The antibacterial activity of carob leaves extracts againstListeria monocytogenes and Pectobacterium atrosepticum has alsobeen reported [24,25]. Furthermore, the anticancer, cytotoxic andanti-diarrheal activities of carob fiber, germ flour extracts (seed)and carob pod attributed to the presence of polyphenols, flavo-noids and tannins were reported in detail [23]. The presence ofpolyphenols in carob pods and in derived products was determinedusing high performance liquid chromatography-ultravioletabsorption-electrospray ion trap-mass spectrometry (HPLC-UV-ESI-MS) and in carob flour using liquid chromatography-massspectrometry (LC-MS) [26,27]. The leaf flavonoid compositionwas also determined [28].
Nowadays, carob pods is used primarily as food for the livestock[29]. For humans, it is mostly used as a cocoa substitute due to its
low price and as a caffeine free product. The carob pods are widelyemployed in bakery and confectionery products, pasta or bever-ages. Furthermore, they are used in biotechnology applicationsfor the production of citric and lactic acid, mannitol, succinic acidand ethanol [10,23].
The carob tree has long been associated with the ancient historyof Cyprus; the first written reports of carobs existence in the islandwere associated with the Venetians in the 15th century [30]. InCyprus, the carob tree is widely known as ‘‘teratsia”. In the olddays, it was described as the ‘‘black gold of Cyprus”, since it wasthe product with the largest agricultural exports and an importantsource of income. According to the macroscopic observations ofcarob pods, three cultivars exist in Cyprus: Tylliria, Koumpota andKountourka. A number of traditional carob products are thereforeproduced, such as carob syrup (charoupomelo), carob powderand pastelli.
In recent years, there has been a great interest in the identifica-tion of botanical or geographical origin of foods. Indeed, the Euro-pean countries are working towards highlighting the geographicorigin, protected designation of origin (PDO) and protected geo-graphical indication (PGI) of the traditional food products follow-ing European Union regulation No 1151/2012 [31]. To this effect,many analytical methods are employed including mass spectro-metric, spectroscopic, separation and other (sensory and DNA)techniques [32]. Of these, FTIR spectroscopy is considered a simple(requiring minimum sample preparation), rapid, low-cost and non-destructive applied spectroscopic method.
The powerful combination of FTIR and chemometrics has beensuccessfully applied in many research areas in food and beverages.A wide array of chemometric methods are therefore used includingPrincipal Component Analysis (PCA), Hierarchical Cluster Analysis(HCA), Canonical Variate Analysis (CVA), Discriminant Analysis(DA), Soft Independent Modelling by Class Analogy (SIMCA), Artifi-cial Neural Network (ANN) and Partial Least Squares Regression(PLS). Indeed, the previous combined methodologies were appliedfor the detection of foodborne pathogenic bacteria [33]. The mid-infrared (MIR) spectroscopy (400–4000 cm�1) associated withchemometric methods was used to discriminate wines, cheeses,olive oils and honey according to their geographical origin [32].The same methodology was also used for the quantitative analysisof food ingredients such as sugars or organic acids in fruits, fruitjuices and soft drinks, aiming in product authenticity or adulter-ation [34]. Moreover, near-infrared (NIR) spectroscopy (4000–14,000 cm�1) coupled with chemometric techniques wereemployed for the geographical classification of grapes, wines, rice,soy sauce and olive oils [32]. The authenticity of local wines inCyprus was also studied by spectroscopic and chemometric analy-sis [35]. In general, the combination of attenuated total reflectance(ATR) with FTIR enhances sample spectral collection [36]. Similarapplications highlighting the successful combination of FTIR andchemometric techniques in food and beverages are shown in Sup-plementary Material Table SM-1 [37–44].
To our knowledge, only Alabdi et al., used FTIR and chemomet-ric techniques (HCA, PCA and PLS-DA) to discriminate and classifysamples of pods and seeds from Moroccan regions [3]. The lattermethod was applied for the differentiation of LBG among other car-bohydrate gums and gums mixtures [45]. Furthermore, Farag et al.,studied the aroma profile of roasted and unroasted carob podsusing solid-phase microextraction gas chromatography-mass spec-trometry (SPME-GC-MS) analysis associated with chemometrics[46]. Also, capillary zone electrophoresis was combined withchemometrics for the classification of carob gum samples [47].Given the increasing commercial value of carobs, it is necessaryto distinguish Cypriot authentic carobs from carobs produce inother countries. As a part of a wider study, our aim was to examinethe application of FTIR and chemometrics as a rapid methodology

C. Christou et al. / Journal of Advanced Research 10 (2018) 1–8 3
in order to differentiate the origin of carobs, as well the type of 16carob cultivars from 7 Mediterranean countries (Cyprus, Greece,Italy, Spain, Turkey, Jordan and Palestine), both authentic and com-mercial. It is believed that the basis for the differentiation of carobsis related to the geological and climatic conditions existing in theproduction area.
Experimental
Carob pods (flesh and seed) from Cyprus and six other Mediter-ranean countries (Greece, Italy, Spain, Turkey, Jordan and Pales-tine) were studied (Table 1). Carob samples from Cyprus, Greece,Italy and Spain were authentic (from cultivars), while samplesfrom Turkey, Jordan and Palestine were commercial from localmarkets. The seed was grounded in the laboratory mill 3100, whilethe flesh was grounded in blender Cuisine 4200 magimix. Prior tospectroscopic analysis, samples were placed in an oven at 130 �Cfor 1½ h and the moisture content was measured (for the seedsit was ranged between 7.6 and 11.4 %, while for the flesh it was9.1–16.5%). The FTIR analysis was performed randomly (in termsof the sample number and country of origin) both in the fleshand the seed. The transmittance spectra were obtained under con-trolled environmental conditions on a Jasco FT/IR-6100 spec-trophotometer in two different ways: (a) as pressed KBr pelletand (b) with small sample placement on ATR on a ZnSe [3,37].The spectra recorded in duplicate in the wavelength region of400–4000 cm�1 with 128 scans and a 16 cm�1 resolution. A back-
Table 1Examined carob cultivars per country.
Country Cultivars * Sample type
Cyprus 3 (Tylliria, Koumpota, Kountourka) Flesh and seedGreece 3 (Imera, Imera,a Unknown) Flesh and seedItaly 4 (Raexmosa, Giubiliana, Saccarata, Unknown) Flesh and seedSpain 3 (Negra, Rojal, Metalafera) Flesh and seedTurkey 1 (Fleshy) Flesh and seedJordan 1 (Unknown) Flesh and seedPalestine 1 (Unknown) Flesh and seed
* Samples originated from European countries were collected from field cultivars,whereas samples from Middle East countries from local stores (post-harvestsamples).
a Freshly watered.
Fig. 1. FTIR spectra of carob flesh and seed sample from Cyprus (
ground was collected before each sample was analyzed and thensubtracted automatically from the sample spectra prior to furtheranalysis. The first- and second- derivatives were applied to therecorded transmittance spectra. However, the ATR-FTIR experi-mental approach presented unsatisfied discriminant analysis forthe recorded spectra. Finally, the spectra recorded by the use ofKBr pellets provide better discrimination and therefore were stud-ied first, for the whole wavelength range of 400–4000 cm�1 andthen for specific ranges (400–1500 cm�1, 1500–2500 cm�1 and2500–4000 cm�1). The multivariate statistical analysis of spectro-scopic data was performed with SIMCA software (version 13.0,Umetrics, Sweden). PCA and CA chemometric techniques wereused for the classification of samples and PLS and OPLS-DA for theirdiscrimination.
Results and discussion
In the infrared region, molecules vibrations correspond to speci-fic vibration frequencies revealing functional group vibrationsdirectly correlated with molecular identification [48–51]. A fullassignment of the spectral bands in carobs is very challenging,but this was not the scope of the present study. The baseline-corrected and area normalized spectra were transformed to absor-bance units and truncated to 250 points. Fig. 1 presents represen-tative FTIR absorption spectra of carob flesh and seed sample fromCyprus (Kountourka cultivar) in the 400–4000 cm�1 region. Themain bands are shown in Fig. 1 and the analysis of the characteris-tic peaks of the spectra is given in Table 2. In all the obtained IRspectra, peaks corresponding to the main atmospheric components(CO2, H2O) were observed. The peak at 3600 cm�1 is attributed toH2O, whereas, the double peak near 2300 cm�1 corresponds toCO2. The bands at 3386, 3390 and 3336 cm�1 arise from the OAHand NAH stretching vibrations from polysaccharides and proteins,while the bands at 2927 and 2935 cm�1 correspond to CH2 asym-metric or symmetric stretch. The bands at 1628–1650 and 1543cm�1 result from stretching or bending vibrations of the bondswhich may be derived from proteins. Absorption bands at 1435,1404 and 1346 cm�1 correspond to CH2 bending vibrations, rock-ing vibrations of CAH bonds and bending vibrations of CH3 groups,respectively [49–51]. The most important area in the spectrum fordistinguishing the origin of the samples was the region 2500–4000cm�1, that contains mainly the bands of proteins, polysaccharides,unsaturated lipids and carbohydrates. Fig. SM-1 shows all the
Kountourka) in the 400–4000 cm�1 region (offset for clarity).

Table 2Main bands of carob flesh and seed sample with the corresponding functional group vibrations.
Frequency (cm�1) Functional group vibration Possible origin Literature
3336–3386 OAH and NAH group stretching vibration Polysaccharides, protein [49]2927–2935 CH2 asymmetric or symmetric stretch Mainly unsaturated lipid and little contribution
from proteins, carbohydrates, nucleic acids[49–51]
1628–1650 C@O stretch (1652 cm�1) Protein [49,50]cis C@C (1654 cm�1)
1543 NAH bend, CAN stretch Protein [49]1435 CH2 bending vibrations (1462 cm�1) Lipids, proteins [49–51]
Rocking vibrations of CH bonds (1417 cm�1) cis-disubstituted alkenes1404 Rocking vibrations of CH bonds cis-disubstituted alkenes [50,51]1346 CH3 bending vibrations Lipids, proteins [49,50]1238–1245 and 1122 Stretching vibration of CAO group (1228 and 1155 cm�1) Esters [50]
ACH bending and ACH deformation vibrations (1111 and 1097 cm�1) Fatty acids1065–1068 CAO stretching – [50,51]400–1000 ‘‘Fingerprint region” – [33]
Fig. 2. 1st (A) and 2nd (B) spectra derivatives of carob flesh samples from different origin.
4 C. Christou et al. / Journal of Advanced Research 10 (2018) 1–8
obtained spectra of carob flesh samples from the 16 carobcultivars (whereas Fig. SM-2 shows only the spectra of Cypriotcarob seed samples Koumpota, Kountourka, Tylliria cultivars in the400–4000 cm�1 region). The differences between them are smalland therefore their distinction in the different regions of thespectra is limited. The profiles of the first and second derivativesof the transmittances are shown in Fig. 2. As mentioned abovefor the primary spectra, most of the spectral information used to
discriminate the samples lies in the region 2500–4000 cm�1. Thefirst derivative is more informative, so chemometric analysis wasthen performed to these data.
Chemometric analysis
The matrix of the FTIR spectral data set was imported into theSIMCA-P version 13.0 (Umetrics, Umeå, Sweden) for statistical
C. Christou et al. / Journal of Advanced Research 10 (2018) 1–8 5
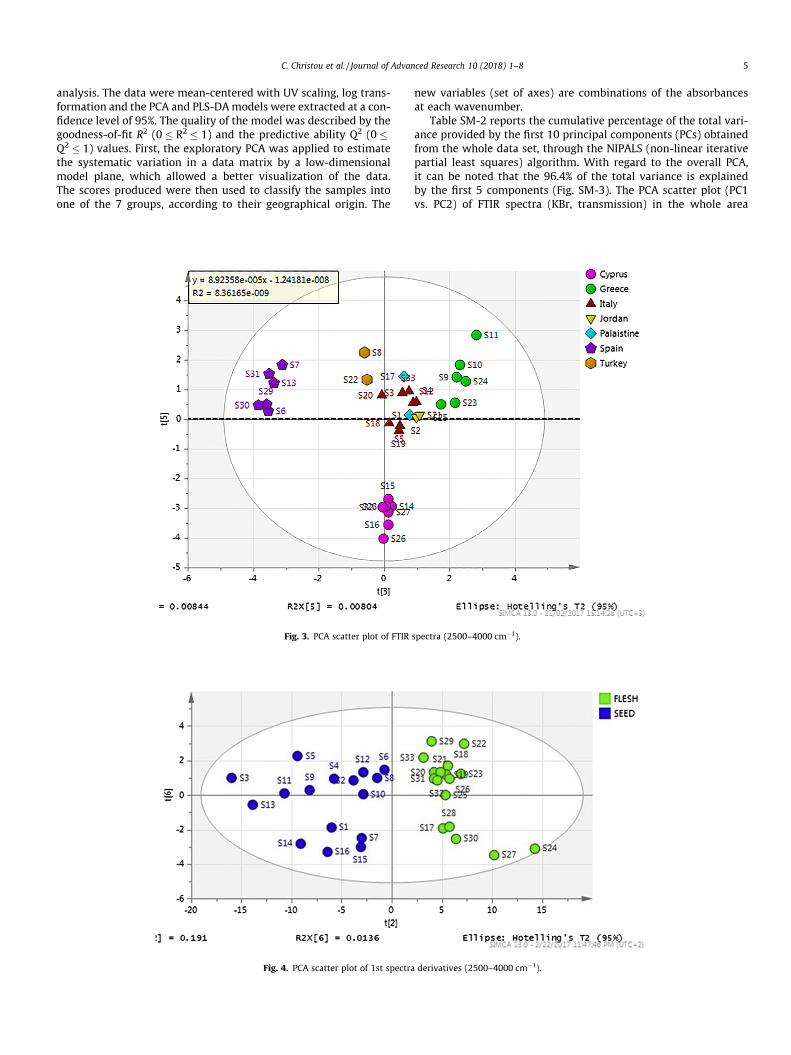
analysis. The data were mean-centered with UV scaling, log trans-formation and the PCA and PLS-DAmodels were extracted at a con-fidence level of 95%. The quality of the model was described by thegoodness-of-fit R2 (0 � R2 � 1) and the predictive ability Q2 (0 �Q2 � 1) values. First, the exploratory PCA was applied to estimatethe systematic variation in a data matrix by a low-dimensionalmodel plane, which allowed a better visualization of the data.The scores produced were then used to classify the samples intoone of the 7 groups, according to their geographical origin. The
Fig. 3. PCA scatter plot of FTIR
Fig. 4. PCA scatter plot of 1st spectra
new variables (set of axes) are combinations of the absorbancesat each wavenumber.
Table SM-2 reports the cumulative percentage of the total vari-ance provided by the first 10 principal components (PCs) obtainedfrom the whole data set, through the NIPALS (non-linear iterativepartial least squares) algorithm. With regard to the overall PCA,it can be noted that the 96.4% of the total variance is explainedby the first 5 components (Fig. SM-3). The PCA scatter plot (PC1vs. PC2) of FTIR spectra (KBr, transmission) in the whole area
spectra (2500–4000 cm�1).
derivatives (2500–4000 cm�1).

Fig. 5. PLS plot from analysis on PCAs of 1st derivatives (2500–4000 cm�1).
6 C. Christou et al. / Journal of Advanced Research 10 (2018) 1–8
(400–4000 cm�1) (Fig. SM-4), shows an overlap between groupswith respect to their geographical origin. This was improved whenthe analysis was obtained on the spectra in a smaller wavelengthregion.
Fig. 3 shows the PCA results (PC3 vs. PC5 score plot) in thewavelength range of 2500–4000 cm�1. In this case, there wasclear differentiation between the carob samples depending onthe country of origin. Four separate groups can be identified:(a) carobs from Cyprus (the group was very well formed), (b)carobs from Spain, (c) carobs from Greece and (d) carobs fromItaly, Jordan and Palestine. Some small degree of separationbetween the samples in the last group was suggested in thehyperplane. The samples from Turkey were slightly distinguishedfrom the last group.
The same procedure applied to the 1st derivatives of thespectra and Fig. 4 shows the PCA results (PC2 vs. PC6 score plot)of the data obtained from the application of the first derivativeto the recorded spectra in the wavelength range 2500–4000cm�1, showing the differentiation according to their type. Theseparation based on the type of the samples is readily apparentfrom the plot showing the two groups: (a) samples of carob fleshand (b) samples of carob seed. The above discriminant compo-nents were chosen as they best differentiated the carob sampleswith respect to their origin (Fig. 3) and their type (Fig. 4). Ofcourse PC1 and PC2 explain the maximum variation, probablydue to the homogeneity of the carobs throughout its various
Table 3Correct classification rates for all samples (PCs of 1st derivatives in 2500–4000 cm�1) afte
True classa Total number Correct Assigned cla
1
1 7 100% 72 6 100% 03 8 100% 06 2 100% 07 2 100% 04 6 100% 05 2 100% 0No class 0 0Total 33 100% 7Fishers prob. 1.2e�021
a 1: Cyprus, 2: Greece, 3: Italy, 4: Jordan, 5: Palestine, 6: Spain, 7: Turkey.
parts. However, the eigenvalue for each of the 6 PCs in themodel range from 1.95 to 2.52, indicates that the model fits wellwith the data, indicating that they are all important and can beused to classify the samples. To validate the previous results onthe influence of the origin, discriminant analysis was applied, byusing the ‘‘leave-one-out cross-validation” method. The PCAscores of the 1st derivatives of the spectra in the above limitedrange were then analyzed statistically with PLS and OPLS-DA.OPLS-DA is an extension of the supervised PLS regressionmethod that manages to increase the quality of the classificationmodel by separating the systematic variation in X into two parts,one that is linearly related to Y (predictive information) and onethat is unrelated to Y (orthogonal information). The OPLS-DAmodels at a confidence level of 95% were scaled and log trans-formed. Fig. 5 (three-dimensional) shows the discrimination ofsamples of different geographical origin into a clear presentationin the plane.
Equally, Table 3 summaries the correct classification rates for allsamples (PCs of 1st derivatives in 2500–4000 cm�1) after a PLS dis-criminant analysis (leave-one-out cross-validation) and points outthe potential of this technique to discriminate the groups with100% correct classification without error (Figs. SM-5 and SM-6report the OPLS-DA scatter plot on PCAs and the dendrogram byHCA in the same wavelength range, respectively).
Conclusions
In summary, in our study which is part of a wider investigationon carobs, we examined whether a combination of FTIR spec-troscopy and subsequent chemometric data analysis could beapplied in order to differentiate carob samples from different geo-graphical regions. Our results have clearly demonstrated that thecarob samples could be categorized into distinct groups dependingon their origin and type, as well the chemometric technique thatwas used for the analysis of the spectroscopic data. The use ofappropriate algorithm on the PCs of the first derivatives of thespectra in the wavelength range 2500–4000 cm�1, gives groupsof samples with confidence level 95%. The discriminant analysiswith the leave-one-out cross-validation, correctly classified thesamples, rising to 100% for each group.
The uncertainty of the method is of great importance for thedevelopment of the models that may differentiate carobs of differ-ent origin. Therefore, to build such models, much larger samplesets comprising carobs from many years and harvests from differ-ent countries would be needed. Thus, the method could prove to bea useful tool for discriminating carobs from different origin andtype.
r PLS-DA.
sses
2 3 6 7 4 5
0 0 0 0 0 06 0 0 0 0 00 8 0 0 0 00 0 2 0 0 00 0 0 2 0 00 0 0 0 6 00 0 0 0 0 20 0 0 0 0 06 8 2 2 6 2

C. Christou et al. / Journal of Advanced Research 10 (2018) 1–8 7
Acknowledgements
The authors would like to thank the ‘‘Black Gold” project, finan-cially supported by the University of Cyprus.
Conflict of Interest
The authors have declared no conflict of interest.
Compliance with Ethics Requirements
This article does not contain any studies with human or animalsubjects.
Appendix A. Supplementary material
Supplementary data associated with this article can be found, inthe online version, at https://doi.org/10.1016/j.jare.2017.12.001.
References
[1] Batlle I, Tous J. Carob tree. Ceratonia siliqua L. Promoting the conservation anduse of underutilized and neglected crops, vol. 17. Rome: Institute of PlantGenetics and Crop Plant Research, Gatersleben/International Plant GeneticResources Institute; 1997.
[2] Food and Agriculture Organization of the United Nations. Available from:<http://www.fao.org/faostat/en/#data/QC> [accessed September 12, 2017].
[3] Alabdi F. Carob origin classification by FTIR spectroscopy and chemometrics. JChem Chem Eng 2011;5:1020–9.
[4] Biner B, Gubbuk H, Karhan M, Aksu M, Pekmezci M. Sugar profiles of the podsof cultivated and wild types of carob bean (Ceratonia siliqua L.) in Turkey. FoodChem 2007;100:1453–5.
[5] Tetik N, Turhan I, Oziyci HR, Karhan M. Determination of d-pinitol in carobsyrup. Int J Food Sci Nutr 2011;62:572–6.
[6] Turhan I. Relationship between sugar profile and D-Pinitol content of pods ofwild and cultivated types of Carob Bean (Ceratonia siliqua L.). Int J Food Prop2014;17:363–70.
[7] Dakia PA, Wathelet B, Paquot M. Isolation and chemical evaluation of carob(Ceratonia siliqua L.) seed germ. Food Chem 2007;102:1368–74.
[8] Sigge GO, lipumbu L, Britz TJ. Proximate composition of carob cultivarsgrowing in South Africa. South African J Plant Soil 2011;28:17–22.
[9] Tous J, Romero A, Hermoso JF, Ninot A, Plana J, Batlle I. Agronomic andcommercial performance of four Spanish Carob Cultivars. Hort Technol2009;19:465–70.
[10] Rababah TM, Al-u’datt M, Ereifej K, Almajwal A, Al-Mahasneh M, Brewer S,et al. Chemical, functional and sensory properties of carob juice. J Food Qual2013;36:238–44.
[11] Rizzo V, Tomaselli F, Gentile A, La Malfa S, Maccarone E. Rheological propertiesand sugar composition of locust bean gum from different carob varieties(Ceratonia siliqua L.). J Agric Food Chem 2004;52:7925–30.
[12] Lazaridou A, Biliaderis CG, Izydorczyk MS. Structural characteristics andrheological properties of locust bean galactomannans: a comparison ofsamples from different carob tree populations. J Sci Food Agric 2001;81:68–75.
[13] Khlifa M, Bahloul A, Kitane S. Determination of chemical composition of carobpod (Ceratonia siliqua L) and its morphological study. J Mater Environ Sci2013;4:348–53.
[14] Oziyci HR, Tetik N, Turhan I, Yatmaz E, Ucgun K, Akgul H, et al. Mineralcomposition of pods and seeds of wild and grafted carob (Ceratonia siliqua L.)fruits. Sci Hortic (Amsterdam) 2014;167:149–52.
[15] Youssef MKE, El-Manfaloty MM, Ali HM. Assessment of proximate chemicalcomposition, nutritional status, fatty acid composition and phenoliccompounds of carob (Ceratonia Siliqua L.). Food Public Heal 2013;3:304–8.
[16] Ayaz FA, Torun H, Glew RH, Bak ZD, Chuang LT, Presley JM, et al. Nutrientcontent of carob pod (Ceratonia siliqua L.) flour prepared commercially anddomestically. Plant Foods Hum Nutr 2009;64:286.
[17] Durazzo A, Turfani V, Narducci V, Azzini E, Maiani G, Carcea M. Nutritionalcharacterisation and bioactive components of commercial carobs flours. FoodChem 2014;153:109–13.
[18] Tsatsaragkou K, Gounaropoulos G, Mandala I. Development of gluten freebread containing carob flour and resistant starch. LWT – Food Sci Technol2014;58:124–9.
[19] Tsatsaragkou K, Yiannopoulos S, Kontogiorgi A, Poulli E, Krokida M, Mandala I.Mathematical approach of structural and textural properties of gluten freebread enriched with carob flour. J Cereal Sci 2012;56:603–9.
[20] Tsatsaragkou K, Yiannopoulos S, Kontogiorgi A, Poulli E, Krokida M, Mandala I.Effect of carob flour addition on the rheological properties of Gluten-FreeBreads. Food Bioprocess Technol 2014;7:868–76.
[21] Cabecinha A, Guerrero C, Beltrao J, Brito J. Carob residues as a substrate and asoil organic amendment. WSEAS Trans Environ Dev 2010;6:317–26.
[22] Mazaheri D, Shojaosadati SA, Mousavi SM, Hejazi P, Saharkhiz S. Bioethanolproduction from carob pods by solid-state fermentation with Zymomonasmobilis. Appl Energy 2012;99:372–8.
[23] Goulas V, Stylos E, Chatziathanasiadou MV, Mavromoustakos T, Tzakos AG.Functional components of carob fruit: linking the chemical and biologicalspace. Int J O F Mol Sci 2016;17(11).
[24] Aissani N, Coroneo V, Fattouch S, Caboni P. Inhibitory effect of carob (Ceratoniasiliqua) leaves methanolic extract on Listeria monocytogenes. J Agric Food Chem2012;60:9954–8.
[25] Meziani S, Oomah BD, Zaidi F, Simon-Levert A, Bertrand C, Zaidi-Yahiaoui R.Antibacterial activity of carob (Ceratonia siliqua L.) extracts againstphytopathogenic bacteria Pectobacterium atrosepticum. Microb Pathog2015;78:95–102.
[26] Ortega N, Macià A, Romero M-P, Trullols E, Morello J-R, Anglès N, et al. Rapiddetermination of phenolic compounds and alkaloids of carob flour byimproved liquid chromatography tandem mass spectrometry. J Agric FoodChem 2009;57:7239–44.
[27] Papagiannopoulos M, Wollseifen HR, Mellenthin A, Haber B, Galensa R.Identification and quantification of polyphenols in carob fruits (Ceratoniasiliqua L.) and derived products by HPLC-UV-ESI/MSn. J Agric Food Chem2004;52:3784–91.
[28] Vaya J, Mahmood S. Flavonoid content in leaf extracts of the fig (Ficus carica L.),carob (Ceratonia siliqua L.) and pistachio (Pistacia lentiscus L.). BioFactors2006;28:169–75.
[29] Obeidat BS, Alrababah MA, Abdullah AY, Alhamad MN, Gharaibeh MA,Rababah TM, et al. Growth performance and carcass characteristics ofAwassi lambs fed diets containing carob pods (Ceratonia siliqua L.). SmallRumin Res 2011;96:149–54.
[30] Casola P. Canon Pietro Casola’s Pilgrimage to Jerusalem in the year1494. Manchester: At the University Press; 1907.
[31] REGULATION (EU) No 1151/2012 OF THE EUROPEAN PARLIAMENTAND OF THE COUNCIL of 21 November 2012 on quality schemes foragricultural products and foodstuffs. Available from: <http://eur-lex.europa.eu/legal-content/EN/TXT/?uri=CELEX%3A32012R1151> [accessed September12, 2017].
[32] Luykx DMAM, van Ruth SM. An overview of analytical methods fordetermining the geographical origin of food products. Food Chem2008;107:897–911.
[33] Davis R, Mauer LJ. Fourier Transform Infrared (FT-IR) spectroscopy: a rapid toolfor detection and analysis of foodborne pathogenic bacteria. Curr Res TechnolEduc Top Appl Microbiol Microb Biotechnol 2010;2(2):1582–94.
[34] Bureau S, Ruiz D, Reich M, Gouble B, Bertrand D, Audergon J-M, et al.Application of ATR-FTIR for a rapid and simultaneous determination of sugarsand organic acids in apricot fruit. Food Chem 2009;115:1133–40.
[35] Ioannou-Papayianni E, Kokkinofta RI, Theocharis CR. Authenticity of CypriotSweet Wine Commandaria using FT-IR and chemometrics. J Food Sci 2011;76:C420–7.
[36] Cozzolino D. Recent trends on the use of infrared spectroscopy to trace andauthenticate Natural and Agricultural Food Products. Appl Spectrosc Rev2012;47:518–30.
[37] Craig AP, Franca AS, Oliveira LS. Evaluation of the potential of FTIR andchemometrics for separation between defective and non-defective coffees.Food Chem 2012;132:1368–74.
[38] Tarantilis PA, Troianou VE, Pappas CS, Kotseridis YS, Polissiou MG.Differentiation of Greek red wines on the basis of grape variety usingattenuated total reflectance Fourier transform infrared spectroscopy. FoodChem 2008;111:192–6.
[39] Kelly JFD, Downey G. Detection of sugar adulterants in apple juice usingfourier transform infrared spectroscopy and chemometrics. J Agric Food Chem2005;53:3281–6.
[40] Silva SD, Feliciano RP, Boas LV, Bronze MR. Application of FTIR-ATR to Moscateldessert wines for prediction of total phenolic and flavonoid contents andantioxidant capacity. Food Chem 2014;150:489–93.
[41] Silva SD, Rosa NF, Ferreira AE, Boas LV, Bronze MR. Rapid determination of a-tocopherol in vegetable oils by Fourier Transform Infrared Spectroscopy. FoodAnal Methods 2008;2:120.
[42] Etzold E, Lichtenberg-Kraag B. Determination of the botanical origin of honeyby Fourier-transformed infrared spectroscopy: an approach for routineanalysis. Eur Food Res Technol 2008;227:579–86.
[43] Banc R, Loghin F, Miere D, Fetea F, Socaciu C. Romanian wines quality andauthenticity using FT-MIR spectroscopy coupled with multivariate dataanalysis. Not Bot Horti Agrobo 2014;42(2):556–64.
[44] Anjos O, Santos AJA, Estevinho LM, Caldeira I. FTIR–ATR spectroscopyapplied to quality control of grape-derived spirits. Food Chem 2016;205:28–35.
[45] Prado BM, Kim S, Özen BF, Mauer LJ. Differentiation of carbohydrate gums andmixtures using Fourier transform infrared spectroscopy and chemometrics. JAgric Food Chem 2005;53:2823–9.
[46] Farag MA, El-Kersh DM. Volatiles profiling in Ceratonia siliqua (Carob bean)from Egypt and in response to roasting as analyzed via solid-phasemicroextraction coupled to chemometrics. J Adv Res 2017;8:379–85.
[47] Hanrahan G, Gomez FA. Chemometric methods in capillaryelectrophoresis. Hoboken, New Jersey: John Wiley & Sons, Inc.; 2009.

8 C. Christou et al. / Journal of Advanced Research 10 (2018) 1–8
[48] Mellado-Mojica E, Seeram NP, López MG. Comparative analysis of maplesyrups and natural sweeteners: Carbohydrates composition and classification(differentiation) by HPAEC-PAD and FTIR spectroscopy-chemometrics. J FoodCompos Anal 2016;52:1–8.
[49] Dogan A, Siyakus G, Severcan F. FTIR spectroscopic characterization ofirradiated hazelnut (Corylus avellana L.). Food Chem 2007;100:1106–14.
[50] Rohman A, Sismindari, Erwanto Y, Che Man YB. Analysis of pork adulterationin beef meatball using Fourier transform infrared (FTIR) spectroscopy. Meat Sci2011;88:91–5.
[51] Rohman A, Man YBC. Fourier transform infrared (FTIR) spectroscopy foranalysis of extra virgin olive oil adulterated with palm oil. Food Res Int2010;43:886–92.